sector review deep dig on mining capex & capital allocation
TRANSCRIPT

DISCLOSURE APPENDIX AT THE BACK OF THIS REPORT CONTAINS IMPORTANT DISCLOSURES, ANALYST CERTIFICATIONS, LEGAL ENTITY DISCLOSURE AND THE STATUS OF NON-US ANALYSTS. US Disclosure: Credit Suisse does and seeks to do business with companies covered in its research reports. As a result, investors should be aware that the Firm may have a conflict of interest that could affect the objectivity of this report. Investors should consider this report as only a single factor in making their investment decision.
3 March 2017 Global
Equity Research Diversified Metals & Mining
Global Mining 2020 Capex The Ideas Engine series showcases Credit Suisse’s unique
insights and investment ideas.
Research Analysts
Europe
Liam Fitzpatrick
44 20 7883 8350
James Gurry
44 20 7883 7083
Michael Shillaker
34 91 791 58 78
Conor Rowley
44 20 7883 9156
Australia
Paul McTaggart
61 2 8205 4698
Christian Prendiville
612 8205 4012
Canada
Ralph M. Profiti, CFA
416 352 4563
Yan Truong, CFA
416 352 4584
Latin America
Ivano Westin
55 11 3701 6318
Renan Criscio
55 11 3701 6210
Specialist Sales: James Brady 44 20 7888 4267 [email protected]
Please contact your Sales person to access the supplemental analysis behind this report
SECTOR REVIEW KEY CONCLUSIONS
Deep dig on mining capex & capital allocation Figure 1: Diversified miners' capex progression 2016-20E ($m)
Companies used: BHP Billiton, Rio Tinto, Anglo American, Glencore, Vale and Teck Resources Source: Company data, Credit Suisse estimates
In this Ideas Engine, we take a global approach to future capital
allocation and capex: Through our in-depth analysis of the asset bases and
investment profiles of the six largest diversified miners, we assess longer-term
capex requirements and find material differences between the companies, with
important implications for future cash flows and shareholder returns.
■ Capex on the rise: A rebounding capex cycle is a sign of a healthier industry and only becomes a problem after several years of elevated returns (well above what is currently priced in), when more marginal projects are pursued. However, with growth capex having hit trough levels in 2016, volumes will begin to decline post 2020 without fresh investment.
■ 2020+ normalised capex: An area lacking in competitor analysis is longer-
term reliable capex estimates. Using our capex projection model, based on a detailed analysis of annual depletion rates and future project costs, we estimate that industry capex could rise by 50-60% compared with 2016. Under our 2020+ capex estimates and assuming spot iron ore and coal prices moderate (iron ore to $55-60/tonne), sector FCF yields would fall from over 15% to 8-10%. However, we think material increases in capex are unlikely until 2019/20.
■ Not all companies are equal: Companies where we see the lowest level of potential capex increases on a three- to five-year view look to be the best positioned. Vale is in the strongest position with declining capex, followed by Rio and Teck with limited increases expected by 2020. We see the greatest risk of capex increases at BHP and Anglo American. Glencore's capex could also rise significantly, but latent capacity is an advantage.
■ Stock calls: Our preferred names are Rio, Glencore and Teck, all Outperform-rated. We have raised our 2017/18 iron ore price forecasts from $55/53 per tonne to $78/$58 per tonne and sit materially ahead of consensus. Linked to our view of contained capex for the next two years, we make significant upgrades to our two-year cash return assumptions.
22,144
33,380
2,338
8,898
-
5,000
10,000
15,000
20,000
25,000
30,000
35,000
40,000
2016 Capex increase to maintainstable production
Capex to grow at 2% pa 2020E

3 March 2017
Global Mining 2020 Capex 2
Focus charts
Figure 2: Diversified miners' capex outlook
Figure 3: 2020+ capex outlook (% change vs 2017
guidance)
Source: Company data, Credit Suisse estimates, CY basis, Companies used: BHP, RIO, AAL, GLEN, Vale and Teck
Source: Credit Suisse estimates
Figure 4: Illustrative FCF Bridge 2017E spot to
2020E normalized Figure 5: CS capex estimates vs consensus
Source: Credit Suisse estimates, CY basis Note: Above charts based on BHP,RIO, AAL, GLEN. Spot prices assumed for 2020 except for iron ore ($60), thermal coal ($70), coking coal ($140)
Source: Company data, Credit Suisse estimates, I/B/E/S Consensus,
Figure 6: Copper industry expansionary capital ($/t
annual production) Figure 7: Large cap growth capex 2005-16
Source: Wood Mackenzie, Credit Suisse research Source: Company data, CY basis
-
5,000
10,000
15,000
20,000
25,000
30,000
35,000
40,000
2016 2017E 2020E
2020E normalized capex to offset
production decline
2020E normalized capex to grow production by
2%pa
Potential ~52% capex
2016/17 guided capex increase
of 5%
-20%
0%
20%
40%
60%
80%
100%
AAL BHP GLEN Teck VALE RIO
2020+ capex to keep volumes stable 2020 capex to grow at 2% pa
Capex Increase Risk
-
5,000
10,000
15,000
20,000
25,000
30,000
35,000
40,000
45,000
Spot 2017EFCF
Change incapex 2020 vs
2017
Highervolumes
Iron ore $60/tand lower coal
prices
2020ENormalised
-
5,000
10,000
15,000
20,000
25,000
30,000
35,000
40,000
20
15
20
16
20
17
E
20
18
E
20
19
E
20
20
E
Total Capex CS estimates IBES Consensus Capex
2020E normalized capex to grow production by 2%pa
0
500
1,000
1,500
2,000
2,500
2000 2002 2004 2006 2008 2010 2012 2014 2016
-
10,000
20,000
30,000
40,000
50,000
60,000
2005 2006 2007 2008 2009 2010 2011 2012 2013 2014 2015 2016
BLT RIO GLEN AAL VALE TECK
3 March 2017
Global Mining 2020 Capex 3
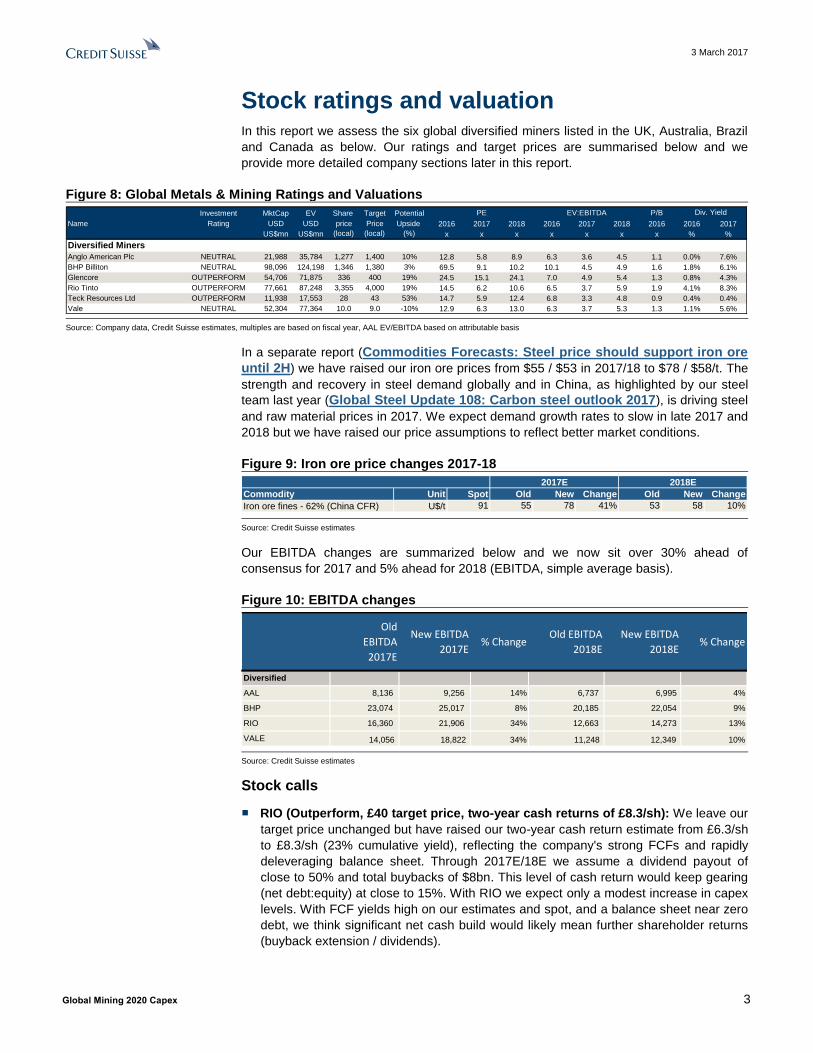
Stock ratings and valuation In this report we assess the six global diversified miners listed in the UK, Australia, Brazil
and Canada as below. Our ratings and target prices are summarised below and we
provide more detailed company sections later in this report.
Figure 8: Global Metals & Mining Ratings and Valuations
Source: Company data, Credit Suisse estimates, multiples are based on fiscal year, AAL EV/EBITDA based on attributable basis
In a separate report (Commodities Forecasts: Steel price should support iron ore
until 2H) we have raised our iron ore prices from $55 / $53 in 2017/18 to $78 / $58/t. The
strength and recovery in steel demand globally and in China, as highlighted by our steel
team last year (Global Steel Update 108: Carbon steel outlook 2017), is driving steel
and raw material prices in 2017. We expect demand growth rates to slow in late 2017 and
2018 but we have raised our price assumptions to reflect better market conditions.
Figure 9: Iron ore price changes 2017-18
Source: Credit Suisse estimates
Our EBITDA changes are summarized below and we now sit over 30% ahead of
consensus for 2017 and 5% ahead for 2018 (EBITDA, simple average basis).
Figure 10: EBITDA changes
Source: Credit Suisse estimates
Stock calls
■ RIO (Outperform, £40 target price, two-year cash returns of £8.3/sh): We leave our
target price unchanged but have raised our two-year cash return estimate from £6.3/sh
to £8.3/sh (23% cumulative yield), reflecting the company's strong FCFs and rapidly
deleveraging balance sheet. Through 2017E/18E we assume a dividend payout of
close to 50% and total buybacks of $8bn. This level of cash return would keep gearing
(net debt:equity) at close to 15%. With RIO we expect only a modest increase in capex
levels. With FCF yields high on our estimates and spot, and a balance sheet near zero
debt, we think significant net cash build would likely mean further shareholder returns
(buyback extension / dividends).
Investment MktCap EV Share Target Potential PE EV:EBITDA P/B
Name Rating USD USD price Price Upside 2016 2017 2018 2016 2017 2018 2016 2016 2017
US$mn US$mn (local) (local) (%) x x x x x x x % %
Diversified Miners
Anglo American Plc NEUTRAL 21,988 35,784 1,277 1,400 10% 12.8 5.8 8.9 6.3 3.6 4.5 1.1 0.0% 7.6%
BHP Billiton NEUTRAL 98,096 124,198 1,346 1,380 3% 69.5 9.1 10.2 10.1 4.5 4.9 1.6 1.8% 6.1%
Glencore OUTPERFORM 54,706 71,875 336 400 19% 24.5 15.1 24.1 7.0 4.9 5.4 1.3 0.8% 4.3%
Rio Tinto OUTPERFORM 77,661 87,248 3,355 4,000 19% 14.5 6.2 10.6 6.5 3.7 5.9 1.9 4.1% 8.3%
Teck Resources Ltd OUTPERFORM 11,938 17,553 28 43 53% 14.7 5.9 12.4 6.8 3.3 4.8 0.9 0.4% 0.4%
Vale NEUTRAL 52,304 77,364 10.0 9.0 -10% 12.9 6.3 13.0 6.3 3.7 5.3 1.3 1.1% 5.6%
Div. Yield
2017E 2018E Long-
Commodity Unit Spot Old New Change Old New Change
Iron ore fines - 62% (China CFR) U$/t 91 55 78 41% 53 58 10%
Old
EBITDA
2017E
New EBITDA
2017E% Change
Old EBITDA
2018E
New EBITDA
2018E% Change
Diversified
AAL 8,136 9,256 14% 6,737 6,995 4%
BHP 23,074 25,017 8% 20,185 22,054 9%
RIO 16,360 21,906 34% 12,663 14,273 13%
VALE 14,056 18,822 34% 11,248 12,349 10%
3 March 2017
Global Mining 2020 Capex 4
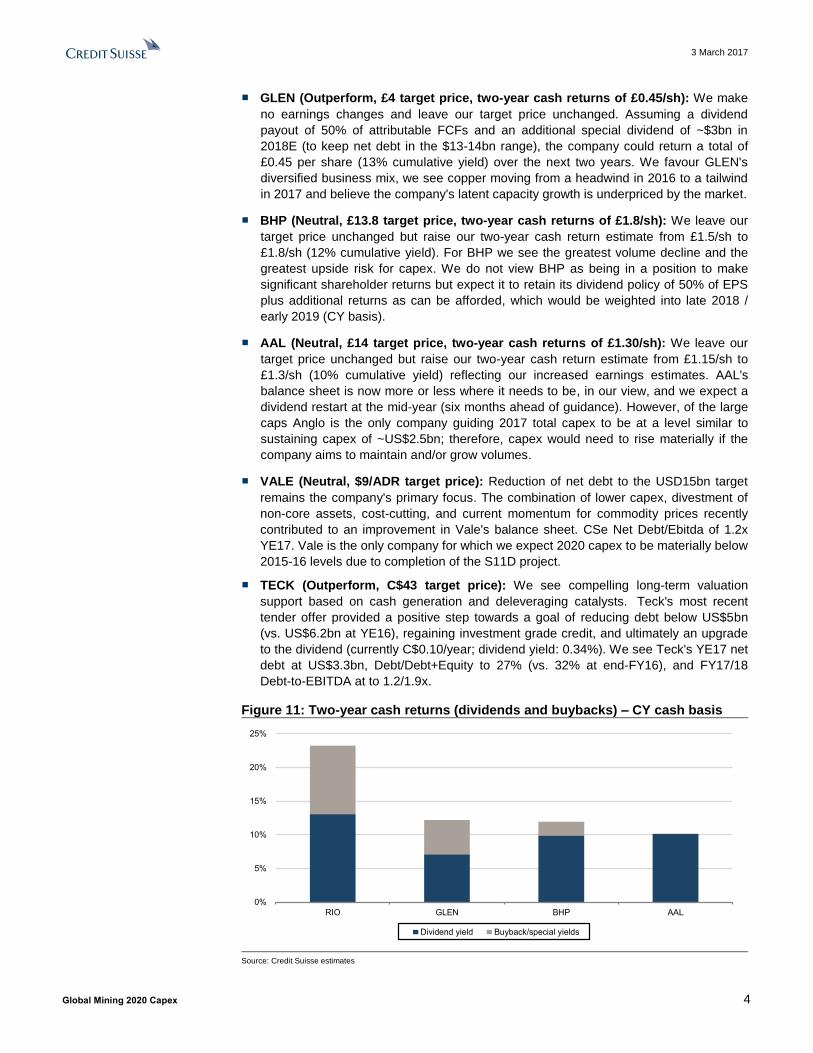
■ GLEN (Outperform, £4 target price, two-year cash returns of £0.45/sh): We make
no earnings changes and leave our target price unchanged. Assuming a dividend
payout of 50% of attributable FCFs and an additional special dividend of ~$3bn in
2018E (to keep net debt in the $13-14bn range), the company could return a total of
£0.45 per share (13% cumulative yield) over the next two years. We favour GLEN's
diversified business mix, we see copper moving from a headwind in 2016 to a tailwind
in 2017 and believe the company's latent capacity growth is underpriced by the market.
■ BHP (Neutral, £13.8 target price, two-year cash returns of £1.8/sh): We leave our
target price unchanged but raise our two-year cash return estimate from £1.5/sh to
£1.8/sh (12% cumulative yield). For BHP we see the greatest volume decline and the
greatest upside risk for capex. We do not view BHP as being in a position to make
significant shareholder returns but expect it to retain its dividend policy of 50% of EPS
plus additional returns as can be afforded, which would be weighted into late 2018 /
early 2019 (CY basis).
■ AAL (Neutral, £14 target price, two-year cash returns of £1.30/sh): We leave our
target price unchanged but raise our two-year cash return estimate from £1.15/sh to
£1.3/sh (10% cumulative yield) reflecting our increased earnings estimates. AAL's
balance sheet is now more or less where it needs to be, in our view, and we expect a
dividend restart at the mid-year (six months ahead of guidance). However, of the large
caps Anglo is the only company guiding 2017 total capex to be at a level similar to
sustaining capex of ~US$2.5bn; therefore, capex would need to rise materially if the
company aims to maintain and/or grow volumes.
■ VALE (Neutral, $9/ADR target price): Reduction of net debt to the USD15bn target
remains the company's primary focus. The combination of lower capex, divestment of
non-core assets, cost-cutting, and current momentum for commodity prices recently
contributed to an improvement in Vale's balance sheet. CSe Net Debt/Ebitda of 1.2x
YE17. Vale is the only company for which we expect 2020 capex to be materially below
2015-16 levels due to completion of the S11D project.
■ TECK (Outperform, C$43 target price): We see compelling long-term valuation
support based on cash generation and deleveraging catalysts. Teck's most recent
tender offer provided a positive step towards a goal of reducing debt below US$5bn
(vs. US$6.2bn at YE16), regaining investment grade credit, and ultimately an upgrade
to the dividend (currently C$0.10/year; dividend yield: 0.34%). We see Teck's YE17 net
debt at US$3.3bn, Debt/Debt+Equity to 27% (vs. 32% at end-FY16), and FY17/18
Debt-to-EBITDA at to 1.2/1.9x.
Figure 11: Two-year cash returns (dividends and buybacks) – CY cash basis
Source: Credit Suisse estimates
0%
5%
10%
15%
20%
25%
RIO GLEN BHP AAL
Dividend yield Buyback/special yields

3 March 2017
Global Mining 2020 Capex 5
Our commodity price assumptions are summarised below:
Figure 12: Commodity price forecast
Source: Credit Suisse estimates, Thomson Reuters
Base case and spot multiples are summarized below for the six companies.
Figure 13: Valuation summary base and spot
Source: Credit Suisse estimates, CY basis, PE based on Underlying EPS, AAL EV/EBITDA adjusted for minorities.
Commodity Unit 2015 2016E 2017E 2018E Spot
Spot
vs. 2016
Spot
vs. 2017
Spot
vs. 2018
Iron ore 62% CFR $/t 56 57 78 58 91 59% 18% 57%
Thermal coal $/t 58 61 74 70 83 36% 13% 19%
Coking coal Contract $/t 102 114 200 130 162 42% -19% 25%
Ferrochrome $/lb 1.07 0.96 1.53 1.20 1.65 73% 8% 38%
Copper U$/lb 2.50 2.22 2.45 2.05 2.72 23% 11% 33%
Nickel U$/lb 5.38 4.37 5.25 6.00 4.98 14% -5% -17%
Zinc U$/lb 0.88 0.95 1.15 1.05 1.29 36% 13% 23%
Aluminium U$/lb 0.75 0.73 0.79 0.74 0.88 21% 12% 20%
Platinum U$/oz 1,053 990 938 940 1,015 3% 8% 8%
Palladium U$/oz 690 618 730 740 775 25% 6% 5%
Gold U$/oz 1,160 1,251 1,338 1,375 1,245 0% -7% -9%
Oil (Brent) US$/t 52.7 44.5 56.3 65.0 56.7 28% 1% -13%
USD:AUD 0.75 0.74 0.73 0.72 0.77 4% 6% 7%
USD:ZAR 12.77 14.73 13.75 14.25 12.82 -13% -7% -10%
USD:Peso 655 678 675 720 641 -5% -5% -11%
USD:KZT 223 342 323 315 312 -9% -3% -1%
USD:SEK 8.44 8.55 9.00 9.20 8.98 5% 0% -2%
Base Case
2017 2018 2017 2018 2017 2018 2017 2018 2017 2018 2017 2018
Diversifieds
BHP 8.1 11.2 4.2 5.4 0.5 0.5 0.1 0.1 13.6% 9.1% 6.2% 4.5%
RIO 6.2 10.6 3.7 5.9 0.2 0.5 0.0 0.1 16.1% 8.0% 8.3% 5.5%
Glen 15.1 24.1 4.9 5.4 0.8 0.8 0.2 0.2 10.3% 8.6% 4.3% 4.3%
AAL 5.8 8.8 3.6 4.5 0.6 0.6 0.3 0.2 16.0% 11.0% 7.6% 5.7%
Teck 5.9 12.4 3.3 4.8 0.7 0.7 0.3 0.2 12.7% 11.5% 0.4% 0.4%
Vale 6.7 13.9 3.9 5.5 1.0 1.0 0.3 0.2 17.5% 12.6% 5.3% 3.6%
Spot Case
2017 2018 2017 2018 2017 2018 2017 2018 2017 2018 2017 2018
Diversifieds
BHP 7.2 6.3 3.8 3.5 0.4 0.1 0.1 0.0 15.0% 15.2% 7.0% 7.0%
RIO 5.1 4.8 3.1 3.0 0.0 -0.1 0.0 0.0 19.4% 18.5% 9.6% 10.3%
Glen 13.6 13.4 4.6 4.3 0.8 0.5 0.2 0.1 11.1% 11.2% 4.7% 6.0%
AAL 5.6 5.3 3.4 3.0 0.5 0.3 0.2 0.1 16.9% 18.8% 8.2% 9.4%
Teck 5.5 7.2 3.2 3.3 0.7 0.3 0.3 0.1 13.6% 18.4% 0.4% 0.4%
Vale 4.5 3.7 3.2 2.4 0.8 0.2 0.3 0.1 19.8% 27.6% 3.3% 6.7%
FCF Yield Div YieldP/E EV/EBITDA ND/EBITDA ND/Mrk Cap
Div YieldP/E EV/EBITDA ND/EBITDA ND/Mrk Cap FCF Yield

3 March 2017
Global Mining 2020 Capex 6
Executive summary After three years of heavy cuts, the global mining capex cycle is turning. The sector
reached unprecedented levels of capex from 2011 to 2013 but then needed to cut
investment sharply in reaction to weaker demand growth, falling prices and the resultant
pressure on balance sheets and cash flows. From strategies led by volume and market
share gains only 4-5 years ago, the large cap CEO mantra is now one of value over
volume and a prudent approach to growth is likely to remain.
However, mining is a capex-intensive industry with finite reserves and, with balance
sheets repaired and the outlook for commodities brighter than 12 months ago, the industry
now looks to be in a position to begin investing again to offset natural mine depletion and
for longer-term growth. A frustration for investors is that sell-side estimates typically only
factor in known projects and may show unrealistic capex and FCF profiles on a 2-3 year
horizon. Our report addresses this issue by analysing where capex could trend to from
2020. We expect only modest increases in 2017/18 capex with businesses generally well
capitalised following the significant investment during the boom years and steady annual
volume growth from projects committed to 5-6 years ago. From 2020, we estimate capex
for the six companies assessed could increase by 50-60% compared with 2016 levels
assuming the companies aim to maintain average annual volume growth at 2% pa. If the
companies only invest sufficiently to offset reserve decline/mine depletion, capex could
remain at levels similar to 2017 guidance.
Figure 14: Large cap total capex U$m – could increase 60% by 2020E (vs 2016)
Source: Company data, Credit Suisse estimates, Glencore pro forma before 2013 and XTA capex before 2006
Balance sheet improvements should lead shareholder cash returns and then capex higher
Capex cuts and efforts to improve cash flows were at their maximum in late 2015/early
2016. 2016 was a year of balance sheet recovery and 2017 and 2018 should see further
material net debt reductions and higher shareholder returns. By end 2017, we expect net
debt for the six diversified miners to have more than halved from the 2012 peak of $120bn
to below $60bn. Net debt:EBITDA should on average fall below 1x. All of the corporates
are signaling more conservative balance sheet policies than in the past, but by the end of
2017 balance sheets should be under-geared, allowing for increased shareholder returns
through ordinary dividends, specials and buybacks.
-
10,000
20,000
30,000
40,000
50,000
60,000
70,000
80,000
1998
1999
2000
2001
2002
2003
2004
2005
2006
2007
2008
2009
2010
2011
2012
2013
2014
2015
2016
2017E
2018E
2020E
2020E
BLT RIO GLEN AAL Vale Teck
2020E normalized capex to offset
production decline
2020E normalized
capex to grow production by
2% pa

3 March 2017
Global Mining 2020 Capex 7
Figure 15: Net Debt: EBITDA 2016 and 2017E Figure 16: Large cap aggregate Net Debt
Source: Company data, Credit Suisse estimates, CY basis Note: 2017 are CS estimates Source: Company data, Credit Suisse estimates, CY basis, Includes BLT, RIO, GLEN, AAL, VALE and Teck
Below we illustrate total shareholder cash returns (through dividends and buybacks)
expected over the next two years. We break this down between our normal dividend
assumptions and specials/buybacks. The below chart excludes VALE and TECK where
we expect the focus through 2017 and 2018 to still be on debt reduction.
Figure 17: Shareholder cash returns (dividends and buybacks)
Source: Credit Suisse estimates
Volumes likely to decline post 2019/20 without increased investment
For the diversified miners, volume growth averaged ~5% pa over 2010-15 but slowed
sharply thereafter. Legacy growth projects should keep volumes expanded out to 2019,
but from 2019/20, we expect volume growth to grind to a halt without fresh investment in
replacement projects and potential new growth opportunities. An exception to this is VALE
where iron ore growth volumes are expected to continue over the next 3-4 years.
-
0.50
1.00
1.50
2.00
2.50
VALE GLEN TECK AAL BLT RIO
2016 2017
-
0.50
1.00
1.50
2.00
2.50
-
20,000
40,000
60,000
80,000
100,000
120,000
140,000
2011 2012 2013 2014 2015 2016 2017
Net Debt ND/EBITDA
0%
5%
10%
15%
20%
25%
RIO GLEN BHP AAL
Dividend yield Buyback/special yields

3 March 2017
Global Mining 2020 Capex 8
Figure 18: Large cap indexed volume growth 2010-20E
Source: Company data, Credit Suisse estimates, CY basis Note: CS estimates from 2017-20
Total industry capex from 2020 could rise by 50-60% vs 2016
We estimate capex trends for each of the companies based on expected production levels
in 2020, anticipated production declines thereafter (due to lower grades, mine depletion
etc) and estimated project costs. Under a scenario where each of the companies invests
sufficiently to offset reserve decline (typically of 3-4% pa) and grow group production
volumes by 2% (slightly below long-term commodity demand growth trends), we estimate
capex for the industry could climb by 50-60% from 2020 onwards. However, as we discuss
in the company sections that follow, there are large differences between the companies.
VALE is the only major where we expect lower capex in 2020 vs 2016. Excluding VALE
we expect capex for the other companies to be up over 60% vs 2016 levels.
Figure 19: Capex progression 2016-20E ($m)
Source: Company data, Credit Suisse estimates, Companies used: BHP, RIO, AAL, GLEN, VALE and Teck
The companies have inherent flexibility around capex and we don’t expect more material
increases until 2019/20. If prices were to decline and companies only invest sufficiently to
keep group volumes stable, capex could remain at levels similar to 2017 guidance.
22,144
33,380
2,338
8,898
-
5,000
10,000
15,000
20,000
25,000
30,000
35,000
40,000
2016 Capex increase to maintainstable production
Capex to grow at 2% pa 2020E

3 March 2017
Global Mining 2020 Capex 9
Capex increases only become a problem at the end of a cycle
The sector is enjoying high margins and FCFs well above the market average and
historical norms, and a return to the free-spending 2007-12 years seems to be a growing
concern with investors. Commodity prices, which lead capex direction by ~1 year, have
recovered strongly over the past year and spot EBITDA margins are now higher than the
peak years. Based on current guidance, the companies are already guiding in aggregate
to 2017 capex 5-10% above 2016 levels. At the company level, there are different trends,
with Vale guiding to lower capex YoY in 2017, Anglo to flat and the other companies to
increases of more than 10% (details in the company sections).
While capex will most likely increase over the coming years, a rebounding capex cycle is a
sign of a healthier industry and excessive capex becomes a problem only towards the end
of a cycle when supply outpaces demand and marginal projects are pursued. We think the
industry would need to generate several years of elevated returns before a lack of capex
discipline becomes a concern.
Figure 20: Large cap EBITDA margins 2005-17E vs
prices Figure 21: Average ROCE 2005-17E vs capex (U$m)
Source: Company data, Credit Suisse estimates, Thomson Reuters, Large cap includes BLT,RIO and AAL, CY basis, Weights for Commodity index: Iron ore 35%, Cu 25%, Coal 15%, Ali 5%, Ni 3%, Zn 5%, Pt 5%, Brent 7%
Source: Company data, Credit Suisse estimates, Large cap includes BLT, RIO and AAL, CY basis, Total capex for BLT, RIO, GLEN, AAL, Vale and Teck
Capex intensity in US$ terms should remain structurally lower than the peak 2010-13 period, but…
The major mining resource currencies are now 25-40% weaker against the US$ compared
with average levels in the 2010-12 period. Key input costs such as oil and steel are also
materially lower and the overall supply chain is looser. Company management teams have
estimated that current project costs are down 15-40% compared with the peak 2012
period (bigger increases for iron ore / bulk projects versus copper/base metals)
… capex intensity structurally higher for copper than for iron ore and…
Capex for growth is likely to be directed more towards later-cycle copper than to earlier-
cycle iron ore where we expect production to continue to ramp up to installed capacity
over the next three years. Our analysis later in this report shows that copper capex
intensity (measured by capex:sales and capex to unit of production) is almost double that
of iron ore, meaning targeted growth in copper will increase capex requirements over the
long term.
0
50
100
150
200
250
300
350
400
30%
32%
34%
36%
38%
40%
42%
44%
46%
48%
2005 2007 2009 2011 2013 2015 2017E
EBITDA % Underlying Commodity index, Rhs
-
10,000
20,000
30,000
40,000
50,000
60,000
70,000
80,000
90,000
0%
5%
10%
15%
20%
25%
30%
2005 2007 2009 2011 2013 2015 2017E
Average ROCE Total Capex, Rhs
3 March 2017
Global Mining 2020 Capex 10
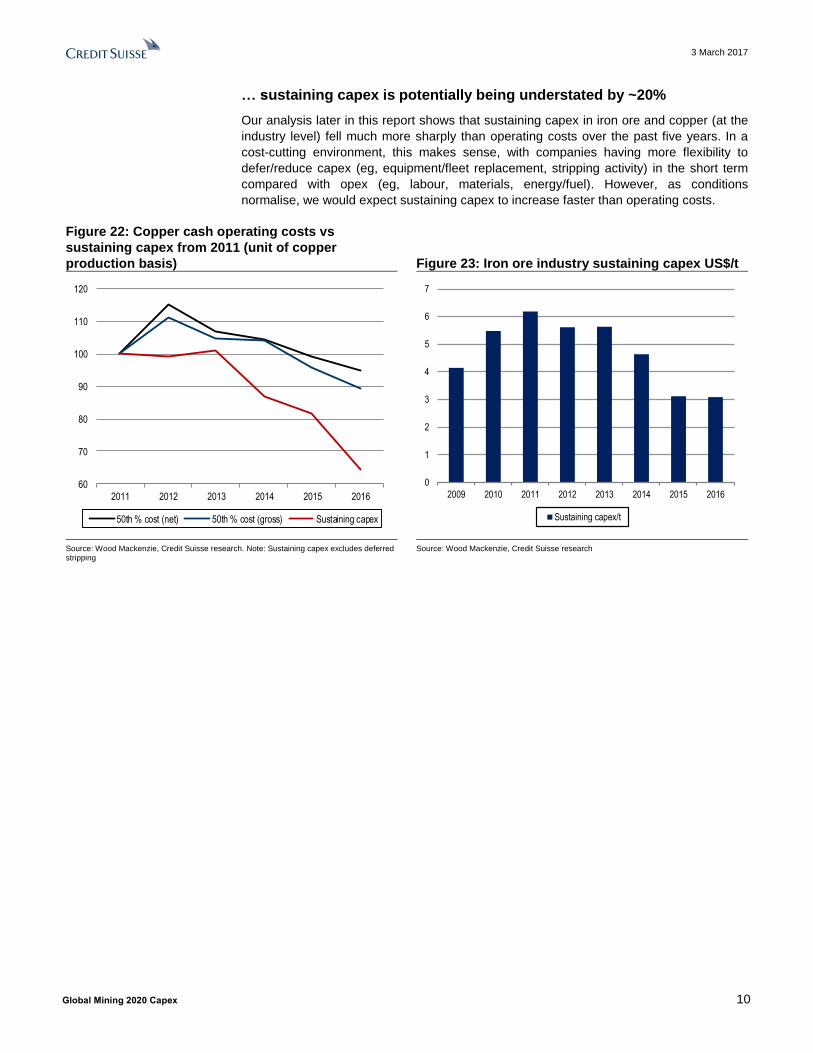
… sustaining capex is potentially being understated by ~20%
Our analysis later in this report shows that sustaining capex in iron ore and copper (at the
industry level) fell much more sharply than operating costs over the past five years. In a
cost-cutting environment, this makes sense, with companies having more flexibility to
defer/reduce capex (eg, equipment/fleet replacement, stripping activity) in the short term
compared with opex (eg, labour, materials, energy/fuel). However, as conditions
normalise, we would expect sustaining capex to increase faster than operating costs.
Figure 22: Copper cash operating costs vs
sustaining capex from 2011 (unit of copper
production basis) Figure 23: Iron ore industry sustaining capex US$/t
Source: Wood Mackenzie, Credit Suisse research. Note: Sustaining capex excludes deferred stripping
Source: Wood Mackenzie, Credit Suisse research
60
70
80
90
100
110
120
2011 2012 2013 2014 2015 2016
50th % cost (net) 50th % cost (gross) Sustaining capex
0
1
2
3
4
5
6
7
2009 2010 2011 2012 2013 2014 2015 2016
Sustaining capex/t

3 March 2017
Global Mining 2020 Capex 11
Europe/United Kingdom Diversified Metals & Mining
Anglo American Plc (AAL.L) Rating NEUTRAL [V] Price (01 Mar 17, p) 1310.00 Target price (p) 1400.00 Market Cap (£ m) 18,369.4 Enterprise value (£ m) 27,411.7 Target price is for 12 months.
[V] = Stock Considered Volatile (see Disclosure Appendix)
Research Analysts
Liam Fitzpatrick
44 20 7883 8350
Michael Shillaker
34 91 791 58 78
James Gurry
44 20 7883 7083
Conor Rowley
44 20 7883 9156
Sustaining capex is not sustainable
■ Capex outlook: Anglo is the only of the large caps guiding 2017 total capex
to be at a similar level to sustaining capex of ~US$2.5bn. From 2019, group
volumes will likely begin to decline and from 2020, we estimate group
volumes will decline at a rate of close to 3% pa assuming no capex is sunk
beyond sustaining capex (of ~US$2.5bn). This will mean capex will need to
rise materially if the company aims to maintain and/or grow volumes. To keep
group volumes flat post 2020, we estimate the company would need to spend
~US$3.5bn pa (US$2.5bn sustaining). To grow volumes at 2% pa from 2020,
and assuming that incremental volume growth is primarily in copper rather
than iron ore, would mean that group capex could climb to US$4.5bn.
■ Investment overview: At the recent FY16 results, management gave the
latest iteration of the Anglo strategy which now envisages retaining most of
the iron ore and coal businesses. The balance sheet is now more or less
where it needs to be and we expect a dividend restart at the mid-year (six
months ahead of guidance). However, as we outlined in our recent note
(Anglo American Plc - Breaking up is hard to do) we see strategic merit in
divesting a large part (if not all) of the SA businesses, including reduced EM
exposure (higher multiple, lower perceived political risk), simpler corporate
structure and greater concentration towards later cycle commodities. The
tough question for management now is whether Anglo in its current form is
sufficiently differentiated compared to its larger (and simpler) global peers.
■ Catalysts and risks: Progress on divestments (Samancor, domestic coal in
SA); Coking coal, iron ore, platinum and copper prices; Regulatory
developments in South Africa.
■ Valuation and earnings changes: We increase EBITDA estimates by
14%/4% in 2017/18 on our higher base case iron ore prices. We leave our TP
unchanged at £14 but increase our dividend assumptions for 2017/18 (50%
payout ratio assumed).
Share price performance
The price relative chart measures performance against the
FTSE ALL SHARE INDEX which closed at 4014.7 on
01/03/17
On 01/03/17 the spot exchange rate was £.86/Eu 1.-
Eu.95/US$1
Performance 1M 3M 12M Absolute (%) -6.0 5.6 143.7 Relative (%) -10.0 -3.9 124.7
Financial and valuation metrics
Year 12/16A 12/17E 12/18E 12/19E Revenue (US$ m) 21,378.0 24,614.1 22,255.4 23,290.6 EBITDA (US$ m) 6,075.0 9,256.1 6,994.7 7,459.3 Pre-tax profit adjusted (US$ m) 4,724.00 6,664.34 4,343.80 4,729.69 CS EPS (adj.) (US$) 1.23 2.68 1.76 1.89 Prev. EPS (US$) - 2.31 1.66 - ROIC (%) 9.8 15.0 9.9 10.5 P/E (adj.) (x) 13.1 6.0 9.2 8.5 P/E rel. (%) 73.4 40.7 67.3 68.2 EV/EBITDA (x) 6.0 3.7 4.7 4.3
Dividend (12/17E, US$) 1.20 Net debt/equity (12/17E,%) 19.6 Dividend yield (12/17E,%) 7.4 Net debt (12/17E, US$ m) 5,419.3 BV/share (12/17E, US$) 16.9 IC (12/17E, US$ m) 33,109.4 Free float (%) 100.0 EV/IC (12/17E, (x) 1.0 Source: Company data, Thomson Reuters, Credit Suisse estimates

3 March 2017
Global Mining 2020 Capex 12
Anglo American Plc (AAL.L)
Price (01 Mar 2017): 1310.00p; Rating: NEUTRAL [V]; Target Price: 1400.00p; Analyst: Liam Fitzpatrick
Income statement (US$ m) 12/16A 12/17E 12/18E 12/19E
Revenue 21,378 24,614 22,255 23,291 EBITDA 6,075 9,256 6,995 7,459 Depr. & amort. (2,309) (2,628) (2,753) (2,831) EBIT 3,766 6,628 4,242 4,629 Net interest exp. (229) (407) (259) (262) Associates 278 443 361 363 PBT 4,724 6,664 4,344 4,730 Income taxes (698) (1,661) (1,025) (1,177) Profit after tax 4,026 5,003 3,319 3,552 Minorities (332) (832) (466) (520) Preferred dividends - - - - Associates & other (2,100) (685) (566) (569) Net profit 1,594 3,487 2,287 2,463 Other NPAT adjustments 0 0 0 0 Reported net income 1,594 3,487 2,287 2,463
Cash flow (US$ m) 12/16A 12/17E 12/18E 12/19E
EBIT 3,766 6,628 4,242 4,629 Net interest (229) (407) (259) (262) Cash taxes paid - - - - Change in working capital 1,863 (400) 0 (118) Other cash and non-cash items (1) 1,133 1,601 1,527 Cash flow from operations 5,399 6,954 5,584 5,776 CAPEX (2,418) (2,499) (2,553) (2,839) Free cashflow to the firm 4,112 3,875 2,477 2,366 Acquisitions 0 0 0 0 Divestments - - - - Other investment/(outflows) 1,893 282 137 70 Cash flow from investments (525) (2,216) (2,415) (2,769) Net share issue/(repurchase) - - - - Dividends paid 0 (807) (1,287) (1,206) Issuance (retirement) of debt (4,519) (5,320) (3,000) 0 Cashflow from financing (5,780) (6,990) (4,979) (1,847) Changes in net cash/debt 4,423 3,068 1,190 1,160 Net debt at start 12,910 8,487 5,419 4,230 Change in net debt (4,423) (3,068) (1,190) (1,160) Net debt at end 8,487 5,419 4,230 3,069
Balance sheet (US$ m) 12/16A 12/17E 12/18E 12/19E
Assets Total current assets 12,449 10,197 8,386 9,776 Total assets 50,149 47,794 45,748 47,178 Liabilities Total current liabilities 6,525 6,125 6,125 6,236 Total liabilities 25,824 20,104 17,104 17,215 Total equity and liabilities 50,149 47,794 45,748 47,178
Per share 12/16A 12/17E 12/18E 12/19E
No. of shares (wtd avg.) (mn) 1,300 1,300 1,300 1,300 CS EPS (adj.) (US$) 1.23 2.68 1.76 1.89 Dividend (US$) 0.00 1.20 0.89 0.96 Free cash flow per share (US$) 3.16 2.98 1.91 1.82
Key ratios and valuation 12/16A 12/17E 12/18E 12/19E
Growth/Margin (%) Sales growth (%) 4.5 15.1 (9.6) 4.7 EBIT growth (%) 69.4 76.0 (36.0) 9.1 Net income growth (%) 128.3 118.7 (34.4) 7.7 EPS growth (%) 128.1 118.7 (34.4) 7.7 EBITDA margin (%) 28.4 37.6 31.4 32.0 EBIT margin (%) 17.6 26.9 19.1 19.9 Pretax profit margin (%) 22.1 27.1 19.5 20.3 Net income margin (%) 7.5 14.2 10.3 10.6
Valuation 12/16A 12/17E 12/18E 12/19E
EV/Sales (x) 1.7 1.4 1.5 1.4 EV/EBITDA (x) 6.0 3.7 4.7 4.3 EV/EBIT (x) 9.7 5.1 7.8 6.9 Dividend yield (%) 0.00 7.43 5.51 5.94 P/E (x) 13.1 6.0 9.2 8.5
Credit ratios (%) 12/16A 12/17E 12/18E 12/19E
Net debt/equity (%) 34.9 19.6 14.8 10.2 Net debt to EBITDA (x) 1.4 0.6 0.6 0.4 Interest coverage ratio (x) 16.4 16.3 16.4 17.7
Company Background
Anglo American plc is a global mining company. Its portfolio of mining assets and natural resources includes platinum group metals and diamonds, with interests in copper, iron ore, metallurgical coal, nickel and thermal coal.
Blue/Grey Sky Scenario
Our Blue Sky Scenario (p) 1800.00
Our Blue Sky valuation of £18.0 assumes a full break-up / take-out valuation for the group.
Our Grey Sky Scenario (p) 800.00
Our Grey Sky valuation of £8 assumes ~$45/t iron ore and ~200c copper, but we do not assume a return to the extreme balance sheet stress as seen in late 2015/early 2016.
Share price performance
The price relative chart measures performance against the FTSE ALL SHARE
INDEX which closed at 4014.7 on 01/03/17
On 01/03/17 the spot exchange rate was £.86/Eu 1.- Eu.95/US$1
Source: FTI, Company data, Thomson Reuters, Credit Suisse Securities (EUROPE) LTD. Estimates

3 March 2017
Global Mining 2020 Capex 13
Asia Pacific/Australia Diversified Metals & Mining
BHP Billiton (BLT.L) Rating NEUTRAL [V] Price (01 Mar 17, p) 1353.50 Target price (p) 1380.00 Market Cap (£ m) 78,458.7 Enterprise value (£ m) 90,015.4 Primary RIC BHP.AX Price (01 Mar 17, A$) 24.88 Target price (A$) 26.50 Target price is for 12 months.
[V] = Stock Considered Volatile (see Disclosure Appendix)
Research Analysts
Paul McTaggart
61 2 8205 4698
James Gurry
44 20 7883 7083
Liam Fitzpatrick
44 20 7883 8350
Conor Rowley
44 20 7883 9156
Rising capex requirements on a 2-3 year
horizon
■ Event: We increase BHP EBITDA by 8%, 9% and 3% over the 3 years FY17-
FY19 on our higher base case iron ore prices. However, in this analysis, we
also note the rising capex profile we expect at BHP as it considers the next
round of project approvals including the next Phase at Escondida, Olympic
Dam growth to 450kt/yr, iron ore replacement mines near 2020 and the
Jansen potash project as shaft development approaches completion. This is
even before considering the oil business where volumes are declining and
investment increasing, with extremely high levels of exploration spend at
~US$800m/yr. We do not see BHP in a position to make significant
shareholder returns but expect it to stick to its dividend policy of 50% of EPS
plus additional returns as can be afforded.
■ Investment overview: Oil is the differentiator and we would be more
negative on BHP except for our view on oil prices is for upside risk. The shale
operations were FCF positive for the first time in the Dec-2016 half year.
■ Catalysts and risks: Oil and iron ore prices are key risks and potential
catalysts and we see divergent expectations - positive for the former and
negative for the latter - on a 12-month view. We expect the Spence copper
project US$2.2bn to be approved in coming months. Thereafter, we highlight
a series of project approval considerations for BHP over the coming 2-3
years.
■ Valuation: BHP trades on c.9x FY17E PE and 4.4x EBITDA. This is not
demanding but lacks the clear value and shareholder return case we see in
its major rivals.
Share price performance
The price relative chart measures performance against the
FTSE ALL SHARE INDEX which closed at 4014.7 on
01/03/17
On 01/03/17 the spot exchange rate was £.86/Eu 1.-
Eu.95/US$1
Performance 1M 3M 12M Absolute (%) -6.4 3.2 72.9 Relative (%) -10.4 -6.3 54.0
Financial and valuation metrics
Year 6/16A 6/17E 6/18E 6/19E Revenue (US$ m) 30,912.0 43,611.2 40,416.6 36,619.0 EBITDA (US$ m) 12,340.0 25,017.2 22,054.4 17,918.3 Pre-tax profit adjusted (US$ m) 2,445.00 16,300.31 13,752.29 10,421.24 CS EPS (adj.) (US$) 0.24 1.81 1.63 1.29 Prev. EPS (US$) - 1.58 1.39 1.19 ROIC (%) 2.4 13.6 12.4 9.5 P/E (adj.) (x) 69.9 9.2 10.2 12.9 P/E rel. (%) 391.0 62.2 75.2 103.8 EV/EBITDA (x) 9.9 4.4 4.8 5.9
Dividend (06/17E, US$) 1.01 Net debt/equity (06/17E,%) 21.6 Dividend yield (06/17E,%) 6.1 Net debt (06/17E, US$ m) 14,392.9 BV/share (06/17E, US$) 11.4 IC (06/17E, US$ m) 81,036.9 Free float (%) 99.5 EV/IC (06/17E, (x) 1.4 Source: Company data, Thomson Reuters, Credit Suisse estimates

3 March 2017
Global Mining 2020 Capex 14
BHP Billiton (BLT.L)
Price (01 Mar 2017): 1353.50p; Rating: NEUTRAL [V]; Target Price: 1380.00p; Analyst: Paul McTaggart
Income statement (US$ m) 6/16A 6/17E 6/18E 6/19E
Revenue 30,912 43,611 40,417 36,619 EBITDA 12,340 25,017 22,054 17,918 Depr. & amort. (8,871) (7,803) (7,596) (6,861) EBIT 3,469 17,214 14,458 11,057 Net interest exp. (1,024) (913) (706) (636) Associates 0 0 0 0 PBT 2,445 16,300 13,752 10,421 Income taxes 1,052 (5,927) (4,401) (3,335) Profit after tax 1,444 10,423 9,352 7,086 Minorities (178) (706) (634) (298) Preferred dividends - - - - Associates & other 0 0 0 0 Net profit 1,266 9,717 8,718 6,788 Other NPAT adjustments (7,651) (40) 0 0 Reported net income (6,385) 9,677 8,718 6,788
Cash flow (US$ m) 6/16A 6/17E 6/18E 6/19E
EBIT 3,469 17,214 14,458 11,057 Net interest (702) (457) 0 0 Cash taxes paid (2,286) (3,682) (3,000) (2,273) Change in working capital - - - - Other cash and non-cash items 10,144 5,412 5,543 5,464 Cash flow from operations 10,625 18,487 17,001 14,248 CAPEX (7,022) (4,600) (5,400) (6,547) Free cashflow to the firm 9,835 17,491 15,023 11,202 Acquisitions (237) (243) (150) (150) Divestments 273 681 0 0 Other investment/(outflows) (259) (707) (900) (784) Cash flow from investments (7,245) (4,869) (6,450) (7,481) Net share issue/(repurchase) 0 0 0 (3,000) Dividends paid (4,217) (3,227) (5,556) (4,002) Issuance (retirement) of debt 4,451 (1,000) 0 1,000 Cashflow from financing 284 (4,303) (5,556) (6,002) Changes in net cash/debt (1,685) 11,709 4,996 (234) Net debt at start 24,417 26,102 14,393 9,397 Change in net debt 1,685 (11,709) (4,996) 234 Net debt at end 26,102 14,393 9,397 9,632
Balance sheet (US$ m) 6/16A 6/17E 6/18E 6/19E
Assets Total current assets 17,714 27,165 32,161 32,926 Total assets 118,953 123,754 126,766 127,402 Liabilities Total current liabilities 12,340 11,999 11,999 11,999 Total liabilities 58,882 57,110 57,110 58,110 Total equity and liabilities 118,953 123,754 126,766 127,402
Per share 6/16A 6/17E 6/18E 6/19E
No. of shares (wtd avg.) (mn) 5,322 5,362 5,362 5,278 CS EPS (adj.) (US$) 0.24 1.81 1.63 1.29 Dividend (US$) 0.30 1.01 0.82 0.65 Free cash flow per share (US$) 1.85 3.26 2.80 2.12
Key ratios and valuation 6/16A 6/17E 6/18E 6/19E
Growth/Margin (%) Sales growth (%) (30.7) 41.1 (7.3) (9.4) EBIT growth (%) (70.8) 396.2 (16.0) (23.5) Net income growth (%) (80.1) 667.5 (10.3) (22.1) EPS growth (%) (80.1) 661.8 (10.3) (20.9) EBITDA margin (%) 39.9 57.4 54.6 48.9 EBIT margin (%) 11.2 39.5 35.8 30.2 Pretax profit margin (%) 7.9 37.4 34.0 28.5 Net income margin (%) 4.1 22.3 21.6 18.5
Valuation 6/16A 6/17E 6/18E 6/19E
EV/Sales (x) 4.0 2.5 2.6 2.9 EV/EBITDA (x) 9.9 4.4 4.8 5.9 EV/EBIT (x) 35.3 6.4 7.3 9.6 Dividend yield (%) 1.80 6.07 4.92 3.89 P/E (x) 69.9 9.2 10.2 12.9
Credit ratios (%) 6/16A 6/17E 6/18E 6/19E
Net debt/equity (%) 43.5 21.6 13.5 13.9 Net debt to EBITDA (x) 2.1 0.6 0.4 0.5 Interest coverage ratio (x) 3.4 18.8 20.5 17.4
Company Background
BHP Billiton Limited is a diversified natural resources company. It operates nine units: petroleum, aluminium, base metals (incl. uranium), diamonds and specialty products, stainless steel materials, iron ore, manganese, metallurgical & energy coal.
Blue/Grey Sky Scenario
Our Blue Sky Scenario (p) 2000.00
China reverses its declining steel demand trend and stimulates the economy significantly, resulting in much tighter iron ore markets and prices in the $85/t range, while oil and copper markets also tighten on higher China demand resulting in a valuation of GBp2000/shr.
Our Grey Sky Scenario (p) 400.00
China steel demand declines significantly as the economy slows and urbanisation rate declines. While still generating positive bottom of the cycle earnings, we think iron ore could trade as low as $35/tonne, petroleum and copper prices also fall to $30/bbl and $1.75/lb resulting in a valuation of GBp400/shr.
Share price performance
The price relative chart measures performance against the FTSE ALL SHARE
INDEX which closed at 4014.7 on 01/03/17
On 01/03/17 the spot exchange rate was £.86/Eu 1.- Eu.95/US$1
Source: FTI, Company data, Thomson Reuters, Credit Suisse Securities (EUROPE) LTD. Estimates

3 March 2017
Global Mining 2020 Capex 15
Europe/United Kingdom Diversified Metals & Mining
Glencore (GLEN.L) Rating OUTPERFORM [V] Price (01 Mar 17, p) 337.75 Target price (p) 400.00 Market Cap (£ m) 44,797.5 Enterprise value (£ m) 55,743.2 Target price is for 12 months.
[V] = Stock Considered Volatile (see Disclosure Appendix)
Research Analysts
Liam Fitzpatrick
44 20 7883 8350
Michael Shillaker
34 91 791 58 78
James Gurry
44 20 7883 7083
Conor Rowley
44 20 7883 9156
Benefiting from latent capacity
■ Capex outlook: At the recent results, the company guided capex would
remain ~US$4bn over the next 3-5 years of which sustaining would account
for ~US$3bn. In our view the company should be able to maintain this level
(US$4-4.5bn) through 2017-19 without the need to approve any major
projects benefiting from latent capacity growth potential in copper and zinc.
This should underpin growth of ~3% pa 2016-20 after which point, assuming
all suspended volumes return, we estimate group production volumes will
decline at a rate of 3% pa or higher, assuming no capex is sunk beyond
sustaining capex. To keep group volumes flat post 2020, we estimate
Glencore (GLEN) would need to spend $4.5-5.0bn pa. To grow volumes at
2% pa from 2020, and assuming that incremental volume growth is primarily
in copper, this would mean that group capex could climb to ~US$6bn.
■ Investment overview: As we recently outlined (Glencore - Diversification
and copper exposure to the fore), we favour GLEN's diversified business mix,
we see copper moving from a headwind in 2016 to a tailwind in 2017, and the
company's latent capacity growth is under-priced by the market, in our view.
The company delivered a strong cost and cash flow performance in 2016 and
gave consistent guidance for 2017. We expect the balance sheet to move to
an 'under-geared' position (sub 1x net debt : EBITDA by mid-2017 or H217)
and this should open the door for higher dividend payments. Based on our
medium-long term price assumptions, we believe the business can sustain a
dividend payout of over US$2.5bn pa (>4.5% dividend yield) based on a 40%
payout of industrial cash flows.
■ Catalysts and risks: Base metal and thermal coal prices, potential M&A.
■ Valuation: Glencore has no iron ore exposure and therefore we have left our
estimates unchanged. Our £4/sh TP is based on a target EV/EBITDA multiple
of 6x 2017E and 6.5x 2018E (higher due to lower price assumptions). Our
Blue Sky valuation is £5 based on a rerating to 2013/14 multiples of ~7x
industrial EV/EBITDA.
Share price performance
The price relative chart measures performance against the
FTSE 100 IDX which closed at 7382.9 on 01/03/17
On 01/03/17 the spot exchange rate was £.86/Eu 1.-
Eu.95/US$1
Performance 1M 3M 12M Absolute (%) 2.9 20.9 148.1 Relative (%) -1.1 11.2 128.0
Financial and valuation metrics
Year 12/16A 12/17E 12/18E 12/19E Revenue (US$ m) 177,351.0 209,082.9 221,137.3 233,014.0 EBITDA (US$ m) 10,268.0 13,955.5 12,374.6 13,918.3 Pre-tax profit adjusted (US$ m) 2,397.00 6,398.62 4,256.93 5,429.00 CS EPS (adj.) (US$) 0.17 0.27 0.17 0.22 Prev. EPS (US$) - - - - ROIC (%) 5.4 9.3 7.0 9.5 P/E (adj.) (x) 24.7 15.2 24.3 18.6 P/E rel. (%) 137.9 102.9 178.5 149.4 EV/EBITDA (x) 7.0 4.9 5.4 4.5
Dividend (12/17E, US$) 0.18 Net debt/equity (12/17E,%) 30.5 Dividend yield (12/17E,%) 4.3 Net debt (12/17E, US$ m) 13,876.0 BV/share (12/17E, US$) 3.2 IC (12/17E, US$ m) 59,352.2 Free float (%) 65.0 EV/IC (12/17E, (x) 1.2 Source: Company data, Thomson Reuters, Credit Suisse estimates

3 March 2017
Global Mining 2020 Capex 16
Glencore (GLEN.L)
Price (01 Mar 2017): 337.75p; Rating: OUTPERFORM [V]; Target Price: 400.00p; Analyst: Liam Fitzpatrick
Income statement (US$ m) 12/16A 12/17E 12/18E 12/19E
Revenue 177,351 209,083 221,137 233,014 EBITDA 10,268 13,955 12,375 13,918 Depr. & amort. (6,338) (6,225) (6,683) (7,039) EBIT 3,930 7,730 5,691 6,880 Net interest exp. (1,533) (1,332) (1,434) (1,451) Associates 0 0 0 0 PBT 2,397 6,399 4,257 5,429 Income taxes (362) (1,813) (1,328) (1,602) Profit after tax 2,035 4,586 2,929 3,827 Minorities 422 (293) (183) (239) Preferred dividends - - - - Associates & other (264) (405) (315) (419) Net profit 2,193 3,888 2,431 3,170 Other NPAT adjustments 0 0 0 0 Reported net income 2,193 3,888 2,431 3,170
Cash flow (US$ m) 12/16A 12/17E 12/18E 12/19E
EBIT 3,930 7,730 5,691 6,880 Net interest (1,533) (1,332) (1,434) (1,451) Cash taxes paid - - - - Change in working capital (1,201) (344) 19 (1,878) Other cash and non-cash items 3,622 2,451 3,664 3,436 Cash flow from operations 4,818 8,506 7,940 6,987 CAPEX (3,048) (3,617) (3,528) (3,536) Free cashflow to the firm 8,430 5,308 4,907 4,137 Acquisitions 0 (534) 0 0 Divestments 5,839 0 0 0 Other investment/(outflows) 821 952 495 685 Cash flow from investments 3,612 (3,198) (3,033) (2,851) Net share issue/(repurchase) 3 0 0 0 Dividends paid 0 (1,501) (2,684) (2,654) Issuance (retirement) of debt (7,839) 0 0 0 Cashflow from financing (8,629) (1,501) (2,684) (2,654) Changes in net cash/debt 10,619 3,755 2,011 4,564 Net debt at start 28,250 17,631 13,876 11,865 Change in net debt (10,619) (3,755) (2,011) (4,564) Net debt at end 17,631 13,876 11,865 7,301
Balance sheet (US$ m) 12/16A 12/17E 12/18E 12/19E
Assets Total current assets 43,412 47,185 49,159 57,511 Total assets 124,600 126,298 125,117 129,966 Liabilities Total current liabilities 36,206 36,206 36,206 41,416 Total liabilities 80,819 80,822 80,816 86,121 Total equity and liabilities 124,600 126,298 125,117 129,966
Per share 12/16A 12/17E 12/18E 12/19E
No. of shares (wtd avg.) (mn) 14,224 14,218 14,218 14,218 CS EPS (adj.) (US$) 0.17 0.27 0.17 0.22 Dividend (US$) 0.04 0.18 0.18 0.19 Free cash flow per share (US$) 0.59 0.37 0.35 0.29
Key ratios and valuation 12/16A 12/17E 12/18E 12/19E
Growth/Margin (%) Sales growth (%) 2.7 17.9 5.8 5.4 EBIT growth (%) 80.9 96.7 (26.4) 20.9 Net income growth (%) 63.4 77.3 (37.5) 30.4 EPS growth (%) 67.0 62.5 (37.5) 30.4 EBITDA margin (%) 5.8 6.7 5.6 6.0 EBIT margin (%) 2.2 3.7 2.6 3.0 Pretax profit margin (%) 1.4 3.1 1.9 2.3 Net income margin (%) 1.2 1.9 1.1 1.4
Valuation 12/16A 12/17E 12/18E 12/19E
EV/Sales (x) 0.4 0.3 0.3 0.3 EV/EBITDA (x) 7.0 4.9 5.4 4.5 EV/EBIT (x) 18.4 8.9 11.8 9.1 Dividend yield (%) 0.84 4.28 4.26 4.51 P/E (x) 24.7 15.2 24.3 18.6
Credit ratios (%) 12/16A 12/17E 12/18E 12/19E
Net debt/equity (%) 40.3 30.5 26.8 16.7 Net debt to EBITDA (x) 1.7 1.0 1.0 0.5 Interest coverage ratio (x) 2.6 5.8 4.0 4.7
Company Background
Glencore is a leading commodities producer and marketer. It produces, sources, processes, refines, transports, stores, finances and supplies commodities that industries around the world need.
Blue/Grey Sky Scenario
Our Blue Sky Scenario (p) 500.00
Our Blue Sky valuation of £5.0 assumes >300c copper and thermal coal remaining above $70/t.
Our Grey Sky Scenario (p) 220.00
Our Grey Sky valuation of £2 assumes ~200c copper and thermal coal falling back below $60/t, but we do not assume a return to the extreme balance sheet stress as seen in late 2015/early 2016.
Share price performance
The price relative chart measures performance against the FTSE 100 IDX
which closed at 7382.9 on 01/03/17
On 01/03/17 the spot exchange rate was £.86/Eu 1.- Eu.95/US$1
Source: FTI, Company data, Thomson Reuters, Credit Suisse Securities (EUROPE) LTD. Estimates
3 March 2017
Global Mining 2020 Capex 17
Asia Pacific/Australia Diversified Metals & Mining
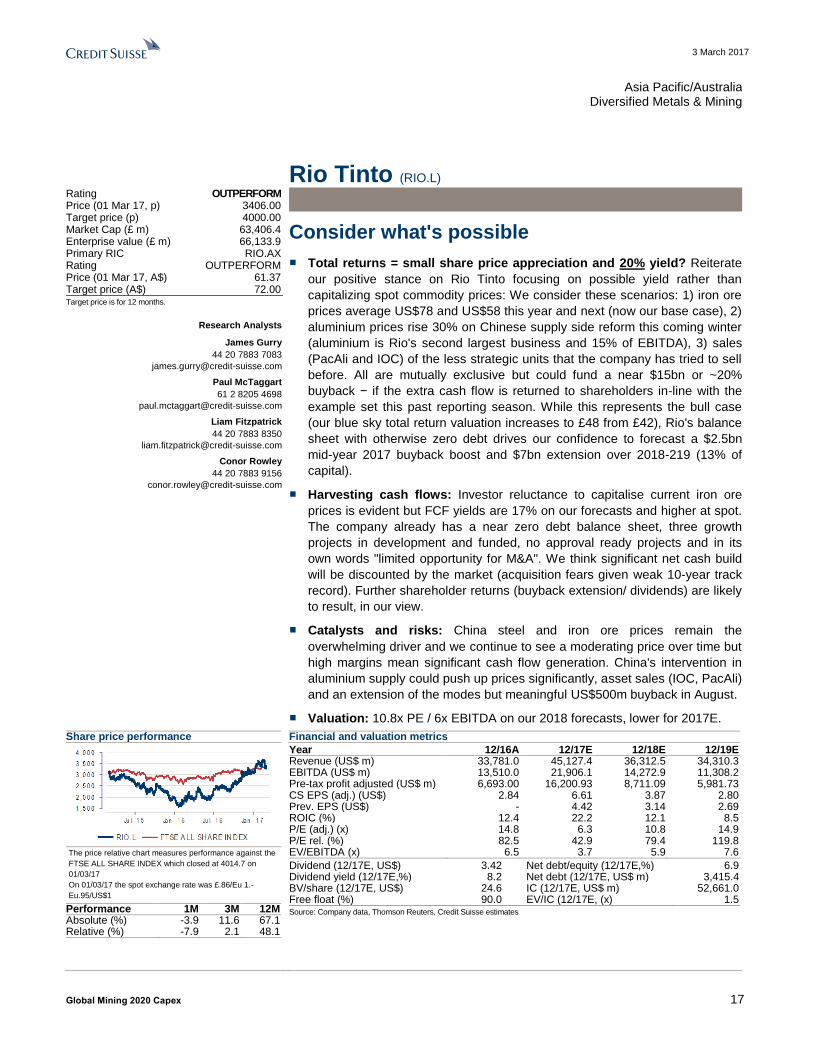
Rio Tinto (RIO.L) Rating OUTPERFORM Price (01 Mar 17, p) 3406.00 Target price (p) 4000.00 Market Cap (£ m) 63,406.4 Enterprise value (£ m) 66,133.9 Primary RIC RIO.AX Rating OUTPERFORM Price (01 Mar 17, A$) 61.37 Target price (A$) 72.00 Target price is for 12 months.
Research Analysts
James Gurry
44 20 7883 7083
Paul McTaggart
61 2 8205 4698
Liam Fitzpatrick
44 20 7883 8350
Conor Rowley
44 20 7883 9156
Consider what's possible
■ Total returns = small share price appreciation and 20% yield? Reiterate
our positive stance on Rio Tinto focusing on possible yield rather than
capitalizing spot commodity prices: We consider these scenarios: 1) iron ore
prices average US$78 and US$58 this year and next (now our base case), 2)
aluminium prices rise 30% on Chinese supply side reform this coming winter
(aluminium is Rio's second largest business and 15% of EBITDA), 3) sales
(PacAli and IOC) of the less strategic units that the company has tried to sell
before. All are mutually exclusive but could fund a near $15bn or ~20%
buyback − if the extra cash flow is returned to shareholders in-line with the
example set this past reporting season. While this represents the bull case
(our blue sky total return valuation increases to £48 from £42), Rio's balance
sheet with otherwise zero debt drives our confidence to forecast a $2.5bn
mid-year 2017 buyback boost and $7bn extension over 2018-219 (13% of
capital).
■ Harvesting cash flows: Investor reluctance to capitalise current iron ore
prices is evident but FCF yields are 17% on our forecasts and higher at spot.
The company already has a near zero debt balance sheet, three growth
projects in development and funded, no approval ready projects and in its
own words "limited opportunity for M&A". We think significant net cash build
will be discounted by the market (acquisition fears given weak 10-year track
record). Further shareholder returns (buyback extension/ dividends) are likely
to result, in our view.
■ Catalysts and risks: China steel and iron ore prices remain the
overwhelming driver and we continue to see a moderating price over time but
high margins mean significant cash flow generation. China's intervention in
aluminium supply could push up prices significantly, asset sales (IOC, PacAli)
and an extension of the modes but meaningful US$500m buyback in August.
■ Valuation: 10.8x PE / 6x EBITDA on our 2018 forecasts, lower for 2017E.
Share price performance
The price relative chart measures performance against the
FTSE ALL SHARE INDEX which closed at 4014.7 on
01/03/17
On 01/03/17 the spot exchange rate was £.86/Eu 1.-
Eu.95/US$1
Performance 1M 3M 12M Absolute (%) -3.9 11.6 67.1 Relative (%) -7.9 2.1 48.1
Financial and valuation metrics
Year 12/16A 12/17E 12/18E 12/19E Revenue (US$ m) 33,781.0 45,127.4 36,312.5 34,310.3 EBITDA (US$ m) 13,510.0 21,906.1 14,272.9 11,308.2 Pre-tax profit adjusted (US$ m) 6,693.00 16,200.93 8,711.09 5,981.73 CS EPS (adj.) (US$) 2.84 6.61 3.87 2.80 Prev. EPS (US$) - 4.42 3.14 2.69 ROIC (%) 12.4 22.2 12.1 8.5 P/E (adj.) (x) 14.8 6.3 10.8 14.9 P/E rel. (%) 82.5 42.9 79.4 119.8 EV/EBITDA (x) 6.5 3.7 5.9 7.6
Dividend (12/17E, US$) 3.42 Net debt/equity (12/17E,%) 6.9 Dividend yield (12/17E,%) 8.2 Net debt (12/17E, US$ m) 3,415.4 BV/share (12/17E, US$) 24.6 IC (12/17E, US$ m) 52,661.0 Free float (%) 90.0 EV/IC (12/17E, (x) 1.5 Source: Company data, Thomson Reuters, Credit Suisse estimates

3 March 2017
Global Mining 2020 Capex 18
Rio Tinto (RIO.L)
Price (01 Mar 2017): 3406.00p; Rating: OUTPERFORM; Target Price: 4000.00p; Analyst: James Gurry
Income statement (US$ m) 12/16A 12/17E 12/18E 12/19E
Revenue 33,781 45,127 36,312 34,310 EBITDA 13,510 21,906 14,273 11,308 Depr. & amort. (4,794) (5,223) (5,109) (4,845) EBIT 8,716 16,683 9,164 6,463 Net interest exp. (1,022) (482) (453) (482) Associates - - - - PBT 6,693 16,201 8,711 5,982 Income taxes (1,412) (4,860) (2,613) (1,795) Profit after tax 5,281 11,341 6,098 4,187 Minorities -0 (307) (58) (44) Preferred dividends - - - - Associates & other (181) 656 513 411 Net profit 5,100 11,689 6,553 4,554 Other NPAT adjustments (483) 0 0 0 Reported net income 4,617 11,689 6,553 4,554
Cash flow (US$ m) 12/16A 12/17E 12/18E 12/19E
EBIT 8,716 16,683 9,164 6,463 Net interest (1,294) (482) (453) (482) Cash taxes paid - - - - Change in working capital (341) 318 1 3 Other cash and non-cash items 1,384 1,018 3,009 3,462 Cash flow from operations 8,465 17,538 11,722 9,446 CAPEX (3,012) (5,000) (5,500) (5,500) Free cashflow to the firm 6,465 15,538 9,722 7,366 Acquisitions 0 0 0 0 Divestments 1,115 2,266 100 100 Other investment/(outflows) (207) 0 0 0 Cash flow from investments (2,104) (2,734) (5,400) (5,400) Net share issue/(repurchase) 101 (3,000) (5,000) (2,000) Dividends paid (2,725) (5,620) (4,632) (3,167) Issuance (retirement) of debt - - - - Cashflow from financing (7,491) (8,620) (9,632) (5,167) Changes in net cash/debt 4,671 6,172 (3,311) (1,121) Net debt at start 14,258 9,587 3,415 6,726 Change in net debt (4,671) (6,172) 3,311 1,121 Net debt at end 9,587 3,415 6,726 7,847
Balance sheet (US$ m) 12/16A 12/17E 12/18E 12/19E
Assets Total current assets 15,086 19,944 16,659 15,588 Total assets 89,263 91,748 88,755 88,239 Liabilities Total current liabilities 9,362 8,367 8,394 8,447 Total liabilities 43,533 42,538 42,565 42,618 Total equity and liabilities 89,263 91,783 88,790 88,274
Per share 12/16A 12/17E 12/18E 12/19E
No. of shares (wtd avg.) (mn) 1,797 1,768 1,692 1,624 CS EPS (adj.) (US$) 2.84 6.61 3.87 2.80 Dividend (US$) 1.70 3.42 2.27 1.65 Free cash flow per share (US$) 3.60 8.79 5.75 4.54
Key ratios and valuation 12/16A 12/17E 12/18E 12/19E
Growth/Margin (%) Sales growth (%) (3.0) 33.6 (19.5) (5.5) EBIT growth (%) 9.3 91.4 (45.1) (29.5) Net income growth (%) (5.1) 129.2 (43.9) (30.5) EPS growth (%) (3.6) 132.9 (41.4) (27.6) EBITDA margin (%) 40.0 48.5 39.3 33.0 EBIT margin (%) 25.8 37.0 25.2 18.8 Pretax profit margin (%) 19.8 35.9 24.0 17.4 Net income margin (%) 15.1 25.9 18.0 13.3
Valuation 12/16A 12/17E 12/18E 12/19E
EV/Sales (x) 2.6 1.8 2.3 2.5 EV/EBITDA (x) 6.5 3.7 5.9 7.6 EV/EBIT (x) 10.0 4.9 9.2 13.3 Dividend yield (%) 4.06 8.16 5.41 3.94 P/E (x) 14.8 6.3 10.8 14.9
Credit ratios (%) 12/16A 12/17E 12/18E 12/19E
Net debt/equity (%) 21.0 6.9 14.6 17.2 Net debt to EBITDA (x) 0.7 0.2 0.5 0.7 Interest coverage ratio (x) 8.5 34.6 20.2 13.4
Company Background
Rio Tinto Limited is engaged in minerals exploration, development, production and processing. The Company’s product groups include aluminum, copper, diamonds and minerals, energy, and iron ore.
Blue/Grey Sky Scenario
Our Blue Sky Scenario (p) (from 4200.00) 4800.00
Our Blue Sky valuation reflects the scenario that iron ore prices remain elevated through 2018 (at above $65/tonne), Chinese intervenes in the aluminium market causing a 30% increase in prices for 12 months, and $3bn of non-core assets are sold with 100% of proceeds passed to shareholders (via buybacks / dividends)
Our Grey Sky Scenario (p) 1450.00
China hits a hard landing and iron ore prices fall below $30/tonne.
Share price performance
The price relative chart measures performance against the FTSE ALL SHARE
INDEX which closed at 4014.7 on 01/03/17
On 01/03/17 the spot exchange rate was £.86/Eu 1.- Eu.95/US$1
Source: FTI, Company data, Thomson Reuters, Credit Suisse Securities (EUROPE) LTD. Estimates
3 March 2017
Global Mining 2020 Capex 19
Americas/Canada Diversified Metals & Mining
Teck Resources Ltd (TECKb.TO) Rating OUTPERFORM [V] Price (01-Mar-17, C$) 28.08 Target price (C$) 43.00 52-week price range (C$) 35.02 - 9.08 Market cap (C$ m) 15,936.71 Target price is for 12 months.
[V] = Stock Considered Volatile (see Disclosure Appendix)
Research Analysts
Ralph M. Profiti, CFA
416 352 4563
Yan Truong, CFA
416 352 4584
Strong cash flows & diversification pave the way
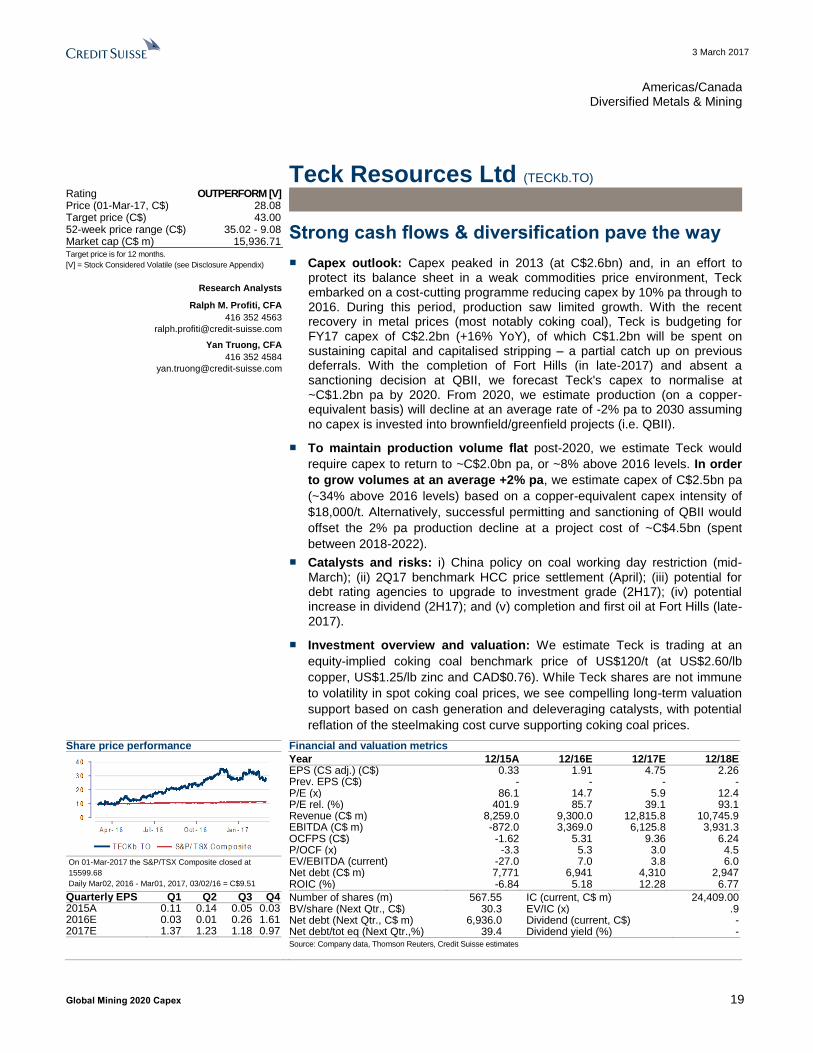
■ Capex outlook: Capex peaked in 2013 (at C$2.6bn) and, in an effort to protect its balance sheet in a weak commodities price environment, Teck embarked on a cost-cutting programme reducing capex by 10% pa through to 2016. During this period, production saw limited growth. With the recent recovery in metal prices (most notably coking coal), Teck is budgeting for FY17 capex of C$2.2bn (+16% YoY), of which C$1.2bn will be spent on sustaining capital and capitalised stripping – a partial catch up on previous deferrals. With the completion of Fort Hills (in late-2017) and absent a sanctioning decision at QBII, we forecast Teck's capex to normalise at ~C$1.2bn pa by 2020. From 2020, we estimate production (on a copper-equivalent basis) will decline at an average rate of -2% pa to 2030 assuming
no capex is invested into brownfield/greenfield projects (i.e. QBII).
■ To maintain production volume flat post-2020, we estimate Teck would
require capex to return to ~C$2.0bn pa, or ~8% above 2016 levels. In order
to grow volumes at an average +2% pa, we estimate capex of C$2.5bn pa
(~34% above 2016 levels) based on a copper-equivalent capex intensity of
$18,000/t. Alternatively, successful permitting and sanctioning of QBII would
offset the 2% pa production decline at a project cost of ~C$4.5bn (spent
between 2018-2022).
■ Catalysts and risks: i) China policy on coal working day restriction (mid-
March); (ii) 2Q17 benchmark HCC price settlement (April); (iii) potential for debt rating agencies to upgrade to investment grade (2H17); (iv) potential increase in dividend (2H17); and (v) completion and first oil at Fort Hills (late-
2017).
■ Investment overview and valuation: We estimate Teck is trading at an
equity-implied coking coal benchmark price of US$120/t (at US$2.60/lb
copper, US$1.25/lb zinc and CAD$0.76). While Teck shares are not immune
to volatility in spot coking coal prices, we see compelling long-term valuation
support based on cash generation and deleveraging catalysts, with potential
reflation of the steelmaking cost curve supporting coking coal prices.
Share price performance
On 01-Mar-2017 the S&P/TSX Composite closed at
15599.68
Daily Mar02, 2016 - Mar01, 2017, 03/02/16 = C$9.51
Quarterly EPS Q1 Q2 Q3 Q4 2015A 0.11 0.14 0.05 0.03 2016E 0.03 0.01 0.26 1.61 2017E 1.37 1.23 1.18 0.97
Financial and valuation metrics
Year 12/15A 12/16E 12/17E 12/18E EPS (CS adj.) (C$) 0.33 1.91 4.75 2.26 Prev. EPS (C$) - - - - P/E (x) 86.1 14.7 5.9 12.4 P/E rel. (%) 401.9 85.7 39.1 93.1 Revenue (C$ m) 8,259.0 9,300.0 12,815.8 10,745.9 EBITDA (C$ m) -872.0 3,369.0 6,125.8 3,931.3 OCFPS (C$) -1.62 5.31 9.36 6.24 P/OCF (x) -3.3 5.3 3.0 4.5 EV/EBITDA (current) -27.0 7.0 3.8 6.0 Net debt (C$ m) 7,771 6,941 4,310 2,947 ROIC (%) -6.84 5.18 12.28 6.77
Number of shares (m) 567.55 IC (current, C$ m) 24,409.00 BV/share (Next Qtr., C$) 30.3 EV/IC (x) .9 Net debt (Next Qtr., C$ m) 6,936.0 Dividend (current, C$) - Net debt/tot eq (Next Qtr.,%) 39.4 Dividend yield (%) - Source: Company data, Thomson Reuters, Credit Suisse estimates

3 March 2017
Global Mining 2020 Capex 20
Teck Resources Ltd (TECKb.TO)
Price (23 Feb 2017): C$27.29; Rating: OUTPERFORM [V]; Target Price: C$43.00; Analyst: Ralph Profiti
Income Statement 12/15A 12/16E 12/17E 12/18E
Revenue (C$ m) 8,259.0 9,300.0 12,815.8 10,745.9 EBITDA (872) 3,369 6,126 3,931 Depr. & amort. (1,366) (1,385) (1,332) (1,301) EBIT (C$) (2,238) 1,984 4,794 2,630 Net interest exp (314) (341) (440) (548) Associates (10) (10) (10) (10) Other adj. 0 0 0 0 PBT (C$) (2,562) 1,633 4,344 2,072 Income taxes 836 (587) (1,607) (767) Profit after tax (1,726) 1,046 2,737 1,305 Minorities 10 (10) 1 (3) Preferred dividends - - - - Associates & other 1,904 63 0 0 Net profit (C$) 188 1,099 2,737 1,303 Other NPAT adjustments (2,662) (63) 0 0 Reported net income (2,474) 1,036 2,737 1,303
Cash Flow 12/15A 12/16E 12/17E 12/18E
EBIT (2,238) 1,984 4,794 2,630 Net interest (314) (341) (440) (548) Cash taxes paid - - - - Change in working capital 180 (360) 0 0 Other cash & non-cash items 1,437 1,778 1,041 1,514 Cash flow from operations (935) 3,061 5,395 3,596 CAPEX (2,244) (1,912) (2,314) (1,618) Free cashflow to the firm (3,179) 1,149 3,080 1,978 Aquisitions - - - - Divestments 810 0 59 0 Other investment/(outflows) 330 74 (0) 0 Cash flow from investments (1,104) (1,838) (2,256) (1,618) Net share issue(/repurchase) 0 8 0 0 Dividends paid (395) (44) (58) (58) Issuance (retirement) of debt (448) (993) (64) (29) Other 1,217 700 (386) (529) Cashflow from financing activities 374 (329) (507) (616) Effect of exchange rates 304 (64) 0 0 Changes in Net Cash/Debt (1,361) 830 2,631 1,362 Net debt at start 6,410 7,771 6,941 4,310 Change in net debt 1,361 (830) (2,631) (1,362)
Net debt at end 7,771 6,941 4,310 2,947
Balance Sheet (C$) 12/15A 12/16E 12/17E 12/18E
Assets Cash & cash equivalents 1,888 1,402 3,969 5,303 Account receivables 1,298 1,682 1,682 1,682 Inventory 1,620 1,673 1,673 1,673 Other current assets 0 0 0 0 Total current assets 4,806 4,757 7,324 8,658 Total fixed assets 26,791 27,595 28,519 28,836 Intangible assets and goodwill 1,127 1,127 1,127 1,127 Investment securities - - - - Other assets 1,965 2,145 2,145 2,145 Total assets 34,689 35,624 39,115 40,766 Liabilities Accounts payables 1,673 2,101 2,101 2,101 Short-term debt 25 0 0 0 Other short term liabilities 28 99 99 99 Total current liabilities 1,726 2,200 2,200 2,200 Long-term debt 9,606 8,244 8,180 8,151 Other liabilities 6,719 7,584 8,460 8,892 Total liabilities 18,051 18,028 18,840 19,243
Shareholder equity 16,408 17,437 20,116 21,364 Minority interests 230 159 159 159 Total liabilities and equity 34,689 35,624 39,115 40,766 Net debt 7,771 6,941 4,310 2,947
Per share 12/15A 12/16E 12/17E 12/18E
No. of shares (wtd avg) 576 576 576 576 CS adj. EPS 0.33 1.91 4.75 2.26 Prev. EPS (C$) - - - - Dividend (C$) 0.30 0.10 0.10 0.10 Dividend payout ratio 91.95 5.25 2.11 4.42 Free cash flow per share (5.52) 1.99 5.34 3.43
Earnings 12/15A 12/16E 12/17E 12/18E
Sales growth (%) (4.0) 12.6 37.8 (16.2) EBIT growth (%) (326.7) 188.7 141.6 (45.1) Net profit growth (%) (58.4) 484.5 149.1 (52.4) EPS growth (%) (58.4) 484.3 149.1 (52.4) EBITDA margin (%) (10.6) 36.2 47.8 36.6 EBIT margin (%) (27.1) 21.3 37.4 24.5 Pretax margin (%) (31.0) 17.6 33.9 19.3 Net margin (%) 2.3 11.8 21.4 12.1
Valuation 12/15A 12/16E 12/17E 12/18E
EV/Sales (x) 2.82 2.41 1.54 1.72 EV/EBITDA (x) (26.5) 6.9 3.8 5.9 EV/EBIT (x) (10.4) 11.3 4.1 7.0 P/E (x) 83.6 14.3 5.7 12.1 Price to book (x) 1.0 0.9 0.8 0.7 Asset turnover 0.2 0.3 0.3 0.3
Returns 12/15A 12/16E 12/17E 12/18E
ROE stated-return on (%) (14.1) 6.1 14.6 6.3 ROIC (%) (0.1) 0.1 0.1 0.1 Interest burden (%) 1.14 0.82 0.91 0.79 Tax rate (%) 25.3 35.9 37.0 37.0 Financial leverage (%) 0.59 0.48 0.41 0.39
Gearing 12/15A 12/16E 12/17E 12/18E
Net debt/equity (%) 46.7 39.4 21.3 13.7 Net Debt to EBITDA (x) Net
Cash 2.1 0.7 0.7
Interest coverage ratio (X) (7.1) 5.8 10.9 4.8
Quarterly EPS Q1 Q2 Q3 Q4
2015A 0.11 0.14 0.05 0.03 2016E 0.03 0.01 0.26 1.61 2017E 1.37 1.23 1.18 0.97
Share price performance
On 23-Feb-2017 the S&P/TSX Composite closed at 15781.2
Daily Feb25, 2016 - Feb23, 2017, 02/25/16 = C$7.67
Source: Company data, Thomson Reuters, Credit Suisse estimates

3 March 2017
Global Mining 2020 Capex 21
Americas/Brazil Diversified Metals & Mining
Vale (VALE) Rating NEUTRAL [V] Price (01-Mar-17, US$) 10.69 Target price (US$) 9.00 52-week price range (US$) 11.52 - 3.54 Market cap (US$ m) 55,941.21 Enterprise value (US$ m) 73,932.09 Target price is for 12 months.
[V] = Stock Considered Volatile (see Disclosure Appendix)
Research Analysts
Ivano Westin
55 11 3701 6318
Renan Criscio
55 11 3701 6210
Rafael Cunha
55 11 3701 6320
Capex on a downward path ■ Summary: The combination of lower capex, divestment of non-core assets,
cost-cutting, and current momentum for commodities prices recently contributed to an improvement in Vale's balance sheet. Net debt to EBITDA dropped to 2.1x in 4Q16 from 2.9x in 3Q16 and 3.6x in 4Q15, while the gross debt-to-EBITDA ratio moved from 4.1x in 4Q15 and 3.6x in 3Q16 to 2.4x. The ramp-up of S11D should provide additional support for deleveraging, all else equal. We estimate ND/EBITDA at 1.2x YE 2017.
■ Capex on a downward path: Vale is the only major in this report for which we expect 2020 capex to be materially below 2015-16 due to the growth expected from S11D over the next 3-4 years and capex close to conclusion. In 2020 we forecast capex of $3.6bn compared with $8.4/$5.5bn in 2015/16 and we estimate $3.6-4.0bn should be sufficient to keep volumes stable post 2020. To grow volumes at 2% pa post 2020 based on our methodology of copper-focused growth at capex intensity of $16,000/t could mean capex climbing back to the $5.5-6.0bn range, a scenario which we estimate unlikely to materialize, given our base case of no increase in copper asset base.
■ Iron ore outlook: Vale expects steel demand in 2017 to be better than 2016
whereas seaborne iron ore supply should be lower and is seeing a restocking movement from mills ahead of increasing demand in the spring. High inventories at the port are not a major concern for the company as the bulk of the ore is low quality, for which demand is lower. For 2018, Vale reinforced that it will be responsible for ~50% of the additional seaborne supply volume and will always operate with the end-goal of margin optimisation.
■ Dividends: Reduction of net debt to the USD15bn target remains the company's primary focus, but we expect dividends to be at robust levels in CY17 (CSe ~ 5% dividend yield).
■ Vale's agenda – short to mid-term: Vale mentioned the current agenda is not completed and still needs to conclude: (i) ramp-up of all projects, especially S11D, (ii) leverage reduction, (iii) shareholder restructuring at Vale, and (iv) cost reduction. Once all these projects are concluded, Vale might consider new projects that could be explored. Vale intends to increase cash return to shareholders at the right time.
Share price performance
On 01-Mar-2017 the S&P 500 INDEX closed at 2395.96
Daily Mar02, 2016 - Mar01, 2017, 03/02/16 = US$3.63
Quarterly EPS Q1 Q2 Q3 Q4 2016A - - - - 2017E - - - - 2018E - - - -
Financial and valuation metrics
Year 12/16A 12/17E 12/18E 12/19E Revenue (US$ m) 29,366.7 38,396.1 31,305.6 27,791.5 EBITDA (US$ m) 12,184.7 18,821.6 12,348.9 8,388.0 EBIT (US$ m) 8,153.7 14,262.4 7,844.2 3,823.7 Net Income (US$ m) 3,985.7 8,234.5 3,955.2 762.6 EPS (CS adj.) (US$) 0.77 1.60 0.77 0.15 Prev. EPS (US$) 0.71 1.00 0.68 0.37 Dividend yield (%) 1.0 5.3 3.6 1.4 P/E (x) 13.8 6.7 13.9 72.2 EV/EBITDA 6.6 3.9 5.5 8.0 P/B (x) 1.41 1.24 1.19 1.19 ROE stated-return on equity 11.0 19.7 8.7 1.6 ROIC (%) 9.32 16.51 9.53 4.70 Net debt (US$ m) 25,060 17,991 12,532 11,576 Net debt/EBITDA (12/16E, %) 61.1 38.4 25.5 23.4 Capex (US$ m) -5,469 -4,513 -4,504 -4,101
Source: Company data, Thomson Reuters, Credit Suisse estimates

3 March 2017
Global Mining 2020 Capex 22
Vale (VALE)
Price (01 Mar 2017): US$10.69; Rating: NEUTRAL [V]; Target Price: US$9.00; Analyst: Ivano Westin
Income Statement 12/16A 12/17E 12/18E 12/19E
Revenue (US$ m) 29,366.7 38,396.1 31,305.6 27,791.5 EBITDA 12,185 18,822 12,349 8,388 Depr. & amort. (3,834) (4,397) (4,359) (4,319) EBIT (US$) 8,154 14,262 7,844 3,824 Net interest exp (2,542) (2,866) (2,616) (2,548) Associates - - - - Other adj. 3,185 (584) (351) (365) PBT (US$) 8,797 10,812 4,878 911 Income taxes (2,151) (2,703) (1,219) (228) Profit after tax 6,646 8,109 3,658 683 Minorities 6 441 421 185 Preferred dividends - - - - Associates & other (2,666) (316) (124) (106) Net profit (US$) 3,986 8,234 3,955 763 Other NPAT adjustments 0 0 0 0 Reported net income 3,986 8,234 3,955 763
Cash Flow 12/16A 12/17E 12/18E 12/19E
EBIT 8,154 14,262 7,844 3,824 Net interest (2,542) (2,866) (2,616) (2,548) Cash taxes paid - - - - Change in working capital (1,991) (773) 704 203 Other cash & non-cash items 7,140 8,767 8,016 7,767 Cash flow from operations 10,761 19,390 13,948 9,245 CAPEX (5,469) (4,513) (4,504) (4,101) Free cashflow to the firm 5,292 14,877 9,444 5,145 Aquisitions - - - - Divestments - - - - Other investment/(outflows) 770 2,053 2,232 0 Cash flow from investments (4,699) (2,460) (2,272) (4,101) Net share issue(/repurchase) 0 0 0 0 Dividends paid (543) (2,895) (1,978) (763) Issuance (retirement) of debt (740) (353) 0 0 Other (4,577) (6,612) (4,240) (3,426) Cashflow from financing activities (5,860) (9,861) (6,217) (4,188) Effect of exchange rates - - - - Changes in Net Cash/Debt 202 7,069 5,459 956 Net debt at start 25,262 25,060 17,991 12,532 Change in net debt (202) (7,069) (5,459) (956)
Net debt at end 25,060 17,991 12,532 11,576
Balance Sheet (US$) 12/16A 12/17E 12/18E 12/19E
Assets Cash & cash equivalents 4,262 11,857 17,612 18,867 Account receivables 3,663 4,010 3,309 3,102 Inventory 3,349 4,385 4,282 4,436 Other current assets 10,930 10,930 10,930 10,930 Total current assets 22,204 31,182 36,133 37,335 Total fixed assets 55,419 55,535 56,077 56,253 Intangible assets and goodwill 6,871 6,871 6,474 6,080 Investment securities - - - - Other assets 14,157 11,626 9,125 8,774 Total assets 98,651 105,214 107,809 108,442 Liabilities Accounts payables 3,630 4,240 4,140 4,289 Short-term debt 1,660 1,660 1,660 1,660 Other short term liabilities 5,942 5,589 5,589 5,589 Total current liabilities 11,232 11,489 11,389 11,538 Long-term debt 27,662 28,188 28,484 28,783 Other liabilities 19,096 19,096 19,096 19,096 Total liabilities 57,990 58,772 58,969 59,416
Shareholder equity 39,042 44,381 46,359 46,359 Minority interests 1,982 2,423 2,845 3,029 Total liabilities and equity 99,014 105,577 108,172 108,805 Net debt 25,060 17,991 12,532 11,576
Per share 12/16A 12/17E 12/18E 12/19E
No. of shares (wtd avg) 5,153 5,153 5,153 5,153 CS adj. EPS 0.77 1.60 0.77 0.15 Prev. EPS (US$) 0.71 1.00 0.68 0.37 Dividend (US$) 0.11 0.56 0.38 0.15 Dividend payout ratio 13.62 35.16 50.00 100.00 Free cash flow per share 1.03 2.89 1.83 1.00
Earnings 12/16A 12/17E 12/18E 12/19E
Sales growth (%) 14.6 30.7 (18.5) (11.2) EBIT growth (%) 197.3 74.9 (45.0) (51.3) Net profit growth (%) 132.9 106.6 (52.0) (80.7) EPS growth (%) 132.9 106.6 (52.0) (80.7) EBITDA margin (%) 41.5 49.0 39.4 30.2 EBIT margin (%) 27.8 37.1 25.1 13.8 Pretax margin (%) 30.0 28.2 15.6 3.3 Net margin (%) 13.6 21.4 12.6 2.7
Valuation 12/16A 12/17E 12/18E 12/19E
EV/Sales (x) 2.76 1.93 2.19 2.43 EV/EBITDA (x) 6.6 3.9 5.5 8.0 EV/EBIT (x) 9.9 5.2 8.7 17.7 P/E (x) 13.8 6.7 13.9 72.2 Price to book (x) 1.4 1.2 1.2 1.2 Asset turnover 0.3 0.4 0.3 0.3
Returns 12/16A 12/17E 12/18E 12/19E
ROE stated-return on (%) 11.0 19.7 8.7 1.6 ROIC (%) 0.1 0.2 0.1 0.0 Interest burden (%) 1.08 0.76 0.62 0.24 Tax rate (%) 37.0 25.0 25.0 25.0 Financial leverage (%) 0.75 0.67 0.65 0.66
Gearing 12/16A 12/17E 12/18E 12/19E
Net debt/equity (%) 61.1 38.4 25.5 23.4 Net Debt to EBITDA (x) 2.1 1.0 1.0 1.4 Interest coverage ratio (X) 3.2 5.0 3.0 1.5
Quarterly EPS Q1 Q2 Q3 Q4
2016A - - - - 2017E - - - - 2018E - - - -
Share price performance
On 01-Mar-2017 the S&P 500 INDEX closed at 2395.96
Daily Mar02, 2016 - Mar01, 2017, 03/02/16 = US$3.63
Source: Company data, Thomson Reuters, Credit Suisse estimates

3 March 2017
Global Mining 2020 Capex 23
Companies Mentioned (Price as of 01-Mar-2017) Anglo American Plc (AAL.L, 1310.0p, NEUTRAL[V], TP 1400.0p) BHP Billiton (BLT.L, 1353.5p, NEUTRAL[V], TP 1380.0p) Fortescue Metals Group Ltd (FMG.AX, A$6.6) Glencore (GLEN.L, 337.75p, OUTPERFORM[V], TP 400.0p) Kumba Iron Ore (KIOJ.J, R222.15) Rio Tinto (RIO.L, 3406.0p, OUTPERFORM, TP 4000.0p) Teck Resources Ltd (TECKb.TO, C$28.08, OUTPERFORM[V], TP C$43.0) Vale (VALE.N, $10.69, NEUTRAL[V], TP $9.0)
Disclosure Appendix
Analyst Certification The analysts identified in this report each certify, with respect to the companies or securities that the individual analyzes, that (1) the views expressed in this report accurately reflect his or her personal views about all of the subject companies and securities and (2) no part of his or her compensation was, is or will be directly or indirectly related to the specific recommendations or views expressed in this report.
3-Year Price and Rating History for Anglo American Plc (AAL.L)
AAL.L Closing Price Target Price
Date (p) (p) Rating
31-Mar-14 1526.50 1800.00 O
15-May-14 1608.00 1850.00 N
23-Jun-14 1470.50 1800.00
10-Oct-14 1325.50 1800.00 O
15-Dec-14 1098.50 1600.00
09-Apr-15 1024.00 1400.00 N
23-Jun-15 996.70 1350.00
15-Jul-15 874.40 1350.00 O
27-Jul-15 772.60 1200.00
04-Sep-15 668.50 R
17-Sep-15 749.30 1200.00 O
22-Sep-15 648.10 900.00 N
09-Nov-15 516.00 750.00
15-Dec-15 271.10 320.00
17-Feb-16 468.05 470.00
07-Apr-16 506.10 500.00
30-Jun-16 726.90 630.00
18-Jul-16 832.00 700.00
29-Jul-16 830.50 870.00
09-Aug-16 879.00 890.00
19-Sep-16 860.90 950.00
14-Oct-16 1006.00 970.00
17-Nov-16 1126.50 1300.00
07-Dec-16 1252.00 1400.00
* Asterisk signifies initiation or assumption of coverage.
O U T PERFO RM
N EU T RA L
REST RICT ED

3 March 2017
Global Mining 2020 Capex 24
3-Year Price and Rating History for BHP Billiton (BLT.L)
BLT.L Closing Price Target Price
Date (p) (p) Rating
13-Mar-14 1668.56 2097.36 N
19-Aug-14 1831.69 1864.32 U
14-Oct-14 1572.09 1864.32 N
26-Nov-14 1496.58 1724.49
09-Apr-15 1354.43 1305.02 U
16-May-15 1429.00 1350.00
24-Jun-15 1373.50 1350.00 N
21-Sep-15 1076.00 1250.00
21-Oct-15 1096.50 1350.00
10-Nov-15 946.50 1100.00
15-Dec-15 686.90 900.00 O
14-May-16 822.80 1050.00
18-Jul-16 976.80 1150.00
20-Jul-16 926.40 1050.00
19-Sep-16 1022.50 1150.00
13-Oct-16 1184.00 1300.00
07-Dec-16 1362.00 1380.00 N
* Asterisk signifies initiation or assumption of coverage.
N EU T RA L
U N D ERPERFO RM
O U T PERFO RM
3-Year Price and Rating History for Glencore (GLEN.L)
GLEN.L Closing Price Target Price
Date (p) (p) Rating
05-Mar-14 330.51 397.97 O
31-Mar-14 307.23 378.07
14-Aug-14 358.82 378.07 N
15-Dec-14 278.58 338.27
02-Mar-15 299.02 338.27 O
09-Apr-15 287.38 318.38
23-Jun-15 274.90 310.00
11-Aug-15 191.00 235.00
22-Sep-15 106.35 175.00
10-Dec-15 88.90 R
16-Dec-15 84.35 130.00 O
02-Mar-16 135.40 155.00
06-Apr-16 140.10 R
09-Jun-16 145.70 155.00 O
30-Jun-16 152.85 160.00
18-Jul-16 186.40 200.00 N
09-Aug-16 195.95 210.00
19-Sep-16 196.50 220.00 O
14-Oct-16 228.25 250.00
10-Nov-16 285.00 300.00
02-Dec-16 277.90 320.00
07-Dec-16 296.75 340.00
30-Jan-17 321.55 380.00
24-Feb-17 327.50 400.00
* Asterisk signifies initiation or assumption of coverage.
O U T PERFO RM
N EU T RA L
REST RICT ED

3 March 2017
Global Mining 2020 Capex 25
3-Year Price and Rating History for Rio Tinto (RIO.L)
RIO.L Closing Price Target Price
Date (p) (p) Rating
31-Mar-14 3337.50 4200.00 O
23-Jun-14 3127.00 4000.00
24-Nov-14 2976.50 3600.00
15-Dec-14 2616.50 3400.00
12-Feb-15 3039.50 3400.00 N
09-Apr-15 2852.50 2800.00
21-Sep-15 2274.50 2500.00
04-Nov-15 2370.50 2400.00
15-Dec-15 1879.50 2100.00
18-Jul-16 2462.50 2300.00
03-Aug-16 2423.00 2100.00
19-Sep-16 2359.00 2300.00
14-Oct-16 2596.00 2750.00
07-Dec-16 3221.50 3600.00 O
08-Feb-17 3377.50 4000.00
* Asterisk signifies initiation or assumption of coverage.
O U T PERFO RM
N EU T RA L
3-Year Price and Rating History for Teck Resources Ltd (TECKb.TO)
TECKb.TO Closing Price Target Price
Date (C$) (C$) Rating
31-Mar-14 23.86 29.00 O
23-Jun-14 24.44 28.50
10-Oct-14 18.01 27.50
15-Dec-14 12.97 21.00
08-Apr-15 17.54 21.00 N
28-May-15 15.09 17.50
23-Jun-15 13.81 17.00
21-Sep-15 7.71 13.00
15-Dec-15 4.50 8.00
31-Mar-16 9.85 10.00
03-May-16 14.38 15.00
28-Jul-16 20.19 17.50
20-Sep-16 23.61 23.00
14-Oct-16 24.66 30.00 O
27-Oct-16 27.94 33.00
23-Nov-16 34.91 35.00
07-Dec-16 33.20 43.00
* Asterisk signifies initiation or assumption of coverage.
O U T PERFO RM
N EU T RA L

3 March 2017
Global Mining 2020 Capex 26
3-Year Price and Rating History for Vale (VALE.N)
VALE.N Closing Price Target Price
Date (US$) (US$) Rating
16-May-14 13.73 17.00 N
11-Jul-14 13.86 15.00
23-Sep-14 11.42 12.50
28-Oct-14 10.64 11.00 U
27-Nov-14 9.27 10.70
14-Dec-14 7.19 7.50
27-Feb-15 7.42 7.00
08-Apr-15 6.10 5.00
14-May-15 7.13 5.70
16-Sep-15 5.03 6.00
19-Oct-15 4.60 5.70
23-Nov-15 3.79 5.00
14-Dec-15 3.20 4.50
20-Apr-16 6.07 4.00
06-Dec-16 8.81 7.00 N
* Asterisk signifies initiation or assumption of coverage.
N EU T RA L
U N D ERPERFO RM
The analyst(s) responsible for preparing this research report received Compensation that is based upon various factors including Credit Suisse's total revenues, a portion of which are generated by Credit Suisse's investment banking activities
As of December 10, 2012 Analysts’ stock rating are defined as follows: Outperform (O) : The stock’s total return is expected to outperform the relevant benchmark* over the next 12 months. Neutral (N) : The stock’s total return is expected to be in line with the relevant benchmark* over the next 12 months. Underperform (U) : The stock’s total return is expected to underperform the relevant benchmark* over the next 12 months. *Relevant benchmark by region: As of 10th December 2012, Japanese ratings are based on a stock’s total return relative to the analyst's coverage universe which consists of all companies covered by the analyst within the relevant sector, with Outperforms representing the most attractive, Neutrals the less attractive, and Underperforms the least attractive investment opportunities. As of 2nd October 2012, U.S. and Canadian as well as European ra tings are based on a stock’s total return relative to the analyst's coverage universe which consists of all companies covered by the analyst within the relevant sector , with Outperforms representing the most attractive, Neutrals the less attractive, and Underperforms the least attractive investment opportunities. For Latin American and non-Japan Asia stocks, ratings are based on a stock’s total return relative to the average total return of the relevant country or regional benchmark; prior to 2nd October 2012 U.S. and Canadian ratings were based on (1) a stock’s absolute total return potential to its current share price and (2) the relative attractiveness of a stock’s total return potential within an analyst’s coverage universe. For Australian and New Zealand stocks, the expected total return (ETR) calculation includes 12-month rolling dividend yield. An Outperform rating is assigned where an ETR is greater than or equal to 7.5%; Underperform where an ETR less than or equal to 5%. A Neutral may be assigned where the ETR is between -5% and 15%. The overlapping rating range allows analysts to assign a rating that puts ETR in the context of associated risks. Prior to 18 May 2015, ETR ranges for Outperform and Underperform ratings did not overlap with Neutral thresholds between 15% and 7.5%, wh ich was in operation from 7 July 2011. Restricted (R) : In certain circumstances, Credit Suisse policy and/or applicable law and regulations preclude certain types of communications, including an investment recommendation, during the course of Credit Suisse's engagement in an investment banking transaction and in certain other circumstances. Not Rated (NR) : Credit Suisse Equity Research does not have an investment rating or view on the stock or any other securities related to the company at this time. Not Covered (NC) : Credit Suisse Equity Research does not provide ongoing coverage of the company or offer an investment rating or investment view on the equity security of the company or related products.
Volatility Indicator [V] : A stock is defined as volatile if the stock price has moved up or down by 20% or more in a month in at least 8 of the past 24 months or the analyst expects significant volatility going forward.
Analysts’ sector weightings are distinct from analysts’ stock ratings and are based on the analyst’s expectations for the fundamentals and/or valuation of the sector* relative to the group’s historic fundamentals and/or valuation: Overweight : The analyst’s expectation for the sector’s fundamentals and/or valuation is favorable over the next 12 months. Market Weight : The analyst’s expectation for the sector’s fundamentals and/or valuation is neutral over the next 12 months. Underweight : The analyst’s expectation for the sector’s fundamentals and/or valuation is cautious over the next 12 months. *An analyst’s coverage sector consists of all companies covered by the analyst within the relevant sector. An analyst may cover mul tiple sectors.
Credit Suisse's distribution of stock ratings (and banking clients) is:
Global Ratings Distribution
Rating Versus universe (%) Of which banking clients (%) Outperform/Buy* 45% (64% banking clients) Neutral/Hold* 39% (59% banking clients) Underperform/Sell* 14% (53% banking clients) Restricted 2% *For purposes of the NYSE and FINRA ratings distribution disclosure requirements, our stock ratings of Outperform, Neutral, and Underperform most closely correspond to Buy, Hold, and Sell, respectively; however, the meanings are not the same, as our stock ratings are determined on a relative basis. (Please refer to definitions above.) An investor's decision to buy or sell a security should be based on investment objectives, current holdings, an d other individual factors.

3 March 2017
Global Mining 2020 Capex 27
Important Global Disclosures Credit Suisse’s research reports are made available to clients through our proprietary research portal on CS PLUS. Credit Suisse research products may also be made available through third-party vendors or alternate electronic means as a convenience. Certain research products are only made available through CS PLUS. The services provided by Credit Suisse’s analysts to clients may depend on a specific client’s preferences regarding the frequency and manner of receiving communications, the client’s risk profile and investment, the size and scope of the overall client relationship with the Firm, as well as legal and regulatory constraints. To access all of Credit Suisse’s research that you are entitled to receive in the most timely manner, please contact your sales representative or go to https://plus.credit-suisse.com . Credit Suisse’s policy is to update research reports as it deems appropriate, based on developments with the subject company, the sector or the market that may have a material impact on the research views or opinions stated herein. Credit Suisse's policy is only to publish investment research that is impartial, independent, clear, fair and not misleading. For more detail please refer to Credit Suisse's Policies for Managing Conflicts of Interest in connection with Investment Research: https://www.credit-suisse.com/sites/disclaimers-ib/en/managing-conflicts.html . Credit Suisse does not provide any tax advice. Any statement herein regarding any US federal tax is not intended or written to be used, and cannot be used, by any taxpayer for the purposes of avoiding any penalties.
Target Price and Rating Valuation Methodology and Risks: (12 months) for Anglo American Plc (AAL.L)
Method: Our £14 TP is derived from a blend of our NPV and a target 2017/18 EV/EBITDA of ~6x. Our full break-up / take-out valuation for the group is £18. We rate the stock Neutral due to the limited upside potential indicated by our target price.
Risk: Risks to our £14 target price and Neutral rating: Mining operations are inherently subject to a wide range of internal and external risk. The impact of these risks on the target price is linked mainly to commodity prices and the operating environment. Typically, risks increase in an environment that prevents and/or restricts the management of operations, which include technical, financial and fiscal norms. Other risks, which may impact the target price and rating, include country risk, infrastructural and environmental risk, which could interrupt mining operations, including the provisions of water and electricity. Lastly, risks associated with metal price and exchange rate fluctuations.
Target Price and Rating Valuation Methodology and Risks: (12 months) for BHP Billiton (BLT.L)
Method: We set our target price of A$26.5 / GBp1380 in line with our discounted cash flow (DCF) sum-of-parts (SOP) valuation. Our DCF is calculated using a weighted average cost of capital (WACC) of 8.5%. We model (principally) in USD and over life-of-mine for BHP's long life operations. We rate the stock NEUTRAL as following a strong year of outperformance in 2016, the shares have closed the valuation discount that was formerly evident.
Risk: Risks to our BHP price target of A$26.5/ GBp1380 and NEUTRAL rating include commodity price risk (especially Chinese growth expectations), mining operational risk and regulatory risk (taxes and royalty rates, and possible future carbon taxes). Other risks to our investment view include the quantum of the Samarco settlement which is being contested by Federal prosecutors in Brazil.
Target Price and Rating Valuation Methodology and Risks: (12 months) for Glencore (GLEN.L)
Method: Our £4 TP is based on a marketing PE of 12 (equity value of $25bn) and a target EV/EBITDA of 6-6.5x for the industrial business. Latent capacity in copper and zinc provides 10-15% upside to current group EBITDA, an area the market is currently placing very little value on. We rate the stock Outperform given the upside potential indicated by our target price.
Risk: The main risks to our TP and Outperform rating are: 1) lower commodity prices; 2) political risk; 3) regulatory risk impacting the marketing operations; 4) M&A activity; 5) interest rates; 6) key management dependency.
Target Price and Rating Valuation Methodology and Risks: (12 months) for Rio Tinto (RIO.L)
Method: Our 12-month target price for Rio Tinto of A$72/GBP40.0 is set broadly in line with our DCF (discounted cash flow) valuation. Our sum of the parts (life of mine) discounted cash flow valuation uses a weighted average cost of capital of 9%. Our Outperform Rating is backed by positive commodity price movements and continued further cost out and capex reductions by RIO.
Risk: Risks that could impede achievement of our target prices of A$72/GBP40.0 and Outperform for Rio Tinto include: commodity price risk, mining production risk and project execution risk (capex costs, forex, etc). Country risk is also a factor for Rio Tinto, especially in non-OECD countries where its does business, including Mongolia. Risks to our Outperform Rating are around a slowdown in demand for commodities and inability to initiate continued cost outs.
Target Price and Rating Valuation Methodology and Risks: (12 months) for Teck Resources Ltd (TECKb.TO)
Method: Our TP of C$43/share for Teck Resources Ltd. (TECK) is based on 1.1x P/NAV based on our NAVPS (C$34.65) and 5.5x our FY17/18 EV/EBITDA (enterprise value/earnings before interest, taxes, depreciation and amortization). We rate TECK Outperform as we expect the

3 March 2017
Global Mining 2020 Capex 28
coking coal market will remain relatively tight over the next two years, with a supply response from swing producers unlikely to materialize over a 6-12 month period.
Risk: Primary risks to our C$43 target price and Outperform rating for Teck Resources Ltd. (TECK) are financial and commodity price risk (primarily coking coal, copper, and zinc), currency risk (US$/CAD$), as well as mining and operating risk at the operations.
Target Price and Rating Valuation Methodology and Risks: (12 months) for Vale (VALE.N)
Method: Our Discounted Cash Flow to Equity analysis, based on an estimated 11.5% cost of equity, 350bps. country risk, 3.0% risk-free rate, 5.0% equity premium and 2.0% perpetuity growth rate, supports our US$9.0 target price and Neutral rating for Vale. We rate the stock Neutral as we see more attractive valuations elsewhere in the sector.
Risk: Rsks to our US$9.0 target price and Neutral rating for Vale are Global currencies, monetary policies, liquidity, and S&D could all impact prices. A structural bounce back in commodities prices would be against our Neutral rating. Chinese demand surprising on the upside or capacity shutdowns would trigger a more pronounced recovery in commodities prices. Also, Commodity prices; disruptions in mine operations; weather conditions; fuel and energy price; freight rates; delays in the announced expansion projects, especially in the iron ore segment; inflation in the price of equipment needed to expand operations, FX related risks, environmental framework in Brazil.
Please refer to the firm's disclosure website at https://rave.credit-suisse.com/disclosures for the definitions of abbreviations typically used in the target price method and risk sections.
See the Companies Mentioned section for full company names The subject company (AAL.L, TECKb.TO, RIO.L, BLT.L, VALE.N, GLEN.L, KIOJ.J, FMG.AX) currently is, or was during the 12-month period preceding the date of distribution of this report, a client of Credit Suisse. Credit Suisse provided investment banking services to the subject company (AAL.L, RIO.L, BLT.L, GLEN.L, KIOJ.J) within the past 12 months. Credit Suisse has managed or co-managed a public offering of securities for the subject company (GLEN.L) within the past 12 months. Credit Suisse has received investment banking related compensation from the subject company (AAL.L, RIO.L, BLT.L, GLEN.L, KIOJ.J) within the past 12 months Credit Suisse expects to receive or intends to seek investment banking related compensation from the subject company (AAL.L, TECKb.TO, RIO.L, BLT.L, VALE.N, GLEN.L, KIOJ.J, FMG.AX) within the next 3 months. Credit Suisse has a material conflict of interest with the subject company (AAL.L) . Credit Suisse is acting as financial adviser to Anglo American Platinum Limited in relation to the proposed disposal of its Rustenburg operations. Credit Suisse has a material conflict of interest with the subject company (VALE.N) . The analyst Ivano Westin has a relationship with a natural person who may provide remunerated services to one or more of the companies covered in this report.
For other important disclosures concerning companies featured in this report, including price charts, please visit the website at https://rave.credit-suisse.com/disclosures or call +1 (877) 291-2683. For date and time of production, dissemination and history of recommendation for the subject company(ies) featured in this report, disseminated within the past 12 months, please refer to the link: https://rave.credit-suisse.com/disclosures/view/report?i=287561&v=-6c52t3ezk8hlne5vlh752qxh .
Important Regional Disclosures Singapore recipients should contact Credit Suisse AG, Singapore Branch for any matters arising from this research report. The analyst(s) involved in the preparation of this report may participate in events hosted by the subject company, including site visits. Credit Suisse does not accept or permit analysts to accept payment or reimbursement for travel expenses associated with these events. Restrictions on certain Canadian securities are indicated by the following abbreviations: NVS--Non-Voting shares; RVS--Restricted Voting Shares; SVS--Subordinate Voting Shares. Individuals receiving this report from a Canadian investment dealer that is not affiliated with Credit Suisse should be advised that this report may not contain regulatory disclosures the non-affiliated Canadian investment dealer would be required to make if this were its own report. For Credit Suisse Securities (Canada), Inc.'s policies and procedures regarding the dissemination of equity research, please visit https://www.credit-suisse.com/sites/disclaimers-ib/en/canada-research-policy.html. The following disclosed European company/ies have estimates that comply with IFRS: (AAL.L, BLT.L). Credit Suisse has acted as lead manager or syndicate member in a public offering of securities for the subject company (AAL.L, GLEN.L) within the past 3 years. Principal is not guaranteed in the case of equities because equity prices are variable. Commission is the commission rate or the amount agreed with a customer when setting up an account or at any time after that. I, Ivano Westin, certify that (1) The views expressed in this report solely and exclusively reflect my personal opinions and have been prepared independently, including with respect to Banco de Investimentos Credit Suisse (Brasil) S.A. or its affiliates ("Credit Suisse"). (2) Part of my compensation is based on various factors, including the total revenues of Credit Suisse, but no part of my compensation has been, is, or will be related to the specific recommendations or views expressed in this report. In addition, Credit Suisse declares that: Credit Suisse has provided, and/or may in the future provide investment banking, brokerage, asset management, commercial banking and other financial services to the subject company/companies or its affiliates, for which they have received or may receive customary fees and commissions, and which constituted or may constitute relevant financial or commercial interests in relation to the subject company/companies or the subject securities. This research report is authored by: Banco de Investments Credit Suisse (Brasil) SA or its affiliates. .................................................. Ivano Westin ; Renan Criscio ; Rafael Cunha Credit Suisse International .............................................................................................................. Liam Fitzpatrick ; James Gurry ; Conor Rowley Credit Suisse Equities (Australia) Limited .................................................................................................... Paul McTaggart ; Christian Prendiville
3 March 2017
Global Mining 2020 Capex 29
Credit Suisse Securities (Europe) Limited ..................................................................................................................................... Michael Shillaker Credit Suisse Securities (Canada), Inc. .................................................................................................... Ralph M. Profiti, CFA ; Yan Truong, CFA To the extent this is a report authored in whole or in part by a non-U.S. analyst and is made available in the U.S., the following are important disclosures regarding any non-U.S. analyst contributors: The non-U.S. research analysts listed below (if any) are not registered/qualified as research analysts with FINRA. The non-U.S. research analysts listed below may not be associated persons of CSSU and therefore may not be subject to the FINRA 2241 and NYSE Rule 472 restrictions on communications with a subject company, public appearances and trading securities held by a research analyst account. Banco de Investments Credit Suisse (Brasil) SA or its affiliates. ............................................................................Ivano Westin ; Renan Criscio Credit Suisse International .............................................................................................................. Liam Fitzpatrick ; James Gurry ; Conor Rowley Credit Suisse Equities (Australia) Limited .................................................................................................... Paul McTaggart ; Christian Prendiville Credit Suisse Securities (Europe) Limited ..................................................................................................................................... Michael Shillaker Credit Suisse Securities (Canada), Inc. .................................................................................................... Ralph M. Profiti, CFA ; Yan Truong, CFA
For Credit Suisse disclosure information on other companies mentioned in this report, please visit the website at https://rave.credit-suisse.com/disclosures or call +1 (877) 291-2683.

3 March 2017
Global Mining 2020 Capex 30
This report is produced by subsidiaries and affiliates of Credit Suisse operating under its Global Markets Division. For more information on our structure, please use the following link: https://www.credit-suisse.com/who-we-are This report may contain material that is not directed to, or intended for distribution to or use by, any person or entity who is a citizen or resident of or located in any locality, state, country or other jurisdiction where such distribution, publication, availability or use would be contrary to law or regulation or which would subject Credit Suisse or its affiliates ("CS") to any registration or licensing requirement within such jurisdiction. All material presented in this report, unless specifically indicated otherwise, is under copyright to CS. None of the material, nor its content, nor any copy of it, may be altered in any way, transmitted to, copied or distributed to any other party, without the prior express written permission of CS. All trademarks, service marks and logos used in this report are trademarks or service marks or registered trademarks or service marks of CS or its affiliates.The information, tools and material presented in this report are provided to you for information purposes only and are not to be used or considered as an offer or the solicitation of an offer to sell or to buy or subscribe for securities or other financial instruments. CS may not have taken any steps to ensure that the securities referred to in this report are suitable for any particular investor. CS will not treat recipients of this report as its customers by virtue of their receiving this report. The investments and services contained or referred to in this report may not be suitable for you and it is recommended that you consult an independent investment advisor if you are in doubt about such investments or investment services. Nothing in this report constitutes investment, legal, accounting or tax advice, or a representation that any investment or strategy is suitable or appropriate to your individual circumstances, or otherwise constitutes a personal recommendation to you. CS does not advise on the tax consequences of investments and you are advised to contact an independent tax adviser. Please note in particular that the bases and levels of taxation may change. Information and opinions presented in this report have been obtained or derived from sources believed by CS to be reliable, but CS makes no representation as to their accuracy or completeness. CS accepts no liability for loss arising from the use of the material presented in this report, except that this exclusion of liability does not apply to the extent that such liability arises under specific statutes or regulations applicable to CS. This report is not to be relied upon in substitution for the exercise of independent judgment. CS may have issued, and may in the future issue, other communications that are inconsistent with, and reach different conclusions from, the information presented in this report. Those communications reflect the different assumptions, views and analytical methods of the analysts who prepared them and CS is under no obligation to ensure that such other communications are brought to the attention of any recipient of this report. Some investments referred to in this report will be offered solely by a single entity and in the case of some investments solely by CS, or an associate of CS or CS may be the only market maker in such investments. Past performance should not be taken as an indication or guarantee of future performance, and no representation or warranty, express or implied, is made regarding future performance. Information, opinions and estimates contained in this report reflect a judgment at its original date of publication by CS and are subject to change without notice. The price, value of and income from any of the securities or financial instruments mentioned in this report can fall as well as rise. The value of securities and financial instruments is subject to exchange rate fluctuation that may have a positive or adverse effect on the price or income of such securities or financial instruments. Investors in securities such as ADR's, the values of which are influenced by currency volatility, effectively assume this risk. Structured securities are complex instruments, typically involve a high degree of risk and are intended for sale only to sophisticated investors who are capable of understanding and assuming the risks involved. The market value of any structured security may be affected by changes in economic, financial and political factors (including, but not limited to, spot and forward interest and exchange rates), time to maturity, market conditions and volatility, and the credit quality of any issuer or reference issuer. Any investor interested in purchasing a structured product should conduct their own investigation and analysis of the product and consult with their own professional advisers as to the risks involved in making such a purchase. Some investments discussed in this report may have a high level of volatility. High volatility investments may experience sudden and large falls in their value causing losses when that investment is realised. Those losses may equal your original investment. Indeed, in the case of some investments the potential losses may exceed the amount of initial investment and, in such circumstances, you may be required to pay more money to support those losses. Income yields from investments may fluctuate and, in consequence, initial capital paid to make the investment may be used as part of that income yield. Some investments may not be readily realisable and it may be difficult to sell or realise those investments, similarly it may prove difficult for you to obtain reliable information about the value, or risks, to which such an investment is exposed. This report may provide the addresses of, or contain hyperlinks to, websites. Except to the extent to which the report refers to website material of CS, CS has not reviewed any such site and takes no responsibility for the content contained therein. Such address or hyperlink (including addresses or hyperlinks to CS's own website material) is provided solely for your convenience and information and the content of any such website does not in any way form part of this document. Accessing such website or following such link through this report or CS's website shall be at your own risk.
This report is issued and distributed in European Union (except Switzerland): by Credit Suisse Securities (Europe) Limited, One Cabot Square, London E14 4QJ, England, which is authorised by the Prudential Regulation Authority and regulated by the Financial Conduct Authority and the Prudential Regulation Authority. Germany: Credit Suisse Securities (Europe) Limited Niederlassung Frankfurt am Main regulated by the Bundesanstalt fuer Finanzdienstleistungsaufsicht ("BaFin"). United States and Canada: Credit Suisse Securities (USA) LLC; Switzerland: Credit Suisse AG; Brazil: Banco de Investimentos Credit Suisse (Brasil) S.A or its affiliates; Mexico: Banco Credit Suisse (México), S.A. (transactions related to the securities mentioned in this report will only be effected in compliance with applicable regulation); Japan: by Credit Suisse Securities (Japan) Limited, Financial Instruments Firm, Director-General of Kanto Local Finance Bureau ( Kinsho) No. 66, a member of Japan Securities Dealers Association, The Financial Futures Association of Japan, Japan Investment Advisers Association, Type II Financial Instruments Firms Association; Hong Kong: Credit Suisse (Hong Kong) Limited; Australia: Credit Suisse Equities (Australia) Limited; Thailand: Credit Suisse Securities (Thailand) Limited, regulated by the Office of the Securities and Exchange Commission, Thailand, having registered address at 990 Abdulrahim Place, 27th Floor, Unit 2701, Rama IV Road, Silom, Bangrak, Bangkok10500, Thailand, Tel. +66 2614 6000; Malaysia: Credit Suisse Securities (Malaysia) Sdn Bhd; Singapore: Credit Suisse AG, Singapore Branch; India: Credit Suisse Securities (India) Private Limited (CIN no.U67120MH1996PTC104392) regulated by the Securities and Exchange Board of India as Research Analyst (registration no. INH 000001030) and as Stock Broker (registration no. INB230970637; INF230970637; INB010970631; INF010970631), having registered address at 9th Floor, Ceejay House, Dr.A.B. Road, Worli, Mumbai - 18, India, T- +91-22 6777 3777; South Korea: Credit Suisse Securities (Europe) Limited,
Seoul Branch; Taiwan: Credit Suisse AG Taipei Securities Branch; Indonesia: PT Credit Suisse Securities Indonesia; Philippines:Credit Suisse Securities (Philippines ) Inc., and elsewhere in the world by the relevant authorised affiliate of the above. Additional Regional Disclaimers Hong Kong: Credit Suisse (Hong Kong) Limited ("CSHK") is licensed and regulated by the Securities and Futures Commission of Hong Kong under the laws of Hong Kong, which differ from Australian laws. CSHKL does not hold an Australian financial services licence (AFSL) and is exempt from the requirement to hold an AFSL under the Corporations Act 2001 (the Act) under Class Order 03/1103 published by the ASIC in respect of financial services provided to Australian wholesale clients (within the meaning of section 761G of the Act). Research on Taiwanese securities produced by Credit Suisse AG, Taipei Securities Branch has been prepared by a registered Senior Business Person. Australia (to the extent services are offered in Australia): Credit Suisse Securities (Europe) Limited (“CSSEL”) and Credit Suisse International (“CSI”) are authorised by the Prudential Regulation Authority and regulated by the Financial Conduct Authority (“FCA”) and the Prudential Regulation Authority under UK laws, which differ from Australian Laws. CSSEL and CSI do not hold an Australian Financial Services Licence (“AFSL”) and are exempt from the requirement to hold an AFSL under the Corporations Act (Cth) 2001 (“Corporations Act”) under Class Order 03/1099 published by the Australian Securities and Investments Commission (“ASIC”), in respect of the financial services provided to Australian wholesale clients (within the meaning of section 761G of the Corporations Act). This material is not for distribution to retail clients and is directed exclusively at Credit Suisse's professional clients and eligible counterparties as defined by the FCA, and wholesale clients as defined under section 761G of the Corporations Act. Credit Suisse (Hong Kong) Limited (“CSHK”) is licensed and regulated by the Securities and Futures Commission of Hong Kong under the laws of Hong Kong, which differ from Australian laws. CSHKL does not hold an AFSL and is exempt from the requirement to hold an AFSL under the Corporations Act under Class Order 03/1103 published by the ASIC in respect of financial services provided to Australian wholesale clients (within the meaning of section 761G of the Corporations Act). Credit Suisse Securities (USA) LLC (CSSU) and Credit Suisse Asset Management LLC (CSAM LLC) are licensed and regulated by the Securities Exchange Commission of the United States under the laws of the United States, which differ from Australian laws. CSSU and CSAM LLC do not hold an AFSL and is exempt from the requirement to hold an AFSL under the Corporations Act under Class Order 03/1100 published by the ASIC in respect of financial services provided to Australian wholesale clients (within the meaning of section 761G of the Corporations Act). Malaysia: Research provided to residents of Malaysia is authorised by the Head of Research for Credit Suisse Securities (Malaysia) Sdn Bhd, to whom they should direct any queries on +603 2723 2020. Singapore: This report has been prepared and issued for distribution in Singapore to institutional investors, accredited investors and expert investors (each as defined under the Financial Advisers Regulations) only, and is also distributed by Credit Suisse AG, Singapore Branch to overseas investors (as defined under the Financial Advisers Regulations). Credit Suisse AG, Singapore Branch may distribute reports produced by its foreign entities or affiliates pursuant to an arrangement under Regulation 32C of the Financial Advisers Regulations. Singapore recipients should contact Credit Suisse AG, Singapore Branch at +65-6212-2000 for matters arising from, or in connection with, this report. By virtue of your status as an institutional investor, accredited investor, expert investor or overseas investor, Credit Suisse AG, Singapore Branch is exempted from complying with certain compliance requirements under the Financial Advisers Act, Chapter 110 of Singapore (the “FAA”), the Financial Advisers Regulations and the relevant Notices and Guidelines issued thereunder, in respect of any financial advisory service which Credit Suisse AG, Singapore Branch may provide to you. UAE: This information is being distributed by Credit Suisse AG (DIFC Branch), duly licensed and regulated by the Dubai Financial Services Authority (“DFSA”). Related financial services or products are only made available to Professional Clients or Market Counterparties, as defined by the DFSA, and are not intended for any other persons. Credit Suisse AG (DIFC Branch) is located on Level 9 East, The Gate Building, DIFC, Dubai, United Arab Emirates. EU: This report has been produced by subsidiaries and affiliates of Credit Suisse operating under its Global Markets Division In jurisdictions where CS is not already registered or licensed to trade in securities, transactions will only be effected in accordance with applicable securities legislation, which will vary from jurisdiction to jurisdiction and may require that the trade be made in accordance with applicable exemptions from registration or licensing requirements. Non-US customers wishing to effect a transaction should contact a CS entity in their local jurisdiction unless governing law permits otherwise. US customers wishing to effect a transaction should do so only by contacting a representative at Credit Suisse Securities (USA) LLC in the US. Please note that this research was originally prepared and issued by CS for distribution to their market professional and institutional investor customers. Recipients who are not market professional or institutional investor customers of CS should seek the advice of their independent financial advisor prior to taking any investment decision based on this report or for any necessary explanation of its contents. This research may relate to investments or services of a person outside of the UK or to other matters which are not authorised by the Prudential Regulation Authority and regulated by the Financial Conduct Authority and the Prudential Regulation Authority or in respect of which the protections of the Prudential Regulation Authority and Financial Conduct Authority for private customers and/or the UK compensation scheme may not be available, and further details as to where this may be the case are available upon request in respect of this report. CS may provide various services to US municipal entities or obligated persons ("municipalities"), including suggesting individual transactions or trades and entering into such transactions. Any services CS provides to municipalities are not viewed as "advice" within the meaning of Section 975 of the Dodd-Frank Wall Street Reform and Consumer Protection Act. CS is providing any such services and related information solely on an arm's length basis and not as an advisor or fiduciary to the municipality. In connection with the provision of the any such services, there is no agreement, direct or indirect, between any municipality (including the officials,management, employees or agents thereof) and CS for CS to provide advice to the municipality. Municipalities should consult with their financial, accounting and legal advisors regarding any such services provided by CS. In addition, CS is not acting for direct or indirect compensation to solicit the municipality on behalf of an unaffiliated broker, dealer, municipal securities dealer, municipal advisor, or investment adviser for the purpose of obtaining or retaining an engagement by the municipality for or in connection with Municipal Financial Products, the issuance of municipal securities, or of an investment adviser to provide investment advisory services to or on behalf of the municipality. If this report is being distributed by a financial institution other than Credit Suisse AG, or its affiliates, that financial institution is solely responsible for distribution. Clients of that institution should contact that institution to effect a transaction in the securities mentioned in this report or require further information. This report does not constitute investment advice by Credit Suisse to the clients of the distributing financial institution, and neither Credit Suisse AG, its affiliates, and their respective officers, directors and employees accept any liability whatsoever for any direct or consequential loss arising from their use of this report or its content. Principal is not guaranteed. Commission is the commission rate or the amount agreed with a customer when setting up an account or at any time after that. Copyright © 2017 CREDIT SUISSE AG and/or its affiliates. All rights reserved.
Investment principal on bonds can be eroded depending on sale price or market price. In addition, there are bonds on which investment principal can be eroded due to changes in redemption amounts. Care is required when investing in such instruments. When you purchase non-listed Japanese fixed income securities (Japanese government bonds, Japanese municipal bonds, Japanese government guaranteed bonds, Japanese corporate bonds) from CS as a seller, you will be requested to pay the purchase price only.