sector notebook project inorganic chemicals - us epa. management of chemicals in wastestream ......
TRANSCRIPT
Sector Notebook Project Inorganic Chemicals
This report is one in a series of volumes published by the U.S. Environmental Protection Agency (EPA) to provide information of general interest regarding environmental issues associated with specific industrial sectors. The documents were developed under contract by Abt Associates (Cambridge, MA), and Booz-Allen & Hamilton, Inc. (McLean, VA). This publication may be purchased from the Superintendent of Documents, U.S. Government Printing Office. A listing of available Sector Notebooks and document numbers is included on the following page.
All telephone orders should be directed to:
Superintendent of DocumentsU.S. Government Printing OfficeWashington, DC 20402(202) 512-1800FAX (202) 512-22508:00 a.m. to 4:30 p.m., ET, M-F
Using the form provided at the end of this document, all mail orders should be directed to:
U.S. Government Printing OfficeP.O. Box 371954Pittsburgh, PA 15250-7954
Complimentary volumes are available to certain groups or subscribers, such as public and academic libraries, Federal, State, local, and foreign governments, and the media. For further information, and for answers to questions pertaining to these documents, please refer to the contact names and numbers provided within this volume.
Electronic versions of all Sector Notebooks are available free of charge at the following web address: www.epa.gov/oeca/sector. Direct technical questions to the “Feedback” button at the bottom of the web page.
September 1995 SIC 281

Sector Notebook Project Inorganic Chemicals
Cover photograph by Steve Delaney, EPA. Photograph courtesy of Vista Chemicals, Baltimore, Maryland. Special thanks to Dave Mahler.
September 1995 SIC 281

Sector Notebook Project Inorganic Chemicals
EPA/310-R-95-004
EPA Office of Compliance Sector Notebook Project
Profile of the Inorganic Chemical Industry
September 1995
Office of ComplianceOffice of Enforcement and Compliance Assurance
U.S. Environmental Protection Agency401 M St., SW (MC 2221-A)
Washington, DC 20460
Sector Notebook Contacts
September 1995 SIC 281
Sector Notebook Project Inorganic Chemicals
The Sector Notebooks were developed by the EPA’s Office of Compliance. Questions relating to the Sector Notebook Project can be directed to:
Seth Heminway, Coordinator, Sector Notebook ProjectUS EPA Office of Compliance401 M St., SW (2223-A)Washington, DC 20460(202) 564-7017
Questions and comments regarding the individual documents can be directed to the appropriate specialists listed below.
Document Number Industry Contact Phone (202) EPA/310-R-95-001. Dry Cleaning Industry Joyce Chandler 564-7073 EPA/310-R-95-002. Electronics and Computer Industry* Steve Hoover 564-7007 EPA/310-R-95-003. Wood Furniture and Fixtures Industry Bob Marshall 564-7021 EPA/310-R-95-004. Inorganic Chemical Industry* Walter DeRieux 564-7067 EPA/310-R-95-005. Iron and Steel Industry Maria Malave 564-7027 EPA/310-R-95-006. Lumber and Wood Products Industry Seth Heminway 564-7017 EPA/310-R-95-007. Fabricated Metal Products Industry* Scott Throwe 564-7013 EPA/310-R-95-008. Metal Mining Industry Jane Engert 564-5021 EPA/310-R-95-009. Motor Vehicle Assembly Industry Anthony Raia 564-6045 EPA/310-R-95-010. Nonferrous Metals Industry Jane Engert 564-5021 EPA/310-R-95-011. Non-Fuel, Non-Metal Mining Industry Rob Lischinsky 564-2628 EPA/310-R-95-012. Organic Chemical Industry* Walter DeRieux 564-7067 EPA/310-R-95-013. Petroleum Refining Industry Tom Ripp 564-7003 EPA/310-R-95-014. Printing Industry Ginger Gotliffe 564-7072 EPA/310-R-95-015. Pulp and Paper Industry Seth Heminway 564-7017 EPA/310-R-95-016. Rubber and Plastic Industry Maria Malave 564-7027 EPA/310-R-95-017. Stone, Clay, Glass, and Concrete Industry Scott Throwe 564-7013 EPA/310-R-95-018. Transportation Equipment Cleaning Ind. Virginia Lathrop 564-7057 EPA/310-R-97-001. Air Transportation Industry Virginia Lathrop 564-7057 EPA/310-R-97-002. Ground Transportation Industry Virginia Lathrop 564-7057 EPA/310-R-97-003. Water Transportation Industry Virginia Lathrop 564-7057 EPA/310-R-97-004. Metal Casting Industry Jane Engert 564-5021 EPA/310-R-97-005. Pharmaceuticals Industry Emily Chow 564-7071 EPA/310-R-97-006. Plastic Resin and Man-made Fiber Ind. Sally Sasnett 564-7074 EPA/310-R-97-007. Fossil Fuel Electric Power Generation Ind. Rafael Sanchez 564-7028 EPA/310-R-97-008. Shipbuilding and Repair Industry Anthony Raia 564-6045 EPA/310-R-97-009. Textile Industry Belinda Breidenbach 564-7022 EPA/310-R-97-010. Sector Notebook Data Refresh-1997 Seth Heminway 564-7017 EPA/310-R-98-001. Aerospace Industry Anthony Raia 564-6045 EPA/310-R-98-002. Agricultural Chemical, Pesticide, and Shruti Sanghavi 564-4158
Fertilizer Industry EPA/310-R-98-003. Agricultural Crop Production Industry Ginah Mortensen (913)551-7864 EPA/310-R-98-004. Agricultural Livestock Production Ind. Ginah Mortensen (913)551-7864
September 1995 SIC 281

Sector Notebook Project Inorganic Chemicals
EPA/310-R-98-005. Oil and Gas Exploration and Production Dan Chadwick 564-7054 Industry
EPA/310-R-98-008. Local Government Operations John Dombrowski 564-7036 *Spanish Translations Available
September 1995 SIC 281

Sector Notebook Project Inorganic Chemicals
Industry Sector Notebook Contents: Inorganic Chemicals Manufacturing
Exhibits Index . . . . . . . . . . . . . . . . . . . . . . . . . . . . . . . . . . . . . . . . . . . . . . . . . . . . . . . . . . . . . iii
List of Acronyms . . . . . . . . . . . . . . . . . . . . . . . . . . . . . . . . . . . . . . . . . . . . . . . . . . . . . . . . . . . . v
I. INTRODUCTION TO THE SECTOR NOTEBOOK PROJECT . . . . . . . . . . . . . . . . . . . . . . 1A. Summary of the Sector Notebook Project . . . . . . . . . . . . . . . . . . . . . . . . . . . . . . . . . . . . 1B. Additional Information . . . . . . . . . . . . . . . . . . . . . . . . . . . . . . . . . . . . . . . . . . . . . . . . . . 2
II. INTRODUCTION TO THE INORGANIC CHEMICALS INDUSTRY . . . . . . . . . . . . . . . . 3A. Introduction, Background, and Scope of the Notebook . . . . . . . . . . . . . . . . . . . . . . . . . . 3B. Characterization of the Inorganic Chemical Industry . . . . . . . . . . . . . . . . . . . . . . . . . . . . 4
1. Product Characterization . . . . . . . . . . . . . . . . . . . . . . . . . . . . . . . . . . . . . . . . . . . . . . 42. Industry Size and Geographic Distribution . . . . . . . . . . . . . . . . . . . . . . . . . . . . . . . . . 53. Economic Trends . . . . . . . . . . . . . . . . . . . . . . . . . . . . . . . . . . . . . . . . . . . . . . . . . . . 10
III. INDUSTRIAL PROCESS DESCRIPTION . . . . . . . . . . . . . . . . . . . . . . . . . . . . . . . . . . . . 13A. Industrial Processes in the Inorganic Chemical Industry . . . . . . . . . . . . . . . . . . . . . . . . . 13
1. Mercury Cell . . . . . . . . . . . . . . . . . . . . . . . . . . . . . . . . . . . . . . . . . . . . . . . . . . . . . . 162. Diaphragm Cell . . . . . . . . . . . . . . . . . . . . . . . . . . . . . . . . . . . . . . . . . . . . . . . . . . . . 183. Membrane Cell . . . . . . . . . . . . . . . . . . . . . . . . . . . . . . . . . . . . . . . . . . . . . . . . . . . . . 204. Auxiliary Processes . . . . . . . . . . . . . . . . . . . . . . . . . . . . . . . . . . . . . . . . . . . . . . . . . 22
B. Raw Material Inputs and Pollution Outputs in the Production Line . . . . . . . . . . . . . . . . 241. Mercury Cell . . . . . . . . . . . . . . . . . . . . . . . . . . . . . . . . . . . . . . . . . . . . . . . . . . . . . . 252. Diaphragm Cell . . . . . . . . . . . . . . . . . . . . . . . . . . . . . . . . . . . . . . . . . . . . . . . . . . . . 253. Membrane Cell . . . . . . . . . . . . . . . . . . . . . . . . . . . . . . . . . . . . . . . . . . . . . . . . . . . . . 264. Auxiliary Processes . . . . . . . . . . . . . . . . . . . . . . . . . . . . . . . . . . . . . . . . . . . . . . . . . 27
C. Management of Chemicals In Wastestream . . . . . . . . . . . . . . . . . . . . . . . . . . . . . . . . . . 29
IV. CHEMICAL RELEASE AND TRANSFER PROFILE . . . . . . . . . . . . . . . . . . . . . . . . . . . 31A. EPA Toxic Release Inventory for the Inorganic Chemical Industry . . . . . . . . . . . . . . . . 34B. Summary of Selected Chemicals Released . . . . . . . . . . . . . . . . . . . . . . . . . . . . . . . . . . . 43C. Other Data Sources . . . . . . . . . . . . . . . . . . . . . . . . . . . . . . . . . . . . . . . . . . . . . . . . . . . . 48D. Comparison of Toxic Release Inventory Between Selected Industries . . . . . . . . . . . . . . 50
September 1995 i SIC 281

Sector Notebook Project Inorganic Chemicals
V. POLLUTION PREVENTION OPPORTUNITIES . . . . . . . . . . . . . . . . . . . . . . . . . . . . . . . 53
VI. SUMMARY OF APPLICABLE FEDERAL STATUTES AND REGULATIONS . . . . . . 73A. General Description of Major Statutes . . . . . . . . . . . . . . . . . . . . . . . . . . . . . . . . . . . . . . 73B. Industry Specific Requirements . . . . . . . . . . . . . . . . . . . . . . . . . . . . . . . . . . . . . . . . . . . 84C. Pending and Proposed Regulatory Requirements . . . . . . . . . . . . . . . . . . . . . . . . . . . . . . 87
VII. COMPLIANCE AND ENFORCEMENT HISTORY . . . . . . . . . . . . . . . . . . . . . . . . . . . . 89A. Inorganic Chemical Industry Compliance History . . . . . . . . . . . . . . . . . . . . . . . . . . . . . 93B. Comparison of Enforcement Activity Between Selected Industries . . . . . . . . . . . . . . . . 95C. Review of Major Legal Actions . . . . . . . . . . . . . . . . . . . . . . . . . . . . . . . . . . . . . . . . . . 100
1. Review of Major Cases . . . . . . . . . . . . . . . . . . . . . . . . . . . . . . . . . . . . . . . . . . . . . 1002. Supplementary Environmental Projects . . . . . . . . . . . . . . . . . . . . . . . . . . . . . . . . . . 100
VIII. COMPLIANCE ASSURANCE ACTIVITIES AND INITIATIVES . . . . . . . . . . . . . . . 103A. Sector-related Environmental Programs and Activities . . . . . . . . . . . . . . . . . . . . . . . . 103B. EPA Voluntary Programs . . . . . . . . . . . . . . . . . . . . . . . . . . . . . . . . . . . . . . . . . . . . . . 103C. Trade Association/Industry Sponsored Activity . . . . . . . . . . . . . . . . . . . . . . . . . . . . . . 108
1. Environmental Programs . . . . . . . . . . . . . . . . . . . . . . . . . . . . . . . . . . . . . . . . . . . . 1082. Summary of Trade Associations . . . . . . . . . . . . . . . . . . . . . . . . . . . . . . . . . . . . . . . 111
IX. CONTACTS/ACKNOWLEDGMENTS/RESOURCE MATERIALS/BIBLIOGRAPHY 113
ENDNOTES . . . . . . . . . . . . . . . . . . . . . . . . . . . . . . . . . . . . . . . . . . . . . . . . . . . . . . . . . . . . . 115
September 1995 ii SIC 281

Sector Notebook Project Inorganic Chemicals
Exhibits Index
Exhibit 1: Inorganic Chemicals Industry Dominated by a Large Number of Small Facilities . . . . . 6Exhibit 2: Inorganic Chemicals Facilities Distribution . . . . . . . . . . . . . . . . . . . . . . . . . . . . . . . . . . 6Exhibit 3: Chlorine Capacity Located Primarily Along Gulf Coast, Southeast, Northwest,
and Great Lakes Region . . . . . . . . . . . . . . . . . . . . . . . . . . . . . . . . . . . . . . . . . . . . . . . 8Exhibit 4: Top U.S. Companies with Inorganic Chemical Manufacturing Operations . . . . . . . . . . 9Exhibit 5: Chlorine Electrolysis Cells . . . . . . . . . . . . . . . . . . . . . . . . . . . . . . . . . . . . . . . . . . . . . 15Exhibit 6: Main Characteristics of the Different Electrolysis Processes . . . . . . . . . . . . . . . . . . . 16Exhibit 7: Mercury Electrolysis Cell and Flow Diagram . . . . . . . . . . . . . . . . . . . . . . . . . . . . . . . 17Exhibit 8: Typical Diaphragm Electrolysis Cell and Flow Diagram . . . . . . . . . . . . . . . . . . . . . . . 19Exhibit 9: Typical Membrane Electrolysis Cell . . . . . . . . . . . . . . . . . . . . . . . . . . . . . . . . . . . . . . 21Exhibit 10: Source Reduction and Recycling Activity for Inorganic Chemicals Industry
(SIC 281) as Reported within TRI . . . . . . . . . . . . . . . . . . . . . . . . . . . . . . . . . . . . . . 30Exhibit 11: 1993 Releases for Inorganic Chemical Manufacturing Facilities (SIC 281) in TRI,
by Number of Facilities Reporting . . . . . . . . . . . . . . . . . . . . . . . . . . . . . . . . . . . . . . . 36Exhibit 12: 1993 Transfers for Inorganic Chemical Manufacturing Facilities (SIC 281) in TRI,
by Number of Facilities Reporting . . . . . . . . . . . . . . . . . . . . . . . . . . . . . . . . . . . . . . . 39Exhibit 13: Top 10 TRI Releasing Inorganic Chemicals Facilities . . . . . . . . . . . . . . . . . . . . . . . . . 42Exhibit 14: Top 10 TRI Releasing Facilities Reporting Inorganic Chemical SIC Codes to TRI . . . 43Exhibit 15: Pollutant Releases (short tons/year) . . . . . . . . . . . . . . . . . . . . . . . . . . . . . . . . . . . . . . 48Exhibit 16: Summary of 1993 TRI Data: Releases and Transfers by Industry . . . . . . . . . . . . . . . . 51Exhibit 17: Toxics Release Inventory Data for Selected Industries . . . . . . . . . . . . . . . . . . . . . . . . 52Exhibit 18: Process/Product Modifications Create Pollution Prevention Opportunities . . . . . . . . . 57Exhibit 19: Modifications to Equipment Can Also Prevent Pollution . . . . . . . . . . . . . . . . . . . . . . 66Exhibit 20: Five-Year Enforcement and Compliance Summary for Inorganic
Chemicals Manufacturing . . . . . . . . . . . . . . . . . . . . . . . . . . . . . . . . . . . . . . . . . . . . . 94Exhibit 21: Five-Year Enforcement and Compliance Summary for Selected Industries . . . . . . . . . 96Exhibit 22: One-Year Inspection and Enforcement Summary for Selected Industries . . . . . . . . . . 97Exhibit 23: Five-Year Inspection and Enforcement Summary by Statute for Selected Industries . . 98Exhibit 24: One-Year Inspection and Enforcement Summary by Statute for Selected Industries . . 99Exhibit 25: FY-1993-1994 Supplemental Environmental Projects Overview:
Inorganic Chemical Manufacture . . . . . . . . . . . . . . . . . . . . . . . . . . . . . . . . . . . . . . 102Exhibit 26: 33/50 Program Participants Reporting SIC 281 (Inorganic Chemicals) . . . . . . . . . . . 104Exhibit 27: Contacts for State and Local Pollution Prevention Programs . . . . . . . . . . . . . . . . . . 109
September 1995 iii SIC 281

Sector Notebook Project Inorganic Chemicals
List of Acronyms
AFS - AIRS Facility Subsystem (CAA database)AIRS - Aerometric Information Retrieval System (CAA database)BIFs - Boilers and Industrial Furnaces (RCRA)BOD - Biochemical Oxygen Demand CAA - Clean Air ActCAAA - Clean Air Act Amendments of 1990CERCLA - Comprehensive Environmental Response, Compensation and Liability ActCERCLIS - CERCLA Information SystemCFCs - ChlorofluorocarbonsCO - Carbon Monoxide COD - Chemical Oxygen Demand CSI - Common Sense Initiative CWA - Clean Water ActD&B - Dun and Bradstreet Marketing IndexDSA - Dimensionallly stableELP - Environmental Leadership Program EPA - United States Environmental Protection AgencyEPCRA - Emergency Planning and Community Right-to-Know Act FIFRA - Federal Insecticide, Fungicide, and Rodenticide ActFINDS - Facility Indexing SystemHAPs - Hazardous Air Pollutants (CAA)HSDB - Hazardous Substances Data Bank IDEA - Integrated Data for Enforcement AnalysisLDR - Land Disposal Restrictions (RCRA)LEPCs - Local Emergency Planning Committees MACT - Maximum Achievable Control Technology (CAA)MCLGs - Maximum Contaminant Level Goals MCLs - Maximum Contaminant Levels MEK - Methyl Ethyl KetoneMSDSs - Material Safety Data Sheets NAAQS - National Ambient Air Quality Standards (CAA)NAFTA - North American Free Trade Agreement NCDB - National Compliance Database (for TSCA, FIFRA, EPCRA)NCP - National Oil and Hazardous Substances Pollution Contingency Plan NEIC - National Enforcement Investigation Center NESHAP - National Emission Standards for Hazardous Air PollutantsNO2 - Nitrogen DioxideNOV - Notice of Violation NOX - Nitrogen Oxide
September 1995 iv SIC 281

Sector Notebook Project Inorganic Chemicals
NPDES - National Pollution Discharge Elimination System (CWA)NPL - National Priorities List NRC - National Response Center NSPS - New Source Performance Standards (CAA)OAR - Office of Air and RadiationOECA - Office of Enforcement and Compliance AssuranceOPA - Oil Pollution ActOPPTS - Office of Prevention, Pesticides, and Toxic SubstancesOSHA - Occupational Safety and Health Administration OSW - Office of Solid WasteOSWER - Office of Solid Waste and Emergency ResponseOW - Office of WaterP2 - Pollution PreventionPCS - Permit Compliance System (CWA Database)POTW - Publicly Owned Treatments Works RCRA - Resource Conservation and Recovery ActRCRIS - RCRA Information SystemSARA - Superfund Amendments and Reauthorization Act SDWA - Safe Drinking Water ActSEPs - Supplementary Environmental Projects SERCs - State Emergency Response Commissions SIC - Standard Industrial Classification SO2 - Sulfur Dioxide SOX - Sulfur OxidesTOC - Total Organic Carbon TRI - Toxic Release InventoryTRIS - Toxic Release Inventory System TCRIS - Toxic Chemical Release Inventory SystemTSCA - Toxic Substances Control ActTSS - Total Suspended Solids UIC - Underground Injection Control (SDWA)UST - Underground Storage Tanks (RCRA)VOCs - Volatile Organic Compounds
September 1995 v SIC 281


Sector Notebook Project Inorganic Chemicals
I. INTRODUCTION TO THE SECTOR NOTEBOOK PROJECT
I.A. Summary of the Sector Notebook Project
Environmental policies based upon comprehensive analysis of air, water and land pollution are an inevitable and logical supplement to traditional single-media approaches to environmental protection. Environmental regulatory agencies are beginning to embrace comprehensive, multi-statute solutions to facility permitting, enforcement and compliance assurance, education/ outreach, research, and regulatory development issues. The central concepts driving the new policy direction are that pollutant releases to each environmental medium (air, water and land) affect each other, and that environmental strategies must actively identify and address these inter-relationships by designing policies for the "whole" facility. One way to achieve a whole facility focus is to design environmental policies for similar industrial facilities. By doing so, environmental concerns that are common to the manufacturing of similar products can be addressed in a comprehensive manner. Recognition of the need to develop the industrial “sector-based” approach within the EPA Office of Compliance led to the creation of this document.
The Sector Notebook Project was initiated by the Office of Compliance within the Office of Enforcement and Compliance Assurance (OECA) to provide its staff and managers with summary information for eighteen specific industrial sectors. As other EPA offices, states, the regulated community, environmental groups, and the public became interested in this project, the scope of the original project was expanded. The ability to design comprehensive, common sense environmental protection measures for specific industries is dependent on knowledge of several inter-related topics. For the purposes of this project, the key elements chosen for inclusion are: general industry information (economic and geographic); a description of industrial processes; pollution outputs; pollution prevention opportunities; Federal statutory and regulatory framework; compliance history; and a description of partnerships that have been formed between regulatory agencies, the regulated community and the public.
For any given industry, each topic listed above could alone be the subject of a lengthy volume. However, in order to produce a manageable document, this project focuses on providing summary information for each topic. This format provides the reader with a synopsis of each issue, and references where more in-depth information is available. Text within each profile was researched from a variety of sources, and was usually condensed from more detailed sources pertaining to specific topics. This approach allows for a wide coverage of activities that can be further explored based upon the citations
September 1995 1 SIC 281

Sector Notebook Project Inorganic Chemicals
and references listed at the end of this profile. As a check on the information included, each notebook went through an external review process. The Office of Compliance appreciates the efforts of all those that participated in this process and enabled us to develop more complete, accurate and up-to-date summaries.
I.B. Additional Information
Providing Comments
OECA’s Office of Compliance plans to periodically review and update the notebooks and will make these updates available both in hard copy and electronically. If you have any comments on the existing notebook, or if you would like to provide additional information, please send a hard copy and computer disk to the EPA Office of Compliance, Sector Notebook Project, 401 M St., SW (2223-A), Washington, DC 20460. Comments can also be uploaded to the Enviro$en$e Bulletin Board or the Enviro$en$e World Wide Web for general access to all users of the system. Follow instructions in Appendix A for accessing these data systems. Once you have logged in, procedures for uploading text are available from the on-line Enviro$en$e Help System.
Adapting Notebooks to Particular Needs
The scope of the existing notebooks reflect an approximation of the relative national occurrence of facility types that occur within each sector. In many instances, industries within specific geographic regions or states may have unique characteristics that are not fully captured in these profiles. For this reason, the Office of Compliance encourages state and local environmental agencies and other groups to supplement or re-package the information included in this notebook to include more specific industrial and regulatory information that may be available. Additionally, interested states may want to supplement the "Summary of Applicable Federal Statutes and Regulations" section with state and local requirements. Compliance or technical assistance providers may also want to develop the "Pollution Prevention" section in more detail. Please contact the appropriate specialist listed on the opening page of this notebook if your office is interested in assisting us in the further development of the information or policies addressed within this volume.
If you are interested in assisting in the development of new notebooks for sectors not covered in the original eighteen, please contact the Office of Compliance at 202-564-2395.
September 1995 2 SIC 281

Sector Notebook Project Inorganic Chemicals
II. INTRODUCTION TO THE INORGANIC CHEMICALS INDUSTRY
This section provides background information on the size, geographic distribution, employment, production, sales, and economic condition of the inorganic chemicals industry. The type of facilities described within the document are also described in terms of their Standard Industrial Classification (SIC) codes. Additionally, this section contains a list of the largest companies in terms of sales.
II.A. Introduction, Background, and Scope of the Notebook
The inorganic chemical industry manufactures over 300 different chemicals accounting for about 10 percent of the total value of chemical shipments in the U.S.1 This industry categorization corresponds to Standard Industrial Classification (SIC) code 281 Industrial Inorganic Chemicals established by the Bureau of Census to track the flow of goods and services within the economy. The 281 category includes alkalies and chlorine (SIC 2812), industrial gases (SIC 2813) (e.g., hydrogen, helium, oxygen, nitrogen, etc.), inorganic pigments (SIC 2816), and industrial inorganic chemicals, not elsewhere classified (SIC 2819). Approximately two-thirds of the value of shipments for the inorganic chemical industry, including over 200 different chemicals, are classified under industrial inorganic chemicals, not elsewhere classified (SIC 2819). The industry does not include those establishments primarily manufacturing organic chemicals, agricultural pesticides, drugs, soaps, or cosmetics. However, the 281 industry group does include a significant number of integrated firms that are engaged in the manufacture of other types of chemicals at the same site. Conversely, many manufacturing facilities not categorized under SIC 281, especially organic chemicals facilities (SIC 286), fertilizer plants (SIC 287), pulp and paper mills (SIC 26), and iron and steel mills (SIC 331), produce and use inorganic chemicals in their processes at the same facility.2 For example, a significant number of inorganic chemical manufacturing processes are part of very large chemical manufacturing or pulp manufacturing facilities, making characterization strictly by SIC code difficult.
Whenever possible, this notebook describes the entire inorganic chemical industry. In many cases, however, specific details relating to some of the topics covered by the notebook (facility size, economic trends, geographic distribution, pollutant releases, pollution prevention issues, and applicable regulations) vary depending on the type of inorganic chemical manufacturing process. The large number of different industrial processes used in the inorganics industry could not all be covered in this notebook. As a result, most sections of this notebook describe the entire inorganic chemical industry as a whole. These sections are usually augmented with information specific
September 1995 3 SIC 281

Sector Notebook Project Inorganic Chemicals
to the largest single industrial process within the industry: chlorine and caustic soda production (SIC 2812). Section III, Industrial Process Description, rather than attempting to describe every inorganic chemical manufacturing process, deals solely with the production of chlorine and caustic soda.
II.B. Characterization of the Inorganic Chemical Industry
II.B.1. Product Characterization
Inorganic Chemicals Industry
The inorganic chemical industry manufactures chemicals which are often of a mineral origin, but not of a basic carbon molecular. Inorganic chemicals are used at some stage in the manufacture of a great variety of other products. The industry's products are used as basic chemicals for industrial processes (i.e., acids, alkalies, salts, oxidizing agents, industrial gases, and halogens); chemical products to be used in manufacturing products (i.e., pigments, dry colors, and alkali metals); and finished products for ultimate consumption (i.e., mineral fertilizers, glass, and construction materials). The largest use of inorganic chemicals is as processing aids in the manufacture of chemical and nonchemical products. Consequently, inorganic chemicals often do not appear in the final products.3
Chlor-alkali Sector
The chlor-alkali industry produces mainly chlorine, caustic soda (sodium hydroxide), soda ash (sodium carbonate), sodium bicarbonate, potassium hydroxide, and potassium carbonate. In 1992, chlorine and caustic soda production accounted for about 80 percent of the chlor-alkali industry's value of shipments and, in terms of weight, were the eighth and ninth largest chemicals produced in the U.S., respectively. Chlorine and caustic soda are co-products produced in about equal amounts primarily through the electrolysis of salt (brine).4
The majority of domestic chlorine production (70 percent) is used in the manufacturing of organic chemicals including: vinyl chloride monomer, ethylene dichloride, glycerine, glycols, chlorinated solvents, and chlorinated methanes. Vinyl chloride, which is used in the production of polyvinyl chloride (PVC) and many other organic chemicals, accounts for about 38 percent of the total domestic chlorine production. The pulp and paper industry consumes approximately 15 percent of U.S. chlorine production, and about eight percent is used in the manufacturing of other inorganic chemicals. Other major uses are disinfection treatment of water, and the production of
September 1995 4 SIC 281

Sector Notebook Project Inorganic Chemicals
hypochlorites. More than two-thirds of all chlorine is consumed in the same manufacturing plant in the production of chemical intermediates.5
The largest users of caustic soda are the organic chemicals industry (30 percent) and the inorganic chemicals industry (20 percent). The primary uses of caustic soda are in industrial processes, neutralization, and off-gas scrubbing; as a catalyst; and in the production of alumina, propylene oxide, polycarbonate resin, epoxies, synthetic fibers, soaps, detergents, rayon, and cellophane. The pulp and paper industry uses about 20 percent of total domestic caustic soda production for pulping wood chips, and other processes. Caustic soda is also used in the production of soaps and cleaning products, and in the petroleum and natural gas extraction industry as a drilling fluid.6
II.B.2. Industry Size and Geographic Distribution
Inorganic Chemical Industry
The inorganic chemical industry is characterized by a relatively large number of small facilities. The Bureau of the Census identified 665 companies
aoperating 1,429 facilities within SIC 281 in 1992. Most of these facilitieswere classified under SIC 2819 -- industrial inorganic chemicals, not elsewhere classified -- which are typically smaller facilities producing specialty inorganic chemicals. The Bureau of Census employment data for 1992 (Exhibit 1) indicated that about 63 percent of inorganic chemical facilities employed fewer than 20 people. A significant portion of inorganic chemicals are produced and used within the same plant in the manufacturing of organic chemicals. The number of these facilities and the number of people employed in the inorganic chemical production portion of the industrial processes is not included in this data.
a Variation in facility counts occur across data sources due to many factors including, reporting and definitiondifferences. This notebook does not attempt to reconcile these differences, but rather reports the data as they are maintained by each source.
September 1995 5 SIC 281

Sector Notebook Project Inorganic Chemicals
Exhibit 1: Inorganic Chemicals Industry Dominated by a Large Number of Small Facilities
Inorganic Chemicals Chlor-alkali
Employees per Facility
Number of Facilities
Percentage of Facilities
Number of Facilities
Percentage of Facilities
1-9 682 48% 12 24%
10-19 212 15% 6 12%
20-49 253 18% 3 6%
50-249 221 15% 23 44%
250-999 51 3% 6 12%
1,000->2,500 10 1% 1 2%
Total 1,429 100% 51 100%
Source: Bureau of the Census, 1992 Census of Manufacturers.
Inorganic chemical facilities are typically located near consumers and to a lesser extent raw materials. The largest use of inorganic chemicals is in industrial processes for the manufacture of chemicals and nonchemical products; therefore, facilities are concentrated in the heavy industrial regions along the Gulf Coast, both east and west coasts, and the Great Lakes region. Since a large portion of inorganic chemicals produced are used by the organic chemicals manufacturing industry, the geographical distribution of inorganic facilities is very similar to that of organic chemicals facilities (Exhibit 2).
September 1995 6 SIC 281

Sector Notebook Project Inorganic Chemicals
Exhibit 2: Inorganic Chemicals Facilities Distribution
�
�
�
� � ���
��
�����������������������������
�
�
�
�� �� �
� ����������������������� ����
�����
� �
� �
������
� �
�
��
�
��� ���
�
����� �
���
�
�
� ����������� ������������
�
�
�� ���
�
� �
� � ������
� ��� �
�
� �
��
�
�
� �
����
�� � �
����
�
�
��
�
�
�
�
� �
�
� �
���
�
� �
� �
���������������� ������
� �
�
�����
�
� �
��
� ��� ��
��
��
���
�
�
� �
� �������
������ � � �
�
�
� � ���� ��
�
���
��� �� ����
�
�� ��������
�
� �� ���
��
� �
��� � ���
� �
�� ���
�
� �
����������
� ��
�� � � ���
���������� � �� �
� � ���
�� ���� �� � ������ �� �����������
�
��
�
���� �
�
��
���� ���� �����
���� �
���
�
� � ����� �
�
� ��
�
�� �� � �����
� �
� ���
������������ ����������� ������� �����
� � �
�
���
�
����� ����
�
� ����� � �������������� �� ���
�� �� � � ���
Miles
4003002001000
(Source: U.S. EPA Toxic Release Inventory Database, 1993)
Chlor-alkali Sector
The alkali and chlorine industry, however, consists of a relatively small number of medium to large facilities. The Bureau of the Census identified 34 companies operating 51 facilities within the SIC 2812 in 1992. According to The Chlorine Institute (an industry trade group), there were 25 companies operating 52 chlorine production plants in 1989. The Bureau of Census employment data for 1992 indicated that about 60 percent of those employed in the chlor-alkali industry worked at facilities with over 50 employees (Exhibit 1).7,8
The distribution of the chlor-alkali sector differs from that of the inorganic chemicals industry as a whole. Since chlorine and caustic soda are coproducts produced in almost equal amounts, the distribution of the caustic soda manufacturing industry is essentially the same as the chlorine manufacturing industry. Chlorine is difficult to store and transport economically; therefore, chlorine and caustic soda are produced near the
September 1995 7 SIC 281

Sector Notebook Project Inorganic Chemicals
chlorine consumers which are primarily chemical manufacturers and pulping operations. Consequently, chlor-alkali facilities are concentrated near the chemical industries along the Gulf Coast, followed by the Great Lakes region as shown in the table below. Other important areas are in the vicinity of the pulp mills of the Southeast and Northwest (Exhibit 3). In 1989, almost half of the chlorine plants in the U.S. (72 percent of domestic chlorine production) were located along the Gulf Coast. Two states, Louisiana and Texas, accounted for two-thirds of the domestic chlorine production.9
Exhibit 3: Chlorine Capacity Located Primarily Along Gulf Coast, Southeast, Northwest, and Great Lakes Region
State Chlorine Plants Number of
per year) (thousand tons
Annual Capacity
Capacity Operating Total U.S. Percent of
Louisiana 9 4,068 37%
Texas 5 3,314 30%
New York 4 652 6%
Alabama 5 592 5%
Washington 4 503 5%
West Virginia 2 392 3%
Georgia 3 246 2%
Tennessee 1 230 2%
Other States (14) 19 1,139 10%
U.S. Total 52 11,136 100%
Source: Kirk-Othmer Encyclopedia of Chemical Technology, 4th ed. Vol. 1, 1993.
September 1995 8 SIC 281

1
2
3
4
5
6
7
8
9
10
Sector Notebook Project Inorganic Chemicals
Ward’s Business Directory of U.S. Private Companies, produced by Gale Research Inc., compiles financial data on U.S. companies including those operating within the inorganic chemicals manufacturing industry. Ward’s ranks U.S. companies, whether they are a parent company, subsidiary or division, by sales volume within the 4-digit SIC codes that they have been assigned as their primary activity. Exhibit 4 lists the top ten inorganic chemical manufacturing companies in the U.S. Readers should note that: 1) Companies are assigned a 4-digit SIC that most closely resembles their principal industry; and 2) Sales figures include total company sales, including sales derived from subsidiaries and operations not related to the manufacture of inorganic chemicals. Additional sources of company specific financial information include Standard & Poor’s Stock Report Services, Dunn & Bradstreet’s Million Dollar Directory, Moody’s Manuals, and annual reports.
Exhibit 4: Top U.S. Companies with Inorganic Chemical Manufacturing Operations
Ranka Companyb
1993 Sales (millions of dollars)
Dow Chemical Co. - Midland, MI 18,800
Hanson Industries, Inc. - Iselin, NJ 6,092
WR Grace and Co. - Boca Raton, FL 6,049
Occidental Chemical Corp. - Dallas, TX 4,600
BOC Group, Inc. - Murray Hill, NJ 4,500
FMC Corp. - Chicago, IL 3,899
Eastman Kadak Co. - Kingsport, TN 3,740
Air Products and Chemicals, Inc. - Allentown, PA 2,931
ARCO Chemical Co. - Newtown Square, PA 2,837
Ethyl Corp. - Richmond, VA 2,575
Note: When Ward’s Business Directory listed both a parent and subsidiary in the top ten,a
only the parent company is presented above to avoid double counting sales volumes. Not all sales can be attributed to the companies’ inorganic chemical manufacturing operations.
Companies shown listed SICs 2812, 2813, 2816 and 2819 as primary activities.b
Source: Ward’s Business Directory of U.S. Private and Public Companies - 1993.
September 1995 9 SIC 281

Sector Notebook Project Inorganic Chemicals
II.B.3. Economic Trends
Inorganic Chemicals Industry
The Bureau of the Census estimated that there were 1,429 facilities in the inorganic chemical industry in 1992. The industry employed 103,000 people and had a total value of shipments of $27.4 billion. The total value of shipments for the inorganic chemicals industry increased about one percent per year between 1992 and 1994. These values do not include inorganic chemicals manufactured for captive use within a facility nor the value of other non-industrial inorganic chemical products manufactured by the same facility. It does, however, include intra-company transfers which are significant in this industry. The inorganic chemical industry's growth rate is expected to continue to increase with the growth of the economy. The U.S. is a net exporter of inorganic chemicals with most exports shipped to the European Community (EC) followed by Canada and Mexico. This positive trade balance increased significantly in 1993 to $1.7 billion and is expected to continue as the European economy improves. By comparison, the 1992 Census of Manufactures for Industrial Organic Chemicals reports a 1992 value of shipments for organic chemicals of $64.5 billion and a total employment of 125,100 people. The 1992 value of shipments for the entire chemical industry (SIC 28) totaled $292.3 billion with an employment of 850,000 people.10
Because inorganic chemicals are used in the manufacturing of many products, the industry tends to grow at the same rate as overall industrial production. In the late 1980s, the industry experienced high growth rates and, in the early 1990s, the industry saw little real growth in output, as a reflection of the U.S. economy's recession. The industry has historically had low profit margins which, in recent years, have decreased further with increasing pollution abatement costs.11
Chlor-alkali Sector
The Bureau of the Census data for 1992 shows that there were 51 facilities within the inorganic chemicals industry that manufactured alkalies and chlorine. These chlor-alkali facilities employed 8,000 people and had a total value of shipments of $2.8 billion. This was an increase of 1.7 percent from 1991. The chlor-alkali industry as a whole is expected to grow at its past rate of 1.5 times gross domestic product (GDP) growth through the 1990s. Because chlorine and caustic soda are electrolysis co-products, the production of one product can depend on the demand of the other product. The market pull has switched several times between caustic soda and chlorine in the past few decades. Presently, chlorine demand is controlling production;
September 1995 10 SIC 281

Sector Notebook Project Inorganic Chemicals
consequently, there is a current excess availability of caustic soda in the U.S. This excess material is typically exported to fill a significant demand outside the U.S. The consumption of caustic soda is growing faster than the consumption of chlorine, however, and domestic caustic soda demand is expected to control production in the coming years.12
After reaching record high levels in the late 1970s, chlorine production declined in the early 1980s due in part to the economic recession between 1980 and 1982. Chlorine production increased slowly through the 1980s and, as of 1992, had not reached the record high levels and growth rates of the 1970s. This is due in part to the relative maturity of the chlorine usage industries and more recent environmental pressures aimed at curtailing chlorine use. Regulatory restrictions on the production or disposal of some products which require large amounts of chlorine to manufacture (i.e., chlorofluorocarbons, PVC, and chlorinated solvents) have adversely affected the market. Chlorine's commercial appeal has been further reduced by initiatives such as the International Joint Commission of Great Lakes Water Quality (a Canada-U.S. environmental oversight group) and a number of environmental groups which call for a gradual phaseout or an immediate ban of chlorine and chlorinated compounds as industrial feedstocks.13
The production of caustic soda is very dependent on the short term and long term chlorine demand and production because chlorine cannot be stored economically. Increased demand for chlorine must be met immediately by increased chlorine production via electrolysis of brine and, consequently, caustic soda production. Domestic and export demand for caustic soda was very strong in the 1980s with the pick up of the world economy and an increase in pulp and paper production. In the late 1980s, there was a worldwide shortage of caustic soda due to increased demand and lower U.S. chlorine production. The demand for caustic soda is expected to continue to grow in the coming years; however, there are a number of uncertainties that may limit the growth rate. Some industries have begun switching from caustic soda to soda ash where possible to avoid caustic soda shortages. Soda ash, which is extremely plentiful in the U.S., is obtained almost entirely from natural sources of trona ore. Demand for caustic soda may also decrease as pulp mills increase their reclamation of caustic soda from spent pulping liquor.14
September 1995 11 SIC 281


Sector Notebook Project Inorganic Chemicals
III. INDUSTRIAL PROCESS DESCRIPTION
This section describes the major industrial processes within the inorganic chemical industry, including the materials and equipment used, and the processes employed. The section is designed for those interested in gaining a general understanding of the industry, and for those interested in the inter-relationship between the industrial process and the topics described in subsequent sections of this profile -- pollutant outputs, pollution prevention opportunities, and Federal regulations. This section does not attempt to replicate published engineering information that is available for this industry. Refer to Section IX for a list of reference documents that are available.
This section specifically contains a description of commonly used production processes, associated raw materials, the byproducts produced or released, and the materials either recycled or transferred off-site. This discussion, coupled with schematic drawings of the identified processes, provide a concise description of where wastes may be produced in the process. This section also describes the potential fate (via air, water, and soil pathways) of these waste products.
III.A. Industrial Processes in the Inorganic Chemical Industry
Chlorine and caustic soda are co-products of electrolysis of saturated aqueous solutions of sodium chloride, NaCl (salt water or brine). In addition, relatively small amounts (by weight) of hydrogen gas are produced in the process. The overall chemical reaction is as follows:
2 NaCl + 2 H2O v 2 NaOH + Cl2 + H2
Energy, in the form of direct current (d-c) electricity, is supplied to drive the reaction. The amount of electrical energy required depends on the design of the electrolytic cell, the voltage used, and the concentration of brine used. For each ton of chlorine produced, 1.1 tons of sodium hydroxide and 28 kilograms of hydrogen are produced.
Three types of electrolysis processes are used for the manufacture of chlorine, caustic soda, and hydrogen from brine:
C Mercury Cell ProcessC Diaphragm Cell ProcessC Membrane Cell Process
Virtually all chlorine produced in the U.S. is manufactured by one of these three electrolysis processes. Each electrolytic cell consists of an anode and
September 1995 13 SIC 281

Sector Notebook Project Inorganic Chemicals
cathode in contact with the brine solution. Exhibit 5 shows the basic elements, inputs and outputs of each type of electrolytic cell. The distinguishing feature of each cell type is the method employed to separate and prevent the mixing of the chlorine gas and sodium hydroxide. Consequently, each process produces a different purity of chlorine gas and a different concentration of caustic soda. Exhibit 6 is a summary of the major differences between each cell type. In 1988, diaphragm cells accounted for 76 percent of all domestic chlorine production, followed by mercury cells with 17 percent, and membrane cells with five percent. The industry is moving away from mercury and diaphragm cells and is moving towards the use of membrane cells. Membrane cells are a relatively recent development which have fewer adverse effects on the environment and produce a higher quality product at a lower cost than the other methods.15,16
September 1995 14 SIC 281

Sector Notebook Project Inorganic Chemicals
Exhibit 5: Chlorine Electrolysis Cells
September 1995 15 SIC 281

Sector Notebook Project Inorganic Chemicals
(Source: Kirk-Othmer Encyclopedia of Chemical Technology, 4th Edition, 1994.)
Exhibit 6: Main Characteristics of the Different Electrolysis Processes
Component Mercury Cell Diaphragm Cell Membrane Cell
Cathode Mercury flowing over steel
Steel or steel coated with activated nickel
Steel or nickel with a nickel based catalytic coating
Diaphragm/ Membrane
None Asbestos or polymer modified asbestos
Ion-exchange membrane
Anode Titanium with RuO2
or TiO coating2
(DSA anode)
Titanium with RuO or TiO coating (DSA anode)
2
2
Titanium with RuO or TiO coating (DSA anode)
2
2
Cathode Product
Sodium amalgam 10-12% NaOH with 15-17% NaCl and H2
30-33% NaOH and H2
Decomposer/ 50% NaOH and H Evaporator Product
from decomposer 2 50% NaOH with 1%
NaCl and solid salt from evaporator
50% NaOH with very little salt
Electricity Consumption Cl
3,300 kWh per ton
2
2,750 kWh per ton Cl2
2,100-2,450 kWh per ton NaOH
Source: Kirk-Othmer Encyclopedia of Chemical Technology, 4th Edition, 1994.
III.A.1. Mercury Cell
The mercury cell process consists of slightly inclined steel troughs through which a thin layer of mercury (about three mm) flows over the bottom (Exhibit 7). The cells are operated at 75 to 85 EC and atmospheric pressure. The mercury layer serves as the cathode for the process and the saturated brine solution (25.5 percent NaCl by weight) flows through the troughs above the mercury. The anodes are usually incorporated into the cell covers and are suspended horizontally in the brine solution. The height of the anodes within the brine is adjusted to the optimal height either manually or through an automatic computer controlled system.17
Electrolytic cell anodes were made of graphite until the late 1960s when anodes of titanium coated with ruthenium oxide (RuO2) and titanium oxide (TiO2) were developed. The RuO2 and TiO2 anodes, termed DSA (dimensionally stable) anodes, are more stable than the graphite anodes (i.e., they do not need to be replaced as frequently) and are more energy efficient.18
September 1995 16 SIC 281

Sector Notebook Project Inorganic Chemicals
Exhibit 7: Mercury Electrolysis Cell and Flow Diagram
(Source: Industrial Inorganic Chemistry, Büchner, et al., 1989.)
The chlorine gas is produced at the anodes where it moves upward through gas extraction slits in the cell covers. Sodium ions are absorbed by the mercury layer and the resulting sodium and mercury mixture, called the amalgam, is processed in "decomposer" cells to generate sodium hydroxide and reusable mercury. The amalgam entering the decomposer cell has a sodium concentration of approximately 0.2 to 0.5 percent by weight. The decomposer consists of a short-circuited electrical cell where graphite serves as the anode and the amalgam serves as the cathode. The amalgam and water flowing through the cell come into direct contact with the graphite. The hydrolysis of the water on the graphite in the presence of the amalgam results in a strong exothermic reaction generating mercury to be reused in the electrolytic cell, a 50 percent caustic soda solution, and hydrogen gas. Mercury cells are operated to maintain a 21 to 22 percent by weight NaCl concentration in the depleted brine leaving the cell. The dissolved chlorine is removed from the depleted brine solution, which is then resaturated with solid salt and purified for further use. Some facilities purge small amounts of brine solution and use new brine as make-up in order to prevent the build up of sulfate impurities in the brine.19,20
September 1995 17 SIC 281

Sector Notebook Project Inorganic Chemicals
The mercury process has the advantage over diaphragm and membrane cells in that it produces a pure chlorine gas with no oxygen, and a pure 50 percent caustic soda solution without having to further concentrate a more dilute solution. However, mercury cells operate at a higher voltage than diaphragm and membrane cells and, therefore, use more energy. The process also requires a very pure brine solution with little or no metal contaminants. Furthermore, elaborate precautions must be taken to avoid releases of mercury to the environment.
III.A.2. Diaphragm Cell
In the diaphragm cell process, multiple cells consisting of DSA anode plates and cathodes are mounted vertically and parallel to each other (Exhibit 8). Each cell consists of one anode and cathode pair. The cathodes are typically flat hollow steel mesh or perforated steel structures covered with asbestos fibers, which serve as the diaphragm. The asbestos fiber structure of the diaphragm prevents the mixing of hydrogen and chlorine by allowing liquid to pass through to the cathode, but not fine bubbles of chlorine gas formed at the anodes. The diaphragm also hinders the back-diffusion to the anode of
-hydroxide (OH ) ions formed at the cathode. The cells are operated at 90 to95 EC and atmospheric pressure. Brine flows continuously into the anode chamber and, subsequently, through the diaphragm to the cathode. As in the mercury cell process, chlorine gas is formed at the anodes; however, in the diaphragm process, caustic soda solution and hydrogen gas are formed directly at the cathode. The chlorine gas is drawn off from above the anodes for further processing. The hydrogen gas is drawn off separately from the cathode chambers.21,22
Two basic types of diaphragm cells are in use today. The first, monopolar cells, have an electrode arrangement in which the anodes and cathodes are arranged in parallel. As a result of this configuration, all cells have the same voltage of about three to four volts; up to 200 cells can be constructed in one circuit. The second basic type of diaphragm cell is the bipolar cell, in which the anode of one cell is directly connected to the cathode of the next cell unit. This type of arrangement minimizes voltage loss between cells; however, since the total voltage across the entire set of cells is the sum of the individual cell voltages, the number of cells per unit is limited. To compensate for the reduced anode and cathode surface area in the bipolar configuration, bipolar units tend to be much larger than monopolar units. Production of chlorine and caustic soda by the diaphragm process is split approximately equally between monopolar and bipolar systems.23
September 1995 18 SIC 281

Sector Notebook Project Inorganic Chemicals
Exhibit 8: Typical Diaphragm Electrolysis Cell and Flow Diagram
(Source: Industrial Inorganic Chemistry, Büchner, et al., 1989)
Diaphragm cells are operated such that about 50 percent of the input NaCl is decomposed resulting in an effluent mixture of brine and caustic soda solution containing eight to 12 percent NaOH and 12 to 18 percent NaCl by weight. This solution is evaporated to 50 percent NaOH by weight at which point all of the salt, except a residual 1.0 to 1.5 percent by weight, precipitates out. The salt generated is very pure and is typically used to make more brine. Because the brine and caustic soda solution are mixed in a single effluent, a fresh brine solution (no recycled brine) is constantly entering the system. The diaphragm cell process does not, therefore, require a brine purge to prevent sulfate build up, or treatment to remove entrained chlorine gas, as in the mercury cell process.24
Diaphragms are constructed of asbestos because of its chemical and physical stability and because it is a relatively inexpensive and abundant material. Beginning in the early 1970s, asbestos diaphragms began to be replaced by diaphragms containing 75 percent asbestos and 25 percent fibrous
September 1995 19 SIC 281
Sector Notebook Project Inorganic Chemicals
polytetrafluoroethylene (PTFE). These diaphragms, trade named Modified Diaphragms, are more stable and operate more efficiently than the fully asbestos diaphragms. Modified Diaphragms are the most common diaphragms currently in use.25
Diaphragm cells have the advantage of operating at a lower voltage than mercury cells and, therefore, use less electricity. In addition, the brine entering a diaphragm cell can be less pure than that required by mercury and membrane cells. The chlorine gas produced by the diaphragm process, however, is not pure and must be processed to remove oxygen, water, salt, and sodium hydroxide. Another disadvantage of the process is that the caustic soda produced contains chlorides and requires evaporation to bring it to a usable concentration.26
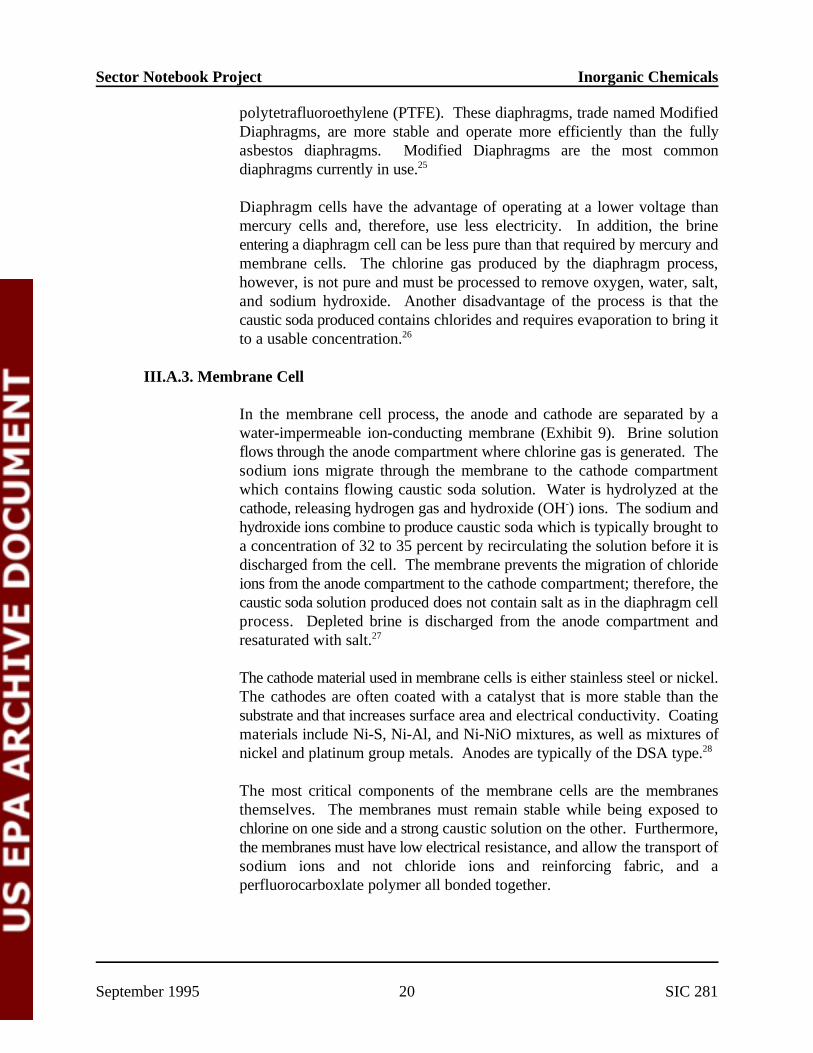
III.A.3. Membrane Cell
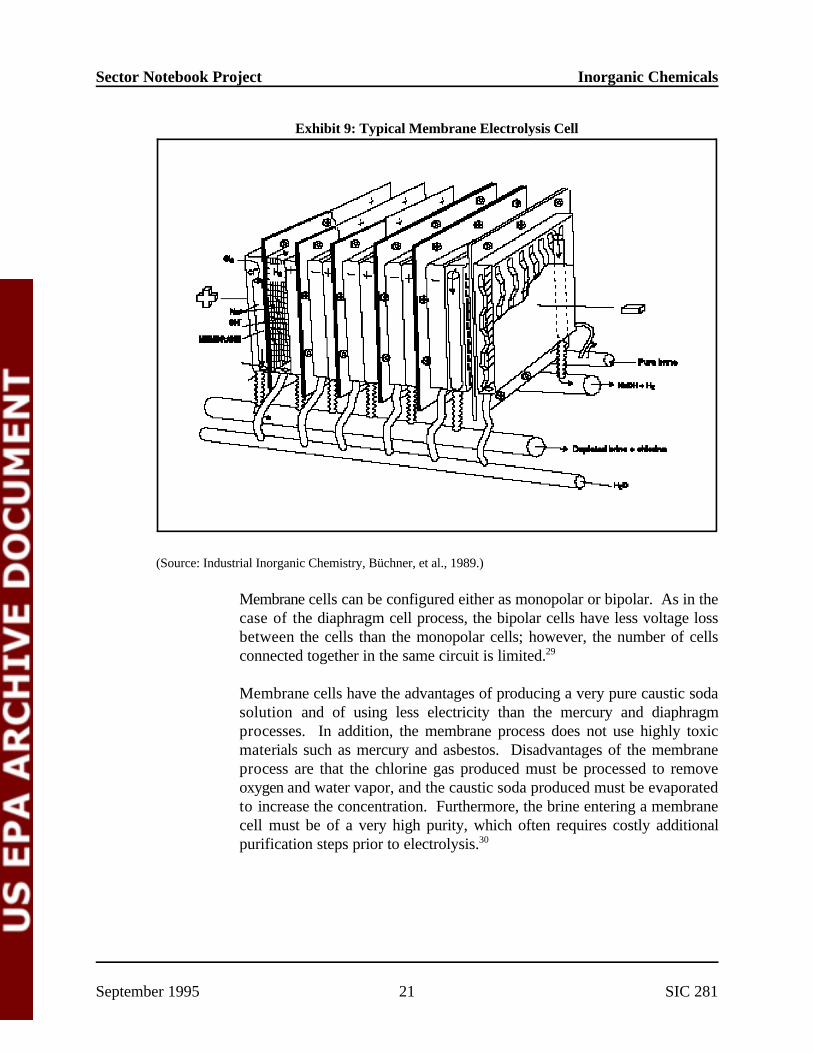
In the membrane cell process, the anode and cathode are separated by a water-impermeable ion-conducting membrane (Exhibit 9). Brine solution flows through the anode compartment where chlorine gas is generated. The sodium ions migrate through the membrane to the cathode compartment which contains flowing caustic soda solution. Water is hydrolyzed at the
-cathode, releasing hydrogen gas and hydroxide (OH ) ions. The sodium andhydroxide ions combine to produce caustic soda which is typically brought to a concentration of 32 to 35 percent by recirculating the solution before it is discharged from the cell. The membrane prevents the migration of chloride ions from the anode compartment to the cathode compartment; therefore, the caustic soda solution produced does not contain salt as in the diaphragm cell process. Depleted brine is discharged from the anode compartment and resaturated with salt.27
The cathode material used in membrane cells is either stainless steel or nickel. The cathodes are often coated with a catalyst that is more stable than the substrate and that increases surface area and electrical conductivity. Coating materials include Ni-S, Ni-Al, and Ni-NiO mixtures, as well as mixtures of nickel and platinum group metals. Anodes are typically of the DSA type.28
The most critical components of the membrane cells are the membranes themselves. The membranes must remain stable while being exposed to chlorine on one side and a strong caustic solution on the other. Furthermore, the membranes must have low electrical resistance, and allow the transport of sodium ions and not chloride ions and reinforcing fabric, and a perfluorocarboxlate polymer all bonded together.
September 1995 20 SIC 281
Sector Notebook Project Inorganic Chemicals
Exhibit 9: Typical Membrane Electrolysis Cell
(Source: Industrial Inorganic Chemistry, Büchner, et al., 1989.)
Membrane cells can be configured either as monopolar or bipolar. As in the case of the diaphragm cell process, the bipolar cells have less voltage loss between the cells than the monopolar cells; however, the number of cells connected together in the same circuit is limited.29
Membrane cells have the advantages of producing a very pure caustic soda solution and of using less electricity than the mercury and diaphragm processes. In addition, the membrane process does not use highly toxic materials such as mercury and asbestos. Disadvantages of the membrane process are that the chlorine gas produced must be processed to remove oxygen and water vapor, and the caustic soda produced must be evaporated to increase the concentration. Furthermore, the brine entering a membrane cell must be of a very high purity, which often requires costly additional purification steps prior to electrolysis.30
September 1995 21 SIC 281

Sector Notebook Project Inorganic Chemicals
III.A.4. Auxiliary Processes
Brine Purification
Approximately 70 percent of the salt used in chlorine gas production is extracted from natural salt deposits; the remainder is evaporated from seawater. Salt from natural deposits is either mined in solid form or is leached from the subsurface. Leaching involves the injection of freshwater into subterranean salt deposits and pumping out brine solution. Brine production from seawater typically occurs by solar evaporation in a series of ponds to concentrate the seawater, precipitate out impurities, and precipitate out solid sodium chloride. Regardless of the method used to obtain the salt, it will contain impurities that must be removed before being used in the electrolysis process. Impurities primarily consist of calcium, magnesium, barium, iron, aluminum, sulfates, and trace metals. Impurities can significantly reduce the efficiency of the electrolytic cells, by precipitating out and subsequently blocking a diaphragm or damaging a membrane depending on the process used. Certain trace metals, such as vanadium, reduce the efficiency of mercury cells and cause the production of potentially dangerous amounts of hydrogen gas. Removal of impurities accounts for a significant portion of the overall costs of chlor-alkali production, especially in the membrane process.31
In addition to the dissolved natural impurities, chlorine must be removed from the recycled brine solutions used in mercury and membrane processes. Dissolved chlorine gas entering the anode chamber in the brine solution will react with hydroxide ions formed at the cathode to form chlorate which reduces product yields. In addition, chlorine gas in the brine solution will cause corrosion of pipes, pumps, and containers during further processing of the brine. In a typical chlorine plant, HCl is added to the brine solution leaving the cells to liberate the chlorine gas. A vacuum is applied to the solution to collect the chlorine gas for further treatment. To further reduce the chlorine levels, sodium sulfite or another reducing agent is added to remove the final traces of chlorine. Dechlorinated brine is then resaturated with solid salt before further treating to remove impurities.32
Depending on the amount of impurities in the salt and the electrolysis process utilized, different purification steps will be required. Brine solution is typically heated before treatment to improve reaction times and precipitation of impurities. Calcium carbonate impurities are precipitated out through treatment with sodium carbonate; magnesium, iron, and aluminum are precipitated out through treatment with sodium hydroxide; and sulfates are precipitated out through the addition of calcium chloride or barium carbonate. Most trace metals are also precipitated out through these processes. Flocculants are sometimes added to the clarifying equipment to improve
September 1995 22 SIC 281
Sector Notebook Project Inorganic Chemicals
settling. The sludges generated in this process are washed to recover entrained sodium chloride. Following the clarification steps, the brine solution is typically passed through sand filters followed by polishing filters. The brine passing through these steps will contain less than four parts per million (ppm) calcium and 0.5 ppm magnesium which is sufficient purification for the diaphragm and mercury cell processes. For brine to be used in the membrane process, however, requires a combined calcium and magnesium content of less than 20 parts per billion (ppb). Brine for the membrane process is, therefore, passed through ion exchange columns to further remove impurities.33
Chlorine Processing
The chlorine gas produced by electrolytic processes is saturated with water vapor. Chlorine gas from the diaphragm process also contains liquid droplets of sodium hydroxide and salt solution. The first steps in processing the chlorine to a usable product consists of cooling the chlorine to less than ten degrees centigrade and then passing it through demisters or electrostatic precipitators to remove water and solids. Next the chlorine is passed through packed towers with concentrated sulfuric acid flowing countercurrently. The water vapor is absorbed by the sulfuric acid and the dry chlorine gas is then passed through demisters to remove sulfuric acid mist. If the chlorine is to be liquefied, liquid chlorine is then added to the gas to further purify the chlorine and to prechill it prior to compression. Prechilling is primarily carried out to prevent the temperature from reaching the chlorine-steel ignition point during compression.34
Chlorine gas is either used in gaseous form within the facility, transferred to customers via pipeline, or liquefied for storage or transport. Liquid chlorine is of a higher purity than gaseous chlorine and is either used within the facility or is transferred via rail tank car, tank truck, or tank barge. The demand for liquid chlorine has increased in recent years and, in 1987, accounted for about 81 percent of chlorine produced in the U.S.35
Chlorine liquefaction processes typically liquefy only about 90-95 percent of the chlorine. This gas and the chlorine gas left inside tank truck tanks, rail car tanks, or barges after removal of liquid chlorine is impure and must be recovered in a chlorine recovery unit. The gas is compressed and cooled using cold water followed by Freon. The chilled gas is fed up through a packed column in which carbon tetrachloride flows downward absorbing the chlorine. The chlorine-rich carbon tetrachloride is fed to a chlorine stripper in which the chlorine and carbon tetrachloride separate as they are heated. The chlorine gas is cooled and scrubbed of carbon tetrachloride using liquid chlorine and the resulting pure chlorine is sent to the chlorine liquefaction system.36
Caustic Soda Processing
September 1995 23 SIC 281

Sector Notebook Project Inorganic Chemicals
Caustic soda solution generated from chlor-alkali processes is typically processed to remove impurities and to concentrate it to either a 50 percent or 73 percent water-based solution or to anhydrous caustic soda. The caustic soda from the mercury and membrane processes is relatively pure. Product from the mercury process requires only filtration to remove mercury droplets. The evaporators used to concentrate the caustic soda solution in the diaphragm process are typically multi-stage forced circulation evaporators. The evaporators have salt settling systems to remove precipitated salt. Sodium borohydride is often added to reduce corrosion of the equipment. Evaporators for the membrane process are usually much simpler than those for the diaphragm process because the salt concentration in the membrane cell caustic solution is very low.37
Hydrogen Processing
The hydrogen produced in all of the electrolytic processes contains small amounts of water vapor, sodium hydroxide, and salt which is removed through cooling. The hydrogen produced during the mercury cell process also contains small amounts of mercury which must be removed by cooling the hydrogen gas to condense the mercury and treating with activated carbon.38
III.B. Raw Material Inputs and Pollution Outputs in the Production Line
Inputs and pollutant outputs of the chlor-alkali industry are relatively small both in number and volume in comparison to the chemical manufacturing industry as a whole. The inputs are primarily salt and water as feedstocks; acids and chemical precipitants used to remove impurities in the input brine or output chlorine and caustic soda; and freon used for liquefying and purifying the chlorine gas produced. The major pollutant outputs from all three electrolytic processes are chlorine gas emissions (both fugitive and point source); spent acids; freon (both fugitive and point source); impurities removed from the input salt or brine; and pollutants originating from electrolytic cell materials and other system parts.
Pollutant outputs have decreased in recent years as the industry moves away from the mercury and diaphragm cell processes to the more efficient (in terms of material and energy inputs and outputs) membrane cell process. In addition, improved cell part materials have been developed, such as DSA anodes and Modified Diaphragms, which are more stable and create less undesirable byproducts.
Inputs and pollutant outputs from the auxiliary processes such as brine purification, chlorine processing, caustic soda processing, and hydrogen processing are described in Section III.B.4.
September 1995 24 SIC 281

Sector Notebook Project Inorganic Chemicals
III.B.1. Mercury Cell
Wastewater streams from mercury cell facilities arise from the chlorine drying process, brine purge, and miscellaneous sources. Small amounts of mercury are found in the brine purge and miscellaneous sources which include floor sumps and cell wash water. Before treatment, mercury concentrations (principally in the form of mercuric chloride, HgCl4
2-) typically range from 0 to 20 ppm. Thereby segregating most mercury bearing wastewater streams from non-mercury bearing wastewater streams. Prior to treatment, sodium hydrosulfide is used to precipitate mercuric sulfide. The mercuric sulfide is removed through filtration before the water is discharged.39
Air emissions consist of mercury vapor and chlorine gas released in relatively small amounts as fugitive emissions from the cells; and in the tail gases of the chlorine processing, caustic soda processing, and hydrogen processing. Process tail gases are wet scrubbed with caustic soda or soda ash solutions to remove chlorine and mercury vapor. Residual chlorine emissions in tail gases after treatment are less than one kg per 1,000 kg of chlorine produced and mercury emissions are negligible. The tail gas scrubber water is typically reused as brine make-up water.40
Solid wastes containing mercury include: solids generated during brine purification; spent graphite from decomposer cells; spent caustic filtration cartridges from the filtration of caustic soda solution; spilled mercury from facility sumps; and mercury cell "butters," which are semisolid amalgams of mercury with barium or iron formed when an excess of barium is used during salt purification. Most mercury bearing solid wastes are shipped off-site to outside reclaimers who recover the mercury. The remaining wastes are disposed of in secure landfills using either chemical or physical methods to recover maximum feasible amount of mercury.41
III.B.2. Diaphragm Cell
Wastewater streams from the diaphragm cell process originate from the barometric condenser during caustic soda evaporation, chlorine drying, and from purification of salt recovered from the evaporators. These wastewaters and their treatment are described below in Section III.B.4. The use of lead and graphite anodes and asbestos diaphragms generates lead, asbestos, and chlorinated hydrocarbons in the caustic soda and chlorine processing waste streams. Lead salts and chlorinated hydrocarbons are generated from corrosion of the anodes, and asbestos particles are formed by the degradation of the diaphragm with use. Over the past twenty years, all but a few diaphragm cell facilities have switched from the use of lead and graphite anodes with asbestos diaphragms to DSA anodes and Modified Diaphragms which resist corrosion and degradation. The lead, asbestos, and chlorinated
September 1995 25 SIC 281

Sector Notebook Project Inorganic Chemicals
hydrocarbon contaminants are, therefore, no longer discharged in significant amounts from most diaphragm cell chlor-alkali facilities. Those facilities that discharged caustic processing wastewater streams to on-site lagoons may, however, still have significant levels of these contaminants on-site.42
Chlorine is released in relatively small amounts as fugitive emissions from the cells and in the process tail gases. Process tail gases are wet scrubbed with soda ash or caustic soda solutions to remove chlorine. Residual chlorine emissions in tail gases after treatment are negligible. The spent caustic solution is neutralized prior to discharge.43
Solid wastes generated in the diaphragm process consist primarily of solids generated during brine purification and scrapped cell parts including, cell covers, piping and used diaphragms. Discarded cell parts are either landfilled on-site, as is typically the case for spent diaphragms, or shipped off-site for disposal. Used cathodes and DSA anodes are shipped off-site for recovery of their titanium content.44
III.B.3. Membrane Cell
Wastewater from the diaphragm cell process originates from the barometric condenser during caustic soda evaporation, chlorine drying, and wash water from the ion exchange resin used to purify the brine solution. The ion exchange wash water consists of dilute hydrochloric acid with small amounts of dissolved calcium, magnesium, and aluminum chloride. The wastewater is combined with the other process wastewaters and treated by neutralization.45
Chlorine is released in relatively small amounts as fugitive emissions from the cells and in the process tail gases. Process tail gases are wet scrubbed with soda ash or caustic soda solutions to remove chlorine. Residual chlorine emissions in tail gases after treatment are negligible. The spent caustic solution is neutralized prior to discharge.46
Solid waste generated in the diaphragm process consists primarily of solids generated during brine purification and used cell parts which include membranes, cathodes and DSA anodes. The used membranes are typically returned to the supplier and the used cathodes and DSA anodes are shipped off-site for recovery of their titanium content.47
III.B.4. Auxiliary Processes
Brine Purification
Brine solutions are typically treated with a number of chemicals to remove impurities prior to input to the electrolytic cells. In the case of mercury and
September 1995 26 SIC 281

Sector Notebook Project Inorganic Chemicals
membrane cell systems, the brine is first acidified with HCl to remove dissolved chlorine. Next, sodium hydroxide and sodium carbonate are added to precipitate calcium and magnesium ions as calcium carbonate and magnesium hydroxide. Barium carbonate is then added to remove sulfates which precipitate out as barium sulfate. The precipitants are removed from the brine solution by settling and filtration. Pollutant outputs from this process include fugitive chlorine emissions and brine muds.48
Brine muds are one of the largest waste streams of the chlor-alkali industry. On average, about 30 kilograms (kg) of brine mud are generated for every 1,000 kg of chlorine produced. The volume of mud will vary, however, depending on the purity of the salt used. Some facilities use pre-purified (i.e., chemical grade) evaporated salts which will produce only 0.7 to 6.0 kg of brine mud per 1,000 kg of chlorine produced. Brine mud typically contains magnesium hydroxide, calcium carbonate, and, in most cases, barium sulfate. Mercury cell brine muds usually contain mercury either in the elemental form or as the complex ion, mercuric chloride (HgCl4
2-). Mercury- containing brine muds are typically disposed of in a RCRA Subtitle C landfill after treatment with sodium sulfide which converts the mercury to an insoluble sulfide.49
Brine muds are usually segregated from other process wastes and stored in lagoons on-site. When the lagoons become filled, the brine mud is either dredged and landfilled off-site, or drained and covered over. Some plants that use brine solution leached from subterranean deposits inject brine muds into the salt cavities that are no longer being used.50
Chlorine Processing
The chlorine gas recovered from electrolytic cells is cooled to remove water vapor. The condensed water is usually recycled as brine make-up although some facilities combine this waste stream with other waterborne waste streams prior to treatment. The remaining water vapor is removed by scrubbing the chlorine gas with concentrated sulfuric acid. The chlorine gas is then compressed and cooled to form liquid chlorine. Between six kg and 35 kg of 79 percent sulfuric acid wastewater is generated per 1,000 kg of chlorine produced. The majority of the spent sulfuric acid waste is shipped off-site for refortification to concentrated sulfuric acid or for use in other processes. The remainder is used to control effluent pH and/or is discharged to water or land disposed.51
The process of purifying and liquefying impure chlorine gas involves the absorption of the chlorine in a stream of carbon tetrachloride. The chlorine is subsequently removed in a stripping process in which the carbon tetrachloride is either recovered and reused, or is vented to the atmosphere.52
September 1995 27 SIC 281

Sector Notebook Project Inorganic Chemicals
Caustic Soda Processing
Caustic soda solution generated from chlor-alkali processes is typically processed to remove impurities and, in the case of the diaphragm and membrane processes, is concentrated to either a 50 percent or 73 percent water-based solution or to anhydrous caustic soda. About five tons of water must be evaporated per ton of 50 percent caustic soda solution produced. The water vapor from the evaporators is condensed in barometric condensers and, in the case of the diaphragm process, will primarily contain about 15 percent caustic soda solution and high concentrations of salt. If sodium sulfate is not removed during the brine purification process, salt recovered from the evaporators is often recrystallized to avoid sulfate buildup in the brine. If the salt is recrystallized, the wastewater from sodium hydroxide processing will also contain sodium sulfates. Significant levels of copper may also be present in the wastewater due to corrosion of pipes and other equipment. Wastewater from the membrane process contains caustic soda solution and virtually no salt or sodium sulfates.53
Caustic soda processing wastewater is typically neutralized with hydrochloric acid, lagooned, and then discharged directly to a receiving water or land disposed. The caustic soda generated from the mercury process only requires filtration to remove mercury droplets which are typically recovered for reuse.
Hydrogen Processing
The hydrogen produced in all of the electrolytic processes contains small amounts of water vapor, sodium hydroxide, and salt which is removed through cooling. Condensed salt water and sodium hydroxide solution is either recycled as brine make-up or treated with other waterborne waste streams. The hydrogen produced during the mercury cell process, however, also contains small amounts of mercury which must be removed prior to liquefaction. Most of the entrained mercury is extracted by cooling the gas. The condensed mercury is then returned to the electrolytic cells. Some facilities further purify the hydrogen gas of mercury using activated carbon treatment. Spent activated carbon is typically shipped off-site as a hazardous waste.54
III.C. Management of Chemicals In Wastestream
The Pollution Prevention Act of 1990 (PPA) requires facilities to report information about the management of TRI chemicals in waste and efforts made to eliminate or reduce those quantities. These data have been collected annually in Section 8 of the TRI reporting Form R beginning with the 1991 reporting year. The data summarized below cover the years 1992-1995 and is meant to provide a basic understanding of the quantities of waste handled
September 1995 28 SIC 281

Sector Notebook Project Inorganic Chemicals
by the industry, the methods typically used to manage this waste, and recent trends in these methods. TRI waste management data can be used to assess trends in source reduction within individual industries and facilities, and for specific TRI chemicals. This information could then be used as a tool in identifying opportunities for pollution prevention compliance assistance activities.
From the yearly data presented below it is apparent that the portion of TRI wastes reported as recycled on-site has increased and the portions treated or managed through treatment on-site have decreased between 1992 and 1995 (projected). While the quantities reported for 1992 and 1993 are estimates of quantities already managed, the quantities reported for 1994 and 1995 are projections only. The PPA requires these projections to encourage facilities to consider future waste generation and source reduction of those quantities as well as movement up the waste management hierarchy. Future-year estimates are not commitments that facilities reporting under TRI are required to meet.
Exhibit 10 shows that the inorganic chemicals industry managed about 1.7 trillion pounds of production-related waste (total quantity of TRI chemicals in the waste from routine production operations) in 1993 (column B). Column C reveals that of this production-related waste, 15 percent was either transferred off-site or released to the environment. Column C is calculated by dividing the total TRI transfers and releases by the total quantity of production-related waste. In other words, about 85 percent of the industry’s TRI wastes were managed on-site through recycling, energy recovery, or treatment as shown in columns E, F and G, respectively. The majority of waste that is released or transferred off-site can be divided into portions that are recycled off-site, recovered for energy off-site, or treated off-site as shown in columns H, I and J, respectively. The remaining portion of the production related wastes (11 percent), shown in column D, is either released to the environment through direct discharges to air, land, water, and underground injection, or it is disposed off-site.
September 1995 29 SIC 281

---
---
Sector Notebook Project Inorganic Chemicals
Exhibit 10: Source Reduction and Recycling Activity for Inorganic Chemicals Industry (SIC 281) as Reported within TRI
A B C D On-Site Off-Site
Year (10 lbs.)
Quantity of Production-
Related Waste
6 a Transferred
% Released and
b Off-site
% Released and
Disposedc E F G H I J
% Recycled
% Energy Recovery
% Treated
% Recycled
% Energy Recovery
% Treated
1992 1,642 16% 12% 42% 0% 42% <1% <1% 3%
1993 1,712 15% 11% 45% 0% 40% <1% <1% 3%
1994 1,759 11% 47% <1% 39% <1% <1% 3%
1995 1,732 10% 48% 0% 40% <1% <1% 3%
Within this industry sector, non-production related waste is < 1% of production related wastes for 1993.a
Total TRI transfers and releases as reported in Section 5 and 6 of Form R as a percentage of production relatedb
wastes. Percentage of production related waste released to the environment and transferred off-site for disposal.c
September 1995 30 SIC 281

Sector Notebook Project Inorganic Chemicals
IV. CHEMICAL RELEASE AND TRANSFER PROFILE
This section is designed to provide background information on the pollutant releases that are reported by this industry. The best source of comparative pollutant release information is the Toxic Release Inventory System (TRI). Pursuant to the Emergency Planning and Community Right-to-Know Act, TRI includes self-reported facility release and transfer data for over 600 toxic chemicals. Facilities within SIC Codes 20-39 (manufacturing industries) that have more than 10 employees, and that are above weight-based reporting thresholds are required to report TRI on-site releases and off-site transfers. TRI is not specific to the chemical industry. The information presented within the sector notebooks is derived from the most recently available (1993) TRI reporting year (which then included 316 chemicals), and focuses primarily on the on-site releases reported by each sector. Because TRI requires consistent reporting regardless of sector, it is an excellent tool for drawing comparisons across industries.
Although this sector notebook does not present historical information regarding TRI chemical releases, please note that in general, toxic chemical releases across all industries have been declining. In fact, according to the 1993 Toxic Release Inventory Data Book, reported releases dropped by 42.7 percent between 1988 and 1993. Although on-site releases have decreased, the total amount of reported toxic waste has not declined because the amount of toxic chemicals transferred off-site has increased. Transfers have increased from 3.7 billion pounds in 1991 to 4.7 billion pounds in 1993. Better management practices have led to increases in off-site transfers of toxic chemicals for recycling. More detailed information can be obtained from EPA's annual Toxics Release Inventory Public Data Release book (which is available through the EPCRA Hotline at 800-535-0202), or directly from the Toxic Release Inventory System database (for user support call 202-260-1531).
Wherever possible, the sector notebooks present TRI data as the primary indicator of chemical release within each industrial category. TRI data provide the type, amount and media receptor of each chemical released or transferred. When other sources of pollutant release data have been obtained, these data have been included to augment the TRI information.
TRI Data Limitations
The reader should keep in mind the following limitations regarding TRI data. Within some sectors, the majority of facilities are not subject to TRI reporting because they are not considered manufacturing industries, or because they are below TRI reporting thresholds. Examples are the mining, dry cleaning,
September 1995 31 SIC 281

Sector Notebook Project Inorganic Chemicals
printing, and transportation equipment cleaning sectors. For these sectors, release information from other sources has been included.
The reader should also be aware that TRI "pounds released" data presented within the notebooks is not equivalent to a "risk" ranking for each industry. Weighting each pound of release equally does not factor in the relative toxicity of each chemical that is released. The Agency is in the process of developing an approach to assign toxicological weightings to each chemical released so that one can differentiate between pollutants with significant differences in toxicity. As a preliminary indicator of the environmental impact of the industry's most commonly released chemicals, the notebook briefly summarizes the toxicological properties of the top chemicals (by weight) reported by each industry.
Definitions Associated With Section IV Data Tables
General Definitions
SIC Code -- is the Standard Industrial Classification (SIC) is a statistical classification standard used for all establishment-based Federal economic statistics. The SIC codes facilitate comparisons between facility and industry data.
TRI Facilities -- are manufacturing facilities that have 10 or more full-time employees and are above established chemical throughput thresholds. Manufacturing facilities are defined as facilities in Standard Industrial Classification primary codes 20-39. Facilities must submit estimates for all chemicals that are on the EPA's defined list and are above throughput thresholds.
Data Table Column Heading Definitions
The following definitions are based upon standard definitions developed by EPA’s Toxic Release Inventory Program. The categories below represent the possible pollutant destinations that can be reported.
RELEASES -- are an on-site discharge of a toxic chemical to the environment. This includes emissions to the air, discharges to bodies of water, releases at the facility to land, as well as contained disposal into underground injection wells.
Releases to Air (Point and Fugitive Air Emissions) -- include all air emissions from industry activity. Point emission occur through confined air streams as found in stacks, ducts, or pipes. Fugitive emissions include losses
September 1995 32 SIC 281

Sector Notebook Project Inorganic Chemicals
from equipment leaks, or evaporative losses from impoundments, spills, or leaks.
Releases to Water (Surface Water Discharges) -- encompass any releases going directly to streams, rivers, lakes, oceans, or other bodies of water. Any estimates for stormwater runoff and non-point losses must also be included.
Releases to Land -- includes disposal of toxic chemicals in waste to on-site landfills, land treated or incorporation into soil, surface impoundments, spills, leaks, or waste piles. These activities must occur within the facility's boundaries for inclusion in this category.
Underground Injection -- is a contained release of a fluid into a subsurface well for the purpose of waste disposal.
TRANSFERS -- is a transfer of toxic chemicals in wastes to a facility that is geographically or physically separate from the facility reporting under TRI. The quantities reported represent a movement of the chemical away from the reporting facility. Except for off-site transfers for disposal, these quantities do not necessarily represent entry of the chemical into the environment.
Transfers to POTWs -- are wastewaters transferred through pipes or sewers to a publicly owned treatments works (POTW). Treatment and chemical removal depend on the chemical's nature and treatment methods used. Chemicals not treated or destroyed by the POTW are generally released to surface waters or landfilled within the sludge.
Transfers to Recycling -- are sent off-site for the purposes of regenerating or recovering still valuable materials. Once these chemicals have been recycled, they may be returned to the originating facility or sold commercially.
Transfers to Energy Recovery -- are wastes combusted off-site in industrial furnaces for energy recovery. Treatment of a chemical by incineration is not considered to be energy recovery.
Transfers to Treatment -- are wastes moved off-site for either neutralization, incineration, biological destruction, or physical separation. In some cases, the chemicals are not destroyed but prepared for further waste management.
Transfers to Disposal -- are wastes taken to another facility for disposal generally as a release to land or as an injection underground.
IV.A. EPA Toxic Release Inventory for the Inorganic Chemical Industry
September 1995 33 SIC 281

Sector Notebook Project Inorganic Chemicals
The 1993 TRI data presented in Exhibits 11 and 12 for inorganic chemicals manufacturing covers 555 facilities. These facilities listed SIC 281 (industrial inorganic chemicals) as a primary SIC code. The Bureau of Census identified 1,429 facilities manufacturing inorganic chemicals. More than half of these facilities, however, have fewer than 20 employees, many of which are likely to be below the TRI reporting thresholds of employment (TRI reporting threshold is greater than 10 employees) and/or chemical use and, therefore, are not required to report to TRI.
According to TRI data, in 1993 the inorganic chemical industry released (discharged to the air, water, or land without treatment) and transferred (shipped off-site) a total of 250 million pounds of 112 different chemical toxic chemicals. This represents about 10 percent of the TRI releases and transfers of the chemical manufacturing industry and about three percent of the total releases and transfers of all manufacturers that year. In comparison, the organic chemical industry (SIC 286) produced 438 million pounds that year, almost twice that of the inorganic chemical industry.55
The chemical industry's releases have been declining in recent years. Between 1988 and 1993 TRI emissions from chemical companies (all those categorized within SIC 28, not just inorganic chemical manufacturers) to air, land, and water were reduced 44 percent, which is slightly above the average for all manufacturing sectors reporting to TRI.56
Because the chemical industry (SIC 28) has historically released more TRI chemicals than any other industry, the EPA has worked to improve environmental performance within this sector. This has been done through a combination of enforcement actions, regulatory requirements, pollution prevention projects, and voluntary programs (e.g. 33/50). In addition, the chemical industry has focused on reducing pollutant releases. For example, the Chemical Manufacturers Association’s (CMA’s) Responsible Care initiative is intended to reduce or eximinate chemical manufacturers’ waste. All 184 members of the CMA, firms that account for the majority of U.S. chemical industry sales and earnings, are required to participate in the program. Participation involves demonstrating a commitment to the program's mandate of continuous improvement in environment, health, and safety. In June of 1994, the CMA approved the use of a third-party verification of management plans to meet these objectives.
Exhibits 11 and 12 present the number and volumes of chemicals released and transferred by inorganic chemical facilities, respectively. The frequency with which chemicals are reported by facilities within a sector is one indication of the diversity of operations and processes. Many of the TRI chemicals are released or transferred by only a small number of facilities which indicates a wide diversity of production processes, particularly for specialty inorganics --
September 1995 34 SIC 281

Sector Notebook Project Inorganic Chemicals
over 70 percent of the 110 chemicals reported are released or transferred by fewer than 10 facilities.
The inorganic chemical industry releases 69 percent of its total TRI poundage to the water (including 67 percent to underground injection and two percent to surface waters), 14 percent to the air, and 17 percent to the land. This release profile differs from other TRI industries which average approximately 30 percent to the water, 59 percent to air, and 10 percent to land. Examining the inorganic chemical industry's TRI reported toxic chemical releases highlights the likely origins of the large water releases for the industry (Exhibit 11).
As presented in Exhibit 11, on-site underground injection of essentially one chemical, hydrochloric acid, accounts for the largest portion, 55 percent, of the inorganic chemical industry's total releases and transfers as reported in TRI. Only five facilities of the 555 identified facilities reported releasing hydrochloric acid through underground injection. Two of these facilities accounted for over 85 percent of the total hydrochloric acid injected to the subsurface, or 42 percent of the inorganic chemical industry's total releases and transfers. Land disposal accounted for the next largest amount, 17 percent, of the industry's total releases. The largest single chemical released to the air by the inorganic chemical industry, carbonyl sulfide, is only emitted by eleven facilities manufacturing certain inorganic pigments.
Discharges to POTWs accounted for 43 percent of the industry’s total transfers of TRI chemicals. Ammonia, hydrochloric acid, and sulfuric acid account for over 66 percent of the 70 million pounds transferred off-site. Finally, approximately 22 million pounds, accounting for 31 percent of the total, are transferred off-site for treatment (Exhibit 12).
September 1995 35 SIC 281

Sector Notebook Project Inorganic Chemicals
Exh
ibit
11:
199
3 R
elea
ses
for
Inor
gani
c C
hem
ical
Man
ufac
turi
ng F
acili
ties
(SI
C 2
81)
in T
RI,
by
Num
ber
of F
acili
ties
Rep
orti
ng
(Rel
ease
s re
port
ed in
pou
nds/
year
)
CH
EM
ICA
L N
AM
E
# R
EP
OR
TIN
G
CH
EM
ICA
L
FU
GIT
IVE
A
IR
PO
INT
A
IR
WA
TE
R
DIS
CH
AR
GE
S U
ND
ER
GR
OU
ND
IN
JEC
TIO
N
LA
ND
D
ISP
OSA
L
TO
TA
L
RE
LE
ASE
S A
VG
. RE
LE
ASE
S P
ER
FA
CIL
ITY
SU
LFU
RIC
AC
ID
311
47,7
43
538,
584
7,48
2 5
29,5
20
623,
334
2,00
4 H
YD
RO
CH
LO
RIC
AC
ID
167
29,4
28
1,42
0,26
2 3,
748
120,
745,
708
213,
351
122,
677,
352
734,
595
AM
MO
NIA
15
2 1,
984,
440
2,72
6,77
4 1,
885,
475
0 1,
162,
987
7,75
9,67
6 51
,051
C
HL
OR
INE
12
1 52
,954
3,
017,
393
6,10
5 0
0 3,
076,
452
25,4
25
PHO
SPH
OR
IC A
CID
72
4,
673
417,
181
500
5 0
422,
359
5,86
6 N
ITR
IC A
CID
71
13
,211
56
,538
25
0 5
0 70
,004
98
6 A
CE
TO
NE
54
40
,304
19
,261
0
0 0
59,5
65
1,10
3 Z
INC
CO
MPO
UN
DS
53
39,1
71
72,7
05
104,
180
0 86
,384
30
2,44
0 5,
706
CH
RO
MIU
M C
OM
POU
ND
S 41
4,
294
13,0
08
33,9
35
0 19
,036
,934
19
,088
,171
46
5,56
5 C
OPP
ER
CO
MPO
UN
DS
33
2,31
7 15
,238
1,
827
0 42
8 19
,810
60
0 N
ICK
EL
CO
MPO
UN
DS
29
1,25
3 20
,000
8,
872
5 34
,289
64
,419
2,
221
ME
TH
AN
OL
28
10
5,22
4 87
8,23
9 77
,887
0
0 1,
061,
350
37,9
05
BA
RIU
M C
OM
POU
ND
S 27
2,
279
8,17
6 5,
629
0 35
3,00
0 36
9,08
4 13
,670
D
ICH
LO
RO
DIF
LU
OR
OM
ET
HA
NE
26
74
1,76
1 54
,302
0
0 0
796,
063
30,6
18
LE
AD
CO
MPO
UN
DS
26
1,37
0 12
,730
28
7 0
58,0
53
72,4
40
2,78
6 M
AN
GA
NE
SE C
OM
POU
ND
S 26
12
4,00
3 14
6,39
3 87
,548
0
7,67
2,76
8 8,
030,
712
308,
874
HY
DR
OG
EN
FL
UO
RID
E
24
93,0
40
84,9
32
5 0
10
177,
987
7,41
6 C
OB
AL
T C
OM
POU
ND
S 21
1,
001
2,01
8 99
6 0
33,4
60
37,4
75
1,78
5 E
TH
YL
EN
E G
LY
CO
L
20
543
765
505
0 70
2 2,
515
126
TO
LU
EN
E
20
84,6
79
11,3
13
0 0
4 95
,996
4,
800
AN
TIM
ON
Y C
OM
POU
ND
S 16
2,
010
11,4
39
273
0 1
13,7
23
858
XY
LE
NE
(M
IXE
D I
SOM
ER
S)
16
9,60
8 7,
998
0 0
52
17,6
58
1,10
4 PH
OSP
HO
RU
S (Y
EL
LO
W O
R
14
1,20
0 4,
137
5 0
323,
749
329,
091
23,5
07
PRO
PYL
EN
E
14
14,4
51
2,21
5 0
0 0
16,6
66
1,19
0 A
MM
ON
IUM
NIT
RA
TE
13
69
7 8,
858
496,
400
0 59
9,02
8 1,
104,
983
84,9
99
AM
MO
NIU
M S
UL
FAT
E
11
1,61
3 4,
935
0 0
0 6,
548
595
CA
RB
ON
YL
SU
LFI
DE
11
38
0 9,
676,
486
0 0
0 9,
676,
866
879,
715
GL
YC
OL
ET
HE
RS
11
4,02
8 40
,640
0
0 0
44,6
68
4,06
1 T
ITA
NIU
M T
ET
RA
CH
LO
RID
E
11
7,90
0 4,
492
0 0
0 12
,392
1,
127
ET
HY
LE
NE
OX
IDE
10
42
8 19
,890
0
0 0
20,3
18
2,03
2 C
OPP
ER
9
523
1,25
0 83
0
0 1,
856
206
MO
LY
BD
EN
UM
TR
IOX
IDE
9
1,15
5 12
,291
3,
749
5 50
0 17
,700
1,
967
FOR
MA
LD
EH
YD
E
8 49
3 11
,703
0
0 0
12,1
96
1,52
5 Z
INC
(FU
ME
OR
DU
ST)
8 25
5 6,
476
0 0
0 6,
731
841
AR
SEN
IC C
OM
POU
ND
S 7
260
264
391
0 50
4 1,
419
203
ME
RC
UR
Y
7 5,
903
1,59
7 21
5 0
1,51
9 9,
234
1,31
9 1,
1,1-
TR
ICH
LO
RO
ET
HA
NE
7
1,20
0 50
5 0
0 0
1,70
5 24
4 A
SBE
STO
S (F
RIA
BL
E)
6 0
1 0
0 0
1 0
CA
RB
ON
TE
TR
AC
HL
OR
IDE
6
25,6
32
259,
791
0 0
2 28
5,42
5 47
,571
C
HR
OM
IUM
6
260
520
86
0 26
7,78
6 26
8,65
2 44
,775
D
ICH
LO
RO
TE
TR
AFL
UO
RO
ET
HA
NE
6
709,
950
5 0
0 0
709,
955
118,
326
ET
HY
LE
NE
6
527
5,28
7 0
0 0
5,81
4 96
9 M
ET
HY
L E
TH
YL
KE
TO
NE
6
10,2
05
2,60
1 0
0 41
12
,847
2,
141
NA
PHT
HA
LE
NE
6
819
33,6
52
741
0 5
35,2
17
5,87
0 C
AD
MIU
M C
OM
POU
ND
S 5
431
4,23
7 21
0
124
4,81
3 96
3 D
ICH
LO
RO
ME
TH
AN
E
5 53
,174
9,
322
0 0
0 62
,496
12
,499
D
IET
HA
NO
LA
MIN
E
5 3,
325
750
0 0
0 4,
075
815
AC
ET
ON
ITR
ILE
4
2,08
5 1,
696
0 0
0 3,
781
945
September 1995 36 SIC 281
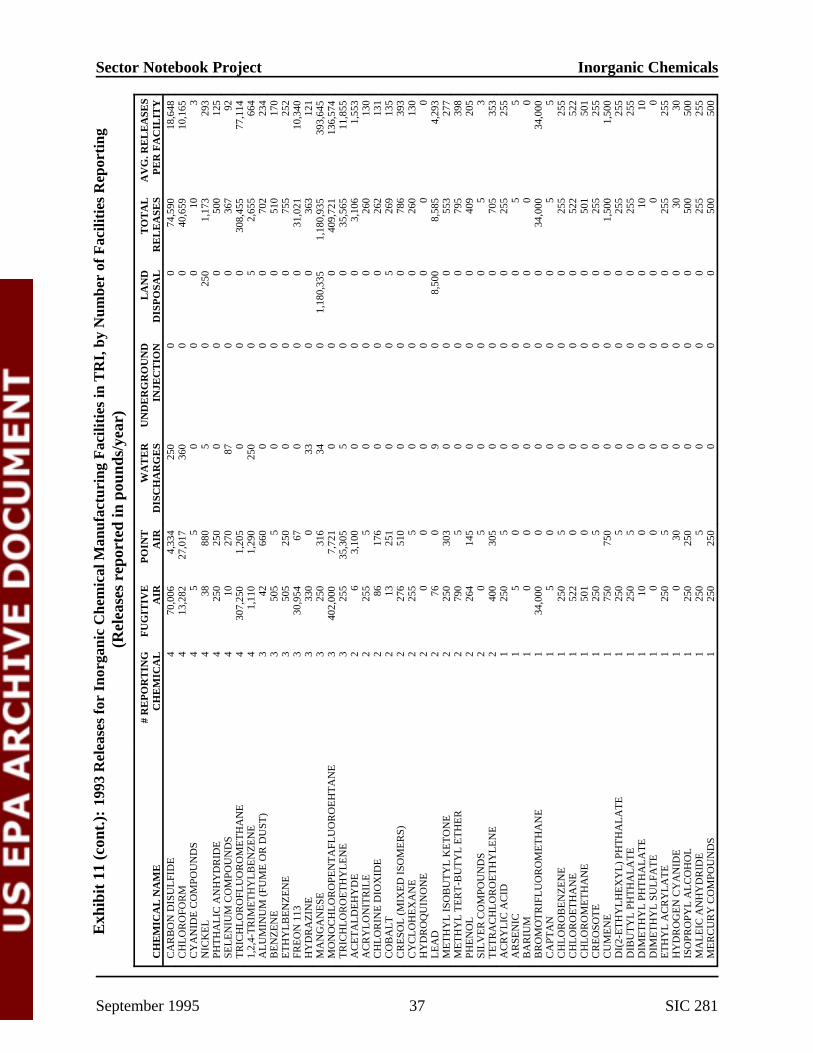
Sector Notebook Project Inorganic Chemicals
Exh
ibit
11
(con
t.):
199
3 R
elea
ses
for
Inor
gani
c C
hem
ical
Man
ufac
turi
ng F
acili
ties
in T
RI,
by
Num
ber
of F
acili
ties
Rep
orti
ng
(Rel
ease
s re
port
ed in
pou
nds/
year
)
CH
EM
ICA
L N
AM
E
# R
EP
OR
TIN
G
CH
EM
ICA
L
FU
GIT
IVE
A
IR
PO
INT
A
IR
WA
TE
R
DIS
CH
AR
GE
S U
ND
ER
GR
OU
ND
IN
JEC
TIO
N
LA
ND
D
ISP
OSA
L
TO
TA
L
RE
LE
ASE
S A
VG
. RE
LE
ASE
S P
ER
FA
CIL
ITY
C
AR
BO
N D
ISU
LFI
DE
4
70,0
06
4,33
4 25
0 0
0 74
,590
18
,648
C
HL
OR
OFO
RM
4
13,2
82
27,0
17
360
0 0
40,6
59
10,1
65
CY
AN
IDE
CO
MPO
UN
DS
4 5
5 0
0 0
10
3 N
ICK
EL
4
38
880
5 0
250
1,17
3 29
3 PH
TH
AL
IC A
NH
YD
RID
E
4 25
0 25
0 0
0 0
500
125
SEL
EN
IUM
CO
MPO
UN
DS
4 10
27
0 87
0
0 36
7 92
T
RIC
HL
OR
OFL
UO
RO
ME
TH
AN
E
4 30
7,25
0 1,
205
0 0
0 30
8,45
5 77
,114
1,
2,4-
TR
IME
TH
YL
BE
NZ
EN
E
4 1,
110
1,29
0 25
0 0
5 2,
655
664
AL
UM
INU
M (
FUM
E O
R D
UST
) 3
42
660
0 0
0 70
2 23
4 B
EN
ZE
NE
3
505
5 0
0 0
510
170
ET
HY
LB
EN
ZE
NE
3
505
250
0 0
0 75
5 25
2 FR
EO
N 1
13
3 30
,954
67
0
0 0
31,0
21
10,3
40
HY
DR
AZ
INE
3
330
0 33
0
0 36
3 12
1 M
AN
GA
NE
SE
3 25
0 31
6 34
0
1,18
0,33
5 1,
180,
935
393,
645
MO
NO
CH
LO
RO
PEN
TA
FLU
OR
OE
HT
AN
E
3 40
2,00
0 7,
721
0 0
0 40
9,72
1 13
6,57
4 T
RIC
HL
OR
OE
TH
YL
EN
E
3 25
5 35
,305
5
0 0
35,5
65
11,8
55
AC
ET
AL
DE
HY
DE
2
6 3,
100
0 0
0 3,
106
1,55
3 A
CR
YL
ON
ITR
ILE
2
255
5 0
0 0
260
130
CH
LO
RIN
E D
IOX
IDE
2
86
176
0 0
0 26
2 13
1 C
OB
AL
T
2 13
25
1 0
0 5
269
135
CR
ESO
L (
MIX
ED
ISO
ME
RS)
2
276
510
0 0
0 78
6 39
3 C
YC
LO
HE
XA
NE
2
255
5 0
0 0
260
130
HY
DR
OQ
UIN
ON
E
2 0
0 0
0 0
0 0
LE
AD
2
76
0 9
0 8,
500
8,58
5 4,
293
ME
TH
YL
ISO
BU
TY
L K
ET
ON
E
2 25
0 30
3 0
0 0
553
277
ME
TH
YL
TE
RT
-BU
TY
L E
TH
ER
2
790
5 0
0 0
795
398
PHE
NO
L
2 26
4 14
5 0
0 0
409
205
SIL
VE
R C
OM
POU
ND
S 2
0 5
0 0
0 5
3 T
ET
RA
CH
LO
RO
ET
HY
LE
NE
2
400
305
0 0
0 70
5 35
3 A
CR
YL
IC A
CID
1
250
5 0
0 0
255
255
AR
SEN
IC
1 5
0 0
0 0
5 5
BA
RIU
M
1 0
0 0
0 0
0 0
BR
OM
OT
RIF
LU
OR
OM
ET
HA
NE
1
34,0
00
0 0
0 0
34,0
00
34,0
00
CA
PTA
N
1 5
0 0
0 0
5 5
CH
LO
RO
BE
NZ
EN
E
1 25
0 5
0 0
0 25
5 25
5 C
HL
OR
OE
TH
AN
E
1 52
2 0
0 0
0 52
2 52
2 C
HL
OR
OM
ET
HA
NE
1
501
0 0
0 0
501
501
CR
EO
SOT
E
1 25
0 5
0 0
0 25
5 25
5 C
UM
EN
E
1 75
0 75
0 0
0 0
1,50
0 1,
500
DI(
2-E
TH
YL
HE
XY
L)
PHT
HA
LA
TE
1
250
5 0
0 0
255
255
DIB
UT
YL
PH
TH
AL
AT
E
1 25
0 5
0 0
0 25
5 25
5 D
IME
TH
YL
PH
TH
AL
AT
E
1 10
0
0 0
0 10
10
D
IME
TH
YL
SU
LFA
TE
1
0 0
0 0
0 0
0 E
TH
YL
AC
RY
LA
TE
1
250
5 0
0 0
255
255
HY
DR
OG
EN
CY
AN
IDE
1
0 30
0
0 0
30
30
ISO
PRO
PYL
AL
CO
HO
L
1 25
0 25
0 0
0 0
500
500
MA
LE
IC A
NH
YD
RID
E
1 25
0 5
0 0
0 25
5 25
5 M
ER
CU
RY
CO
MPO
UN
DS
1 25
0 25
0 0
0 0
500
500
September 1995 37 SIC 281

Sector Notebook Project Inorganic Chemicals
Exh
ibit
11
(con
t.):
199
3 R
elea
ses
for
Inor
gani
c C
hem
ical
Man
ufac
turi
ng F
acili
ties
in T
RI,
by
Num
ber
of F
acili
ties
Rep
orti
ng
(Rel
ease
s re
port
ed in
pou
nds/
year
)
CH
EM
ICA
L N
AM
E
# R
EP
OR
TIN
G
CH
EM
ICA
L
FU
GIT
IVE
A
IR
PO
INT
A
IR
WA
TE
R
DIS
CH
AR
GE
S U
ND
ER
GR
OU
ND
IN
JEC
TIO
N
LA
ND
D
ISP
OSA
L
TO
TA
L
RE
LE
ASE
S A
VG
. RE
LE
ASE
S P
ER
FA
CIL
ITY
M
ET
HY
L M
ET
HA
CR
YL
AT
E
1 25
0 5
0 0
0 25
5 25
5 N
-BU
TY
L A
LC
OH
OL
1
250
250
0 0
0 50
0 50
0 O
-XY
LE
NE
1
5 0
0 0
0 5
5 P-
XY
LE
NE
1
5 0
0 0
0 5
5 PE
RA
CE
TIC
AC
ID
1 10
2,
100
42
0 0
2,15
2 2,
152
POL
YC
HL
OR
INA
TE
D B
IPH
EN
YL
S 1
0 0
0 0
0 0
0 SE
LE
NIU
M
1 5
250
0 0
0 25
5 25
5 SI
LV
ER
1
750
250
0 0
0 1,
000
1,00
0 ST
YR
EN
E
1 25
0 25
0 0
0 0
500
500
TH
IOU
RE
A
1 0
0 0
0 0
0 0
VIN
YL
AC
ET
AT
E
1 5
0 0
0 0
5 5
VIN
YL
CH
LO
RID
E
1 0
0 0
0 0
0 0
1,1,
2-T
RIC
HL
OR
OE
TH
AN
E
1 25
0 5
0 0
0 25
5 25
5 1,
2-D
ICH
LO
RO
ET
HA
NE
1
5 0
0 0
0 5
5 1,
2,4-
TR
ICH
LO
RO
BE
NZ
EN
E
1 5
0 0
0 0
5 5
1,4-
DIO
XA
NE
1
5 0
0 0
0 5
5 T
OT
AL
55
5 5,
366,
356
19,7
37,6
60
2,72
8,27
0 12
0,74
5,73
3 31
,064
,296
17
9,64
2,31
5 32
3,68
0
September 1995 38 SIC 281

Sector Notebook Project Inorganic Chemicals
Exh
ibit
12:
199
3 T
rans
fers
for
Ino
rgan
ic C
hem
ical
Man
ufac
turi
ng F
acili
ties
(SI
C 2
81)
in T
RI,
by
Num
ber
of F
acili
ties
Rep
orti
ng
(Tra
nsfe
rs r
epor
ted
in p
ound
s/ye
ar)
CH
EM
ICA
L N
AM
E
# R
EP
OR
TIN
G
CH
EM
ICA
L
PO
TW
D
ISC
HA
RG
ES
DIS
PO
SAL
R
EC
YC
LIN
G
TR
EA
TM
EN
T
EN
ER
GY
R
EC
OV
ER
Y
TO
TA
L
TR
AN
SFE
RS
AV
G. T
RA
NSF
ER
S P
ER
FA
CIL
ITY
SU
LFU
RIC
AC
ID
311
11,1
46
250,
434
1,02
5,24
2 6,
820,
665
0 8,
107,
487
26,0
69
HY
DR
OC
HL
OR
IC A
CID
16
7 52
8 4,
598,
609
0 10
,423
,062
0
15,0
22,1
99
89,9
53
AM
MO
NIA
15
2 22
,101
,429
37
1,66
9 52
8,23
0 65
,300
0
23,0
66,6
28
151,
754
CH
LO
RIN
E
121
5 61
0 0
270
0 88
5 7
PHO
SPH
OR
IC A
CID
72
3,
913
2,13
0 23
,218
13
2,06
5 0
161,
326
2,24
1 N
ITR
IC A
CID
71
10
25
0 0
438,
614
0 43
8,87
4 6,
181
AC
ET
ON
E
54
1,65
5 23
15
,726
11
,249
84
,368
11
3,02
1 2,
093
ZIN
C C
OM
POU
ND
S 53
7,
382
509,
395
159,
713
30,2
65
0 70
6,75
5 13
,335
C
HR
OM
IUM
CO
MPO
UN
DS
41
4,07
8 12
1,56
9 47
,843
51
,452
0
224,
942
5,48
6 C
OPP
ER
CO
MPO
UN
DS
33
4,22
8 32
1,51
7 57
6,64
2 7,
733
0 91
0,12
0 27
,579
N
ICK
EL
CO
MPO
UN
DS
29
9,84
0 86
,370
27
8,63
0 10
6,69
2 0
481,
532
16,6
05
ME
TH
AN
OL
28
16
,209
4,
000
291,
354
175
1,80
2,76
5 2,
114,
503
75,5
18
BA
RIU
M C
OM
POU
ND
S 27
5,
080
370,
288
0 12
3,56
0 0
498,
928
18,4
79
DIC
HL
OR
OD
IFL
UO
RO
ME
TH
AN
E
26
0 0
20,6
00
16
0 20
,616
79
3 L
EA
D C
OM
POU
ND
S 26
1,
301
89,6
60
1,15
3,21
1 1,
087,
669
0 2,
331,
841
89,6
86
MA
NG
AN
ESE
CO
MPO
UN
DS
26
1,44
6 1,
694,
840
7,30
0 2,
206,
411
0 3,
909,
997
150,
385
HY
DR
OG
EN
FL
UO
RID
E
24
185
230,
250
77,5
87
38,7
00
0 34
6,72
2 14
,447
C
OB
AL
T C
OM
POU
ND
S 21
3,
996
13,5
80
8,05
0 10
,598
0
36,2
24
1,72
5 E
TH
YL
EN
E G
LY
CO
L
20
3,95
1 0
30,9
12
2,24
8 13
,852
50
,963
2,
548
TO
LU
EN
E
20
1,37
5 20
3 25
,347
32
,384
21
7,97
9 27
7,28
8 13
,864
A
NT
IMO
NY
CO
MPO
UN
DS
16
3,73
5 52
,815
16
,000
7,
171
0 79
,721
4,
983
XY
LE
NE
(M
IXE
D I
SOM
ER
S)
16
0 73
25
0 5,
127
188,
093
193,
543
12,0
96
PHO
SPH
OR
US
(YE
LL
OW
OR
14
0
1 0
26,0
00
0 26
,001
1,
857
PRO
PYL
EN
E
14
0 0
0 0
0 0
0 A
MM
ON
IUM
NIT
RA
TE
13
1,
923,
495
160
603,
440
0 0
2,52
7,09
5 19
4,39
2 A
MM
ON
IUM
SU
LFA
TE
11
6,
506,
733
8,24
7 0
6,09
2 0
6,52
1,07
2 59
2,82
5 C
AR
BO
NY
L S
UL
FID
E
11
0 0
0 0
0 0
0 G
LY
CO
L E
TH
ER
S 11
62
8 50
6 0
37,3
87
13,4
05
51,9
26
4,72
1 T
ITA
NIU
M T
ET
RA
CH
LO
RID
E
11
0 16
0
489
86
591
54
ET
HY
LE
NE
OX
IDE
10
0
0 0
0 0
0 0
CO
PPE
R
9 46
93
8,47
7 0
55,2
61
0 99
3,78
4 11
0,42
0 M
OL
YB
DE
NU
M T
RIO
XID
E
9 7,
652
52,4
24
61,2
20
0 0
121,
296
13,4
77
FOR
MA
LD
EH
YD
E
8 25
5 25
0 0
362
0 86
7 10
8 Z
INC
(FU
ME
OR
DU
ST)
8 25
0 1,
710
250
0 0
2,21
0 27
6 A
RSE
NIC
CO
MPO
UN
DS
7 5
59,9
00
250
904
0 61
,059
8,
723
ME
RC
UR
Y
7 0
3,48
6 5,
222
1,01
0 0
9,71
8 1,
388
1,1,
1-T
RIC
HL
OR
OE
TH
AN
E
7 0
0 25
0 5
0 25
5 36
A
SBE
STO
S (F
RIA
BL
E)
6 0
33,0
70
0 0
0 33
,070
5,
512
CA
RB
ON
TE
TR
AC
HL
OR
IDE
6
0 1,
400
0 34
,107
0
35,5
07
5,91
8 C
HR
OM
IUM
6
0 48
,930
2,
763
37,7
65
0 89
,458
14
,910
D
ICH
LO
RO
TE
TR
AFL
UO
RO
ET
HA
6
0 0
0 0
0 0
0 E
TH
YL
EN
E
6 0
0 0
0 0
0 0
ME
TH
YL
ET
HY
L K
ET
ON
E
6 0
92
0 44
3 33
,567
34
,102
5,
684
NA
PHT
HA
LE
NE
6
0 48
0
880
250
1,17
8 19
6 C
AD
MIU
M C
OM
POU
ND
S 5
35
585
5 4,
061
0 4,
686
937
DIC
HL
OR
OM
ET
HA
NE
5
0 0
5,14
7 5
0 5,
152
1,03
0 D
IET
HA
NO
LA
MIN
E
5 45
0 0
0 0
0 45
0 90
A
CE
TO
NIT
RIL
E
4 0
0 0
5 22
,239
22
,244
5,
561
September 1995 39 SIC 281

Sector Notebook Project Inorganic Chemicals
Exh
ibit
12
(con
t.):
199
3 T
rans
fers
for
Ino
rgan
ic C
hem
ical
Man
ufac
turi
ng F
acili
ties
in T
RI,
by
Num
ber
of F
acili
ties
Rep
orti
ng
(Tra
nsfe
rs r
epor
ted
in p
ound
s/ye
ar)
CH
EM
ICA
L N
AM
E
# R
EP
OR
TIN
G
CH
EM
ICA
L
PO
TW
D
ISC
HA
RG
ES
DIS
PO
SAL
R
EC
YC
LIN
G
TR
EA
TM
EN
T
EN
ER
GY
R
EC
OV
ER
Y
TO
TA
L
TR
AN
SFE
RS
AV
G. T
RA
NSF
ER
S P
ER
FA
CIL
ITY
C
AR
BO
N D
ISU
LFI
DE
4
250
10
0 0
500
760
190
CH
LO
RO
FOR
M
4 0
7,70
0 0
72,3
11
0 80
,011
20
,003
C
YA
NID
E C
OM
POU
ND
S 4
1 0
0 4
0 5
1 N
ICK
EL
4
97
505
23,6
70
0 0
24,2
72
6,06
8 PH
TH
AL
IC A
NH
YD
RID
E
4 5
0 0
5 2,
412
2,42
2 60
6 SE
LE
NIU
M C
OM
POU
ND
S 4
2 27
0
295
0 32
4 81
T
RIC
HL
OR
OFL
UO
RO
ME
TH
AN
E
4 0
0 3,
100
1,70
5 0
4,80
5 1,
201
1,2,
4-T
RIM
ET
HY
LB
EN
ZE
NE
4
0 0
0 1,
854
3,18
8 5,
042
1,26
1 A
LU
MIN
UM
(FU
ME
OR
DU
ST)
3 0
0 0
0 0
0 0
BE
NZ
EN
E
3 0
0 0
5 0
5 2
ET
HY
LB
EN
ZE
NE
3
0 0
0 5
0 5
2 FR
EO
N 1
13
3 0
0 0
1,50
0 0
1,50
0 50
0 H
YD
RA
ZIN
E
3 0
0 0
0 0
0 0
MA
NG
AN
ESE
3
0 18
3,41
2 0
0 0
183,
412
61,1
37
MO
NO
CH
LO
RO
PEN
TA
FLU
OR
OE
3
0 0
0 0
0 0
0 T
RIC
HL
OR
OE
TH
YL
EN
E
3 0
0 0
1,30
5 0
1,30
5 43
5 A
CE
TA
LD
EH
YD
E
2 0
0 0
0 0
0 0
AC
RY
LO
NIT
RIL
E
2 0
0 0
5 0
5 3
CH
LO
RIN
E D
IOX
IDE
2
130
0 0
0 0
130
65
CO
BA
LT
2
4 5
2,30
0 0
0 2,
309
1,15
5 C
RE
SOL
(M
IXE
D I
SOM
ER
S)
2 0
0 0
5 0
5 3
CY
CL
OH
EX
AN
E
2 0
0 0
5 0
5 3
HY
DR
OQ
UIN
ON
E
2 50
0 0
0 0
0 50
0 25
0 L
EA
D
2 0
750
0 66
0
816
408
ME
TH
YL
ISO
BU
TY
L K
ET
ON
E
2 0
0 0
5 82
0 82
5 41
3 M
ET
HY
L T
ER
T-B
UT
YL
ET
HE
R
2 0
0 0
5 0
5 3
PHE
NO
L
2 0
0 0
5 0
5 3
SIL
VE
R C
OM
POU
ND
S 2
5 5
0 0
0 10
5
TE
TR
AC
HL
OR
OE
TH
YL
EN
E
2 0
0 0
5 0
5 3
AC
RY
LIC
AC
ID
1 0
0 0
5 0
5 5
AR
SEN
IC
1 0
0 0
70,7
61
0 70
,761
70
,761
B
AR
IUM
1
0 26
,217
0
0 0
26,2
17
26,2
17
BR
OM
OT
RIF
LU
OR
OM
ET
HA
NE
1
0 0
0 0
0 0
0 C
APT
AN
1
0 0
0 0
0 0
0 C
HL
OR
OB
EN
ZE
NE
1
0 0
0 5
0 5
5 C
HL
OR
OE
TH
AN
E
1 0
0 0
0 0
0 0
CH
LO
RO
ME
TH
AN
E
1 0
0 0
0 0
0 0
CR
EO
SOT
E
1 0
0 0
5 0
5 5
CU
ME
NE
1
0 0
0 1,
000
0 1,
000
1,00
0 D
I(2-
ET
HY
LH
EX
YL
) 1
0 0
0 5
0 5
5 D
IBU
TY
L P
HT
HA
LA
TE
1
0 0
0 5
0 5
5 D
IME
TH
YL
PH
TH
AL
AT
E
1 0
0 0
0 0
0 0
DIM
ET
HY
L S
UL
FAT
E
1 0
0 0
0 0
0 0
ET
HY
L A
CR
YL
AT
E
1 0
0 0
5 0
5 5
HY
DR
OG
EN
CY
AN
IDE
1
0 0
0 0
0 0
0 IS
OPR
OPY
L A
LC
OH
OL
1
0 0
0 5
0 5
5 M
AL
EIC
AN
HY
DR
IDE
1
0 0
0 5
0 5
5 M
ER
CU
RY
CO
MPO
UN
DS
1 5
1,52
5 0
5 0
1,53
5 1,
535
September 1995 40 SIC 281

Sector Notebook Project Inorganic Chemicals
Exh
ibit
12
(con
t.):
199
3 T
rans
fers
for
Ino
rgan
ic C
hem
ical
Man
ufac
turi
ng F
acili
ties
in T
RI,
by
Num
ber
of F
acili
ties
Rep
orti
ng
(Tra
nsfe
rs r
epor
ted
in p
ound
s/ye
ar)
CH
EM
ICA
L N
AM
E
# R
EP
OR
TIN
G
CH
EM
ICA
L
PO
TW
D
ISC
HA
RG
ES
DIS
PO
SAL
R
EC
YC
LIN
G
TR
EA
TM
EN
T
EN
ER
GY
R
EC
OV
ER
Y
TO
TA
L
TR
AN
SFE
RS
AV
G. T
RA
NSF
ER
S P
ER
FA
CIL
ITY
M
ET
HY
L M
ET
HA
CR
YL
AT
E
1 0
0 0
5 0
5 5
N-B
UT
YL
AL
CO
HO
L
1 0
0 0
5 0
5 5
O-X
YL
EN
E
1 0
0 0
0 0
0 0
P-X
YL
EN
E
1 0
0 0
0 0
0 0
PER
AC
ET
IC A
CID
1
0 0
0 11
0 0
110
110
POL
YC
HL
OR
INA
TE
D
1 0
0 0
0 0
0 0
SEL
EN
IUM
1
0 0
0 1,
450
0 1,
450
1,45
0 SI
LV
ER
1
0 0
1,01
1 0
0 1,
011
1,01
1 ST
YR
EN
E
1 0
0 0
5 0
5 5
TH
IOU
RE
A
1 0
0 0
0 0
0 0
VIN
YL
AC
ET
AT
E
1 0
0 0
0 0
0 0
VIN
YL
CH
LO
RID
E
1 0
0 0
0 0
0 0
1,1,
2-T
RIC
HL
OR
OE
TH
AN
E
1 0
0 0
5 0
5 5
1,2-
DIC
HL
OR
OE
TH
AN
E
1 0
0 0
0 0
0 0
1,2,
4-T
RIC
HL
OR
OB
EN
ZE
NE
1
0 0
0 0
0 0
0 1,
4-D
IOX
AN
E
1 0
0 0
0 0
0 0
TO
TA
L
555
30,6
22,0
40
10,0
87,7
43
4,99
4,48
3 21
,958
,678
2,
383,
524
70,0
46,4
68
126,
210
September 1995 41 SIC 281

1
2
3
4
5
6
7
8
9
10
Sector Notebook Project Inorganic Chemicals
The TRI database contains a detailed compilation of self-reported, facility-specific chemical releases. The top reporting facilities for this sector are listed below. Facilities that have reported only the SIC codes covered under this notebook appear on the first list. The second list contains additional facilities that have reported the SIC code covered within this report, and one or more SIC codes that are not within the scope of this notebook. Therefore, the second list includes facilities that conduct multiple operations -- some that are under the scope of this notebook, and some that are not. Currently, the facility-level data do not allow pollutant releases to be broken apart by industrial process.
Exhibit 13: Top 10 TRI Releasing Inorganic Chemicals Facilitiesb
Rank Facility in Pounds
Total TRI Releases
Du Pont Delisle Plant - Pass Christian, MS 58,875,734
Du Pont Johnsonville Plant - New Johnsonville, TN 51,215,700
Cabot Corp. Cab-O-Sil Div. - Tuscola, IL 13,926,440
American Chrome & Chemicals Inc. - Corpus Christi, TX 12,113,360
Occidental Chemical Corp. - Castle Hayne, NC 6,705,795
Chemetals Inc. - New Johnsonville, TN 5,684,893
Kaiser Aluminum & Chemical Corp. - Mulberry, FL 4,876,348
Kerr-McGee Chemical Corp. - Henderson, NV 2,333,175
SCM Chemicals Americas Plant II - Ashtabula, OH 2,238,400
Louisiana Pigment Co. L.P. - Westlake, LA 1,465,753
Source: U.S. EPA, Toxics Release Inventory Database, 1993.
b Being included on this list does not mean that the release is associated with non-compliance with environmental laws.
September 1995 42 SIC 281

1
2
3
4
5
6
7
Sector Notebook Project Inorganic Chemicals
Exhibit 14: Top 10 TRI Releasing Facilities Reporting Inorganic Chemical SIC Codes to TRIc
Rank Reported in TRI SIC Codes
Facility Pounds Releases in Total TRI
2819, 2873, 2874 IMC-Agrico Co., Faustina Plant - Saint James, LA 127,912,967
2819, 2869 Cytec Industries, Inc., Fortier Plant - Westwego, LA 120,149,724
2819, 2874 IMC-Agrico Co., Uncle Sam Plant - Uncle Sam, LA 61,807,180
2816 Du Pont Delisle Plant - Pass Christian, MS 58,875,734
2816 Du Pont Johnsonville Plant - New Johnsonville, TN 51,215,700
2819, 2823 Courtaulds Fibers, Inc. - Axis, AL 42,658,865
2819, 2869, 2841, 2879
Monsanto Co. - Alvin, TX 40,517,095
8 2819, 2869, 2865 Sterling Chemicals, Inc. - Texas City, TX 24,709,135
9 2819, 2873, 2874 Arcadian Fertilizer L.P. - Geismar, LA 22,672,961
10 2812, 2813, 2869 Vulcan Chemicals - Wichita, KS 17,406,218
Source: U.S. EPA, Toxics Release Inventory Database, 1993.
IV.B. Summary of Selected Chemicals Released
The brief descriptions provided below were taken from the 1993 Toxics Release Inventory Public Data Release (EPA, 1994), and the Hazardous Substances Data Bank (HSDB), accessed via TOXNET. TOXNET is a computer system run by the National Library of Medicine. It includes a number of toxicological databases managed by EPA, the National Cancer Institute, and the National Institute for Occupational Safety and Health.d
HSDB contains chemical-specific information on manufacturing and use, chemical and physical properties, safety and handling, toxicity and biomedical effects, pharmacology, environmental fate and exposure potential, exposure standards and regulations, monitoring and analysis methods, and additional
c Being included on this list does not mean that the release is associated with non-compliance with environmental laws.
d Databases included in TOXNET are: CCRIS (Chemical Carcinogenesis Research Information System), DART (Developmental and Reproductive Toxicity Database), DBIR (Directory of Biotechnology Information Resources), EMICBACK (Environmental Mutagen Information Center Backfile), GENE-TOX (Genetic Toxicology), HSDB (Hazardous Substances Data Bank), IRIS (Integrated Risk Information System), RTECS (Registry of Toxic Effects of Chemical Substances), and TRI (Toxic Chemical Release Inventory).
September 1995 43 SIC 281

Sector Notebook Project Inorganic Chemicals
references. The information contained below is based upon exposure assumptions that have been conducted using standard scientific procedures. The effects listed below must be taken in context of these exposure assumptions that are more fully explained within the full chemical profiles in HSDB. For more information on TOXNET, contact the TOXNET help line at 800-231-3766.
Hydrochloric Acid (CAS: 7647-01-1)
Sources. Hydrochloric acid is one of the highest volume chemicals produced by the inorganic chemical industry. Some of its more common uses are as a pickling liquor and metal cleaner in the iron and steel industry, as an activator of petroleum wells, as a boiler scale remover, and as a neutralizer of caustic waste streams. The largest release of hydrochloric acid by the inorganic chemical industry is in the form of underground injection of spent hydrochloric acid used to manufacture chlorosulfonic acid and other products.57
Toxicity. Hydrochloric acid is primarily a concern in its aerosol form. Acid aerosols have been implicated in causing and exacerbating a variety of respiratory ailments. Dermal exposure and ingestion of highly concentrated hydrochloric acid can result in corrosivity.
Ecologically, accidental releases of solution forms of hydrochloric acid may adversely affect aquatic life by including a transient lowering of the pH (i.e., increasing the acidity) of surface waters.
Carcinogenicity. There is currently no evidence to suggest that this chemical is carcinogenic.
Environmental Fate. Releases of hydrochloric acid to surface waters and soils will be neutralized to an extent due to the buffering capacities of both systems. The extent of these reactions will depend on the characteristics of the specific environment.
Physical Properties. Concentrated hydrochloric acid is highly corrosive.
Chromium and Chromium Compounds (CAS: 7440-47-3; 20-06-4)
Sources. Chrome pigments, chromates, chromic acid, chromium salts, and other inorganic chromium compounds are some of the larger volume products of the inorganic chemicals industry. Chrome is used as a plating element for metal and plastics to prevent corrosion, and as a constituent of certain steels and inorganic pigments. Most chromium wastes released to the environment
September 1995 44 SIC 281
Sector Notebook Project Inorganic Chemicals
by the inorganic chemicals industry are land disposed in the form of chromium containing sludges.
Toxicity. Although the naturally-occurring form of chromium metal has very low toxicity, chromium from industrial emissions is highly toxic due to strong oxidation characteristics and cell membrane permeability. The majority of the effects detailed below are based on Chromium VI (an isomer that is more toxic than Cr III). Exposure to chromium metal and insoluble chromium salts affects the respiratory system. Inhalation exposure to chromium and chromium salts may cause severe irritation of the upper respiratory tract and scarring of lung tissue. Dermal exposure to chromium and chromium salts can also cause sensitive dermatitis and skin ulcers.
Ecologically, although chromium is present in small quantities in all soils and plants, it is toxic to plants at higher soil concentrations (i.e., 0.2 to 0.4 percent in soil).
Carcinogenicity. Different sources disagree on the carcinogenicity of chromium. Although an increased incidence in lung cancer among workers in the chromate-producing industry has been reported, data are inadequate to confirm that chromium is a human carcinogen. Other sources consider chromium VI to be a known human carcinogen based on inhalation exposure.
Environmental Fate. Chromium is a non-volatile metal with very low solubility in water. If applied to land, most chromium remains in the upper five centimeters of soil. Most chromium in surface waters is present in particulate form as sediment. Airborne chromium particles are relatively unreactive and are removed from the air through wet and dry deposition. The precipitated chromium from the air enters surface water or soil. Chromium bioaccumulates in plants and animals, with an observed bioaccumulation factor of 1,000,000 in snails.
Carbonyl Sulfide (CAS: 463-58-1)
Sources. Carbonyl sulfide is the largest volume chemical released to the air by the inorganic chemicals industry. Carbonyl sulfide is primarily generated by a relatively small number of facilities hydrolyzing ammonium or potassium thiocyanate during the manufacturing of inorganic pigments and dyes.58
Toxicity. Exposure to low to moderate concentrations of carbonyl sulfide causes eye and skin irritation and adverse central nervous system effects such as giddiness, headache, vertigo, amnesia, confusion, and unconsciousness. If ingested, gastrointestinal effects include profuse salivation, nausea, vomiting and diarrhea. Moderate carbonyl sulfide poisoning also causes rapid breathing and heartbeat, sweating, weakness, and muscle cramps. Exposure to very
September 1995 45 SIC 281

Sector Notebook Project Inorganic Chemicals
high concentrations of carbonyl sulfide causes sudden collapse, unconsciousness, and death from sudden respiratory paralysis. Recovery from sublethal exposure is slow, but generally complete. Degradation products of carbonyl sulfide (especially hydrogen sulfide) can result in toxic symptoms and death.
Carcinogenicity. There is currently no evidence to suggest that this chemical is carcinogenic.
Environmental Fate. If released to soil or surface waters, carbonyl sulfide will rapidly volatilize. It is not expected to adsorb to soil sediments or organic matter nor is it expected to bioconcentrate in fish and aquatic organisms. Carbonyl sulfide is hydrolyzed in water to carbon dioxide and hydrogen sulfide. Carbonyl sulfide is expected to have a long residence time in the atmosphere. Atmospheric removal of carbonyl sulfide may occur by slow reactions with other gases, and may also occur through adsorption by plants and soil microbes.
Manganese and Manganese Compounds (CAS: 7439-96-5; 20-12-2)
Sources. Manganese is both a product and chemical intermediate of the inorganic chemical industry. Manganese is used as a purifying and scavenging agent in metal production, as an intermediate in aluminum production and as a constituent of non-ferrous alloys to improve corrosion resistance and hardness.59
Toxicity. There is currently no evidence that human exposure to manganese at levels commonly observed in ambient atmosphere results in adverse health effects. However, recent EPA review of the fuel additive MMT (methylcyclopentadienyl manganese tricarbonyl) concluded that use of MMT in gasoline could lead to ambient exposures to manganese at a level sufficient to cause adverse neurological effects in humans.
Chronic manganese poisoning bears some similarity to chronic lead poisoning. Occurring via inhalation of manganese dust or fumes, it primarily involves the central nervous system. Early symptoms include languor, speech disturbances, sleepiness, and cramping and weakness in legs. A stolid mask-like appearance of face, emotional disturbances such as absolute detachment broken by uncontrollable laughter, euphoria, and a spastic gait with a tendency to fall while walking are seen in more advanced cases. Chronic manganese poisoning is reversible if treated early and exposure stopped. Populations at greatest risk of manganese toxicity are the very young and those with iron deficiencies.
September 1995 46 SIC 281

Sector Notebook Project Inorganic Chemicals
Ecologically, although manganese is an essential nutrient for both plants and animals, in excessive concentrations manganese inhibits plant growth.
Carcinogenicity. There is currently no evidence to suggest that this chemical is carcinogenic.
Environmental Fate. Manganese is an essential nutrient for plants and animals. As such, manganese accumulates in the top layers of soil or surface water sediments and cycles between the soil and living organisms. It occurs mainly as a solid under environmental conditions, though may also be transported in the atmosphere as a vapor or dust
Ammonia (CAS: 7664-41-7)
Sources. Ammonia is used in many chemical manufacturing processes and is the building block for all synthetic nitrogen products. Its prevalence and its volatile and water soluble characteristics allow it to be readily released to the air and water. In the inorganic chemical manufacturing industry, ammonia can be either a feedstock or a by-product. Some of the more common inorganic chemical industry processes using or producing ammonia include the manufacturing of: ammonium chloride, ammonium hydroxide, ammonium thiosulfate, ammonium nitrate, hydrazine, and hydrogen cyanide.
Toxicity. Anhydrous ammonia is irritating to the skin, eyes, nose, throat, and upper respiratory system. Ecologically, ammonia is a source of nitrogen (an essential element for aquatic plant growth), and may therefore contribute to eutrophication of standing or slow-moving surface water, particularly in nitrogen-limited waters such as the Chesapeake Bay. In addition, aqueous ammonia is moderately toxic to aquatic organisms.
Carcinogenicity. There is currently no evidence to suggest that this chemical is carcinogenic.
Environmental Fate. Ammonia combines with sulfate ions in the atmosphere and is washed out by rainfall, resulting in rapid return of ammonia to the soil and surface waters. Ammonia is a central compound in the environmental cycling of nitrogen. Ammonia in lakes, rivers, and streams is converted to nitrate.
Physical Properties. Ammonia is a corrosive and severely irritating gas with a pungent odor.
IV.C. Other Data Sources
September 1995 47 SIC 281
Sector Notebook Project Inorganic Chemicals
In addition to chemicals covered under TRI, many other chemicals are released. For example, the EPA Office of Air Quality Planning and Standards has compiled air pollutant emission factors for determining the total air emissions of priority pollutants (e.g., VOCs, SOx, NOx, CO, particulates) from many chemical industry sources.
The EPA Office of Air’s Aerometric Information Retrieval System (AIRS) contains a wide range of information related to stationary sources of air pollution, including the emissions of a number of air pollutants which may be of concern within a particular industry. With the exception of volatile organic compounds (VOCs), there is little overlap with the TRI chemicals reported above. Exhibit 15 summarizes annual releases of carbon monoxide (CO), nitrogen dioxide (NO2), particulate matter of 10 microns or less (PM10), total particulate (PT), sulfur dioxide (SO2) and volatile organic compounds (VOCs).
September 1995 48 SIC 281

Sector Notebook Project Inorganic Chemicals
Exhibit 15: Pollutant Releases (short tons/year)
Industry Sector CO NO 2 PM 10 PT SO 2 VOC
Metal Mining 5,391 28,583 39,359 140,052 84,222 1,283
Nonmetal Mining 4,525 28,804 59,305 167,948 24,129 1,736
Lumber and Wood Production
123,756 42,658 14,135 63,761 9,419 41,423
Furniture and Fixtures 2,069 2,981 2,165 3,178 1,606 59,426
Pulp and Paper 624,291 394,448 35,579 113,571 541,002 96,875
Printing 8,463 4,915 399 1,031 1,728 101,537
Inorganic Chemicals 166,147 103,575 4,107 39,062 182,189 52,091
Organic Chemicals 146,947 236,826 26,493 44,860 132,459 201,888
Petroleum Refining 419,311 380,641 18,787 36,877 648,155 369,058
Rubber and Misc. Plastics
2,090 11,914 2,407 5,355 29,364 140,741
Stone, Clay and Concrete
58,043 338,482 74,623 171,853 339,216 30,262
Iron and Steel 1,518,642 138,985 42,368 83,017 238,268 82,292
Nonferrous Metals 448,758 55,658 20,074 22,490 373,007 27,375
Fabricated Metals 3,851 16,424 1,185 3,136 4,019 102,186
Computer and Office Equipment
24 0 0 0 0 0
Electronics and Other Electrical Equipment and Components
367 1,129 207 293 453 4,854
Motor Vehicles, Bodies, Parts and Accessories
35,303 23,725 2,406 12,853 25,462 101,275
Dry Cleaning 101 179 3 28 152 7,310
Source: U.S. EPA Office of Air and Radiation, AIRS Database, May 1995.
September 1995 49 SIC 281

Sector Notebook Project Inorganic Chemicals
IV.D. Comparison of Toxic Release Inventory Between Selected Industries
The following information is presented as a comparison of pollutant release and transfer data across industrial categories. It is provided to give a general sense as to the relative scale of releases and transfers within each sector profiled under this project. Please note that the following figure and table do not contain releases and transfers for industrial categories that are not included in this project, and thus cannot be used to draw conclusions regarding the total release and transfer amounts that are reported to TRI. Similar information is available within the annual TRI Public Data Release Book.
Exhibit 16 is a graphical representation of a summary of the 1993 TRI data for the inorganic chemicals industry and the other sectors profiled in separate notebooks. The bar graph presents the total TRI releases and total transfers on the left axis and the triangle points show the average releases per facility on the right axis. Industry sectors are presented in the order of increasing total TRI releases. The graph is based on the data shown in Exhibit 17 and is meant to facilitate comparisons between the relative amounts of releases, transfers, and releases per facility both within and between these sectors. The reader should note, however, that differences in the proportion of facilities captured by TRI exist between industry sectors. This can be a factor of poor SIC matching and relative differences in the number of facilities reporting to TRI from the various sectors. In the case of the inorganic chemicals, the 1993 TRI data presented here covers 555 facilities. These facilities listed SIC 2812-2819 (inorganic chemicals) as a primary SIC code.
September 1995 50 SIC 281

Sector Notebook Project Inorganic Chemicals
Exhibit 16: Summary of 1993 TRI Data:Releases and Transfers by Industry
0
100
200
300
400
500
600
700
Tot
al P
ound
s (m
illio
ns)
0
200,000
400,000
600,000
800,000
1,000,000
Ave
rage
Rel
ease
s pe
r Fa
cilit
y (l
bs.)
36 24
32 27
25 2911
34 371
331 30
286 26
281 333, 334
Total Releases Total Transfers Avg. Releases/Facility
SIC Range
Industry Sector SIC Range
Industry Sector SIC Range
Industry Sector
36 Electronic Equipment and Components
2911 Petroleum Refining 286 Organic Chemical Mfg.
24 Lumber and Wood Products 34 Fabricated Metals 26 Pulp and Paper
32 Stone, Clay, and Concrete 371 Motor Vehicles, Bodies, Parts, and Accessories
281 Inorganic Chemical Mfg.
27 Printing 331 Iron and Steel 333,334 Nonferrous Metals
25 Wood Furniture and Fixtures 30 Rubber and Misc. Plastics
September 1995 51 SIC 281

Sector Notebook Project Inorganic Chemicals
Exh
ibit
17:
Tox
ics
Rel
ease
Inv
ento
ry D
ata
for
Sele
cted
Ind
ustr
ies
Ave
rage
Rel
ease
s +
Tra
nsfe
rs p
er
Fac
ility
(po
unds
)
46,0
00
24,0
00
148,
000
147,
000
133,
000
104,
000
369,
000
706,
000
450,
000
3,08
8,00
0
123,
000
1,82
5,00
0
1,34
9,00
0
1,05
2,00
0
Indu
stry
sec
tor
not s
ubje
ct to
TR
I re
port
ing.
Indu
stry
sec
tor
not s
ubje
ct to
TR
I re
port
ing.
Indu
stry
sec
tor
not s
ubje
ct to
TR
I re
port
ing.
Sour
ce:
U.S
. EPA
, Tox
ics
Rel
ease
Inv
ento
ry D
atab
ase,
199
3.
Tot
al R
elea
ses
+ T
rans
fers
(m
illio
n lb
s.)
28.8
11.9
46.4
46.7
53.7
163.
4
224.
8
218.
1
249.
7
481.
9
267.
7
695.
3
280.
7
438.
4
1993
TR
I T
rans
fers
Ave
rage
T
rans
fers
pe
r F
acili
ty
(pou
nds)
4,00
0
7,00
0
13,0
00
32,0
00
116,
000
29,0
00
239,
000
157,
000
126,
000
2,67
6,00
0
83,0
00
1,60
0,00
0
472,
000
688,
000
Tot
al
Tra
nsfe
rs
(mill
ion
lbs.
) 2.2
3.5
4.2
10.2
47.1
45
145.
5
48.4
70
417.
5
195.
7
609.
5
98.2
286.
7
1993
TR
I R
elea
ses
Ave
rage
R
elea
ses
per
Fac
ility
(p
ound
s)
42,0
00
17,0
00
135,
000
115,
000
17,0
00
75,0
00
130,
000
549,
000
324,
000
412,
000
30,0
00
225,
000
877,
000
364,
000
Tot
al
Rel
ease
s (m
illio
n lb
s.)
26.6
8.4
42.2
36.5
6.7
118.
4
79.3
169.
7
179.
6
64.3
72
85.8
182.
5
151.
6
# T
RI
Fac
iliti
es
634
491
313
318
406
1,57
9
609
309
555
156
2,36
3
381
208
417
SIC
R
ange
32
24
25
2711
-278
9 36
30
371
2611
-263
1
2812
-281
9
2911
34
331
333,
334
2861
-286
9 10
14
7216
Indu
stry
Sec
tor
Ston
e, C
lay,
and
Con
cret
e
Lum
ber
and
Woo
d Pr
oduc
ts
Furn
iture
and
Fix
ture
s
Prin
ting
Ele
ctro
nic
Equ
ip. a
nd
Com
pone
nts
Rub
ber
and
Mis
c. P
last
ics
Mot
or V
ehic
les,
Bod
ies,
Pa
rts,
and
Acc
esso
ries
Pulp
and
Pap
er
Inor
gani
c C
hem
. Mfg
.
Petr
oleu
m R
efin
ing
Fabr
icat
ed M
etal
s
Iron
and
Ste
el
Non
ferr
ous
Met
als
Org
anic
Che
mic
al M
fg.
Met
al M
inin
g
Non
met
al M
inin
g
Dry
Cle
anin
g
September 1995 52 SIC 281

Sector Notebook Project Inorganic Chemicals
V. POLLUTION PREVENTION OPPORTUNITIES
The best way to reduce pollution is to prevent it in the first place. Some companies have creatively implemented pollution prevention techniques that improve efficiency and increase profits while at the same time minimize environmental impacts. This can be done in many ways such as reducing material inputs, re-engineering processes to reuse by-products, improving management practices, and employing substitute toxic chemicals. Some smaller facilities are able to actually get below regulatory thresholds just by reducing pollutant releases through aggressive pollution prevention policies.
In order to encourage these approaches, this section provides both general and company-specific descriptions of some pollution prevention advances that have been implemented within the inorganic chemical manufacturing industry. While the list is not exhaustive, it does provide core information that can be used as the starting point for facilities interested in beginning their own pollution prevention projects. When possible, this section provides information from real activities that can, or are being implemented by this sector -- including a discussion of associated costs, time frames, and expected rates of return. This section also provides the context (in terms of type of industry and/or type of process affected) in which the pollution prevention technique can effectively be used.
There have been numerous cases have where the chemical industry has simultaneously reduced pollutant outputs and operating costs through pollution prevention techniques. In the inorganic chemicals manufacturing sector, however, economically viable pollution prevention opportunities are not as easily identified as in other sectors. The relatively small size and limited resources of a typical inorganic chemical facility limits the number of feasible pollution prevention options. The limited resources available to the industry eliminates many pollution prevention options that require significant capital expenditures such as process modifications and process redesign. In addition, the inorganic chemicals industry's products are primarily commodity chemicals for which the manufacturing processes have been developed over many years. Commodity chemical manufacturers redesign their processes infrequently so that redesign of the reaction process or equipment is unlikely in the short term. In addition, the industry's process equipment has been amortized over long periods of time making cost-effective process equipment improvements scarce. As a result, pollution prevention in the inorganic chemicals industry is somewhat restricted to the less costly options, such as minor process modifications, operational changes, raw material substitutions, and recycling.
Pollution prevention in the chemical industry in process specific. As such it is difficult to generalize about the relative merits of different pollution prevention strategies. The age and size of the facility, and the type and
September 1995 53 SIC 281

Sector Notebook Project Inorganic Chemicals
number of its processes will determine the most effective pollution prevention strategy. Brief descriptions of some of the more widespread, general pollution prevention techniques found to be effective at inorganic chemicals facilities are provided below. Many of these pollution prevention opportunities can be applied to the petrochemical industry as a whole due to the many similar processes found throughout the industry. It should be noted that many of the ideas identified below as pollution prevention opportunities, aimed at reducing wastes and reducing materials use, have been carried out by the chemicals manufacturing industry for many years as the primary means of improving process efficiencies and increasing profits.
In chlor-alkali production, pollution prevention options have been demonstrated for both the mercury cell and diaphragm cell processes; however, the best opportunity to reduce pollutant outputs, conserve energy, and reduce costs in the chlor-alkali industry are in the conversion to the membrane cell process. In terms of energy consumption, the membrane cell process uses only about 77 percent of that of the mercury cell process and about 90 percent of that of the diaphragm cell process. The membrane cell process also generates significantly less airborne and waterborne pollutants and solid wastes (see Section III.B. - Raw Material Inputs and Pollution Outputs).
Substitute raw materials. The substitution or elimination of some of the raw materials used in the manufacturing of inorganic chemicals can result in substantial waste reductions and cost savings. Because impurities in the feed stream can be a major contributor to waste generation, one of the most common substitutions is to use a higher purity feedstock. This can be accomplished either by working with suppliers to get a higher quality feed or by installing purification equipment. Raw materials can also be substituted with less toxic and less water soluble materials to reduce water contamination, and with less volatile materials to reduce fugitive emissions. Sometimes certain raw materials can be eliminated all together. The need for raw materials that end up as wastes should be reexamined to determine if raw materials can be eliminated by modifying the process and improving control.
Improve reactor efficiencies. Since the chemical products are primarily created inside the process reactor, it can be the primary source for waste (off-spec) materials. One of the most important parameters dictating the reactor efficiency is the quality of mixing. A number of techniques can be used to improve mixing, such as installing baffles in the reactor, a higher rpm motor for the agitator, a different mixing blade design, multiple impellers, and pump recirculation. The method used to introduce feed to the reactor can also have an effect on the quality of mixing. A feed distributor can be added to equalize residence time through the reactor, and feed streams can be added at a point
September 1995 54 SIC 281

Sector Notebook Project Inorganic Chemicals
in time closer to the ideal reactant concentration. This will avoid secondary reactions which form unwanted by-products.
Improve catalyst. The catalyst plays a critical role in the effectiveness of chemical conversion in the reactor. Alternative chemical makeups and physical characteristics can lead to substantial improvements in the effectiveness and life of a catalyst. Different catalysts can also eliminate by-product formation. Noble metal catalysts can replace heavy metal catalysts to eliminate wastewater contaminated with heavy metals. The consumption of catalysts can be reduced by using a more active form and emissions and effluents generated during catalyst activation can be eliminated by obtaining the catalyst in the active form.
Optimize processes. Process changes that optimize reactions and raw materials use can reduce waste generation and releases. Many larger facilities are using computer controlled systems which analyze the process continuously and respond more quickly and accurately than manual control systems. These systems are often capable of automatic startups, shutdowns, and product changeover which can bring the process to stable conditions quickly, minimizing the generation of off-spec wastes. Other process optimization techniques include: equalizing the reactor and storage tank vent lines during batch filling to minimize vent gas losses; sequencing the addition of reactants and reagents to optimize yields and lower emissions; and optimizing sequences to minimize washing operations and cross-contamination of subsequent batches.
Reduce heat exchanger wastes and inefficiencies. Heat exchangers are often the source of significant off-spec product wastes generated by overheating the product closest to the tube walls. The best way to reduce off-spec product from overheating is by reducing the heat exchanger tube wall temperature. This can be accomplished through a number of techniques which do not reduce the overall heat transferred such as: reducing the tube wall temperature and increasing the effective surface area of the heat exchanger; using staged heating by first heating with waste heat, then low pressure steam, followed by superheated high pressure steam; monitor and prevent fouling of the heat exchanger tubes so that lower temperature heat sources can be used; using noncorroding tubes which will foul less quickly than tubes that corrode.
Improve wastewater treatment and recycling. A large portion of the inorganic chemical industry's pollutants leave the facilities as wastewater or wastewater treatment system sludge. Improved treatment and minimization of wastewater are effective pollution prevention opportunities that often do not require significant changes to the industrial processes. Modern wastewater treatment technologies such as ion exchange, electrolytic cells,
September 1995 55 SIC 281

Sector Notebook Project Inorganic Chemicals
reverse osmosis, and improved distillation, evaporation, and dewatering can often be added to existing treatment systems. Wastewater streams containing acids or metals can be concentrated enough to be sold commercially as a product by slightly altering the manufacturing process, adding processing steps, and segregating wastewater streams. Furthermore, many wastewater streams can be reused within the same or different processes, significantly reducing discharges to the wastewater treatment system. An ion exchange system installed in a mercury cell chlor-alkali plant reduced mercury by 99 percent in the facility's effluent. An inorganic chemicals plant making photochemistry solution generated a wastewater containing silver. Electrolytic cells were installed that recovered 98 percent of the silver and an evaporator was added that concentrated the remaining liquid for disposal resulting in a 90 percent reduction in waste volume.
Prevent leaks and spills. The elimination of sources of leaks and spills can be a very cost effective pollution prevention opportunity. Leaks and spills can be prevented by installing seamless pumps and other "leakless" components, maintaining a preventative maintenance program, and maintaining a leak detection program.
Improve inventory management and storage. Good inventory management can reduce the generation of wastes by preventing materials from exceeding their shelf life, preventing materials from being left over or not needed, and reducing the likelihood of accidental releases of stored material. Designating a materials storage area, limiting traffic through the area, and giving one person the responsibility to maintain and distribute materials can reduce materials use, and the contamination and dispersal of materials.
Exhibit 18 summarizes the above pollution prevention opportunities and provides additional examples provided by the Chemical Manufacturers Association.
September 1995 56 SIC 281
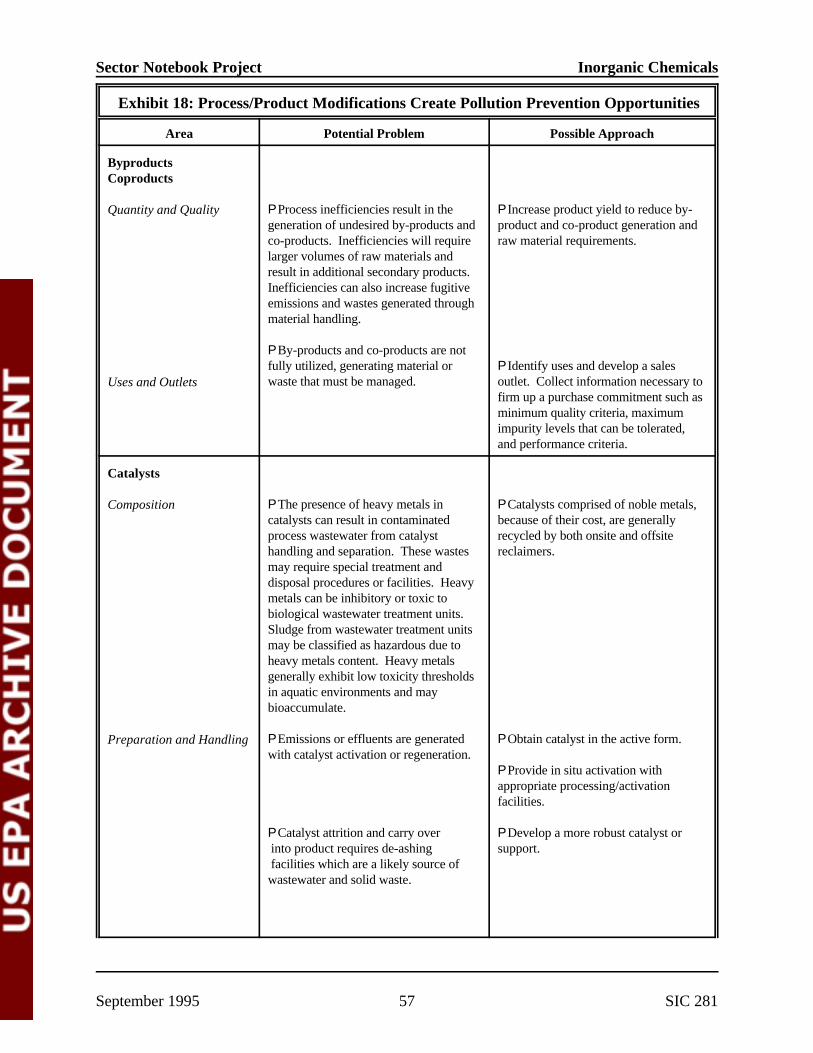
Sector Notebook Project Inorganic Chemicals
Exhibit 18: Process/Product Modifications Create Pollution Prevention Opportunities
Area Potential Problem Possible Approach
Byproducts Coproducts
Quantity and Quality
Uses and Outlets
P Process inefficiencies result in the generation of undesired by-products and co-products. Inefficiencies will require larger volumes of raw materials and result in additional secondary products. Inefficiencies can also increase fugitive emissions and wastes generated through material handling.
P By-products and co-products are not fully utilized, generating material or waste that must be managed.
P Increase product yield to reduce by-product and co-product generation and raw material requirements.
P Identify uses and develop a sales outlet. Collect information necessary to firm up a purchase commitment such as minimum quality criteria, maximum impurity levels that can be tolerated, and performance criteria.
Catalysts
Composition
Preparation and Handling
P The presence of heavy metals in catalysts can result in contaminated process wastewater from catalyst handling and separation. These wastes may require special treatment and disposal procedures or facilities. Heavy metals can be inhibitory or toxic to biological wastewater treatment units. Sludge from wastewater treatment units may be classified as hazardous due to heavy metals content. Heavy metals generally exhibit low toxicity thresholds in aquatic environments and may bioaccumulate.
P Emissions or effluents are generated with catalyst activation or regeneration.
P Catalyst attrition and carry over into product requires de-ashing facilities which are a likely source of wastewater and solid waste.
P Catalysts comprised of noble metals, because of their cost, are generally recycled by both onsite and offsite reclaimers.
P Obtain catalyst in the active form.
P Develop a more robust catalyst or support.
P Provide in situ activation with appropriate processing/activation facilities.
September 1995 57 SIC 281
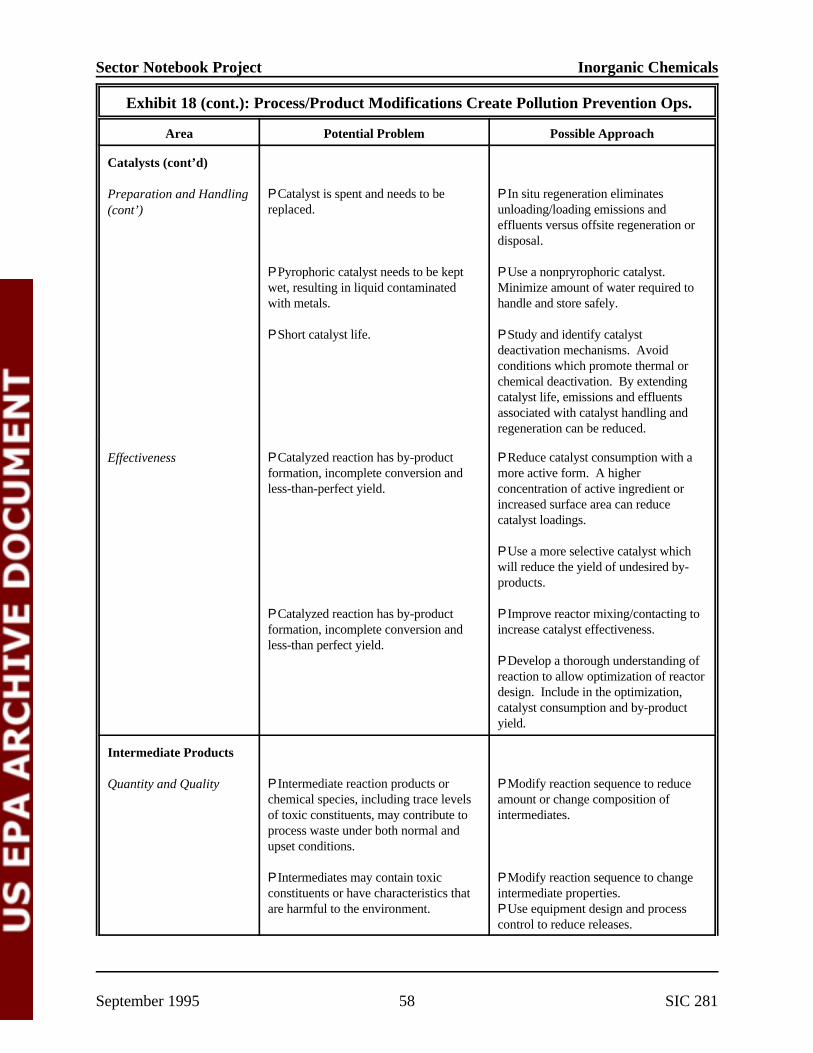
Sector Notebook Project Inorganic Chemicals
Exhibit 18 (cont.): Process/Product Modifications Create Pollution Prevention Ops.
Area Potential Problem Possible Approach
Catalysts (cont’d)
Preparation and Handling (cont’)
Effectiveness
P Catalyst is spent and needs to be replaced.
P Pyrophoric catalyst needs to be kept wet, resulting in liquid contaminated with metals.
P Short catalyst life.
P Catalyzed reaction has by-product formation, incomplete conversion and less-than-perfect yield.
P Catalyzed reaction has by-product formation, incomplete conversion and less-than perfect yield.
P In situ regeneration eliminates unloading/loading emissions and
P Use a nonpryrophoric catalyst. Minimize amount of water required to handle and store safely.
P Study and identify catalyst
effluents versus offsite regeneration or disposal.
deactivation mechanisms. Avoid conditions which promote thermal or chemical deactivation. By extending catalyst life, emissions and effluents associated with catalyst handling and regeneration can be reduced.
P Reduce catalyst consumption with a more active form. A higher concentration of active ingredient or
P Improve reactor mixing/contacting to increase catalyst effectiveness.
increased surface area can reduce catalyst loadings.
P Use a more selective catalyst which will reduce the yield of undesired by-products.
P Develop a thorough understanding of reaction to allow optimization of reactor design. Include in the optimization, catalyst consumption and by-product yield.
Intermediate Products
Quantity and Quality P Intermediate reaction products or chemical species, including trace levels of toxic constituents, may contribute to process waste under both normal and upset conditions.
P Intermediates may contain toxic constituents or have characteristics that are harmful to the environment.
P Modify reaction sequence to reduce amount or change composition of intermediates.
P Modify reaction sequence to change intermediate properties. P Use equipment design and process control to reduce releases.
September 1995 58 SIC 281

Sector Notebook Project Inorganic Chemicals
Exhibit 18 (cont.): Process/Product Modifications Create Pollution Prevention Ops.
Area Potential Problem Possible Approach
Process Conditions/ Configuration
Temperature P High heat exchange tube temperatures cause thermal cracking/decomposition of many chemicals. These lower molecular weight by-products are a source of "light ends" and fugitive emissions. High localized temperature gives rise to polymerization of reactive monomers, resulting in "heavies" or "tars." such materials can foul heat exchange equipment or plug fixed-bed reactors, thereby requiring costly equipment cleaning and production outage.
P Higher operating temperatures imply "heat input" usually via combustion which generates emissions.
P Heat sources such as furnaces and boilers are a source of combustion emissions.
P Vapor pressure increases with increasing temperature. Loading/ unloading, tankage and fugitive emissions generally increase with increasing vapor pressure.
P Select operating temperatures at or near ambient temperature whenever possible.
P Use lower pressure steam to lower temperatures.
P Use intermediate exchangers to avoid contact with furnace tubes and walls.
P Use staged heating to minimize product degradation and unwanted side
P Explore heat integration opportunities (e.g., use waste heat to preheat materials and reduce the amount of combustion
P Use thermocompressor to upgrade low-pressure steam to avoid the need for additional boilers and furnaces.
P If possible, cool materials before sending to storage.
P Use hot process streams to reheat feeds.
reactions.
P Use a super heat of high-pressure steam in place of furnace.
P Monitor exchanger fouling to correlate process conditions which increase fouling, avoid conditions which rapidly foul exchangers.
P Use online tube cleaning technologies to keep tube surfaces clean to increase heat transfer.
P Use scraped wall exchangers in viscous service.
P Use falling film reboiler, pumped recirculation reboiler or high-flux tubes.
required.)
September 1995 59 SIC 281
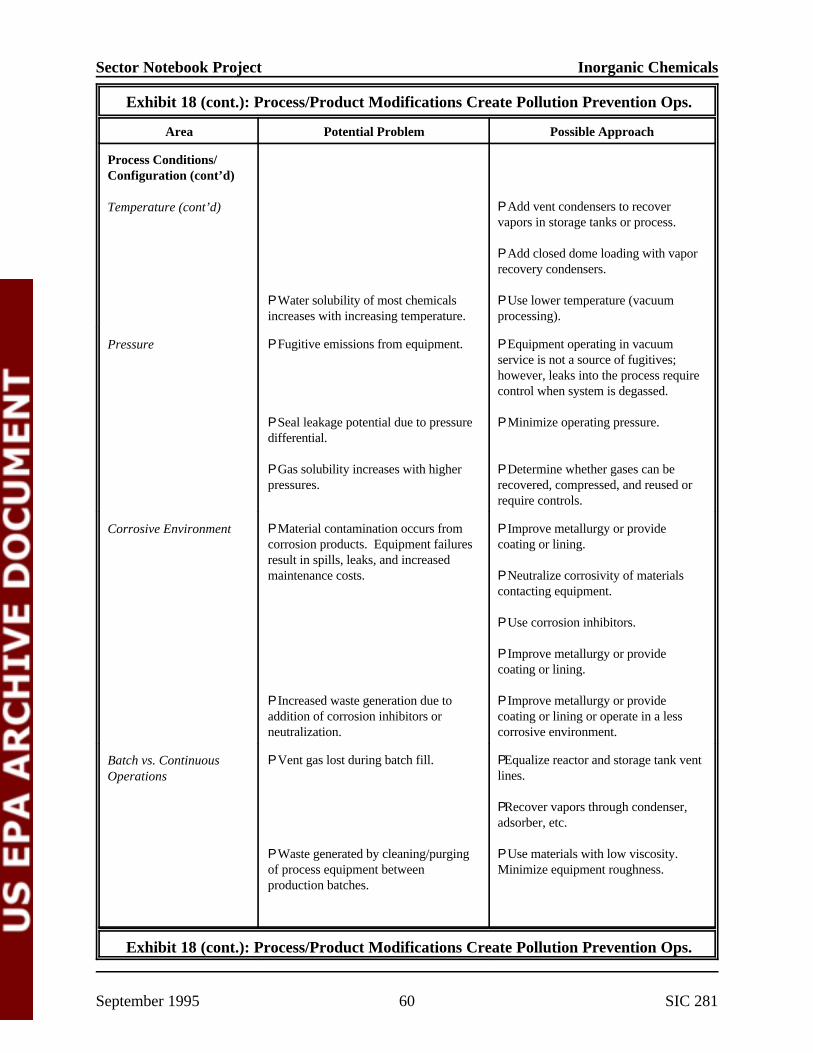
Sector Notebook Project Inorganic Chemicals
Exhibit 18 (cont.): Process/Product Modifications Create Pollution Prevention Ops.
Area Potential Problem Possible Approach
Process Conditions/ Configuration (cont’d)
Temperature (cont’d)
Pressure
Corrosive Environment
Batch vs. Continuous Operations
P Water solubility of most chemicals increases with increasing temperature.
P Fugitive emissions from equipment.
P Seal leakage potential due to pressure differential.
P Gas solubility increases with higher pressures.
P Material contamination occurs from corrosion products. Equipment failures result in spills, leaks, and increased maintenance costs.
P Increased waste generation due to addition of corrosion inhibitors or neutralization.
P Vent gas lost during batch fill.
P Waste generated by cleaning/purging of process equipment between production batches.
P Use lower temperature (vacuum processing).
P Add vent condensers to recover vapors in storage tanks or process.
P Add closed dome loading with vapor recovery condensers.
P Equipment operating in vacuum
P Minimize operating pressure.
P Determine whether gases can be recovered, compressed, and reused or
service is not a source of fugitives; however, leaks into the process require control when system is degassed.
require controls.
P Improve metallurgy or provide coating or lining.
P Neutralize corrosivity of materials
P Improve metallurgy or provide coating or lining or operate in a less corrosive environment.
contacting equipment.
P Use corrosion inhibitors.
P Improve metallurgy or provide coating or lining.
PEqualize reactor and storage tank vent
P Use materials with low viscosity. Minimize equipment roughness.
lines.
PRecover vapors through condenser, adsorber, etc.
Exhibit 18 (cont.): Process/Product Modifications Create Pollution Prevention Ops.
September 1995 60 SIC 281

Sector Notebook Project Inorganic Chemicals
Area Potential Problem Possible Approach
Process Conditions/ Configuration (cont’d)
Batch vs. Continuous Operations (cont’d)
Process Operation/Design
P Process inefficiencies lower yield and increase emissions.
P Continuous process fugitive emissions and waste increase over time due to equipment failure through a lack of maintenance between turnarounds.
P Numerous processing steps create wastes and opportunities for errors.
P Nonreactant materials (solvents, absorbents, etc.) create wastes. Each chemical (including water) employed within the process introduces additional potential waste sources; the composition generated wastes also tends to become more complex.
P High conversion with low yield results in wastes.
P Sequence addition of reactants and reagents to optimize yields and lower
PDesign facility to readily allow maintenance so as to avoid unexpected equipment failure and resultant release.
P Optimize product manufacturing sequence to minimize washing operations and cross-contamination of subsequent batches.
emissions.
P Keep it simple. Make sure all operations are necessary. More
P Evaluate unit operation or technologies (e.g., separation) that do not require the addition of solvents or other nonreactant chemicals.
operations and complexity only tend to increase potential emission and waste sources.
P Recycle operations generally improve overall use of raw materials and chemicals, thereby increasing the yield of desired products while at the same time reducing the generation of wastes. A case-in-point is to operate at a lower conversion per reaction cycle by reducing catalyst consumption, temperature, or residence time. Many times, this can result in a higher selectivity to desired products. The net effect upon recycle of unreacted reagents is an increase in product yield, while at the same time reducing the quantities of spent catalyst and less desirable by-products.
Exhibit 18 (cont.): Process/Product Modifications Create Pollution Prevention Ops.
Area Potential Problem Possible Approach
September 1995 61 SIC 281

Sector Notebook Project Inorganic Chemicals
Process Conditions/ Configuration (cont’d)
Process Operation/Design P Non-regenerative treatment systems result in increased waste versus regenerative systems.
P Regenerative fixed bed treating or desiccant operation (e.g., aluminum oxide, silica, activated carbon, molecular sieves, etc.) will generate less quantities of solid or liquid waste than nonregenerative units (e.g., calcium chloride or activated clay). With regenerative units though, emissions during bed activation and regeneration can be significant. Further, side reactions during activation/regeneration can give rise to problematic pollutants.
Product
Process Chemistry
Product Formulation
P Insufficient R&D into alternative reaction pathways may miss pollution opportunities such as reducing waste or eliminating a hazardous constituent.
P Product based on end-use performance may have undesirable environmental impacts or use raw materials or components that generate excessive or hazardous wastes.
P R&D during process conception and laboratory studies should thoroughly investigate alternatives in process chemistry that affect pollution
P Reformulate products by substituting different material or using a mixture of individual chemicals that meet end-use performance specifications.
prevention.
Raw Materials
Purity P Impurities may produce unwanted by-products and waste. Toxic impurities, even in trace amounts, can make a waste hazardous and therefore subject to strict and costly regulation.
P Excessive impurities may require more processing and equipment to meet product specifications, increasing costs and potential for fugitive emissions, leaks, and spills.
P Use higher purity materials.
P Purify materials before use and reuse if practical.
P Achieve balance between feed purity, processing steps, product quality, and waste generation.
P Use inhibitors to prevent side reactions.
Exhibit 18 (cont.): Process/Product Modifications Create Pollution Prevention Ops.
Area Potential Problem Possible Approach
September 1995 62 SIC 281

Sector Notebook Project Inorganic Chemicals
Raw Materials (cont’d)
Purity (cont’d)
Vapor Pressure
Water Solubility
P Specifying a purity greater than needed by the process increases costs and can generate more waste generation by the supplier.
P Impurities in clean air can increase inert purges.
P Impurities may poison catalyst prematurely resulting in increased wastes due to yield loss and more frequent catalyst replacement.
P Higher vapor pressures increase fugitive emissions in material handling and storage.
P High vapor pressure with low odor threshold materials can cause nuisance odors.
P Toxic or nonbiodegradable materials that are water soluble may affect wastewater treatment operation, efficiency, and cost.
P Higher solubility may increase potential for surface and groundwater contamination and may require more careful spill prevention, containment, and cleanup (SPCC) plans.
P Higher solubility may increase potential for storm water contamination in open areas.
P Process wastewater associated with water washing or hydrocarbon/water phase separation will be impacted by containment solubility in water. Appropriate wastewater treatment will be impacted.
P Specify a purity no greater than what the process needs.
PUse pure oxygen.
PInstall guard beds to protect catalysts.
P Use material with lower vapor pressure.
P Use materials with lower vapor pressure and higher odor threshold.
P Use less toxic or more biodegradable materials.
P Use less soluble materials.
P Use less soluble materials.
P Prevent direct contact with storm
P Minimize water usage.
P Reuse wash water.
P Determine optimum process conditions for phase separation.
water by diking or covering areas.
P Evaluate alternative separation technologies (coalescers, membranes, distillation, etc.)
September 1995 63 SIC 281

Sector Notebook Project Inorganic Chemicals
Exhibit 18 (cont.): Process/Product Modifications Create Pollution Prevention Ops.
Area Potential Problem Possible Approach
Raw Materials (cont’d)
Toxicity
Regulatory
Form of Supply
Handling and Storage
P Community and worker safety and health concerns result from routine and nonroutine emissions. Emissions sources include vents, equipment leaks, wastewater emissions, emergency pressure relief, etc.
P Surges or higher than normal continuous levels of toxic materials can shock or miss wastewater biological treatment systems resulting in possible fines and possible toxicity in the receiving water.
P Hazardous or toxic materials are stringently regulated. They may require enhanced control and monitoring; increased compliance issues and paperwork for permits and record keeping; stricter control for handling, shipping, and disposal; higher sampling and analytical costs; and increased health and safety costs.
P Small containers increase shipping frequency which increases chances of material releases and waste residues from shipping containers (including wash waters).
P Nonreturnable containers may increase waste.
P Physical state (solid, liquid, gaseous) may raise unique environmental, safety, and health issues with unloading operations and transfer to process equipment.
P Use less toxic materials.
P Reduce exposure through equipment design and process control. Use systems which are passive for emergency containment of toxic
P Use less toxic material.
P Reduce spills, leaks, and upset conditions through equipment and process control.
releases.
P Consider effect of chemicals on biological treatment; provide unit pretreatment or diversion capacity to remove toxicity.
P Install surge capacity for flow and concentration equalization.
P Use materials which are less toxic or hazardous.
P Use better equipment and process design to minimize or control releases; in some cases, meeting certain regulatory criteria will exempt a system from permitting or other regulatory requirements.
P Use bulk supply, ship by pipeline, or use “jumbo” drums or sacks.
P In some cases, product may be shipped out in the same containers the
P Use returnable shipping containers or drums.
material supply was shipped in without washing.
P Use equipment and controls appropriate to the type of materials to control releases.
September 1995 64 SIC 281

Sector Notebook Project Inorganic Chemicals
Exhibit 18 (cont.): Process/Product Modifications Create Pollution Prevention Ops.
Area Potential Problem Possible Approach
Raw Materials (cont’d)
Handling and Storage (cont’d)
P Large inventories can lead to spills, inherent safety issues and material expiration.
P Minimize inventory by utilizing just-in-time delivery.
Waste Streams
Quantity and Quality
Composition
Properties
Disposal
P Characteristics and sources of waste streams are unknown.
P Wastes are generated as part of the process.
P Hazardous or toxic constituents are found in waste streams. Examples are: sulfides, heavy metals, halogenated hydrocarbons, and polynuclear aromatics.
P Environmental fate and waste properties are not known or understood.
P Ability to treat and manage hazardous and toxic waste unknown or limited.
P Document sources and quantities of waste streams prior to pollution
P Determine what changes in process conditions would lower waste
prevention assessment.
generation of toxicity.
P Determine if wastes can be recycled back into the process.
P Evaluate whether different process conditions, routes, or reagent chemicals (e.g., solvent catalysts) can be substituted or changed to reduce or eliminate hazardous or toxic compounds.
P Evaluate waste characteristics using the following type properties: corrosivity, ignitability, reactivity, BTU content (energy recovery), biodegradability, aquatic toxicity, and bioaccumulation potential of the waste and of its degradable products, and whether it is a solid, liquid, or gas.
P Consider and evaluate all onsite and offsite recycle, reuse, treatment, and disposal options available. Determine availability of facilities to treat or manage wastes generated.
Source: Chemical Manufacturers Association. Designing Pollution Prevention into the Process, Research, Development and Engineering.
September 1995 65 SIC 281

Sector Notebook Project Inorganic Chemicals
Exhibit 19: Modifications to Equipment Can Also Prevent Pollution
Equipment Environment Problem Potential
Possible Approach
Related Design
Related Operational
Compressors, blowers, fans
P Shaft seal leaks Piston rod seal leaks Vent streams
P Seal-less designs (diaphragmatic, hermetic or magnetics)
P Design for low emissions (internal balancing, double inlet, gland eductors)
P Shaft seal designs (carbon rings, double mechanical seals, buffered seals)
P Double seal with barrier fluid vented to control device
P Preventive maintenance program
Concrete pads, floors, sumps
P Leaks to groundwater P Water stops
P Embedded metal plates
P Epoxy sealing
P Other impervious sealing
P Reduce unnecessary purges, transfers, and sampling
necessary P Use drip pans where
Controls P Shutdowns and Start-ups generate waste and releases
P Improve on-line controls
P On-line instrumentation
P Automatic start-up and shutdown
P On-line vibration analysis
P Use "consensus" systems (e.g., shutdown trip requires two out of three affirmative responses)
P Continuous versus batch
P Optimize on-line run time
P Optimize shutdown interlock inspection
P Identify safety and
instruments and equipment
frequency
environment critical
Distillation P Impurities remain in process streams
P Increase reflux ratio
P Add section to column
P Column intervals
P Change feed tray
P Change column operating conditions - reflux ratio
- temperature
- etc.
- feed tray
- pressure
September 1995 66 SIC 281

Sector Notebook Project Inorganic Chemicals
Exhibit 19 (cont.): Modifications to Equipment Can Also Prevent Pollution
Equipment Environment Problem Potential
Possible Approach
Related Design
Related Operational
Distillation (cont’d)
P Impurities remain in process streams (cont’d)
P Large amounts of contaminated water condensage from stream stripping
P Insulate to prevent heat loss
P Preheat column feed
P Increase vapor line size to lower pressure drop
stripping agents P Use reboilers or inert gas
P Clean column to reduce fouling
steam P Use higher temperature
General manufacturing equipment areas
P Contaminated rainwater
P Contaminated sprinkler and fire water
P Leaks and emissions during cleaning
P Provide roof over process facilities
P Seal floors
P Design for cleaning
P Segregate process sewer from storm sewer (diking)
P Hard-pipe process streams to process sewer
P Drain to sump
P Route to waste treatment
P Design for minimum rinsing
P Design for minimum sludge
P Provide vapor enclosure
P Drain to process
P Return samples to process
P Use drip pans for maintenance activities
P Monitor stormwater discharge
P Rinse to sump
P Reuse cleaning solutions
September 1995 67 SIC 281

Sector Notebook Project Inorganic Chemicals
Exhibit 19 (cont.): Modifications to Equipment Can Also Prevent Pollution
Equipment Environment Problem Potential
Possible Approach
Related Design
Related Operational
Heat exchangers
Piping
P Increased waste due to high localized temperatures
P Leaks to groundwater
P Contaminated materials due to tubes leaking at tube sheets
P Furnace emissions
Fugitive emissions
P Use intermediate exchangers to avoid contact with furnace tubes and walls
P Use staged heating to minimize product degradation and unwanted side reactions. (waste heat >>low pressure steam >>high pressure steam)
P Design equipment layout so
P Use welded tubes or double
Mount vertically
as to minimize pipe run
P Use scraped wall exchangers in viscous service
P Using falling film reboiler, piped recirculation reboiler or high-flux tubes
P Use lowest pressure steam possible
tube sheets with inert purge.
P Use super heat of high-pressure steam in place of a furnace
length
P Eliminate underground piping or design for cathodic protection if necessary to install piping underground
P Use welded fittings
P Reduce number of flanges and valves
P Select operating temperatures at or near ambient temperature when-
generally most desirable from a pollution prevention standpoint
P Use lower pressure steam
ever possible. These are
to lower temperatures
P Monitor for corrosion and
surfaces clean
P Monitor for leaks
erosion
P Monitor exchanger fouling to correlate process
fouling, avoid conditions which rapidly foul exchangers
P Use on-line tube cleaning techniques to keep tube
P Paint to prevent external corrosion
conditions which increase
September 1995 68 SIC 281

Sector Notebook Project Inorganic Chemicals
Exhibit 19 (cont.): Modifications to Equipment Can Also Prevent Pollution
Equipment Environment Problem Potential
Possible Approach
Related Design
Related Operational
Piping (cont’d) P Leaks to groundwater Fugitive emissions (cont’d)
P Releases when cleaning or purging lines
P Use all welded pipe
P Use "pigs" for cleaning
P Use secondary containment
P Use spiral-wound gaskets
P Use plugs and double valves for open end lines
P Change metallurgy
P Use lined pipe
P Slope to low point drain
P Use heat tracing and insulation to prevent freezing
P Install equalizer lines
P Flush to product storage tank
Pumps P Fugitive emissions from shaft seal leaks
P Fugitive emissions from shaft seal leaks
P Residual "heel" of liquid during pump maintenance
P Mechanical seal in lieu of packing
P Use pressure transfer to eliminate pump
P Low point drain on pump casing
P Double mechanical seal with inert barrier fluid
P Double machined seal with barrier fluid vented to control device
P Seal-less pump (canned motor magnetic drive)
P Vertical pump
P Seal installation practices
P Flush casing to process sewer for treatment
P Monitor for leaks
September 1995 69 SIC 281

Sector Notebook Project Inorganic Chemicals
Exhibit 19 (cont.): Modifications to Equipment Can Also Prevent Pollution
Equipment Environment Problem Potential
Possible Approach
Related Design
Related Operational
Pumps (cont’d)
Reactors
P Injection of seal flush
P Poor conversion or
fluid into process stream
performance due to inadequate mixing
P Waste by-product formation
P Use double mechanical seal
P Static mixing
with inert barrier fluid where
P Add baffles
practical
P Change impellers
P Provide separate reactor for converting recycle streams to
P Add horsepower
P Add distributor
usable products
P Increase the mean time
P Add ingredients with
between pump failures by:
optimum sequence
- selecting proper seal material; - aligning well; - reducing pipe-induced stress; - maintaining seal lubrication
P Optimize reaction conditions (temperature,
P Allow proper head space
effect
pressure, etc.)
in reactor to enhance vortex
Relief Valve P Leaks
P Fugitive emissions
P Discharge to environment from over pressure
P Frequent relief
P Provide upstream rupture
P Vent to control or recovery
P Pump discharges to suction of pump
P Use pilot operated relief
disc
device
P Thermal relief to tanks
P Avoid discharge to roof areas to prevent contamination of rainwater
valve
P Increase margin between design and operating pressure
P Monitor for leaks and for
P Monitor for leaks
P Reduce operating
control efficiency
pressure
P Review system performance
Exhibit 19 (cont.): Modifications to Equipment Can Also Prevent Pollution
September 1995 70 SIC 281
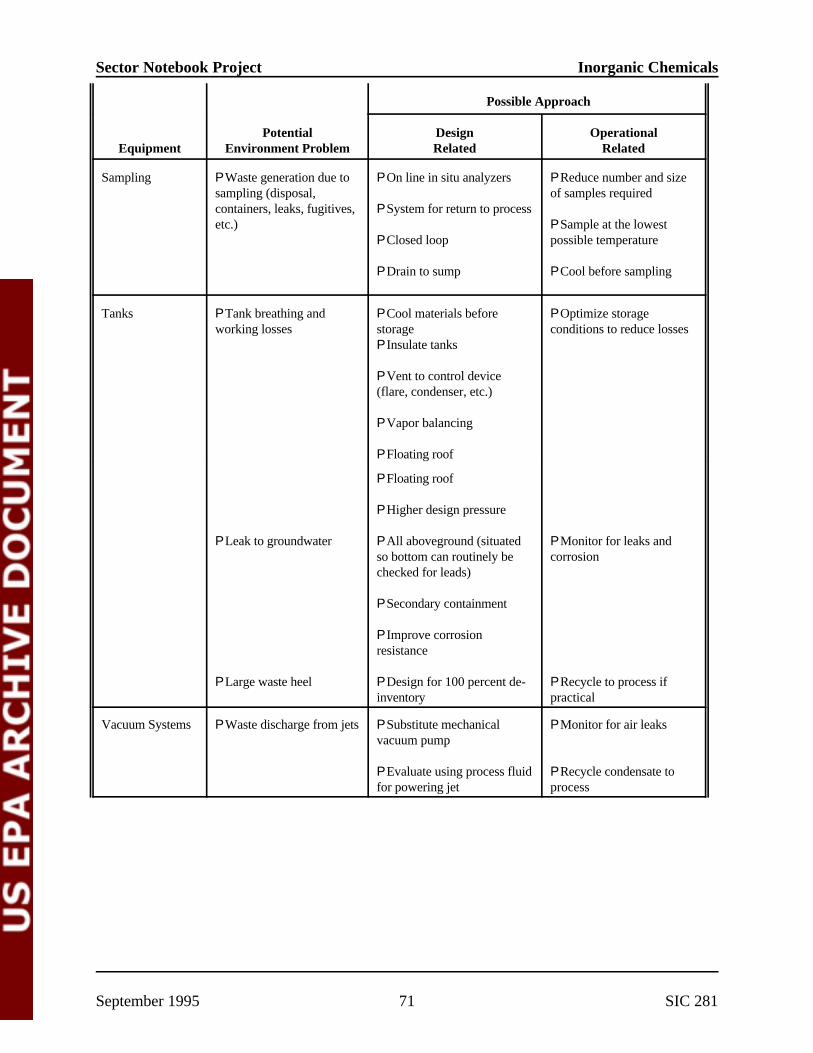
Sector Notebook Project Inorganic Chemicals
Possible Approach
Equipment Environment Problem Related Related Potential Design Operational
Sampling P Waste generation due to P On line in situ analyzers P Reduce number and size sampling (disposal, of samples required containers, leaks, fugitives, P System for return to process etc.) P Sample at the lowest
P Closed loop possible temperature
P Drain to sump P Cool before sampling
Tanks P Tank breathing and P Cool materials before P Optimize storage working losses storage conditions to reduce losses
P Insulate tanks
P Vent to control device (flare, condenser, etc.)
P Vapor balancing
P Floating roof
P Leak to groundwater P All aboveground (situated P Monitor for leaks and
P Large waste heel P Design for 100 percent de- P Recycle to process if
P Floating roof
P Higher design pressure
so bottom can routinely be corrosion checked for leads)
P Secondary containment
P Improve corrosion resistance
inventory practical
Vacuum Systems P Waste discharge from jets P Substitute mechanical P Monitor for air leaks vacuum pump
P Evaluate using process fluid P Recycle condensate to for powering jet process
September 1995 71 SIC 281

Sector Notebook Project Inorganic Chemicals
Exhibit 19 (cont.): Modifications to Equipment Can Also Prevent Pollution
Equipment Environment Problem Potential
Possible Approach
Related Design
Related Operational
Valves P Fugitive emissions from leaks
P Bellow seals
P Reduce number where practical
P Special packing sets
P Stringent adherence to packing procedures
Vents P Release to environment P Route to control or recovery device
P Monitor performance
Source: Chemical Manufacturers Association. Designing Pollution Prevention into the Process, Research, Development and Engineering.
It is critical to emphasize that pollution prevention in the chemical industry is process specific and oftentimes constrained by site-specific considerations. As such, it is difficult to generalize about the relative merits of different pollution prevention strategies. The age, size, and purpose of the plant will influence the most effective pollution prevention strategy. Commodity chemical manufacturers redesign their processes infrequently so that redesign of the reaction process or equipment is unlikely in the short term. Here, operational changes are the most feasible response. Specialty chemical manufacturers are making a greater variety of chemicals and have more process and design flexibility. Incorporating changes at the earlier research and development phases may be possible for them.
September 1995 72 SIC 281

Sector Notebook Project Inorganic Chemicals
VI. SUMMARY OF APPLICABLE FEDERAL STATUTES AND REGULATIONS
This section discusses the Federal regulations that may apply to this sector. The purpose of this section is to highlight, and briefly describe the applicable Federal requirements, and to provide citations for more detailed information. The three following sections are included.
C Section VI.A. contains a general overview of major statutesC Section VI.B. contains a list of regulations specific to this industryC Section VI.C. contains a list of pending and proposed regulations
The descriptions within Section VI are intended solely for general information. Depending upon the nature or scope of the activities at a particular facility, these summaries may or may not necessarily describe all applicable environmental requirements. Moreover, they do not constitute formal interpretations or clarifications of the statutes and regulations. For further information, readers should consult the Code of Federal Regulations and other state or local agencies. EPA Hotline contacts are also provided for each major statute.
VI.A. General Description of Major Statutes
Resource Conservation And Recovery Act
The Resource Conservation And Recovery Act (RCRA) of 1976 which amended the Solid Waste Disposal Act, addresses solid (Subtitle D) and hazardous (Subtitle C) waste management activities. The Hazardous and Solid Waste Amendments (HSWA) of 1984 strengthened RCRA’s waste management provisions and added Subtitle I, which governs underground storage tanks (USTs).
Regulations promulgated pursuant to Subtitle C of RCRA (40 CFR Parts 260-299) establish a “cradle-to-grave” system governing hazardous waste from the point of generation to disposal. RCRA hazardous wastes include the specific materials listed in the regulations (commercial chemical products, designated with the code "P" or "U"; hazardous wastes from specific industries/sources, designated with the code "K"; or hazardous wastes from non-specific sources, designated with the code "F") or materials which exhibit a hazardous waste characteristic (ignitability, corrosivity, reactivity, or toxicity and designated with the code "D").
Regulated entities that generate hazardous waste are subject to waste accumulation, manifesting, and record keeping standards. Facilities that treat, store, or dispose of hazardous waste must obtain a permit, either from EPA or from a State agency which EPA has authorized to implement the permitting program. Subtitle C permits contain general facility standards such as
September 1995 73 SIC 281

Sector Notebook Project Inorganic Chemicals
contingency plans, emergency procedures, record keeping and reporting requirements, financial assurance mechanisms, and unit-specific standards. RCRA also contains provisions (40 CFR Part 264 Subpart S and §264.10) for conducting corrective actions which govern the cleanup of releases of hazardous waste or constituents from solid waste management units at RCRA-regulated facilities.
Although RCRA is a Federal statute, many States implement the RCRA program. Currently, EPA has delegated its authority to implement various provisions of RCRA to 46 of the 50 States.
Most RCRA requirements are not industry specific but apply to any company that transports, treats, stores, or disposes of hazardous waste. Here are some important RCRA regulatory requirements:
C Identification of Solid and Hazardous Wastes (40 CFR Part 261) lays out the procedure every generator should follow to determine whether the material created is considered a hazardous waste, solid waste, or is exempted from regulation.
C Standards for Generators of Hazardous Waste (40 CFR Part 262) establishes the responsibilities of hazardous waste generators including obtaining an ID number, preparing a manifest, ensuring proper packaging and labeling, meeting standards for waste accumulation units, and record keeping and reporting requirements. Generators can accumulate hazardous waste for up to 90 days (or 180 days depending on the amount of waste generated) without obtaining a permit.
C Land Disposal Restrictions (LDRs) are regulations prohibiting the disposal of hazardous waste on land without prior treatment. Under the LDRs (40 CFR 268), materials must meet land disposal restriction (LDR) treatment standards prior to placement in a RCRA land disposal unit (landfill, land treatment unit, waste pile, or surface impoundment). Wastes subject to the LDRs include solvents, electroplating wastes, heavy metals, and acids. Generators of waste subject to the LDRs must provide notification of such to the designated TSD facility to ensure proper treatment prior to disposal.
C Used Oil storage and disposal regulations (40 CFR Part 279) do not define Used Oil Management Standards impose management requirements affecting the storage, transportation, burning, processing, and re-refining of the used oil. For parties that merely generate used oil, regulations establish storage standards. For a party considered a used oil marketer (one who generates and sells
September 1995 74 SIC 281

Sector Notebook Project Inorganic Chemicals
off-specification used oil directly to a used oil burner), additional tracking and paperwork requirements must be satisfied.
C Tanks and Containers used to store hazardous waste with a high volatile organic concentration must meet emission standards under RCRA. Regulations (40 CFR Part 264-265, Subpart CC) require generators to test the waste to determine the concentration of the waste, to satisfy tank and container emissions standards, and to inspect and monitor regulated units. These regulations apply to all facilities who store such waste, including generators operating under the 90-day accumulation rule.
C Underground Storage Tanks (USTs) containing petroleum and hazardous substance are regulated under Subtitle I of RCRA. Subtitle I regulations (40 CFR Part 280) contain tank design and release detection requirements, as well as financial responsibility and corrective action standards for USTs. The UST program also establishes increasingly stringent standards, including upgrade requirements for existing tanks, that must be met by 1998.
C Boilers and Industrial Furnaces (BIFs) that use or burn fuel containing hazardous waste must comply with strict design and operating standards. BIF regulations (40 CFR Part 266, Subpart H) address unit design, provide performance standards, require emissions monitoring, and restrict the type of waste that may be burned.
EPA's RCRA/Superfund/UST Hotline, at (800) 424-9346, responds to questions and distributes guidance regarding all RCRA regulations. The RCRA Hotline operates weekdays from 8:30 a.m. to 7:30 p.m., ET, excluding Federal holidays.
Comprehensive Environmental Response, Compensation, And Liability Act
The Comprehensive Environmental Response, Compensation, and Liability Act (CERCLA), a 1980 law commonly known as Superfund, authorizes EPA to respond to releases, or threatened releases, of hazardous substances that may endanger public health, welfare, or the environment. CERCLA also enables EPA to force parties responsible for environmental contamination to clean it up or to reimburse the Superfund for response costs incurred by EPA. The Superfund Amendments and Reauthorization Act (SARA) of 1986 revised various sections of CERCLA, extended the taxing authority for the Superfund, and created a free-standing law, SARA Title III, also known as the Emergency Planning and Community Right-to-Know Act (EPCRA).
The CERCLA hazardous substance release reporting regulations (40 CFR Part 302) direct the person in charge of a facility to report to the National
September 1995 75 SIC 281
Sector Notebook Project Inorganic Chemicals
Response Center (NRC) any environmental release of a hazardous substance which exceeds a reportable quantity. Reportable quantities are defined and listed in 40 CFR §302.4. A release report may trigger a response by EPA, or by one or more Federal or State emergency response authorities.
EPA implements hazardous substance responses according to procedures outlined in the National Oil and Hazardous Substances Pollution Contingency Plan (NCP) (40 CFR Part 300). The NCP includes provisions for permanent cleanups, known as remedial actions, and other cleanups referred to as "removals." EPA generally takes remedial actions only at sites on the National Priorities List (NPL), which currently includes approximately 1300 sites. Both EPA and states can act at other sites; however, EPA provides responsible parties the opportunity to conduct removal and remedial actions and encourages community involvement throughout the Superfund response process.
EPA's RCRA/Superfund/UST Hotline, at (800) 424-9346, answers questions and references guidance pertaining to the Superfund program. The CERCLA Hotline operates weekdays from 8:30 a.m. to 7:30 p.m., ET, excluding Federal holidays.
Emergency Planning And Community Right-To-Know Act
The Superfund Amendments and Reauthorization Act (SARA) of 1986 created the Emergency Planning and Community Right-to-Know Act (EPCRA, also known as SARA Title III), a statute designed to improve community access to information about chemical hazards and to facilitate the development of chemical emergency response plans by State and local governments. EPCRA required the establishment of State emergency response commissions (SERCs), responsible for coordinating certain emergency response activities and for appointing local emergency planning committees (LEPCs).
EPCRA and the EPCRA regulations (40 CFR Parts 350-372) establish four types of reporting obligations for facilities which store or manage specified chemicals:
C EPCRA §302 requires facilities to notify the SERC and LEPC of the presence of any "extremely hazardous substance" (the list of such substances is in 40 CFR Part 355, Appendices A and B) if it has such substance in excess of the substance's threshold planning quantity, and directs the facility to appoint an emergency response coordinator.
C EPCRA §304 requires the facility to notify the SERC and the LEPC in the event of a release exceeding the reportable quantity of a
September 1995 76 SIC 281

Sector Notebook Project Inorganic Chemicals
CERCLA hazardous substance or an EPCRA extremely hazardous substance.
C EPCRA §311 and §312 require a facility at which a hazardous chemical, as defined by the Occupational Safety and Health Act, is present in an amount exceeding a specified threshold to submit to the SERC, LEPC and local fire department material safety data sheets (MSDSs) or lists of MSDS's and hazardous chemical inventory forms (also known as Tier I and II forms). This information helps the local government respond in the event of a spill or release of the chemical.
C EPCRA §313 requires manufacturing facilities included in SIC codes 20 through 39, which have ten or more employees, and which manufacture, process, or use specified chemicals in amounts greater than threshold quantities, to submit an annual toxic chemical release report. This report, commonly known as the Form R, covers releases and transfers of toxic chemicals to various facilities and environmental media, and allows EPA to compile the national Toxic Release Inventory (TRI) database.
All information submitted pursuant to EPCRA regulations is publicly accessible, unless protected by a trade secret claim.
EPA's EPCRA Hotline, at (800) 535-0202, answers questions and distributes guidance regarding the emergency planning and community right-to-know regulations. The EPCRA Hotline operates weekdays from 8:30 a.m. to 7:30 p.m., ET, excluding Federal holidays.
Clean Water Act
The primary objective of the Federal Water Pollution Control Act, commonly referred to as the Clean Water Act (CWA), is to restore and maintain the chemical, physical, and biological integrity of the nation's surface waters. Pollutants regulated under the CWA include "priority" pollutants, including various toxic pollutants; "conventional" pollutants, such as biochemical oxygen demand (BOD), total suspended solids (TSS), fecal coliform, oil and grease, and pH; and "non-conventional" pollutants, including any pollutant not identified as either conventional or priority.
The CWA regulates both direct and indirect discharges. The National Pollutant Discharge Elimination System (NPDES) program (CWA §402) controls direct discharges into navigable waters. Direct discharges or "point source" discharges are from sources such as pipes and sewers. NPDES permits, issued by either EPA or an authorized State (EPA has authorized approximately forty States to administer the NPDES program), contain industry-specific, technology-based and/or water quality-based limits, and
September 1995 77 SIC 281

Sector Notebook Project Inorganic Chemicals
establish pollutant monitoring requirements. A facility that intends to discharge into the nation's waters must obtain a permit prior to initiating its discharge. A permit applicant must provide quantitative analytical data identifying the types of pollutants present in the facility's effluent. The permit will then set forth the conditions and effluent limitations under which a facility may make a discharge.
A NPDES permit may also include discharge limits based on Federal or State water quality criteria or standards, that were designed to protect designated uses of surface waters, such as supporting aquatic life or recreation. These standards, unlike the technological standards, generally do not take into account technological feasibility or costs. Water quality criteria and standards vary from State to State, and site to site, depending on the use classification of the receiving body of water. Most States follow EPA guidelines which propose aquatic life and human health criteria for many of the 126 priority pollutants.
Storm Water Discharges
In 1987 the CWA was amended to require EPA to establish a program to address storm water discharges. In response, EPA promulgated the NPDES storm water permit application regulations. Storm water discharge associated with industrial activity means the discharge from any conveyance which is used for collecting and conveying storm water and which is directly related to manufacturing, processing, or raw materials storage areas at an industrial plant (40 CFR 122.26(b)(14)). These regulations require that facilities with the following storm water discharges apply for an NPDES permit: (1) a discharge associated with industrial activity; (2) a discharge from a large or medium municipal storm sewer system; or (3) a discharge which EPA or the State determines to contribute to a violation of a water quality standard or is a significant contributor of pollutants to waters of the United States.
The term "storm water discharge associated with industrial activity" means a storm water discharge from one of 11 categories of industrial activity defined at 40 CFR 122.26. Six of the categories are defined by SIC codes while the other five are identified through narrative descriptions of the regulated industrial activity. If the primary SIC code of the facility is one of those identified in the regulations, the facility is subject to the storm water permit application requirements. If any activity at a facility is covered by one of the five narrative categories, storm water discharges from those areas where the activities occur are subject to storm water discharge permit application requirements. Those facilities/activities that are subject to storm water discharge permit application requirements are identified below. To determine whether a particular facility falls within one of these categories, the regulation should be consulted.
September 1995 78 SIC 281

Sector Notebook Project Inorganic Chemicals
Category i: Facilities subject to storm water effluent guidelines, new source performance standards, or toxic pollutant effluent standards.
Category ii: Facilities classified as SIC 24-lumber and wood products (except wood kitchen cabinets); SIC 26-paper and allied products (except paperboard containers and products); SIC 28-chemicals and allied products (except drugs and paints); SIC 291-petroleum refining; and SIC 311-leather tanning and finishing.
Category iii: Facilities classified as SIC 10-metal mining; SIC 12-coal mining; SIC 13-oil and gas extraction; and SIC 14-nonmetallic mineral mining.
Category iv: Hazardous waste treatment, storage, or disposal facilities.
Category v: Landfills, land application sites, and open dumps that receive or have received industrial wastes.
Category vi: Facilities classified as SIC 5015-used motor vehicle parts; and SIC 5093-automotive scrap and waste material recycling facilities.
Category vii: Steam electric power generating facilities.
Category viii: Facilities classified as SIC 40-railroad transportation; SIC 41-local passenger transportation; SIC 42-trucking and warehousing (except public warehousing and storage); SIC 43-U.S. Postal Service; SIC 44-water transportation; SIC 45-transportation by air; and SIC 5171-petroleum bulk storage stations and terminals.
Category ix: Sewage treatment works.
Category x: Construction activities except operations that result in the disturbance of less than five acres of total land area.
Category xi: Facilities classified as SIC 20-food and kindred products; SIC 21-tobacco products; SIC 22-textile mill products; SIC 23-apparel related products; SIC 2434-wood kitchen cabinets manufacturing; SIC 25-furniture and fixtures; SIC 265-paperboard containers and boxes; SIC 267-converted paper and paperboard products; SIC 27-printing, publishing, and allied industries; SIC 283-drugs; SIC 285-paints, varnishes, lacquer, enamels, and allied products; SIC 30-rubber and plastics; SIC 31-leather and leather products (except leather and tanning and finishing); SIC 323-glass products; SIC 34-fabricated metal products (except fabricated structural metal); SIC 35-industrial and commercial machinery and computer equipment; SIC 36-electronic and other electrical equipment and components; SIC 37-
September 1995 79 SIC 281

Sector Notebook Project Inorganic Chemicals
transportation equipment (except ship and boat building and repairing); SIC 38-measuring, analyzing, and controlling instruments; SIC 39-miscellaneous manufacturing industries; and SIC 4221-4225-public warehousing and storage.
Pretreatment Program
Another type of discharge that is regulated by the CWA is one that goes to a publicly-owned treatment works (POTWs). The national pretreatment program (CWA §307(b)) controls the indirect discharge of pollutants to POTWs by "industrial users." Facilities regulated under §307(b) must meet certain pretreatment standards. The goal of the pretreatment program is to protect municipal wastewater treatment plants from damage that may occur when hazardous, toxic, or other wastes are discharged into a sewer system and to protect the quality of sludge generated by these plants. Discharges to a POTW are regulated primarily by the POTW itself, rather than the State or EPA.
EPA has developed technology-based standards for industrial users of POTWs. Different standards apply to existing and new sources within each category. "Categorical" pretreatment standards applicable to an industry on a nationwide basis are developed by EPA. In addition, another kind of pretreatment standard, "local limits," are developed by the POTW in order to assist the POTW in achieving the effluent limitations in its NPDES permit.
Regardless of whether a State is authorized to implement either the NPDES or the pretreatment program, if it develops its own program, it may enforce requirements more stringent than Federal standards.
EPA’s Office of Water, at (202) 260-5700, will direct callers with questions about the CWA to the appropriate EPA office. EPA also maintains a bibliographic database of Office of Water publications which can be accessed through the Ground Water and Drinking Water resource center, at (202) 260-7786.
Safe Drinking Water Act
The Safe Drinking Water Act (SDWA) mandates that EPA establish regulations to protect human health from contaminants in drinking water. The law authorizes EPA to develop national drinking water standards and to create a joint Federal-State system to ensure compliance with these standards. The SDWA also directs EPA to protect underground sources of drinking water through the control of underground injection of liquid wastes.
EPA has developed primary and secondary drinking water standards under its SDWA authority. EPA and authorized States enforce the primary drinking
September 1995 80 SIC 281
Sector Notebook Project Inorganic Chemicals
water standards, which are, contaminant-specific concentration limits that apply to certain public drinking water supplies. Primary drinking water standards consist of maximum contaminant level goals (MCLGs), which are non-enforceable health-based goals, and maximum contaminant levels (MCLs), which are enforceable limits set as close to MCLGs as possible, considering cost and feasibility of attainment.
The SDWA Underground Injection Control (UIC) program (40 CFR Parts 144-148) is a permit program which protects underground sources of drinking water by regulating five classes of injection wells. UIC permits include design, operating, inspection, and monitoring requirements. Wells used to inject hazardous wastes must also comply with RCRA corrective action standards in order to be granted a RCRA permit, and must meet applicable RCRA land disposal restrictions standards. The UIC permit program is primarily State-enforced, since EPA has authorized all but a few States to administer the program.
The SDWA also provides for a Federally-implemented Sole Source Aquifer program, which prohibits Federal funds from being expended on projects that may contaminate the sole or principal source of drinking water for a given area, and for a State-implemented Wellhead Protection program, designed to protect drinking water wells and drinking water recharge areas.
EPA’s Safe Drinking Water Hotline, at (800) 426-4791, answers questions and distributes guidance pertaining to SDWA standards. The Hotline operates from 9:00 a.m. through 5:30 p.m., ET, excluding Federal holidays.
Toxic Substances Control Act
The Toxic Substances Control Act (TSCA) granted EPA authority to create a regulatory framework to collect data on chemicals in order to evaluate, assess, mitigate, and control risks which may be posed by their manufacture, processing, and use. TSCA provides a variety of control methods to prevent chemicals from posing unreasonable risk.
TSCA standards may apply at any point during a chemical’s life cycle. Under TSCA §5, EPA has established an inventory of chemical substances. If a chemical is not already on the inventory, and has not been excluded by TSCA, a premanufacture notice (PMN) must be submitted to EPA prior to manufacture or import. The PMN must identify the chemical and provide available information on health and environmental effects. If available data are not sufficient to evaluate the chemicals effects, EPA can impose restrictions pending the development of information on its health and environmental effects. EPA can also restrict significant new uses of chemicals based upon factors such as the projected volume and use of the chemical.
September 1995 81 SIC 281

Sector Notebook Project Inorganic Chemicals
Under TSCA §6, EPA can ban the manufacture or distribution in commerce, limit the use, require labeling, or place other restrictions on chemicals that pose unreasonable risks. Among the chemicals EPA regulates under §6 authority are asbestos, chlorofluorocarbons (CFCs), and polychlorinated biphenyls (PCBs).
EPA’s TSCA Assistance Information Service, at (202) 554-1404, answers questions and distributes guidance pertaining to Toxic Substances Control Act standards. The Service operates from 8:30 a.m. through 4:30 p.m., ET, excluding Federal holidays.
Clean Air Act
The Clean Air Act (CAA) and its amendments, including the Clean Air Act Amendments (CAAA) of 1990, are designed to “protect and enhance the nation's air resources so as to promote the public health and welfare and the productive capacity of the population.” The CAA consists of six sections, known as Titles, which direct EPA to establish national standards for ambient air quality and for EPA and the States to implement, maintain, and enforce these standards through a variety of mechanisms. Under the CAAA, many facilities will be required to obtain permits for the first time. State and local governments oversee, manage, and enforce many of the requirements of the CAAA. CAA regulations appear at 40 CFR Parts 50 through 99.
Pursuant to Title I of the CAA, EPA has established national ambient air quality standards (NAAQSs) to limit levels of "criteria pollutants," including carbon monoxide, lead, nitrogen dioxide, particulate matter, ozone, and sulfur dioxide. Geographic areas that meet NAAQSs for a given pollutant are classified as attainment areas; those that do not meet NAAQSs are classified as non-attainment areas. Under §110 of the CAA, each State must develop a State Implementation Plan (SIP) to identify sources of air pollution and to determine what reductions are required to meet Federal air quality standards.
Title I also authorizes EPA to establish New Source Performance Standards (NSPSs), which are nationally uniform emission standards for new stationary sources falling within particular industrial categories. NSPSs are based on the pollution control technology available to that category of industrial source but allow the affected industries the flexibility to devise a cost-effective means of reducing emissions.
Under Title I, EPA establishes and enforces National Emission Standards for Hazardous Air Pollutants (NESHAPs), nationally uniform standards oriented towards controlling particular hazardous air pollutants (HAPs). Title III of the CAAA further directed EPA to develop a list of sources that emit any of 189 HAPs, and to develop regulations for these categories of sources. To date EPA has listed 174 categories and developed a schedule for the
September 1995 82 SIC 281

Sector Notebook Project Inorganic Chemicals
establishment of emission standards. The emission standards will be developed for both new and existing sources based on "maximum achievable control technology" (MACT). The MACT is defined as the control technology achieving the maximum degree of reduction in the emission of the HAPs, taking into account cost and other factors.
Title II of the CAA pertains to mobile sources, such as cars, trucks, buses, and planes. Reformulated gasoline, automobile pollution control devices, and vapor recovery nozzles on gas pumps are a few of the mechanisms EPA uses to regulate mobile air emission sources.
Title IV establishes a sulfur dioxide emissions program designed to reduce the formation of acid rain. Reduction of sulfur dioxide releases will be obtained by granting to certain sources limited emissions allowances, which, beginning in 1995, will be set below previous levels of sulfur dioxide releases.
Title V of the CAAA of 1990 created a permit program for all "major sources" (and certain other sources) regulated under the CAA. One purpose of the operating permit is to include in a single document all air emissions requirements that apply to a given facility. States are developing the permit programs in accordance with guidance and regulations from EPA. Once a State program is approved by EPA, permits will be issued and monitored by that State.
Title VI is intended to protect stratospheric ozone by phasing out the manufacture of ozone-depleting chemicals and restrict their use and distribution. Production of Class I substances, including 15 kinds of chlorofluorocarbons (CFCs), will be phased out entirely by the year 2000, while certain hydrochlorofluorocarbons (HCFCs) will be phased out by 2030.
EPA's Control Technology Center, at (919) 541-0800, provides general assistance and information on CAA standards. The Stratospheric Ozone Information Hotline, at (800) 296-1996, provides general information about regulations promulgated under Title VI of the CAA, and EPA's EPCRA Hotline, at (800) 535-0202, answers questions about accidental release prevention under CAA §112(r). In addition, the Technology Transfer Network Bulletin Board System (modem access (919) 541-5742)) includes recent CAA rules, EPA guidance documents, and updates of EPA activities.
VI.B. Industry Specific Requirements
The inorganic chemical industry is affected by nearly all federal environmental statutes. In addition, the industry is subject to numerous laws and regulations from state and local governments designed to protect and improve health, safety, and the environment. A summary of the major federal regulations affecting the chemical industry follows.
September 1995 83 SIC 281

Sector Notebook Project Inorganic Chemicals
Federal Statutes
Toxic Substances Control Act
The Toxic Substances Control Act (TSCA), passed in 1976, gives the Environmental Protection Agency comprehensive authority to regulate any chemical substance whose manufacture, processing, distribution in commerce, use, or disposal may present an unreasonable risk of injury to health or the environment. Three sections are of primary importance to the inorganic chemical industry. Section 5 mandates that chemical companies submit to EPA pre-manufacture notices that provide information on health and environmental effects for each new product and test existing products for these effects. To date, over 20,000 premanufacturing notices have been filed. Section 4 authorizes the EPA to require testing of certain substances. Section 6 gives the EPA authority to prohibit, limit, or ban the manufacture, process, and use of chemicals. Under Section 6 of TSCA, EPA has banned most uses of asbestos. In 1990, however, the chlor-alkali industry was able to show that it did not have difficulty meeting the required exposure limits for asbestos fibers, and the use of asbestos as a diaphragm material was exempted from the TSCA ban.
Clean Air Act
The Clean Air Act Amendments of 1990 set National Emission Standards for Hazardous Air Pollutants (NESHAP) from industrial sources for 41 pollutants to be met by 1995 and for 148 other pollutants to be reached by 2003. Several provisions affect the inorganic chemical industry. The EPA will promulgate maximum achievable control technology (MACT) standards and Lowest Achievable Emission Rates will be required in NAAQS non-attainment areas (Iliam Rosario, U.S. EPA, OAQPS, WAM for Chlorine Production NESHAP (919)-541-5308). An information collection request survey was sent out to the chlor-alkali industry in 1992. The data obtained from the survey will be analyzed and, based on the results, EPA will propose MACT standards (or EPA may propose that no new standards are necessary) for the chlor-alkali industry by 1997. For any subject facility, a six year extension of MACT requirements is available if they can demonstrate early emission reductions.
The Clean Air Act Amendments of 1990 contain provisions to phase out the use of ozone depleting chemicals such as chlorofluorocarbons, halons, carbon tetrachloride, and methyl chloroform, as required by the Montreal Protocol on Substances that Deplete the Ozone Layer. The chlor-alkali industry has been and will continue to be significantly affected by these provisions due to decreases in the demand for chlorine as a feedstock in manufacturing these chemicals. In addition, many of these chemicals are used extensively by the industry to process chlorine.
September 1995 84 SIC 281
Sector Notebook Project Inorganic Chemicals
Clean Water Act
The Clean Water Act, first passed in 1972 and amended in 1977 and 1987, gives EPA the authority to regulate effluents from sewage treatment works, chemical plants, and other industrial sources into waters. The act sets "best available technology" standards for treatment of wastes for both direct and indirect (to a Publicly Owned Treatment Works) discharges. Effluent guidelines for the chlor-alkali industry were last updated in 1984 (40 CFR Section 415). EPA is currently conducting a study to assess the need for new effluent guidelines. (Contact: George Zipf, U.S. EPA, Office of Water, 202-260-2275)
Restrictions on dioxin emissions in the wastewater from pulp mills are having significant effects on the chlor-alkali industry. Dioxins are formed during the chlorine bleaching process and are subsequently released to rivers and streams. Many mills are switching from chlorine to alternative bleaching agents in response to the effluent restrictions. Pulp mills accounted for about 15 percent of the chlorine demand in the U.S. in 1982 and 11 percent in 1992. The demand for chlorine for pulp bleaching is expected to continue to decrease through the 1990s.
Resource Conservation and Recovery Act
The Resource Conservation and Recovery Act (RCRA) of 1976 gives the EPA authority to establish a list of solid and hazardous wastes, and to establish standards and regulations for handling and disposing of these wastes. New wastes specific to the inorganic chemical industry have not been added to the RCRA list since the original waste listings in 1980. EPA is currently under a consent order, however, to propose new hazardous waste listings for the industry by March 1997, and to finalize by March 1998. (Contact: Rick Brandes, U.S. EPA, Office of Solid Waste, 202-260-4770) The Act also requires companies to establish programs to reduce the volume and toxicity of hazardous wastes. It was last amended in 1984 when Congress mandated some 70 new programs for the hazardous waste (Subtitle C) program. Included were tighter standards for handling and disposing of hazardous wastes, land disposal prohibitions, corrective action (or remediation) regulations, and regulations for underground storage tanks. The inorganic chemical industry is strongly affected by the RCRA regulations because of the disposal costs for hazardous waste and the record keeping requirements.
Occupational Safety and Health Act
The Occupational Safety and Health Act gave the Department of Labor the authority to set comprehensive workplace safety and health standards including permissible exposures to chemical in the workplace and authority to conduct inspections and issue citations for violations of safety and health
September 1995 85 SIC 281
Sector Notebook Project Inorganic Chemicals
regulations. The chemical industry is subject to hazard identification standards established by OSHA, which require extensive documentation of chemicals in trade and in the workplace and mandate warning labels on containers. The industry is also subject to OSHA's Hazard Communication Standard and various state and local laws, which give workers the right to know about hazardous chemicals in the workplace.
Hazardous Materials Transportation Act
The Hazardous Materials Transportation Act (HMTA) gives the Department of Transportation authority to regulate the movement of hazardous materials. Chemical manufacturers must comply with regulations governing shipment preparation, including packaging, labeling and shipping papers; handling, loading and unloading; routing emergency and security planning; incident notifications; and liability insurance. The chemical manufacturers must also comply with operating requirements for vehicle, vessel, and carrier transportation of hazardous materials by road, rail, air, and sea. The chemicals covered by the HMTA span a broad list of substances, including hazardous wastes normally regulated by RCRA and hazardous materials that DOT designates as hazardous for the purposes of transportation that may not be considered hazardous under RCRA. These regulations especially apply to chlorine gas which can cause significant risk during transport.
Pollution Prevention Act
The Pollution Prevention Act makes it a national policy of the United States to reduce or eliminate the generation of waste at the source whenever feasible. The EPA is directed to undertake a multi-media program of information collection, technology transfer, and financial assistance to enable the states to implement this policy and to promote the use of source reduction techniques. The reorganization of the Office of Compliance by industry sector is part of EPA's response to this act.
State Statutes
Toxics Use Reduction Act, Massachusetts
The Massachusetts Toxics Use Reduction Act affects those facilities that use, manufacture, or process more than a specified amount of substances that are on the Massachusetts toxic or hazardous substances list. Facilities must submit annual reports on the amounts of substances used, manufactured, or processed and must pay annual fees based on these amounts. In addition, facilities must prepare toxics use reduction plans which show in-plant changes in production processes or raw materials that would reduce, avoid, or eliminate the use or generation of toxic or hazardous substances. The Massachusetts toxic or hazardous substance list initially consists of those
September 1995 86 SIC 281
Sector Notebook Project Inorganic Chemicals
substances listed under §313 of EPCRA and will eventually include those substances listed under CERCLA. New Jersey has recently passed a similar act.
VI.C. Pending and Proposed Regulatory Requirements
Resource Conservation and Recovery Act (RCRA)
The Resource Conservation and Recovery Act (RCRA) listed waste streams specific to the inorganic chemical industry have not been updated since the original RCRA hazardous wastes list developed in 1980. EPA is under a court-ordered deadline to propose and finalize additional waste listings for the industry by March 1997 and March 1988, respectively. The Office of Solid Waste will begin assessing the need for new listings by early 1996. (Contact: Rick Brandes, U.S. EPA, Office of Solid Waste, 202-260-4770)
Clean Air Act
The new NESHAP standards for the inorganic chemical industry are scheduled to be promulgated by EPA by 1997. (Contact: Iliam Rosario, U.S. EPA, OAQPS, WAM for Chlorine Production NESHAP, 919-541-5308) The standards required will, in most cases, be in the form of MACT standards. Lowest Achievable Emission Rates will be required in NAAQS non-attainment areas. An information collection request survey was sent out to the chlor-alkali industry in 1992. The data obtained will be analyzed and used to assess the need for NESHAP standards in the chlor-alkali industry.
The chlor-alkali industry will continue to be affected by the provisions to phase out the use of ozone depleting chemicals as required by the Montreal Protocol on Substances that Deplete the Ozone Layer. The demand for chlorine as a feedstock in manufacturing these chemicals, which accounted for about 15 percent of total domestic demand in 1990, will continue to decline through the 1990s. In addition, costs of purifying and liquefying chlorine gas may increase as the cost of carbon tetrachloride and refrigerants increases, and as alternative processes are introduced.
September 1995 87 SIC 281

Sector Notebook Project Inorganic Chemicals
VII. COMPLIANCE AND ENFORCEMENT HISTORY
Background
To date, EPA has focused much of its attention on measuring compliance with specific environmental statutes. This approach allows the Agency to track compliance with the Clean Air Act, the Resource Conservation and Recovery Act, the Clean Water Act, and other environmental statutes. Within the last several years, the Agency has begun to supplement single-media compliance indicators with facility-specific, multimedia indicators of compliance. In doing so, EPA is in a better position to track compliance with all statutes at the facility level, and within specific industrial sectors.
A major step in building the capacity to compile multimedia data for industrial sectors was the creation of EPA's Integrated Data for Enforcement Analysis (IDEA) system. IDEA has the capacity to "read into" the Agency's single-media databases, extract compliance records, and match the records to individual facilities. The IDEA system can match Air, Water, Waste, Toxics/Pesticides/EPCRA, TRI, and Enforcement Docket records for a given facility, and generate a list of historical permit, inspection, and enforcement activity. IDEA also has the capability to analyze data by geographic area and corporate holder.
Compliance and Enforcement Profile Description
Using inspection, violation, and enforcement data from the IDEA system, this section provides information regarding the historical compliance and enforcement activity of this sector. In order to mirror the facility universe reported in the Toxic Chemical Profile, the data reported within this section consists of records only from the TRI reporting universe. With this decision, the selection criteria are consistent across sectors with certain exceptions. For the sectors that do not normally report to the TRI program, data have been provided from EPA's Facility Indexing System (FINDS) which tracks facilities in all media databases. Please note, in this section, EPA does not attempt to define the actual number of facilities that fall within each sector. Instead, the section portrays the records of a subset of facilities within the sector that are well defined within EPA databases.
As a check on the relative size of the full sector universe, most notebooks contain an estimated number of facilities within the sector according to the Bureau of Census (See Section II). With sectors dominated by small businesses, such as metal finishers and printers, the reporting universe within the EPA databases may be small in comparison to Census data. However, the group selected for inclusion in this data analysis section should be consistent with this sector's general make-up.
September 1995 88 SIC 281

Sector Notebook Project Inorganic Chemicals
Following this introduction is a list defining each data column presented within this section. These values represent a retrospective summary of inspections or enforcement actions, and solely reflect EPA, state, and local compliance assurance activity that have been entered into EPA databases. To identify any changes in trends, the EPA ran two data queries, one for the past five calendar years (August 10, 1990 to August 9, 1995) and the other for the most recent twelve-month period (August 10, 1994 to August 9, 1995). The five-year analysis gives an average level of activity for that period for comparison to the more recent activity.
Because most inspections focus on single-media requirements, the data queries presented in this section are taken from single media databases. These databases do not provide data on whether inspections are state/local or EPA-led. However, the table breaking down the universe of violations does give the reader a crude measurement of the EPA's and states' efforts within each media program. The presented data illustrate the variations across regions for
ecertain sectors. This variation may be attributable to state/local data entryvariations, specific geographic concentrations, proximity to population centers, sensitive ecosystems, highly toxic chemicals used in production, or historical noncompliance. Hence, the exhibited data do not rank regional performance or necessarily reflect which regions may have the most compliance problems.
Compliance and Enforcement Data Definitions
General Definitions
Facility Indexing System (FINDS) -- this system assigns a common facility number to EPA single-media permit records. The FINDS identification number allows EPA to compile and review all permit, compliance, enforcement and pollutant release data for any given regulated facility.
Integrated Data for Enforcement Analysis (IDEA) -- is a data integration system that can retrieve information from the major EPA program office databases. IDEA uses the FINDS identification number to ?glue together” separate data records from EPA’s databases. This is done to create a ?master list” of data records for any given facility. Some of the data systems accessible through IDEA are: AIRS (Air Facility Indexing and Retrieval System, Office of Air and Radiation), PCS (Permit Compliance System, Office of Water), RCRIS (Resource Conservation and Recovery Information System, Office of Solid Waste), NCDB (National Compliance Data Base,
e EPA Regions include the following states: I (CT, MA, ME, RI, NH, VT);II (NJ, NY, PR, VI); III (DC, DE, MD, PA,VA, WV); IV (AL, FL, GA, KY, MS, NC, SC, TN); V (IL, IN, MI, MN, OH, WI); VI (AR, LA, NM, OK, TX); VII (IA, KS, MO, NE); VIII (CO, MT, ND, SD, UT, WY); IX (AZ, CA, HI, NV, Pacific Trust Territories); X (AK, ID, OR, WA).
September 1995 89 SIC 281
Sector Notebook Project Inorganic Chemicals
Office of Prevention, Pesticides, and Toxic Substances), CERCLIS (Comprehensive Environmental and Liability Information System, Superfund), and TRIS (Toxic Release Inventory System). IDEA also contains information from outside sources such as Dun and Bradstreet and the Occupational Safety and Health Administration (OSHA). Most data queries displayed in notebook sections IV and VII were conducted using IDEA.
Data Table Column Heading Definitions
Facilities in Search -- are based on the universe of TRI reporters within the listed SIC code range. For industries not covered under TRI reporting requirements, the notebook uses the FINDS universe for executing data queries. The SIC code range selected for each search is defined by each notebook's selected SIC code coverage described in Section II.
Facilities Inspected -- indicates the level of EPA and state agency facility inspections for the facilities in this data search. These values show what percentage of the facility universe is inspected in a 12 or 60 month period. This column does not count non-inspectional compliance activities such as the review of facility-reported discharge reports.
Number of Inspections -- measures the total number of inspections conducted in this sector. An inspection event is counted each time it is entered into a single media database.
Average Time Between Inspections -- provides an average length of time, expressed in months, that a compliance inspection occurs at a facility within the defined universe.
Facilities with One or More Enforcement Actions -- expresses the number of facilities that were party to at least one enforcement action within the defined time period. This category is broken down further into federal and state actions. Data are obtained for administrative, civil/judicial, and criminal enforcement actions. Administrative actions include Notices of Violation (NOVs). A facility with multiple enforcement actions is only counted once in this column (facility with three enforcement actions counts as one). All percentages that appear are referenced to the number of facilities inspected.
Total Enforcement Actions -- describes the total number of enforcementactions identified for an industrial sector across all environmental statutes. Afacility with multiple enforcement actions is counted multiple times (a facilitywith three enforcement actions counts as three). State Lead Actions -- shows what percentage of the total enforcementactions are taken by state and local environmental agencies. Varying levelsof use by states of EPA data systems may limit the volume of actions
September 1995 90 SIC 281

Sector Notebook Project Inorganic Chemicals
accorded state enforcement activity. Some states extensively report enforcement activities into EPA data systems, while other states may use their own data systems.
Federal Lead Actions -- shows what percentage of the total enforcement actions are taken by the United States Environmental Protection Agency. This value includes referrals from state agencies. Many of these actions result from coordinated or joint state/federal efforts.
Enforcement to Inspection Rate -- expresses how often enforcement actions result from inspections. This value is a ratio of enforcement actions to inspections, and is presented for comparative purposes only. This measure is a rough indicator of the relationship between inspections and enforcement. Reported inspections and enforcement actions under the Clean Water Act (PCS), the Clean Air Act (AFS) and the Resource Conservation and Recovery Act (RCRA) are included in this ratio. Inspections and actions from the TSCA/FIFRA/EPCRA database are not factored into this ratio because most of the actions taken under these programs are not the result of facility inspections. This ratio does not account for enforcement actions arising from non-inspection compliance monitoring activities (e.g., self-reported water discharges) that can result in enforcement action within the CAA, CWA and RCRA.
Facilities with One or More Violations Identified -- indicates the number and percentage of inspected facilities having a violation identified in one of the following data categories: In Violation or Significant Violation Status (CAA); Reportable Noncompliance, Current Year Noncompliance, Significant Noncompliance (CWA); Noncompliance and Significant Noncompliance (FIFRA, TSCA, and EPCRA); Unresolved Violation and Unresolved High Priority Violation (RCRA). The values presented for this column reflect the extent of noncompliance within the measured time frame, but do not distinguish between the severity of the noncompliance. Percentages within this column may exceed 100 percent because facilities can be in violation status without being inspected. Violation status may be a precursor to an enforcement action, but does not necessarily indicate that an enforcement action will occur.
Media Breakdown of Enforcement Actions and Inspections -- four columns identify the proportion of total inspections and enforcement actions within EPA Air, Water, Waste, and TSCA/FIFRA/EPCRA databases. Each column is a percentage of either the ?Total Inspections,” or the ?Total Actions” column.
September 1995 91 SIC 281

Sector Notebook Project Inorganic Chemicals
VII.A. Inorganic Chemical Industry Compliance History
Exhibit 20 provides an overview of the reported compliance and enforcement data for the inorganic chemical industry over the past five years (August 1990 to August 1995). These data are also broken out by EPA Region thereby permitting geographical comparisons. A few points evident from the data are listed below.
C Slightly more than half of the TRI reporting inorganic chemical facilities in the EPA databases were inspected over the five year period resulting in an average of 11 months between inspections of these facilities.
C On average, the states carried out three times the number of inspections as the Regions; however, the percentage of state led actions varied across the Regions from 44 percent to 96 percent.
C The enforcement to inspection rate varied significantly from Region to Region. Region IX had the highest enforcement to inspection rate as well as the highest percentage of state led actions.
September 1995 92 SIC 281

----
--
Sector Notebook Project Inorganic Chemicals
Exh
ibit
20:
Fiv
e-Y
ear
Enf
orce
men
t an
d C
ompl
ianc
e Su
mm
ary
for
Inor
gani
c C
hem
ical
s M
anuf
actu
ring
J
Enf
orce
men
t to
Ins
pect
ion
Rat
e 0.08
0.07
0.12
0.09
0.26
0.15
0.13
0.31
0.11
0.13
I
Per
cent
F
eder
al
Lea
d A
ctio
ns
28%
11%
11%
55%
39%
56%
20%
4%
14%
24%
H
Per
cent
St
ate
Lea
d A
ctio
ns
72%
89%
89%
45%
61%
44%
80%
96%
86%
76%
G
Tot
al
Enf
orce
men
t A
ctio
ns
0 29
38
113 42
106 9 5 53
7
402
F
Fac
iliti
es w
ith
1 or
Mor
e E
nfor
cem
ent
Act
ions
0 12
12
21
11
24 2 4 9 4 99
E
Ave
rage
M
onth
s B
etw
een
Insp
ecti
ons
38 8 7 7 14
14
18
27
25
19
11
D
Num
ber
of
Insp
ecti
ons 16
354
544
916
469
401 62
38
171 63
3,03
4
C
Fac
iliti
es
Insp
ecte
d 5 29
41
54
62
40
12 9 35
11
298
B
Fac
iliti
es
in S
earc
h 10
46
60
105
108 93
19
17
70
20
548
A
Reg
ion
I II
III
IV
V
VI
VII
VII
I
IX
X
TO
TA
L
September 1995 93 SIC 281

Sector Notebook Project Inorganic Chemicals
VII.B. Comparison of Enforcement Activity Between Selected Industries
Exhibits 21 and 22 allow the compliance history of the inorganic chemical manufacturing sector to be compared to the other industries covered by the industry sector notebooks. Comparisons between Exhibits 21 and 22 permit the identification of trends in compliance and enforcement records of the industry by comparing data covering the last five years to that of the past year. Some points evident from the data are listed below.
C The inorganic chemicals industry has a relatively low frequency of inspections compared to most of the other sectors shown. On average, the number of months between inspections at inorganic chemicals facilities has been only about twice that of organic chemicals facilities.
C Over the past five years the inorganic chemical industry has had a ratio of enforcement actions to inspections lower than most of the other sectors listed including the organic chemicals sector. This difference has continued over the past year.
C Enforcement actions are brought against only about 10 percent of the facilities with violations; lower than most other sectors listed.
Exhibits 23 and 24 provide a more in-depth comparison between the inorganic chemicals industry and other sectors by breaking out the compliance and enforcement data by environmental statute. As in the previous Exhibits (21 and 22), the data cover the last five years (Exhibit 23) and the last one year (Exhibit 24) to facilitate the identification of recent trends. A few points evident from the data are listed below.
C Inspections of inorganic chemical facilities are split relatively evenly between Clean Air Act, Clean Water Act, and RCRA, although RCRA accounts for a significantly larger portion of the total actions brought against the inorganic chemicals industry over the past five years.
C Significantly more Clean Water Act inspections are carried out at inorganic chemicals facilities in comparison to the organic chemicals industry, although the Clean Water Act accounts for a smaller portion of the total actions brought against inorganic chemicals facilities.
C Over the past year RCRA inspections have accounted for a significantly smaller portion of the enforcement actions brought against the industry and the Clean Air Act has taken a far greater share.
September 1995 94 SIC 281
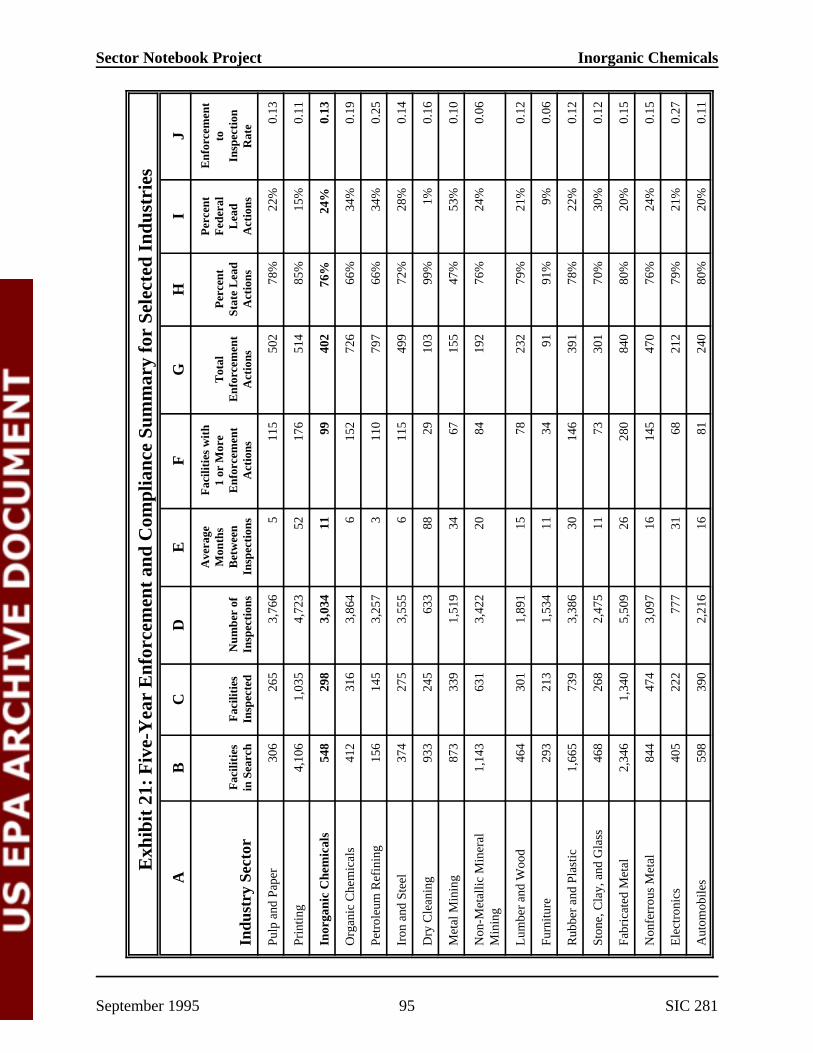
Sector Notebook Project Inorganic Chemicals
Exh
ibit
21:
Fiv
e-Y
ear
Enf
orce
men
t an
d C
ompl
ianc
e Su
mm
ary
for
Sele
cted
Ind
ustr
ies
J
Enf
orce
men
t to
In
spec
tion
R
ate 0.
13
0.11
0.13
0.19
0.25
0.14
0.16
0.10
0.06
0.12
0.06
0.12
0.12
0.15
0.15
0.27
0.11
I
Per
cent
F
eder
al
Lea
d A
ctio
ns
22%
15%
24%
34%
34%
28%
1%
53%
24%
21%
9%
22%
30%
20%
24%
21%
20%
H
Per
cent
St
ate
Lea
d A
ctio
ns
78%
85%
76%
66%
66%
72%
99%
47%
76%
79%
91%
78%
70%
80%
76%
79%
80%
G
Tot
al
Enf
orce
men
t A
ctio
ns 50
2
514
402
726
797
499
103
155
192
232 91
391
301
840
470
212
240
F
Fac
iliti
es w
ith
1 or
Mor
e E
nfor
cem
ent
Act
ions
115
176 99
152
110
115 29
67
84
78
34
146 73
280
145 68
81
E
Ave
rage
M
onth
s B
etw
een
Insp
ecti
ons 5 52
11 6 3 6 88
34
20
15
11
30
11
26
16
31
16
D
Num
ber
of
Insp
ecti
ons
3,76
6
4,72
3
3,03
4
3,86
4
3,25
7
3,55
5
633
1,51
9
3,42
2
1,89
1
1,53
4
3,38
6
2,47
5
5,50
9
3,09
7
777
2,21
6
C
Fac
iliti
es
Insp
ecte
d
265
1,03
5
298
316
145
275
245
339
631
301
213
739
268
1,34
0
474
222
390
B
Fac
iliti
es
in S
earc
h
306
4,10
6
548
412
156
374
933
873
1,14
3
464
293
1,66
5
468
2,34
6
844
405
598
A
Indu
stry
Sec
tor
Pulp
and
Pap
er
Prin
ting
Inor
gani
c C
hem
ical
s
Org
anic
Che
mic
als
Petr
oleu
m R
efin
ing
Iron
and
Ste
el
Dry
Cle
anin
g
Met
al M
inin
g
Non
-Met
allic
Min
eral
M
inin
g
Lum
ber
and
Woo
d
Furn
iture
Rub
ber
and
Plas
tic
Ston
e, C
lay,
and
Gla
ss
Fabr
icat
ed M
etal
Non
ferr
ous
Met
al
Ele
ctro
nics
Aut
omob
iles
September 1995 95 SIC 281
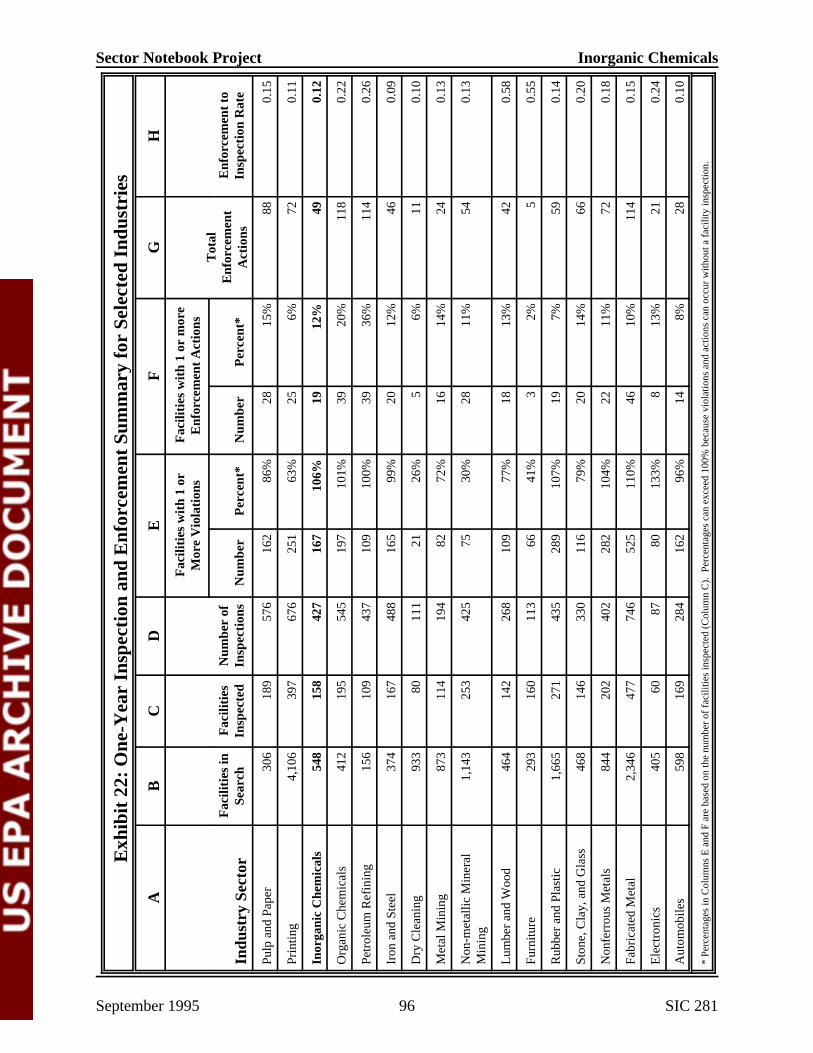
Sector Notebook Project Inorganic Chemicals
Exh
ibit
22:
One
-Yea
r In
spec
tion
and
Enf
orce
men
t Su
mm
ary
for
Sele
cted
Ind
ustr
ies
A
B
C
D
E
F
G
H
Fac
iliti
es w
ith
1 or
M
ore
Vio
lati
ons
Fac
iliti
es w
ith
1 or
mor
e E
nfor
cem
ent
Act
ions
T
otal
E
nfor
cem
ent
Act
ions
Indu
stry
Sec
tor
Fac
iliti
es in
Se
arch
F
acili
ties
In
spec
ted
Num
ber
of
Insp
ecti
ons
Num
ber
Per
cent
* N
umbe
r P
erce
nt*
Enf
orce
men
t to
In
spec
tion
Rat
e
Pulp
and
Pap
er
306
189
576
162
86%
28
15
%
88
0.15
Prin
ting
4,10
6 39
7 67
6 25
1 63
%
25
6%
72
0.11
Inor
gani
c C
hem
ical
s 54
8 15
8 42
7 16
7 10
6%
19
12%
49
0.
12
Org
anic
Che
mic
als
412
195
545
197
101%
39
20
%
118
0.22
Petr
oleu
m R
efin
ing
156
109
437
109
100%
39
36
%
114
0.26
Iron
and
Ste
el
374
167
488
165
99%
20
12
%
46
0.09
Dry
Cle
anin
g 93
3 80
11
1 21
26
%
5 6%
11
0.
10
Met
al M
inin
g 87
3 11
4 19
4 82
72
%
16
14%
24
0.
13
Non
-met
allic
Min
eral
M
inin
g 1,
143
253
425
75
30%
28
11
%
54
0.13
Lum
ber
and
Woo
d 46
4 14
2 26
8 10
9 77
%
18
13%
42
0.
58
Furn
iture
29
3 16
0 11
3 66
41
%
3 2%
5
0.55
Rub
ber
and
Plas
tic
1,66
5 27
1 43
5 28
9 10
7%
19
7%
59
0.14
Ston
e, C
lay,
and
Gla
ss
468
146
330
116
79%
20
14
%
66
0.20
Non
ferr
ous
Met
als
844
202
402
282
104%
22
11
%
72
0.18
Fabr
icat
ed M
etal
2,
346
477
746
525
110%
46
10
%
114
0.15
Ele
ctro
nics
40
5 60
87
80
13
3%
8 13
%
21
0.24
Aut
omob
iles
598
169
284
162
96%
14
8%
28
0.
10
* Pe
rcen
tage
s in
Col
umns
E a
nd F
are
bas
ed o
n th
e nu
mbe
r of
fac
ilitie
s in
spec
ted
(Col
umn
C).
Per
cent
ages
can
exc
eed
100%
bec
ause
vio
latio
ns a
nd a
ctio
ns c
an o
ccur
with
out a
fac
ility
insp
ectio
n.
September 1995 96 SIC 281

Sector Notebook Project Inorganic Chemicals
Exh
ibit
23:
Fiv
e-Y
ear
Insp
ecti
on a
nd E
nfor
cem
ent
Sum
mar
y by
Sta
tute
for
Sel
ecte
d In
dust
ries
Cle
an A
ir A
ct
Cle
an W
ater
Act
Res
ourc
e C
onse
rvat
ion
and
Rec
over
y A
ct
FIF
RA
/TSC
A/
EP
CR
A/O
ther
Indu
stry
Sec
tor
Fac
iliti
es
Insp
ecte
d T
otal
In
spec
tion
s
Tot
al
Enf
orce
men
t A
ctio
ns
% o
f T
otal
In
spec
tion
s
% o
f T
otal
A
ctio
ns
% o
f T
otal
In
spec
tion
s
% o
f T
otal
A
ctio
ns
% o
f T
otal
In
spec
tion
s
% o
f T
otal
A
ctio
ns
% o
f T
otal
In
spec
tion
s
% o
f T
otal
A
ctio
ns
Pulp
and
Pap
er
265
3,76
6 50
2 51
%
48%
38
%
30%
9%
18
%
2%
3%
Prin
ting
1,03
5 4,
723
514
49%
31
%
6%
3%
43%
62
%
2%
4%
Inor
gani
c C
hem
ical
s 29
8 3,
034
402
29%
26
%
29%
17
%
39%
53
%
3%
4%
Org
anic
Che
mic
als
316
3,86
4 72
6 33
%
30%
16
%
21%
46
%
44%
5%
5%
Petr
oleu
m R
efin
ing
145
3,23
7 79
7 44
%
32%
19
%
12%
35
%
52%
2%
5%
Iron
and
Ste
el
275
3,55
5 49
9 32
%
20%
30
%
18%
37
%
58%
2%
5%
Dry
Cle
anin
g 24
5 63
3 10
3 15
%
1%
3%
4%
83%
93
%
0%
1%
Met
al M
inin
g 33
9 1,
519
155
35%
17
%
57%
60
%
6%
14%
1%
9%
Non
-met
allic
Min
eral
M
inin
g 63
1 3,
422
192
65%
46
%
31%
24
%
3%
27%
0%
4%
Lum
ber
and
Woo
d 30
1 1,
891
232
31%
21
%
8%
7%
59%
67
%
2%
5%
Furn
iture
29
3 1,
534
91
52%
27
%
1%
1%
45%
64
%
1%
8%
Rub
ber
and
Plas
tic
739
3,38
6 39
1 39
%
15%
13
%
7%
44%
68
%
3%
10%
Ston
e, C
lay,
and
Gla
ss
268
2,47
5 30
1 45
%
39%
15
%
5%
39%
51
%
2%
5%
Non
ferr
ous
Met
als
474
3,09
7 47
0 36
%
22%
22
%
13%
38
%
54%
4%
10
%
Fabr
icat
ed M
etal
1,
340
5,50
9 84
0 25
%
11%
15
%
6%
56%
76
%
4%
7%
Ele
ctro
nics
22
2 77
7 21
2 16
%
2%
14%
3%
66
%
90%
3%
5%
Aut
omob
iles
390
2,21
6 24
0 35
%
15%
9%
4%
54
%
75%
2%
6%
September 1995 97 SIC 281

Sector Notebook Project Inorganic Chemicals
Exh
ibit
24:
One
-Yea
r In
spec
tion
and
Enf
orce
men
t Su
mm
ary
by S
tatu
te f
or S
elec
ted
Indu
stri
es
FIF
RA
/TSC
A/
EP
CR
A/O
ther
% o
f T
otal
A
ctio
ns
3%
4%
6%
1%
6%
6%
7%
19%
11%
6%
13%
11%
3%
4%
2%
4%
6%
% o
f T
otal
In
spec
tion
s
0%
0%
0%
1%
1%
0%
0%
0%
0%
0%
0%
1%
0%
1%
0%
0%
1%
Res
ourc
e C
onse
rvat
ion
and
Rec
over
y A
ct
% o
f T
otal
A
ctio
ns
7%
66%
36%
49%
47%
50%
67%
6%
16%
61%
10%
71%
37%
69%
77%
87%
69%
% o
f T
otal
In
spec
tion
s
10%
44%
45%
50%
30%
36%
78%
10%
5%
63%
41%
46%
38%
44%
61%
69%
56%
Cle
an W
ater
Act
% o
f T
otal
A
ctio
ns
21%
3%
21%
16%
16%
26%
22%
34%
16%
13%
10%
4%
8%
3%
8%
7%
9%
% o
f T
otal
In
spec
tion
s
35%
5%
29%
13%
19%
35%
1%
43%
26%
8%
1%
14%
18%
21%
14%
14%
10%
Cle
an A
ir A
ct
% o
f T
otal
A
ctio
ns
69%
27%
38%
34%
31%
18%
4%
42%
58%
20%
67%
14%
52%
24%
14%
2%
16%
% o
f T
otal
In
spec
tion
s
56%
50%
26%
36%
50%
29%
21%
47%
69%
29%
58%
39%
45%
33%
25%
17%
34%
Tot
al
Enf
orce
men
t A
ctio
ns 88
72
49
118
114 46
11
24
54
42 5 59
66
72
114 21
28
Tot
al
Insp
ecti
ons
576
676
427
545
437
488
111
194
425
268
160
435
330
402
746 87
284
Fac
iliti
es
Insp
ecte
d
189
397
158
195
109
167 80
114
253
142
293
271
146
202
477 60
169
Indu
stry
Sec
tor
Pulp
and
Pap
er
Prin
ting
Inor
gani
c C
hem
ical
s
Org
anic
Che
mic
als
Petr
oleu
m R
efin
ing
Iron
and
Ste
el
Dry
Cle
anin
g
Met
al M
inin
g
Non
-met
allic
Min
eral
M
inin
g
Lum
ber
and
Woo
d
Furn
iture
Rub
ber
and
Plas
tic
Ston
e, C
lay,
and
Gla
ss
Non
ferr
ous
Met
als
Fabr
icat
ed M
etal
Ele
ctro
nics
Aut
omob
iles
September 1995 98 SIC 281

Sector Notebook Project Inorganic Chemicals
VII.C. Review of Major Legal Actions
Major Cases/Supplemental Environmental Projects
This section provides summary information about major cases that have affected this sector, and a list of Supplementary Environmental Projects (SEPs). SEPs are compliance agreements that reduce a facility's stipulated penalty in return for an environmental project that exceeds the value of the reduction. Often, these projects fund pollution prevention activities that can significantly reduce the future pollutant loadings of a facility.
VII.C.1. Review of Major Cases
Historically, OECA’s Enforcement Capacity and Outreach Office does not regularly compile information related to major cases and pending litigation within an industry sector. The staff are willing to pass along such information to Agency staff as requests are made. In addition, summaries of completed enforcement actions are published each fiscal year in the Enforcement Accomplishments Report. To date, these summaries are not organized by industry sector. (Contact: Office of Enforcement Capacity and Outreach 202-260-4140)
VII.C.2. Supplementary Environmental Projects
Supplemental environmental projects (SEPs) are an enforcement option that requires the non-compliant facility to complete specific projects. Regional summaries of SEPs undertaken in the 1993 and 1994 federal fiscal years were reviewed. Five SEPs were undertaken that involved inorganic chemical manufacturing facilities, as shown in Exhibit 25.
CERCLA violations engendered three out of the five SEPs identified; the fourth and fifth were due to a CAA violation and a TSCA violation. Due to regional reporting methods, the specifics of the original violations are not known and, for one SEP, details of the actual project were not available.
One of the five projects was conducted at a facility that manufactures both inorganic and organic chemicals. This project has been included in both industry sector project summaries. The FY 1993 and 1994 SEPs for inorganic chemical manufacturers fall into four categories: process related projects; control and recovery technology inprovement or installation; leak prevention; and donations to the community.
September 1995 99 SIC 281

Sector Notebook Project Inorganic Chemicals
•Process related projects A Region IV project carried out in 1993 entailed specific process changes intended to reduce chlorinated wastes at the facility. In conjunction with other non-process components of the project, the implementation cost was $93,000.
•Control and recovery technology improvement/installation A Louisiana facility, the combined organic and inorganic chemical manufacturer, implemented a SEP to reduce emissions from returned gas canisters. The SEP involved the installation of recovery technologies to reduce emissions of residual CFC and HCFC from the used canisters. The cost to the company was $158,400.
•Leak prevention A Region IV facility constructed retaining walls around underground storage tanks to prevent hazardous leachate from reaching groundwater. The cost to the company was $46,200.
•Donations to Community Following a CERCLA violation, a facility in Texas donated emergency and computer equipment to the Local Emergency Planning Commission (LEPC) which could be used in the planning and responding to potential chemical emergencies. The facility also agreed to participate in LEPC activities and to provide technical assistance.
September 1995 100 SIC 281

---
---
---
---
---
---
---
---
---
---
---
---
---
---
---
---
Sector Notebook Project Inorganic Chemicals
Exh
ibit
25:
FY
-199
3-19
94 S
uppl
emen
tal E
nvir
onm
enta
l Pro
ject
s O
verv
iew
: In
orga
nic
Che
mic
al M
anuf
actu
re
Supp
lem
enta
l Env
iron
men
tal P
roje
cts
Des
crip
tion
Com
pany
pur
chas
ed, i
nsta
lled,
and
op
erat
ed e
quip
men
t for
rec
over
y of
re
sidu
al C
FCs
and
HC
FCs
in u
sed
gas
cylin
ders
ret
urne
d by
cus
tom
ers
Alte
red
proc
ess
to r
educ
e ch
lori
nate
d w
aste
s, p
rovi
ded
com
pute
r an
d C
ameo
tr
aini
ng f
or c
ount
y E
MA
, don
ated
fun
ds
to L
EPC
for
haz
ards
ana
lysi
s, a
nd h
eld
resp
onse
exe
rcis
es a
t pla
nt
Con
stru
cted
ret
aini
ng w
alls
aro
und
unde
rgro
und
stor
age
tank
s to
pre
vent
ha
zard
ous
mat
eria
l lea
chat
e fr
om
reac
hing
gro
undw
ater
Don
ated
em
erge
ncy
and/
or c
ompu
ter
equi
pmen
t to
LE
PC f
or r
espo
nse/
plan
ning
fo
r ch
emic
al e
mer
genc
ies,
agr
eed
to
part
icip
ate
in L
EPC
act
iviti
es a
nd to
pr
ovid
e te
chni
cal a
ssis
tanc
e
N/A
Faci
litie
s id
entif
ied
as c
ombi
ned
inor
gani
c an
d or
gani
c ch
emic
al m
anuf
actu
rers
* Vio
lati
on I
nfor
mat
ion
Ter
ms
Initi
al p
enal
ty: I
nitia
l pro
pose
d ca
sh p
enal
ty f
or v
iola
tion
Fina
l pen
alty
: Tot
al p
enal
ty a
fter
SE
P ne
gotia
tion
SEP
cred
it: C
ash
cred
it gi
ven
for
SEP
so th
at, F
inal
pen
alty
- S
EP
cred
it =
Fin
al c
ash
pena
lty
SEP
cost
to c
ompa
ny: A
ctua
l cos
t to
com
pany
of
SEP
impl
emen
tatio
n
NO
TE
: Due
to d
iffe
renc
es in
term
inol
ogy
and
leve
l of
deta
il be
twee
n re
gion
al S
EP
info
rmat
ion,
in s
ome
case
s th
e fi
gure
list
ed a
s Fi
nal p
enal
ty m
ay b
e th
e Fi
nal c
ash
pena
lty a
fter
ded
uctio
n fo
r SE
P cr
edit
Pollu
tant
Red
uctio
n
Pollu
tant
R
educ
tion
Pollu
tant
of
Con
cern
CFC
/HC
FC
chlo
rina
ted
was
te
Vio
latio
n In
form
atio
n
SEP
Cos
t to
C
ompa
ny
$158
,400
$93,
000
$46,
200
$10,
000
$198
,000
SEP
Cre
dit
N/A
Fina
l Pe
nalty
$25,
000
$2,0
00
$10,
000
$3,0
00
N/A
Initi
al
Pena
lty
$88,
360
$90,
000
$40,
000
$25,
000
N/A
Typ
e
CA
A
CE
RC
LA
10
3/E
PCR
A
304
CE
RC
LA
, E
PCR
A
CE
RC
LA
10
3(a)
TSC
A
Gen
eral
Inf
orm
atio
n Stat
e/
Reg
ion
*L
A
Reg
. 4
Reg
. 4
TX
Anz
on, I
nc.
Reg
.III
Com
pany
N
ame
LaR
oche
C
hem
ical
s,
Inc.
Coa
stal
C
hem
ical
s
Scho
lle
Cor
p.
AL
CO
A
Doc
ket
# 6-93
-16
FY
93
93
93
93
94
September 1995 101 SIC 281

Sector Notebook Project Inorganic Chemicals
VIII. COMPLIANCE ASSURANCE ACTIVITIES AND INITIATIVES
This section highlights the activities undertaken by this industry sector and public agencies to voluntarily improve the sector's environmental performance. These activities include those independently initiated by industrial trade associations. In this section, the notebook also contains a listing and description of national and regional trade associations.
VIII.A. Sector-related Environmental Programs and Activities
None identified.
VIII.B. EPA Voluntary Programs
33/50 Program
The "33/50 Program" is EPA's voluntary program to reduce toxic chemical releases and transfers of seventeen chemicals from manufacturing facilities. Participating companies pledge to reduce their toxic chemical releases and transfers by 33 percent as of 1992 and by 50 percent as of 1995 from the 1988 baseline year. Certificates of Appreciation have been given out to participants meeting their 1992 goals. The list of chemicals includes seventeen high-use chemicals reported in the Toxics Release Inventory. Exhibit 26 lists those companies participating in the 33/50 program that reported the SIC code 281 to TRI. Many of the companies shown listed multiple SIC codes and, therefore, are likely to carry out operations in addition to inorganic chemicals manufacturing. The SIC codes reported by each company are listed in no particular order. In addition, the number of facilities within each company that are participating in the 33/50 program and that report SIC 281 to TRI is shown. Finally, each company’s total 1993 releases and transfers of 33/50 chemicals and the percent reduction in these chemicals since 1988 are presented.
The inorganic chemicals industry as a whole used, generated or processed almost all of the seventeen target TRI chemicals. Of the target chemicals, chromium and chromium compounds, lead and lead compounds, and nickel and nickel compounds are released and transferred most frequently and in similar quantities. These three toxic chemicals account for about nine percent of TRI releases and transfers from inorganic chemical facilities. Seventy-five companies, representing 168 facilities, listed under SIC 281 (inorganic chemicals) are currently participating in the 33/50 program. This accounts for 30 percent of the facilities reporting to SIC code 281 to TRI which is significantly higher than the average for all industries of 14 percent participation. (Contact: Mike Burns, 202-260-6394 or the 33/50 Program, 202-260-6907)
September 1995 102 SIC 281

Sector Notebook Project Inorganic Chemicals
Exhibit 26: 33/50 Program Participants Reporting SIC 281 (Inorganic Chemicals)
Parent Company City, State Reported SIC Codes
Facilities ing
# of Participat- and Transfers
(lbs.)
1993 Releases
1988 to 1993 % Reduction
3M MINNESOTA MINING & MFG CO. ST. PAUL, MN 2821, 2816, 2899 1 16,481,098 70 AIR PRODUCTS AND CHEMICALS ALLENTOWN, PA 2819, 2869 5 144,876 50 AKZO NOBEL INC. CHICAGO, IL 2819, 2869 1 930,189 13 ALBEMARLE CORP. RICHMOND, VA 2869, 2819 1 1,005,108 51 ALLIED-SIGNAL INC. MORRISTOWN, NJ 2819, 2869 4 2,080,501 50 ASHLAND OIL INC. RUSSELL, KY 2819 1 723,562 50 B F GOODRICH COMPANY AKRON, OH 2812, 2821, 2869 1 621,207 50 BASF CORP. PARSIPPANY, NJ 2869, 2865, 2819 1 1,157,548 50 BENJAMIN MOORE & CO. MONTVALE, NJ 2851, 2812, 7 20,635 * BORDEN CHEM & PLAS LTD PARTNR COLUMBUS, OH 2813, 2821, 2869 1 12,662 *** CABOT CORP. BOSTON, MA 3339, 2819 2 2,407,581 50 CALGON CARBON CORP. PITTSBURGH, PA 2819 1 14,845 50 CIBA-GEIGY CORP. ARDSLEY, NY 2819, 2865, 2869 2 1,875,028 50 CITGO PETROLEUM CORP. TULSA, OK 2911, 2819, 2869 1 1,164,354 20 CONKLIN COMPANY INC. SHAKOPEE, MN 2819, 2952, 2992 1 2,977 * CORNING INC. CORNING, NY 3339, 2819 1 1,521,528 14 CRITERION CATALYST LTD PARTNR HOUSTON, TX 28190 3 3,716 * CYTEC INDUSTRIES WEST PATERSON, NJ 2819, 2869 2 1,074,646 50 DEGUSSA CORP. RIDGEFIELD PARK,
NJ 2819, 2869, 2879 1 676,418 ***
DOW CHEMICAL COMPANY MIDLAND, MI 2800, 2819, 2821 4 2,769,363 50 E. I. DU PONT DE NEMOURS & CO. WILMINGTON, DE 2816 9 11,740,853 50 EAGLE CHEMICALS INC. HAMILTON, OH 2899, 2819, 2841 1 500 33 EAGLE-PICHER INDUSTRIES INC. CINCINNATI, OH 2816 1 227,242 50 ELF AQUITAINE INC. NEW YORK, NY 2812 7 273,274 43 ENGELHARD CORP. ISELIN, NJ 3714, 2819 6 236,302 50 ETHYL CORP. RICHMOND, VA 2869, 2819, 1 251,519 46 FERRO CORP. CLEVELAND, OH 2819, 2869 5 165,529 50 FMC CORP. CHICAGO, IL 2812, 2819 4 502,318 50 GENERAL ELECTRIC COMPANY FAIRFIELD, CT 2821, 2812, 2869 2 5,010,856 50 GEORGIA GULF CORP. ATLANTA, GA 2865, 2812, 2819 1 39,480 80 GEORGIA-PACIFIC CORP. ATLANTA, GA 2611, 2621, 2812 1 2,722,182 50 HANLIN GROUP INC. EDISON, NJ 2812, 2819 3 6,174 75 HM ANGLO-AMERICAN LTD. NEW YORK, NY 2816 4 1,265,741 2 HOECHST CELANESE CORP. SOMERVILLE, NJ 2819, 2869, 2873 1 2,603,661 50 INTERNATIONAL PAPER COMPANY PURCHASE, NY 28190 1 2,784,831 50 ISK AMERICAS INC. SAN FRANCISCO, CA 2879, 2819 2 300,088 50 KEMIRA HOLDINGS INC. SAVANNAH, GA 2816, 2819 1 394,070 * KERR-MCGEE CORP. OKLAHOMA CITY,
OK 2819 3 374,098 35
LAIDLAW ENVIRONMENTAL SERVICES
COLUMBIA, SC 2819, 2869 1 8,167 ***
LAROCHE HOLDINGS INC. ATLANTA, GA 2812, 2869 1 81,470 * MALLINCKRODT GROUP INC. SAINT LOUIS, MO 2869, 2833, 2819 3 775,206 50
September 1995 103 SIC 281
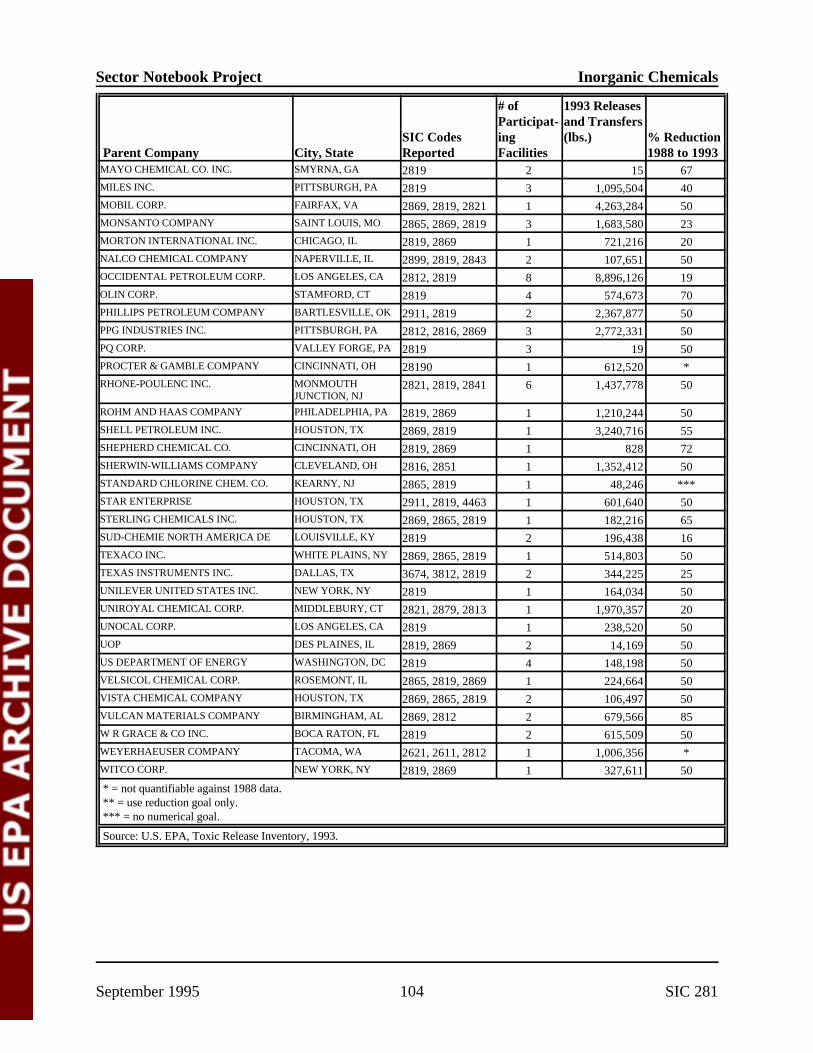
Sector Notebook Project Inorganic Chemicals
Parent Company City, State Reported SIC Codes
Facilities ing
# of Participat- and Transfers
(lbs.)
1993 Releases
1988 to 1993 % Reduction
MAYO CHEMICAL CO. INC. SMYRNA, GA 2819 2 15 67 MILES INC. PITTSBURGH, PA 2819 3 1,095,504 40 MOBIL CORP. FAIRFAX, VA 2869, 2819, 2821 1 4,263,284 50 MONSANTO COMPANY SAINT LOUIS, MO 2865, 2869, 2819 3 1,683,580 23 MORTON INTERNATIONAL INC. CHICAGO, IL 2819, 2869 1 721,216 20 NALCO CHEMICAL COMPANY NAPERVILLE, IL 2899, 2819, 2843 2 107,651 50 OCCIDENTAL PETROLEUM CORP. LOS ANGELES, CA 2812, 2819 8 8,896,126 19 OLIN CORP. STAMFORD, CT 2819 4 574,673 70 PHILLIPS PETROLEUM COMPANY BARTLESVILLE, OK 2911, 2819 2 2,367,877 50 PPG INDUSTRIES INC. PITTSBURGH, PA 2812, 2816, 2869 3 2,772,331 50 PQ CORP. VALLEY FORGE, PA 2819 3 19 50 PROCTER & GAMBLE COMPANY CINCINNATI, OH 28190 1 612,520 * RHONE-POULENC INC. MONMOUTH
JUNCTION, NJ 2821, 2819, 2841 6 1,437,778 50
ROHM AND HAAS COMPANY PHILADELPHIA, PA 2819, 2869 1 1,210,244 50 SHELL PETROLEUM INC. HOUSTON, TX 2869, 2819 1 3,240,716 55 SHEPHERD CHEMICAL CO. CINCINNATI, OH 2819, 2869 1 828 72 SHERWIN-WILLIAMS COMPANY CLEVELAND, OH 2816, 2851 1 1,352,412 50 STANDARD CHLORINE CHEM. CO. KEARNY, NJ 2865, 2819 1 48,246 *** STAR ENTERPRISE HOUSTON, TX 2911, 2819, 4463 1 601,640 50 STERLING CHEMICALS INC. HOUSTON, TX 2869, 2865, 2819 1 182,216 65 SUD-CHEMIE NORTH AMERICA DE LOUISVILLE, KY 2819 2 196,438 16 TEXACO INC. WHITE PLAINS, NY 2869, 2865, 2819 1 514,803 50 TEXAS INSTRUMENTS INC. DALLAS, TX 3674, 3812, 2819 2 344,225 25 UNILEVER UNITED STATES INC. NEW YORK, NY 2819 1 164,034 50 UNIROYAL CHEMICAL CORP. MIDDLEBURY, CT 2821, 2879, 2813 1 1,970,357 20 UNOCAL CORP. LOS ANGELES, CA 2819 1 238,520 50 UOP DES PLAINES, IL 2819, 2869 2 14,169 50 US DEPARTMENT OF ENERGY WASHINGTON, DC 2819 4 148,198 50 VELSICOL CHEMICAL CORP. ROSEMONT, IL 2865, 2819, 2869 1 224,664 50 VISTA CHEMICAL COMPANY HOUSTON, TX 2869, 2865, 2819 2 106,497 50 VULCAN MATERIALS COMPANY BIRMINGHAM, AL 2869, 2812 2 679,566 85 W R GRACE & CO INC. BOCA RATON, FL 2819 2 615,509 50 WEYERHAEUSER COMPANY TACOMA, WA 2621, 2611, 2812 1 1,006,356 * WITCO CORP. NEW YORK, NY 2819, 2869 1 327,611 50
* = not quantifiable against 1988 data. ** = use reduction goal only. *** = no numerical goal.
Source: U.S. EPA, Toxic Release Inventory, 1993.
September 1995 104 SIC 281

Sector Notebook Project Inorganic Chemicals
Environmental Leadership Program
The Environmental Leadership Program (ELP) is a national initiative piloted by EPA and state agencies in which facilities have volunteered to demonstrate innovative approaches to environmental management and compliance. EPA has selected 12 pilot projects at industrial facilities and federal installations which will demonstrate the principles of the ELP program. These principles include: environmental management systems, multimedia compliance assurance, third-party verification of compliance, public measures of accountability, community involvement, and mentoring programs. In return for participating, pilot participants receive public recognition and are given a period of time to correct violations discovered during these experimental projects. Forty proposals were received from companies, trade associations, and federal facilities representing many manufacturing and service sectors. Two chemical companies (Ciba Geigy of St. Gabriel, LA and Akzo Chemicals of Edison, NJ), one pharmaceutical manufacturer (Schering Plough of Kenilworth, NJ), and one manufacturer of agricultural chemicals (Gowan Milling of Yuma, AZ) submitted proposals. (Contact: Tai-ming Chang, ELP Director, 202-564-5081 or Robert Fentress 202-564-7023)
Project XL
Project XL was initiated in March 1995 as a part of President Clinton’s Reinventing Environmental Regulation initiative. The projects seek to achieve cost effective environmental benefits by allowing participants to replace or modify existing regulatory requirements on the condition that they produce greater environmental benefits. EPA and program participants will negotiate and sign a final Project Agreement, detailing specific objectives that the regulated entity shall satisfy. In exchange, EPA will allow the participant a certain degree of regulatory flexibility and may seek changes in underlying regulations or statutes. Participants are encouraged to seek stakeholder support from local governments, businesses, and environmental groups. EPA hopes to implement fifty pilot projects in four categories including facilities, sectors, communities, and government agencies regulated by EPA. Applications will be accepted on a rolling basis and projects will move to implementation within six months of their selection. For additional information regarding XL Projects, including application procedures and criteria, see the May 23, 1995 Federal Register Notice. (Contact: Jon Kessler, Office of Policy Analysis, 202-260-4034)
Green Lights Program
EPA’s Green Lights program was initiated in 1991 and has the goal of preventing pollution by encouraging U.S. institutions to use energy-efficient lighting technologies. The program has over 1,500 participants which include major corporations; small and medium sized businesses; federal, state and
September 1995 105 SIC 281

Sector Notebook Project Inorganic Chemicals
local governments; non-profit groups; schools; universities; and health care facilities. Each participant is required to survey their facilities and upgrade lighting wherever it is profitable. EPA provides technical assistance to the participants through a decision support software package, workshops and manuals, and a financing registry. EPA’s Office of Air and Radiation is responsible for operating the Green Lights Program. (Contact: Maria Tikoff 202-233-9178 or the Green Light/Energy Star Hotline, 202-775-6650)
WasteWi$e Program
The WasteWi$e Program was started in 1994 by EPA’s Office of Solid Waste and Emergency Response. The program is aimed at reducing municipal solid wastes by promoting waste minimization, recycling collection, and the manufacturing and purchase of recycled products. As of 1994, the program had about 300 companies as members, including a number of major corporations. Members agree to identify and implement actions to reduce their solid wastes and must provide EPA with their waste reduction goals along with yearly progress reports. EPA, in turn, provides technical assistance to member companies and allows the use of the WasteWi$e logo for promotional purposes. (Contact: Lynda Wynn 202-260-0700 or the WasteWi$e Hotline, 800-372-9473)
Climate Wise Recognition Program
The Climate Change Action Plan was initiated in response to the U.S. commitment to reduce greenhouse gas emissions in accordance with the Climate Change Convention of the 1990 Earth Summit. As part of the Climate Change Action Plan, the Climate Wise Recognition Program is a partnership initiative run jointly by EPA and the Department of Energy. The program is designed to reduce greenhouse gas emissions by encouraging reductions across all sectors of the economy, encouraging participation in the full range of Climate Change Action Plan initiatives, and fostering innovation. Participants in the program are required to identify and commit to actions that reduce greenhouse gas emissions. The program, in turn, gives organizations early recognition for their reduction commitments; provides technical assistance through consulting services, workshops, and guides; and provides access to the program’s centralized information system. At EPA, the program is operated by the Air and Energy Policy Division within the Office of Policy Planning and Evaluation. (Contact: Pamela Herman 202-260-4407)
September 1995 106 SIC 281

Sector Notebook Project Inorganic Chemicals
NICE3
The U.S. Department of Energy and EPA’s Office of Pollution Prevention are jointly administering a grant program called The National Industrial Competitiveness through Energy, Environment, and Economics (NICE3). By providing grants of up to 50 percent of the total project cost, the program encourages industry to reduce industrial waste at its source and become more energy-efficient and cost-competitive through waste minimization efforts. Grants are used by industry to design, test, demonstrate, and assess the feasibility of new processes and/or equipment with the potential to reduce pollution and increase energy efficiency. The program is open to all industries; however, priority is given to proposals from participants in the pulp and paper, chemicals, primary metals, and petroleum and coal products sectors. (Contact: DOE’s Golden Field Office, 303-275-4729)
VIII.C. Trade Association/Industry Sponsored Activity
VIII.C.1. Environmental Programs
Global Environmental Management Initiative
The Global Environmental Management Initiative (GEMI) is made up of a group of leading companies dedicated to fostering environmental excellence by business. GEMI promotes a worldwide business ethic for environmental management and sustainable development to improve the environmental performance of business through example and leadership. In 1994, GEMI’s membership consisted of about 30 major corporations including Amoco Corporation.
National Pollution Prevention Roundtable
The National Pollution Prevention Roundtable published The Pollution Prevention Yellow Pages in September 1994. It is a compilation of information collected from mail and telephone surveys of state and local government pollution prevention programs. (Contact: Natalie Roy 202-543-7272) The following state programs listed themselves as having expertise in pollution prevention related to inorganic chemical manufacture and use. The contacts listed below (Exhibit 27) are also likely to be aware of various state-and local-level initiatives affecting the inorganic chemical industry.
September 1995 107 SIC 281

Sector Notebook Project Inorganic Chemicals
Exhibit 27: Contacts for State and Local Pollution Prevention Programs
State Program Contact Telephone
Alabama AL Dept. of Env. Protection, Ombudsman and Small Business Assistance Program
Blake Roper, Michael Sherman
(800) 533-2336 (205) 271-7861
AL WRATT Foundation Roy Nicholson (205) 386-3633
California CA State Dept. of Toxic Substances Control David Harley, Kim Wilhelm, Kathy Barwick
(916) 322-3670
County Sanitation Districts of LA Michelle Mische (310) 699-7411
Colorado Region VIII HW Minimization Program Marie Zanowich (303) 294-1065
Illinois IL HW Research and Information Center David Thomas (217) 333-8940
Indiana IN Dept. of Env. Mgmt. Tom Neltner (317) 232-8172
Iowa IA Dept. of Natural Resources Larry Gibson (515) 281-8941
Kentucky KY Partners, State Waste Reduction Center Joyce St. Clair (502) 852-7260
Massachusetts Toxics Use Reduction Institute Janet Clark (508) 934-3346
Michigan University of Detroit Mercy Daniel Klempner (313) 993-3385
New Mexico Waste Management Education and Research Consortium
Ron Bhada (505) 646-1510
North Dakota Energy and Env. Research Center Gerald Groenewold (701) 777-5000
Ohio Institute of Advanced Manufacturing Sciences Harry Stone, Sally Clement
(513) 948-2050
Pennsylvania Center for Hazardous Materials Research Roger Price, Steven Ostheim
(412) 826-5320
Rhode Island RI Center for P2, URI Stanley Barnett (401) 792-2443
South Carolina
Clemson University Eric Snider (803) 656-0985
Texas TX Natural Resource Conservation Commission Andrew Neblett (512) 239-3100
Vermont Retired Engineers and Professionals Program Muriel Durgin (802) 879-4703
Washington WA State Dept. of Ecology Peggy Morgan (206) 407-6705
Wisconsin WI Dept. of Natural Resources, Small Business Assistance Program
Robert Baggot (608) 267-3136
Wyoming WY Dept. of Env. Quality Charles Raffelson (307) 777-7391
Center for Waste Reduction Technologies
September 1995 108 SIC 281

Sector Notebook Project Inorganic Chemicals
Center for Waste Reduction Technologies, under the aegis of the American Institute of Chemical Engineers, sponsors research on innovative technologies to reduce waste in the chemical processing industries. The primary mechanism is through funding of academic research.
National Science Foundation and the Office of Pollution Prevention and Toxics
The National Science Foundation and EPA's Office of Pollution Prevention and Toxics signed an agreement in January of 1994 to coordinate the two agencies' programs of basic research related to pollution prevention. The collaboration will stress research in the use of less toxic chemical and synthetic feedstocks, use of photochemical processes instead of traditional ones that employ toxic reagents, use of recyclable catalysts to reduce metal contamination, and use of natural feedstocks when synthesizing chemicals in large quantities.
Chemical Manufacturers Association
The Chemical Manufacturers Association funds research on issues of interest to their members particularly in support of their positions on proposed or possible legislation. They recently funded a study to characterize the environmental fate of organochlorine compounds.
Responsible Care Program
The Responsible Care Program of the Chemical Manufacturers Association requires members to pledge commitment to six codes that identify 106 management practices that companies must carry out in the areas of community awareness and emergency response, pollution prevention, process safety, distribution, employee health and safety, and product stewardship.
ISO 9000
ISO 9000 is a series of international total quality management guidelines. After a successful independent audit of their management plans, firms are qualified to be ISO 9000 registered. In June of 1993, the International Standards Organization created a technical committee to begin work on new standards for environmental management systems. The new standards are called ISO 14000 and are expected to be issued in 1996.
September 1995 109 SIC 281

Sector Notebook Project Inorganic Chemicals
VII.C.2. Summary of Trade Associations
Chemical Industry
American Chemical Society1155 16th Street, NW Washington, D.C. 20036 Members: 145,000Phone: (202) 872-8724 Staff: 1700Fax: (202) 872-6206 Budget: $192,000,000
The American Chemical Society (ACS) has an educational and research focus.The ACS produces approximately thirty different industry periodicals andresearch journals, including Environmental Science and Technology andChemical Research in Toxicology. In addition to publishing, the ACSpresently conducts studies and surveys; legislation monitoring, analysis, andreporting; and operates a variety of educational programs. The ACS libraryand on-line information services are extensive. Some available on-lineservices are Chemical Journals Online, containing the full text of 18 ACSjournals, 10 Royal Society of Chemistry journals, and five polymer journals,and the Chemical Abstracts Service (CAS), which provides a variety ofinformation on chemical compounds. Founded in 1876, the ACS is presentlycomprised of 184 local groups and 843 student groups nationwide.
Chemical Manufacturers Association2501 M St., NW Members: 185Washington, D.C. 20037 Staff: 246Phone: (202) 887-1164 Budget: $36,000,000Fax: (202) 887-1237 Contact: Joseph Mayhew
Presently, the principle focus of the Chemical Manufacturers Association(CMA) is on regulatory issues facing chemical manufacturers at the local,state, and federal level. At its inception in 1872, the focus of the CMA wason serving chemical manufacturers through research. Research is still ongoingat the CMA, however, as the CHEMSTAR program illustrates. CHEMSTARconsists of a variety of self-funded panels working on single-chemical researchagendas. This research fits in with the overall regulatory focus of the CMA;CHEMSTAR study results are provided to both CMA membership andregulatory agencies. Other initiatives include the "responsible care" program.Membership in the CMA is contingent upon enrollment in the "responsiblecare" program, which includes six codes of management practice (includingpollution prevention) that attempt to "go beyond simple regulatorycompliance.” The CMA also conducts workshops and technical symposia,promotes in-plant safety, operates a chemical emergency center(CHEMTREC) which offers guidance in chemical emergency situations, andoperates the Chemical Referral Center which provides chemical health andsafety information to the public. Publications include: ChemEcology, a 10-
September 1995 110 SIC 281

Sector Notebook Project Inorganic Chemicals
issue-per-year newsletter covering environmental, pollution-control, worker-safety, and federal and state regulatory actions, and the CMA Directory, a listing of the CMA membership. The CMA holds an annual meeting in White Sulphur Springs, WV.
Chlor-alkali Industry
The Chlorine Institute, Inc.2001 L Street, N.W. Suite 506Washington, D.C. 20036Phone: (202) 223-2790Fax: (202) 223-7225
Members: 200 Budget: $1,500,000 Contact: Gary Trojak
The Chlorine Institute, Inc. was established in 1924 and represents companiesin the U.S., Canada, and other countries that produce, distribute, and usechlorine, sodium and potassium hydroxides, and sodium hypochlorite; and thatdistribute and use hydrogen chloride. The Institute is a non-profit scientificand technical organization which serves as a safety, health, and environmentalprotection center for the industry.
Chlorine Chemistry Council2501 M Street, N.W. Members: 30Washington, D.C. 20037 Staff: 24Phone: (202) 887-1100 Budget: $14,000,000Fax: (202) 887-6925 Contact: Kip Howlett Jr.
The Chlorine Chemistry Council (CCC), established in 1993, is a businesscouncil of the Chemical Manufacturers Association (CMA) and is made up ofproducers and users of chlorine and chlorine-related products. Withinvolvement from all stakeholders, the CCC works to promote science-basedpublic policy regarding chlorine chemistry and is committed to develop andproduce only those chemicals that can be manufactured, transported, used,and disposed of safely. CCC facilitates risk-benefit analyses and productstewardship through the collection, development, and use of scientific data onhealth, safety, and environmental issues. CCC hopes to heighten publicawareness of chlorine chemistry and its many societal benefits by collaboratingwith the public health and scientific community in assessing andcommunicating chlorine-related human health and environmental issues.
September 1995 111 SIC 281

Sector Notebook Project Inorganic Chemicals
IX. CONTACTS/ACKNOWLEDGMENTS/RESOURCE MATERIALS/BIBLIOGRAPHY
For further information on selected topics within the inorganic chemicals industry a list of contacts and publications are provided below:
Contactsf
Name Organization Telephone Subject
Walter DeRieux EPA/OECA (202) 564-7067 Regulatory requirements and compliance assistance
Sergio Siao EPA/NEIC (303) 236-3636 Industrial processes and regulatory requirements
Iliam Rosario EPA/OAQPS (919) 541-5308 Regulatory requirements (Air), Chlorine NESHAPs
George Zipf EPA/OW (202) 260-2275 Regulatory requirements (Water)
Rick Brandes EPA/OSWER (202) 260-4770 Regulatory requirements (Solid waste)
Ed Burks EPA/Region IV (404) 347-5205 Inspections, regulatory requirements (RCRA)
Jim Gold EPA/Region VI (713) 983-2153 Inspections and regulatory requirements (Water, AIR and TSCA)
OECA: Office of Enforcement and Compliance AssistanceNEIC: National Enforcement Investigations CenterOAQPS: Office of Air Quality Planning and StandardsOW: Office of WaterOSWER: Office of Solid Waste and Emergency Response
General Profile
U.S. Industrial Outlook 1994, Department of Commerce
1987 Census of Manufacturers, Industry Series, Industrial Inorganic Chemicals, Bureau of the Census [Published every five years the next version will be available in September of 1994]
1992 Census of Manufacturers, Preliminary Report Industry Series, Industrial Inorganic Chemicals, Bureau of the Census [Data will be superseded by a more comprehensive report in September of 1994]
f Many of the contacts listed above have provided valuable background information and comments during the development of this document. EPA appreciates this support and acknowledges that the individuals listed do not necessarily endorse all statements make within this notebook.
September 1995 112 SIC 281

Sector Notebook Project Inorganic Chemicals
Chlorine and Its Derivatives: A World Survey of Supply, Demand, and Trade to 1992, Tecnon Consulting Group, London, 1988.
North American Chlor-Alkali Industry Plants and Production Data Book, Pamphlet 10, The Chlorine Institute, Washington, D.C., January, 1989.
Process Descriptions and Chemical Use Profiles
Riegel’s Handbook of Industrial Chemistry, 9th ed., Kent, James A., Ph.D., editor, Van Nostrand Reinhold, New York, 1993.
Kirk-Othmer Encyclopedia of Chemical Technology, Fourth edition, volume 1, John Wiley and Sons, New York, 1994.
Buchner, Schliebs, Winter, Buchel. Industrial Inorganic Chemistry, VCH Publishers, New York, 1989.
Multi-media Assessment of the Inorganic Chemicals Industry, Chapter 12-Salt Derivatives, Prepared for U.S. EPA Industrial Environmental Research Laboratory by Verser, Inc., Springfield, Virginia, 1980.
Recommendations To Chlor-alkali Manufacturing Facilities for the Prevention of Chlorine Releases, The Chlorine Institute, First Edition, October, 1990.
Assessment of Solid Waste Management Problems and Practices in the Inorganic Chemicals Industry, Final Report, Versar, Inc. for U.S. Environmental Protection Agency, Industrial Environmental Research Laboratory, Cincinnati, Ohio, April 1979.
Chlorine, Its Manufacture, Properties, and Uses, J.S. Sconce, Reinhold Publishing Corp., New York, 1962.
Electrolytic Manufacture of Chemicals from Salt, D.W.F. Hardie and W.W. Smith, The Chlorine Institute, New York, 1975.
Modern Chlor-Alkali Technology, Vol. 4, N.M. Prout and J.S. Moorhouse, eds., Elsevier Applied Science, 1990.
Regulatory Profile
Sustainable Environmental Law, Environmental Law Institute, West Publishing Co., St. Paul, Minn., 1993.
Development Document for Effluent Limitations Guidelines and New Source Performance Standards for the Major Inorganic Products Segment of the Inorganic Chemicals Point Source Category, U.S. Environmental Protection Agency, Washington, D.C., March 1974. Report No. EPA-440/1-74-007a.
September 1995 113 SIC 281

Sector Notebook Project Inorganic Chemicals
ENDNOTES
1. U.S. Department of Commerce. U.S. Industrial Outlook 1994. January 1994.
2. U.S. Department of Commerce, Bureau of the Census. 1994 Census of Manufacturers, Industrial Inorganic Chemicals. April 1995.
3. U.S. Department of Commerce. U.S. Industrial Outlook 1994. January 1994.
4. U.S. Department of Commerce, Bureau of the Census. 1994 Census of Manufacturers, Industrial Inorganic Chemicals. April 1995.
5. Büchner, Schliebs, Winter, Büchel. Industrial Inorganic Chemistry. New York: VCH Publishers, 1989.
6. Ibid.
7. U.S. Department of Commerce, Bureau of the Census. 1994 Census of Manufacturers, Industrial Inorganic Chemicals. April 1995.
8. Charles River Associates. Chlorine Chemistry Plays a Vital Role in the U.S. Economy. Washington, D.C.: The Chlorine Institute, 1993.
9. Kirk-Othmer Encyclopedia of Chemical Technology, Fourth Ed. New York: John Wiley and Sons, 1994.
10. U.S. Department of Commerce. U.S. Industrial Outlook 1994. January 1994.
11. Ibid.
12. Ibid.
13. Ibid.
14. Ibid.
15. Kirk-Othmer Encyclopedia of Chemical Technology, Fourth Ed. New York: John Wiley and Sons, 1994.
16. Büchner, Schliebs, Winter, Büchel. Industrial Inorganic Chemistry. New York: VCH Publishers, 1989.
17. Ibid.
18. Ibid.
19. Kirk-Othmer Encyclopedia of Chemical Technology, Fourth Ed. New York: John Wiley and Sons, 1994.
September 1995 114 SIC 281

Sector Notebook Project Inorganic Chemicals
20. Büchner, Schliebs, Winter, Büchel. Industrial Inorganic Chemistry. New York: VCH Publishers, 1989.
21. Ibid.
22. Kirk-Othmer Encyclopedia of Chemical Technology, Fourth Ed. New York: John Wiley and Sons, 1994.
23. Ibid.
24. Ibid.
25. Ibid.
26. Büchner, Schliebs, Winter, Büchel. Industrial Inorganic Chemistry. New York: VCH Publishers, 1989.
27. Kirk-Othmer Encyclopedia of Chemical Technology, Fourth Ed. New York: John Wiley and Sons, 1994.
28. Ibid.
29. Ibid.
30. Büchner, Schliebs, Winter, Büchel. Industrial Inorganic Chemistry. New York: VCH Publishers, 1989.
31. Kirk-Othmer Encyclopedia of Chemical Technology, Fourth Ed. New York: John Wiley and Sons, 1994.
32. Ibid.
33. Ibid.
34. Ibid.
35. Ibid.
36. Ibid.
37. Ibid.
38. Ibid.
39. Versar, Inc. Multi-Media Assessment of the Inorganic Chemicals Industry. Ch. 12. Cincinnati, Ohio: U.S. EPA Industrial Environmental Research Laboratory, August, 1980.
40. Versar, Inc. Multi-Media Assessment of the Inorganic Chemicals Industry. Ch. 12. Cincinnati, Ohio: U.S. EPA Industrial Environmental Research Laboratory, August, 1980.
September 1995 115 SIC 281

Sector Notebook Project Inorganic Chemicals
41. Ibid.
42. Ibid.
43. Ibid.
44. Ibid.
45. Ibid.
46. Ibid.
47. Ibid.
48. Ibid.
49. Ibid.
50. Ibid.
51. Ibid.
52. Ibid.
53. Ibid.
54. Ibid.
55. U.S. EPA Office of Pollution Prevention and Toxics. 1993 Toxics Release Inventory PublicData Release. May 1994.
56. Ibid.
57. Kent, James A. Ph.D., editor. Riegel’s Handbook of Industrial Chemistry, 9th ed. New York:Van Nostrand Reinhold, 1993.
58. Ibid.
59. Ibid.
September 1995 116 SIC 281

Sector Notebook Project Inorganic Chemicals
GPO Order Form
September 1995 117 SIC 281

Sector Notebook Project Inorganic Chemicals
Inside back cover
September 1995 118 SIC 281

Sector Notebook Project Inorganic Chemicals
Backcover
September 1995 119 SIC 281