sector assessments: tourism & agriculture - un pei · sector assessments: tourism &...
TRANSCRIPT
A Study of the Contribution of Sustainable Natural Resource
Management to Economic Growth, Poverty Eradication and
Achievement of NDP 10 Goals
Sector Assessments: Tourism & Agriculture
By
Botswana Institute for Development Policy Analysis
In association with
GY Associates Ltd
32 Amenbury Lane, Harpenden
Herts. UK. AL5 2DF
web site: www.gya.co.uk
Submitted to:
Ministry of Finance and Development Planning,
Gaborone, Botswana

ii
Acronyms
ALDEP Arable Lands Development Programme ARAP Accelerated Rainfed Arable Programme BCA Botswana College of Agriculture BIDPA Botswana Institute for Development Policy Analysis BoB Bank of Botswana BOBS Botswana Bureau of Standards CBNRM Community Based Natural Resource Management CEDA Citizen Entrepreneurial Development Agency CH1 Community Hunting1 CH2 Community Hunting 2 CSO Central Statistics Office DCs District Councils DEA Department of Environmental Affairs DWA Department of Water Affairs DWNP Department of Wildlife and National Parks FAO Food and Agriculture Organization FAP Financial Assistance Policy FMD Foot and Mouth Disease GDP Gross Domestic Product GoB Government of Botswana HIES Household Income and Expenditure Survey ISPAAD Integrated Support Programme for Arable Agriculture Development LIMID Livestock Management and Infrastructure Development LPG Liquefied Petroleum Gas LWDP Livestock Water Development Programme MDG Millennium Development Goals MEWT Ministry of Environment Wildlife and Tourism MFDP Ministry of Finance and Development Planning MOA Ministry of Agriculture NAMPAADD National Master Plan for Arable Agriculture and Dairy Development NDMO National Disaster Management Office NDP National Development Plan NGO Non Governmental Organization NWNP National Water Master Plan SLOCA Services for Livestock Owners in Communal Areas SOER State of the Environment Report TGLP Tribal Grazing Land Policy UNEP United Nations Environmental Programme UNFCC United Nations Framework on Climate Change WUC Water Utilities Corporation WTTC World Travel& Tourism Council

iii
Acknowledgements
This report was written by Gil Yaron and Pelotshweu Moepeng with David Mmopelwa, Lillian Mookodi and Raymond Lekobane. We are grateful to Ruud Jansen and David Smith of UNDP-UNEP PEI for constructive and helpful comments on an earlier version.
Contents Acronyms ................................................................................................................................................ ii
Acknowledgements ................................................................................................................................ iii
1 Tourism ........................................................................................................................................... 1
1.1 Tourism: Introduction ............................................................................................................. 1
1.2 Tourism and Economic Growth............................................................................................... 1
1.3 Tourism and Poverty Eradication ............................................................................................ 7
1.4 Tourism and Green Growth: Opportunities for Botswana ..................................................... 9
1.5 The Economics of Tourism and the Environment ................................................................. 14
2 Agriculture .................................................................................................................................... 16
2.1 Introduction .......................................................................................................................... 16
2.2 Agriculture and Economic Growth ........................................................................................ 16
2.3 Agriculture (Livestock, Crops and Natural Resources) and Incidence of Poverty in Botswana
19
2.4 Agriculture and the Environment ......................................................................................... 27
2.5 The Economic Costs of Natural Resource Degradation ........................................................ 31
2.6 Agricultural policy and opportunities for technology adoption ........................................... 33
3 The Scope of Tourism and Agriculture to Contribute to Poverty Eradication in Botswana: Some
Conclusions ........................................................................................................................................... 36
References ............................................................................................................................................ 42
List of Figures Figure 1: Total Travel & Tourism Contribution to GDP & Employment .................................................. 2
Figure 2: Tourist and Day Arrivals; 1994-2010 ........................................................................................ 6
Figure 3: Origin of leisure visitor arrivals, 2007 ...................................................................................... 7
Figure 4: Contribution of Agriculture to GDP; 1974-2011 ................................................................... 17
Figure 5: Trends of Desegregated Shares of Total Agricultural GDP by Type of Activity; 1994-2011 .. 18
iv
Figure 6: Number of Cattle sold to Botswana Meat Commission; 1985/86-2010 ................................ 19
Figure 7: Main source of food for agricultural households .................................................................. 23
Figure 8: Trade Balance: Meat, Chicken and related products, 2003-2010, (P‘000) ........................... 24
Figure 9: Relative Frequency with which Heads of Household Mention Different Sources (by Type of
their Income) ......................................................................................................................................... 26
Figure 10: Trends in total production relative to demand (1979-2004) ............................................... 29
Figure 11: Trends of Crop Purchases by BAMB (tonnes) for the Period 1995 to 2008 ........................ 30
Figure 12: Availability of Waste Water Resources by Treatment Plants by Design capacity, Inflow and
Outflow in m3/day by Districts .............................................................................................................. 34
List of Tables Table 1: Foreign tourist spend by main purpose of visit, 2009............................................................... 3
Table 2: WTTC 2012 tourism & travel economic impacts, Botswana ..................................................... 4
Table 3: Annual Average Growth Rate by Economic Sector (1974-2011) ............................................ 17
Table 4: Cross tabulation of Incidence of Poverty of Household Heads whether or not they had
Livestock Sales ...................................................................................................................................... 20
Table 5: Cross tabulation of Incidence of Poverty and Heads of Household Benefits from Crop
Sales 21
Table 6: Cross tabulation of Household Head Poverty and the Dependence of Heads of
Household on Harvested Natural Resources Sales ............................................................................... 22
Table 7: Number of Employees and Share of Employment by Sector for the Period 1981 to 2001 .... 25

1
1 Tourism
1.1 Tourism: Introduction
In this section of the Report we consider the financial returns to Botswana from nature-
based tourism, the scope this offers to contribute to poverty eradication and some key
issues that have to be addressed in order to realise this potential. In ecosystem terms,
nature-based tourism is just a small part of the services – cultural services in the TEEB
(2010) classification – that are provided by Botswana’s natural assets. So before focusing in
on nature-based tourism it is worth remembering that the wilderness that provides wildlife
for tourism also provides other critical eco-system services for Botswana. Local livelihoods
depend on provisioning services (e.g. water and veld products) and Botswana as a whole
relies on regulating services (e.g. carbon sequestration and maintaining soil quality).
These regulating services do not have a financial value but they do have a large economic
value to the country as a whole. For example, Turpie et al (2006) conservatively estimate
indirect use values of 277 million Pula/year (430 million in 2010 prices) from the Okavango
Delta Ramsar Site to Botswana of which 58% are attributable to carbon storage and 28% to
wildlife refuge services. Arntzen et al. (2010) estimate the carbon sequestration value of
the Makgadikgadi is 136 million Pula/annum.
These issues are discussed extensively in Yaron et al (2012) and will not be repeated here.
However, a couple of implications do need to be highlighted. Firstly, tourism policy needs to
take account of other users of these shared natural resources in order to provide solid
foundations for the future and to support human development in economic, social and
ecological terms. Secondly, we are particularly interested in ways of developing tourism
that contributes to all these aspects of human development and, as such, can be described
as providing green growth. For this reason, the latter part of this Section considers
community-based natural resource management (CBNRM), how to add value from cultural
tourism and diversification and building local skills for nature-based tourism to strengthen
the contribution to poverty eradication.
1.2 Tourism and Economic Growth
According to WTTC (2012), the travel and tourism sector in Botswana contributed a total of
6.5% of GDP and 45,000 jobs (11.9% of employment1) in 2011. As Figure 1 shows the direct
contribution of travel and tourism was some 3013 million Pula (2.4% of GDP) and 18,000
jobs (4.8% of formal employment)– these are in the accommodation, restaurant and
transport sectors that provide foreign visitors and local residents with tourism and travel
1Based on total employment of 378,877 reported in CSO March 2011 Formal Employment Statistics

2
services for business and leisure purposes. Government spending to support individual
visits, for example on national parks, is included in this measure.
Figure 1: Total Travel & Tourism Contribution to GDP & Employment
Source: WTTC (2012), p1
The direct contribution of travel and tourism is the standard measure reported in official
statistics2.Note that the direct tourism measure captures the impact of foreign and domestic
visitors3. Currently, expert opinion and evidence from other African countries indicates that
domestic travelers are most likely to be visiting friends or relatives, for business, medical or
religious purposes rather than undertaking nature-based tourism4. Anecdotal evidence
suggests that a number of workshops are held in lodges and hotels that rely on an attractive
natural environment – which could count as domestic nature-based tourism. However, no
published survey data is available on the nature of domestic tourism and so for the purpose
of analyzing linkages between tourism and the natural environment we focus solely on the
statistics for foreign visitors.
As Table 1 below shows, leisure (sometimes known as holiday) spending accounted for a
third of all spending by foreign visitors in 2009 and these visits are nature-based. National
tourism statistics show that there were more visits to national parks and reserves (284,501
in 2007) than there were foreign leisure visitors (257,145 in 2007), but we do not know if
multiple visits or domestic tourism and foreign business/VFR visits account for the
difference.
2As specified in the 2008 Tourism Satellite Account: Recommended Methodological Framework
3Leechor and Fabricius (2005). The UNWTO simply defines Tourists as persons who are "travelling to and
staying in places outsidetheir usual environment for not more than one consecutive year for leisure, business and otherpurposes not related to the exercise of an activity remunerated from within the place visited”. 4 Leechor and Fabricius (2005), Millington et al. (2007)

3
Table 1: Foreign tourist spend by main purpose of visit, 2009
Million Pula Share
Leisure 964 33%
VFR 1259 43%
Business 255 9%
Transit 349 12%
Other 116 4%
Total 2943
Source: Derived from Department of Tourism (2010)
Given that foreign visitor spending accounts for 70.6% of direct tourism impact according to
WTTC (2012) and that at least a third of foreign visitor spending is nature-related, tourism
related to Botswana’s natural environment directly accounts for a minimum of 4,190 jobs
and 0.6% of GDP (around 1000 million Pula each year).
Spending by tourists in Botswana creates additional economic activity. For example, a lodge
employs staff (a direct effect of tourism) and these staff spend their wages on food, school
fees and other household items (indirect effects). Government collective spending on
infrastructure, security and other services that is attributable to tourism is allocated to the
indirect impact category. In addition, direct and indirect spending has a subsequent
induced economic impact (much as a stone landing in a pond causes a wave to ripple
outwards). All of these economic impacts are calculated by WTTC and are shown in Table 2
below.
Indirect and induced tourism and travel contributes 1.7 times as much to GDP and 1.4 times
as much to employment as the direct impact. Based on the foreign visitor share of direct
tourism GDP, the total financial value of tourism related to Botswana’s natural environment
could account for as many as 5870 jobs and 1.0% of GDP (some 1700 million Pula each
year).
4
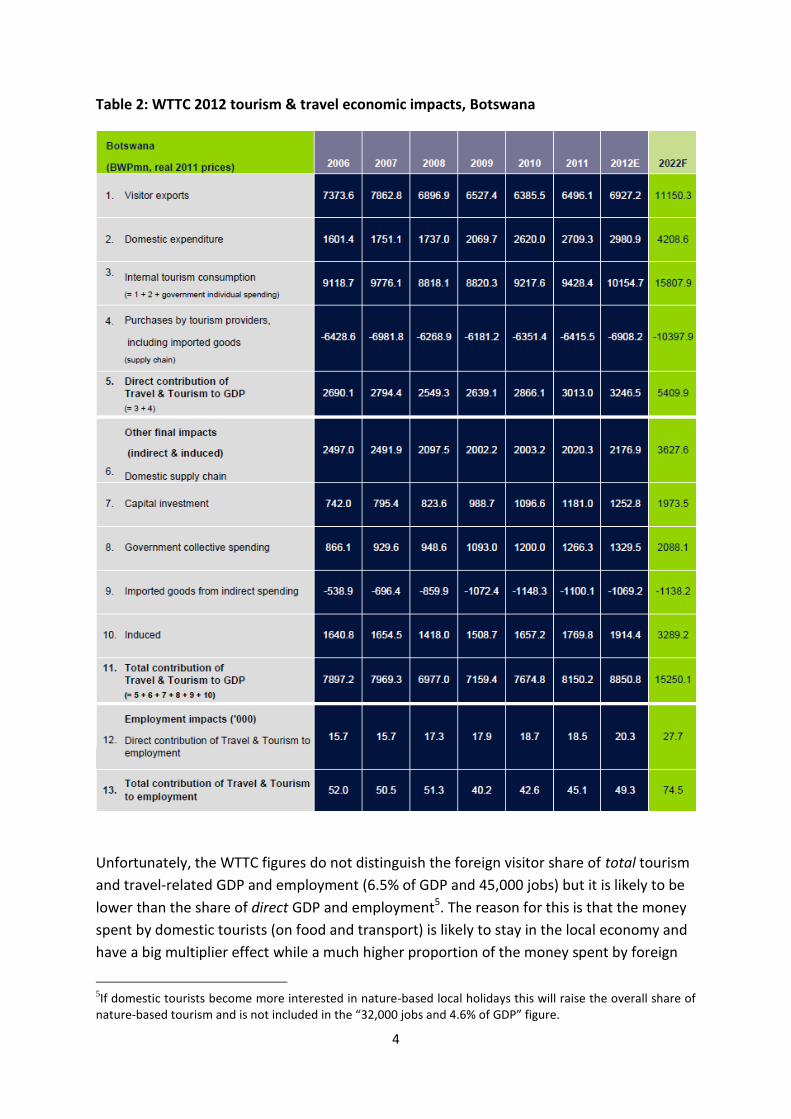
Table 2: WTTC 2012 tourism & travel economic impacts, Botswana
Unfortunately, the WTTC figures do not distinguish the foreign visitor share of total tourism
and travel-related GDP and employment (6.5% of GDP and 45,000 jobs) but it is likely to be
lower than the share of direct GDP and employment5. The reason for this is that the money
spent by domestic tourists (on food and transport) is likely to stay in the local economy and
have a big multiplier effect while a much higher proportion of the money spent by foreign
5If domestic tourists become more interested in nature-based local holidays this will raise the overall share of nature-based tourism and is not included in the “32,000 jobs and 4.6% of GDP” figure.

5
visitors is used to purchase imported food, skills and capital. These imports are referred to
in economic terms as “leakage”. An analysis by BTDP (2000) quoted in Mbaiwa (2005) found
leakage of 71% of foreign visitor tourism expenditure in Botswana – which is very high by
international standards6 – nonetheless, Mbaiwa (2005) provides a credible description of
ways in which this occurs. This leakage effect tends to overstate the NR-based share of total
tourism GDP although, as we have seen, the NR-based share of direct tourism GDP is likely
to be an under-estimate.
As Table 2 shows, leakage from indirect spending accounted for 1,100 million Pula in 2011.
Of course, many imports in the tourism sector are required to ensure that high-spending
visitors receive a high standard of service but, as we will see, there are opportunities to add
value to nature-based tourism that will reduce leakages. By keeping a higher proportion of
total tourism spending in local areas this is expected to make the contribution of tourism
spending to poverty eradication more effective
Some caution is required when comparing the economic contribution of tourism in
Botswana with other countries as differences in the structure of the economy will heavily
influence the results. However, reviewing the comparisons in WTTC (2012) we note that:
Despite rapid growth over the past two decades, tourism contributes a relatively
modest share of GDP in Botswana. The direct contribution of travel and tourism to
2011 GDP in Botswana (2.4%) is some way below the world average (5.2%)7 as well
as countries in the region such as South Africa (2.7%) and Tanzania (5%).
The contribution of tourism to total employment in Botswana is higher than the
contribution to GDP (as tourism is more labour-intensive than mining) but it remains
lower than that of regional competitors: 7.6% in Botswana compared to 9% in South
Africa and 11.6% in Tanzania.
Imported goods from indirect spending (one component of leakage) cost Botswana
1,100 million Pula which is 54.5% of all estimated indirect and induced spending in
the domestic supply chain. In South Africa, the comparable leakage figure is 10.8%.
Tourism is projected to become significantly more important as a source of jobs in
Botswana. The share of tourism employment in total employment is forecast to grow
by 4.2% each year between 2012 and 2022 (compared with 2% per annum in South
Africa). By 2022, the total contribution of tourism to national employment in
Botswana is forecast to be 9.6% (compared to 7.6% in 2011).
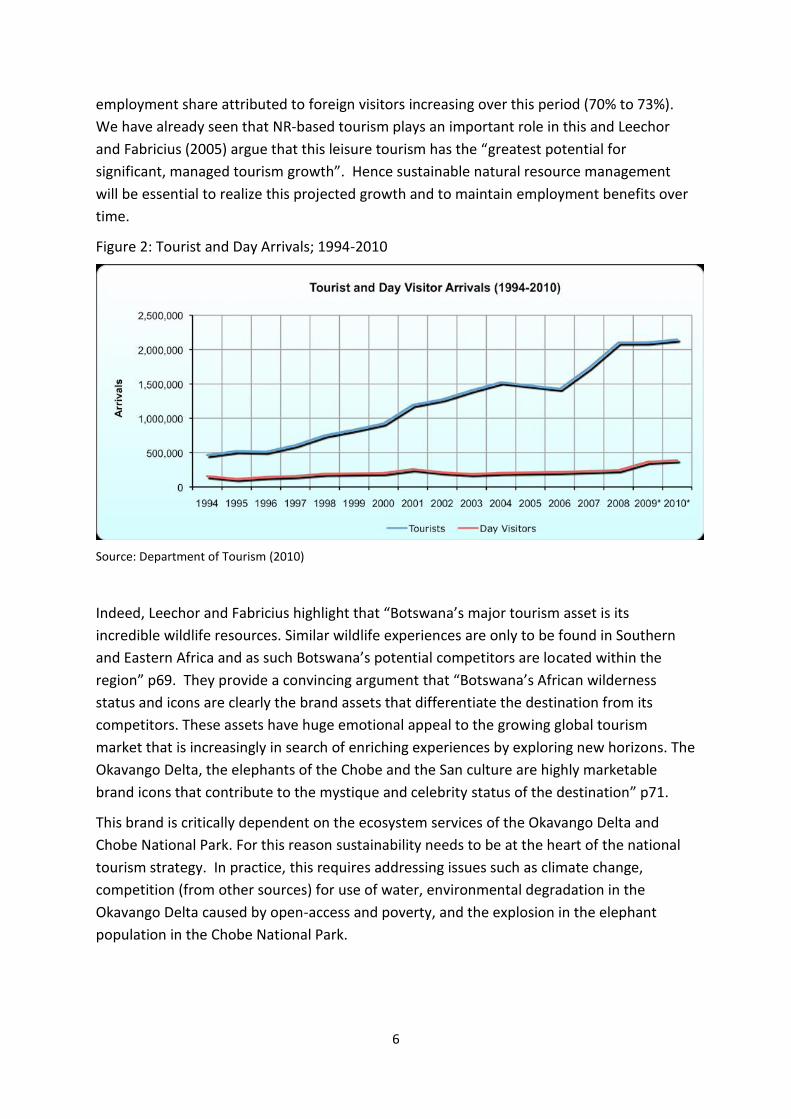
The most important driver of forecast tourism growth is the projected increase in foreign
visitor numbers. As Figure 2 shows, tourist (foreign visitor) arrivals went from 500,000 in
1995 to 1 million in 2000 and 2 million in 2008. These arrivals are projected by WTTC (2012)
to exceed 3.5 million annually by 2022. We also note that the WTTC forecast shows the
6Smith and Jenner (1992) quoted in Wells (1997) report leakage ranging from 11% in the Philippines rising to 60% in pre-independence Seychelles. 10 out of 13 countries had leakage rates below 50%. 7Industrialised countries tend to have higher contributions of travel and tourism to GDP because domestic travel and tourism are a much bigger part of the economy
6
employment share attributed to foreign visitors increasing over this period (70% to 73%).
We have already seen that NR-based tourism plays an important role in this and Leechor
and Fabricius (2005) argue that this leisure tourism has the “greatest potential for
significant, managed tourism growth”. Hence sustainable natural resource management
will be essential to realize this projected growth and to maintain employment benefits over
time.
Figure 2: Tourist and Day Arrivals; 1994-2010
Source: Department of Tourism (2010)
Indeed, Leechor and Fabricius highlight that “Botswana’s major tourism asset is its
incredible wildlife resources. Similar wildlife experiences are only to be found in Southern
and Eastern Africa and as such Botswana’s potential competitors are located within the
region” p69. They provide a convincing argument that “Botswana’s African wilderness
status and icons are clearly the brand assets that differentiate the destination from its
competitors. These assets have huge emotional appeal to the growing global tourism
market that is increasingly in search of enriching experiences by exploring new horizons. The
Okavango Delta, the elephants of the Chobe and the San culture are highly marketable
brand icons that contribute to the mystique and celebrity status of the destination” p71.
This brand is critically dependent on the ecosystem services of the Okavango Delta and
Chobe National Park. For this reason sustainability needs to be at the heart of the national
tourism strategy. In practice, this requires addressing issues such as climate change,
competition (from other sources) for use of water, environmental degradation in the
Okavango Delta caused by open-access and poverty, and the explosion in the elephant
population in the Chobe National Park.
7
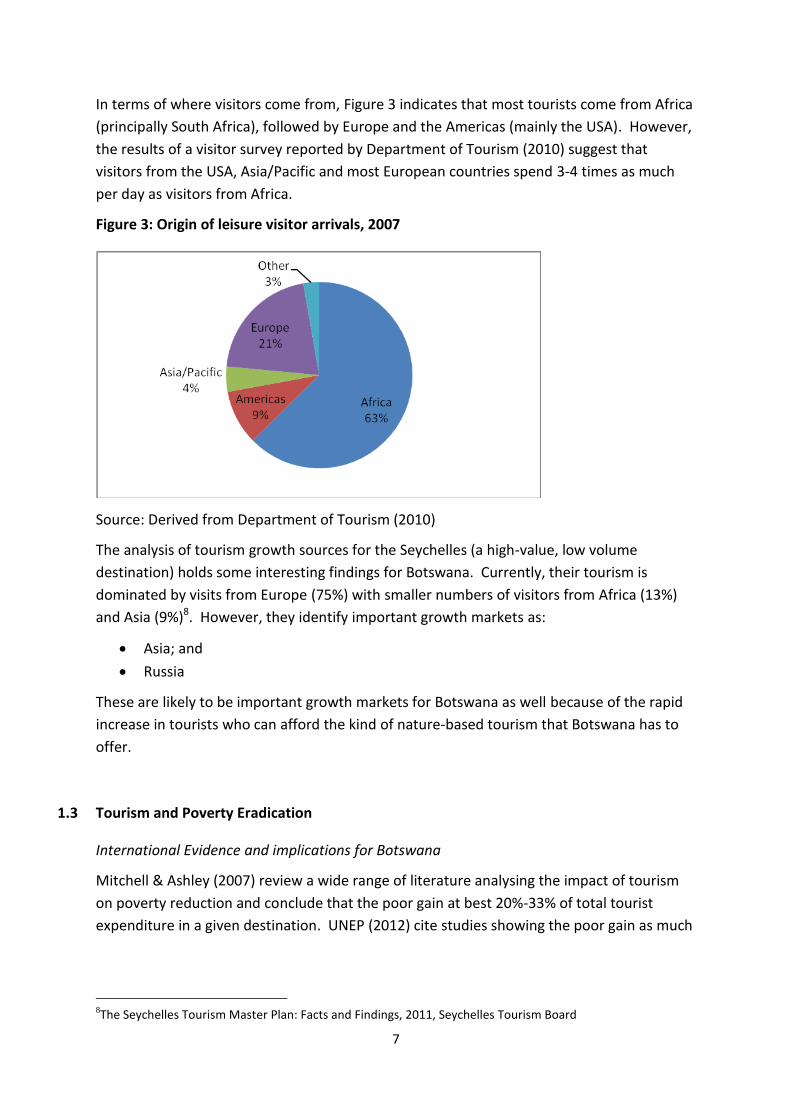
In terms of where visitors come from, Figure 3 indicates that most tourists come from Africa
(principally South Africa), followed by Europe and the Americas (mainly the USA). However,
the results of a visitor survey reported by Department of Tourism (2010) suggest that
visitors from the USA, Asia/Pacific and most European countries spend 3-4 times as much
per day as visitors from Africa.
Figure 3: Origin of leisure visitor arrivals, 2007
Source: Derived from Department of Tourism (2010)
The analysis of tourism growth sources for the Seychelles (a high-value, low volume
destination) holds some interesting findings for Botswana. Currently, their tourism is
dominated by visits from Europe (75%) with smaller numbers of visitors from Africa (13%)
and Asia (9%)8. However, they identify important growth markets as:
Asia; and
Russia
These are likely to be important growth markets for Botswana as well because of the rapid
increase in tourists who can afford the kind of nature-based tourism that Botswana has to
offer.
1.3 Tourism and Poverty Eradication
International Evidence and implications for Botswana
Mitchell & Ashley (2007) review a wide range of literature analysing the impact of tourism
on poverty reduction and conclude that the poor gain at best 20%-33% of total tourist
expenditure in a given destination. UNEP (2012) cite studies showing the poor gain as much
8The Seychelles Tourism Master Plan: Facts and Findings, 2011, Seychelles Tourism Board
8
as 34% of the total tourism spending in Malaysia9 and as little as 10% of total tourism
income spent in Zanzibar10.
In addition, estimates from two separate studies suggest that tourism has reduced the
incidence of poverty in Costa Rica by between 1.4%11 and 3%12. This is in a middle-income
country that relies on travel and tourism for significantly more of its GDP than does
Botswana (13% Vs 6.5%). So while we can expect tourism to contribute to poverty
eradication in Botswana it clearly can only provide one part of the solution.
The international literature suggests factors that are likely to make increased tourism
spending in a country more or less beneficial for the poor. At a macroeconomic level the
challenge is to reduce leakage and increase the multiplier effect of tourism spending in the
national economy – Mill (2002). At a micro-economic level Ashley and Mitchell (2005)
argue that companies and government can alter their behaviour in various ways to “sharpen
the pro-poor benefits from tourism”.
The Sustainable Tourism for Eliminating Poverty (ST-EP) initiative hasidentified seven
different mechanisms that can help in this regard. These are: (1) Undertaking measures to
increase the number of the poor working in tourism enterprises; (2) Maximising the
proportion of tourism spending that is retained in local communities and involving the poor
in the supply process; (3) Promoting the direct sales of goods and services to visitors by the
poor from informal businesses;(4) Establishing and managing more formal tourism
enterprises by thepoor, either individually or at a community level; (5) Using taxes or levies
on tourism income or profits with proceeds benefiting the poor; (6)Supporting the poor in
money or in kind, by visitors or tourism enterprises;and (7) Investing in infrastructure that
offers local communities the chanceto gain new access to available resources13
Although the ST-EP recommendations are based on considerable experience of those
working in the tourism sector, academic research suggests that other factors also need to be
taken into account. Blake et al (2008) use a computable general equilibrium (CGE) model of
the Brazilian economy to investigate how the gains from tourism expansion affect different
income groups. They find that the greatest gains are obtained by skilled rather than
unskilled labour and so, while the poor do benefit from increased tourism higher income
groups benefit even more. This skills issue is discussed further below.
CEPAL (2007), although using a much simpler analytical approach with survey data from
Costa Rica and Nicaragua,also find that “Tourism, then, contributes to poverty reduction
9TPRG (2009): The Application of Value Chain Analysis to measureEconomic Benefits at TanjongPiai, Pontian,
and Johor. TourismPlanning Research Group.UniversitiTeknologiMalysia. 10
Steck, B., K. Wood, and J. Bishop (2010): Tourism: More Value for Zanzibar. ValueChainAnalysis. SNV, VSO, ZATI. 11
Rojas, L. (2009), Evolución e Importancia del Turismo en Costa Rica.San José: Estado de la Nación en Desarrollo
Sostenible 12
CEPAL (2007), Turismo y Condiciones Sociales en Centroamérica:Las Experiencias en Costa Rica y Nicaragua,
NACIONES UNIDAS COMISIÓN ECONÓMICA PARA AMÉRICA LATINA Y EL CARIBE – CEPAL 13UNWTO (2004), Tourism and Poverty Alleviation: Recommendations for Action. Madrid: World Tourism Organization.

9
under certain circumstances, but further policy implementations in terms of education and
training are necessary so as to help workers to get the most of tourism employment as the
sector grows”.
Research is needed to understand whether these results will apply in Botswana but there
are reasons to suggest this is likely. On one hand we know that:
Women are most likely to gain new tourism jobs;
Employment income is important as a route out of poverty; and
Remittances and transfers financed from tourism are important within livelihood
strategies of the poor.
Yet, on the other hand we know the primary tourism market is high value and low volume
and so relative to mass market tourism we might expect a higher proportion of jobs created
to be skilled (e.g. guides and chefs) rather than unskilled (e.g. cleaners). Skilled workers are
most likely to have other job opportunities (in the mining, manufacturing or service sectors)
and so increased tourism will tend to push up wages for this group. The evidence from
Latin America suggests second set of factors is likely to dominate over time.
This does not mean that tourism expansion will fail to benefit the poor but it suggests that
international experience is likely to be relevant to Botswana: changes in behavior by
government, private companies and CBOs can improve the returns to the poor. We
consider what form this might take in the section below.
1.4 Tourism and Green Growth: Opportunities for Botswana
Realising the potential of CBNRM
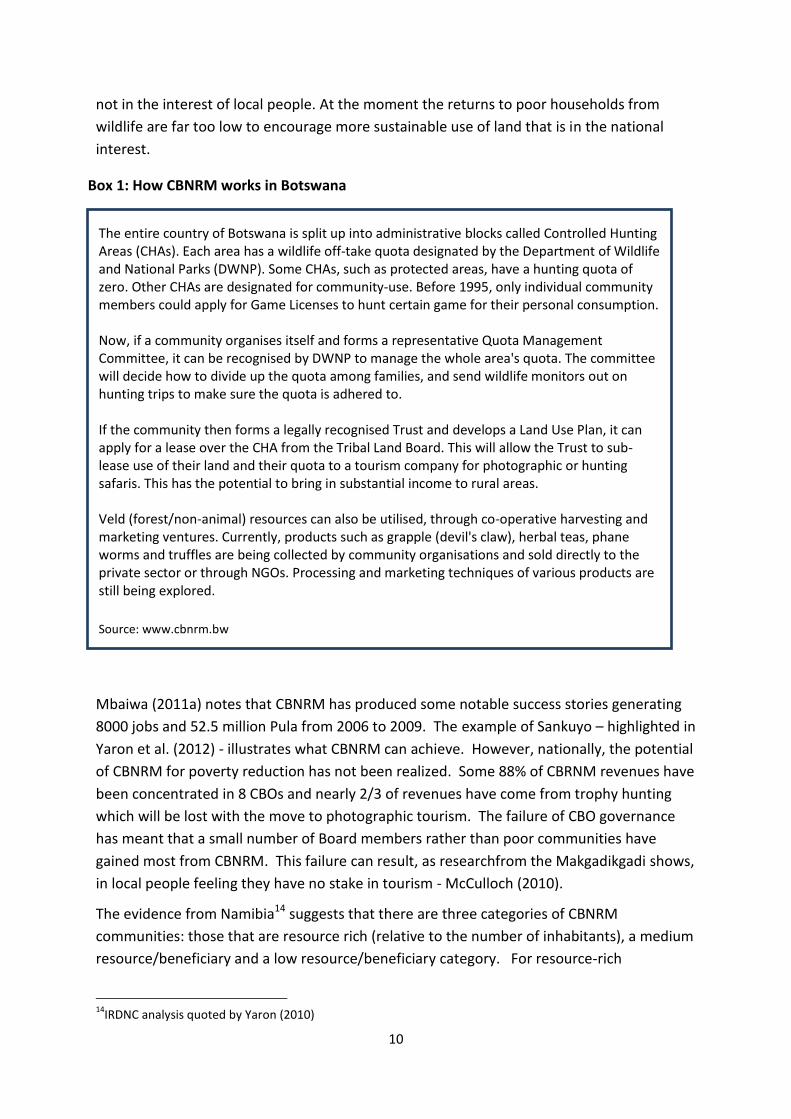
Community-based natural resource management (CBNRM) – described in Box 1 below - can
help tourism to be more pro-poor in a number of ways including:
1. Increasing local income generated by tourism visits
2. Creating skilled job opportunities (e.g. guides)
3. Helping to develop small businesses in rural areas providing services to the tourism
industry; and
4. Empowering local people to manage natural resources in their locality.
Many of the mechanisms identified by ST-EP (see above) can potentially be provided by
CBNRM. In addition, it provides an opportunity for tourism to become a sustainable
livelihood for the local community rather than an alien activity that simply provides jobs for
some community members. McCulloch (2010) illustrates how this distinction matters for
local people in the Makgadikgadi Pan National Park. Currently, wildlife benefits accrue
nearly entirely to the State while livestock benefits accrue to the individual. So, while a
switch from livestock to more wildlife-based land use would be better for the environment,
more resilient to drought and climate change and produce more income for Botswana it is
10
The entire country of Botswana is split up into administrative blocks called Controlled Hunting Areas (CHAs). Each area has a wildlife off-take quota designated by the Department of Wildlife and National Parks (DWNP). Some CHAs, such as protected areas, have a hunting quota of zero. Other CHAs are designated for community-use. Before 1995, only individual community members could apply for Game Licenses to hunt certain game for their personal consumption. Now, if a community organises itself and forms a representative Quota Management Committee, it can be recognised by DWNP to manage the whole area's quota. The committee will decide how to divide up the quota among families, and send wildlife monitors out on hunting trips to make sure the quota is adhered to. If the community then forms a legally recognised Trust and develops a Land Use Plan, it can apply for a lease over the CHA from the Tribal Land Board. This will allow the Trust to sub-lease use of their land and their quota to a tourism company for photographic or hunting safaris. This has the potential to bring in substantial income to rural areas. Veld (forest/non-animal) resources can also be utilised, through co-operative harvesting and marketing ventures. Currently, products such as grapple (devil's claw), herbal teas, phane worms and truffles are being collected by community organisations and sold directly to the private sector or through NGOs. Processing and marketing techniques of various products are still being explored.
Source: www.cbnrm.bw
not in the interest of local people. At the moment the returns to poor households from
wildlife are far too low to encourage more sustainable use of land that is in the national
interest.
Mbaiwa (2011a) notes that CBNRM has produced some notable success stories generating
8000 jobs and 52.5 million Pula from 2006 to 2009. The example of Sankuyo – highlighted in
Yaron et al. (2012) - illustrates what CBNRM can achieve. However, nationally, the potential
of CBNRM for poverty reduction has not been realized. Some 88% of CBRNM revenues have
been concentrated in 8 CBOs and nearly 2/3 of revenues have come from trophy hunting
which will be lost with the move to photographic tourism. The failure of CBO governance
has meant that a small number of Board members rather than poor communities have
gained most from CBNRM. This failure can result, as researchfrom the Makgadikgadi shows,
in local people feeling they have no stake in tourism - McCulloch (2010).
The evidence from Namibia14 suggests that there are three categories of CBNRM
communities: those that are resource rich (relative to the number of inhabitants), a medium
resource/beneficiary and a low resource/beneficiary category. For resource-rich
14
IRDNC analysis quoted by Yaron (2010)
Box 1: How CBNRM works in Botswana

11
communities CBNRM can provide a route out of poverty but only if there is sustained and
significant NGO and Government support over a number of years to build local capacity and
if the appropriate regulatory framework is in place.
Given the problems of CBO governance within CBNRM, GoB has felt it necessary to closely
regulate CBOs in this sector. This presents a classic “principal-agent15” problem in which
central governmentis the principal with responsibility for monitoring CBNRM CBOs (the
agent) but has to rely on imperfect information as those in charge are not based within the
local community. The result is either that CBOs do not act as GoB would like them to (e.g.
by excluding many of the community) or that regulation fails to account for local
circumstances (making it difficult for CBOs to do a good job).
In Namibia, the government gets around this problem by relying on well-informed NGOs
(e.g. IRDNC) that have 20 years track record working with the communities and government
on CBNRM. In Botswana, there is much less NGO capacity in this sector16 and government
seems more comfortable relying on MEWT staff based in regional centres to work with
communities. However, in order to make this work effectively, local MEWT staff need to
have community-level work as a major component of their job description and they need to
be based in the community for a significant proportion of their time.
More generally, CBO businesses based on CBNRM need help to build capacity as well as a
supportive regulatory environment to become effective tourism businesses. These needs
can include basic business and financial management but even where these are in place,
more specialist hospitality industry training (e.g. how to run a camp site to appeal to
international tourists) will be required. However, hospitality training should build on the
comparative advantage that CBNRM has. For example, wild food foraging and cooking has
become fashionable in Europe and the USA and local guides have a great deal of knowledge
in this area. Despite this, the only food offered by CBNRM operations is often based on
imported ingredients. In the same way, there is likely to be a market for bush tracking skills
that CBRNM operations may be better placed to deliver than traditional tourism companies.
It is likely to be efficient to have some centrally-provided types of support for CBNRM.
Marketing support is obviously needed for CBNRM tourism as a whole. CBOs engaged in
negotiations with tourism companies over joint ventures typically have very little experience
in this area and also need to be able to draw on expert advice.
The Government, donor partners, NGOs and private sector all have important contributions
to make to CBNRM capacity building. GoB has expressed interest in facilitating a better
institutional architecture for CBNRM including for support, oversight and marketing. MEWT
has established a National Environmental Fund which will have a CBNRM window for
funding projects. Against these very positive developments we note a tendency for
15
Stiglitz, Joseph E. (1987). "Principal and agent, The New Palgrave: A Dictionary of Economics, v. 3, pp. 966-71 16
This is not intended to detract from the important work done by a number of international and local NGOs in CBNRM. These include SNV, Conservation International, African Wildlife Fund, WWF, Kalahari Conservation Society, Komku Trust, Letloa Trust, Thusano Lefatsheng, TOCADI and Veld Products Research & Development.
12
Government to take a top-down approach to CBNRM in which a lack of consultation can
lead to serious unintended consequences. The ban on hunting in a 25-kilometer radius
around Protected Areas and the requirement of all CBNRM hunting to be replaced by
photographic tourism (without taking into account whether this is realistic for many
communities) is an example.
Donor partners have been fairly significant supporters of the CBOs engaged in CBNRM.
Johnson (2009) reports that CBOs received Pula 8.8 million between 2006-09 (approximately
US$1.5 million). Further support will undoubtedly be required and is likely to be more
achievable if there is a clear strategy for CBNRM development that demonstrates linkages to
improved governance, resilience to climate change and poverty eradication.
Mbaiwa (2011b) notes that some private companies have contributed funding to CBNRM.
However, private companies in sectors such as mining, financial services and manufacturing
could also contribute by mentoring CBO businesses. This relationship might aim to build
specific organisational capacity or achieve business plan goals as well as providing an
informal “sounding board”.
Adding value from cultural tourism and diversification
An extensive review of the international literature by UNEP (2011) leads to the conclusion
that “ecotourism, nature, heritage, cultural and “soft adventure” tourism, as well as sub-
sectors such as rural and community tourism are taking the lead in tourism markets and are
predicted to grow most rapidly over the next two decades. … There is empirical evidence
that tourists seeking environmental and culturally differentiated destinations are willing to
pay more for this experience”.
While Botswana is well placed to gain from nature-based tourism, little has been done to
develop cultural tourism, although this need has been recognized for some time17. In
practice, cultural tourism in Botswana covers a number of areas that include:
Using traditional craftwork such as basket making and weaving to produce items for
tourists. This is probably the most common component of cultural tourism in
Botswana and is closely linked with CBNRM.
Opportunities for visitors to gain an understanding of traditional culture. In many
African countries, tourism offerings include “traditional food and dance evenings”.
This approach can simply be a way of offering tourists an additional experience
within a standard “enclave tourism” format in which few benefits are retained
locally18. However, it can be provided within the CBNRM context e.g. the
Shandereka Cultural Village next to the Kaziikini community campsite19. Other
examples could include kgotla storytelling evenings with local meals.
17Leechor and Fabricas (2005), Mbaiwa (2004) 18Which is the criticism levelled by Mbaiwa (2005) at the current low-volume, high value approach to tourism in the Okavango Delta in Botswana. 19See: http://www.kaziikinicampsite.com/Shandereka%20Village

13
New tourism activities that build on bush craft skills and cultural tourism activities
from industrialised countries. A good example is cookery using local wild foods.
Although this can be an additional offering within enclave tourism, the opportunity
of participating and learning makes this type of tourism well suited to CBNRM and
eco-tourism. So, for example, while one of the most successful CBNRM operations –
Kaziikini campsite – provides restaurant meals, they use mainly imported ingredients
rather than the fresh veld food such as mushrooms their guides point out to tourists.
At the same time, the restaurant voted best in the world for the second time (Noma)
has created exceptional interest in foraged food in Europe20and there is a growing
market for courses that teach gathering and cooking combined with comfortable
accommodation21.
Diversification and encouraging linkages with the local economy should involve:
Encouraging tourism beyond the Okavango Delta and Chobe. This is a good way of
increasing the range of attractions offered to potential tourists and can increase the
amount of time tourists spend in Botswana or occasionally attract tourists who
otherwise may have gone elsewhere. Cultural tourism provides one way of achieving
this. Leechor and Fabricius (2005) argue that “The San interpretation of the natural
wilderness and their ancient traditions such as their rock art offer a potentially
unparalleled tourism experience. Areas such as Tsodilo Hills and the Central Kalahari
offer potentially exceptional experiences in this regard”. They note that this needs
to be carefully managed with the communities concerned. There has certainly been
some progress in this area22 but additional opportunities exist. Other types of eco-
tourism such as avi-tourism also provide important opportunities for diversification
and, again, generally will need to closely involve local communities23.
Building supply relationships between lodges and local producers of fresh produce as
well as, soaps and shampoos and letoisi products (made from local design, although
cloth / material is imported).
Building local skills for nature-based tourism
As we have seen in the Discussion Paper, poverty in Botswana is concentrated in rural areas.
Yet the international evidence strongly suggests that in order for rural communities to gain
fully from the expansion of nature-based tourism local people need access to skilled as well
as unskilled jobs.
20See http://www.spiegel.de/international/zeitgeist/0,1518,759277,00.html 21See, for example, http://www.tastethewild.co.uk/ 22Some international specialist safari companies now offer this option. See: http://www.naturalhighsafaris.com/browse/experience/tracking_with_the_bushmen_of_the_kalahari 23The development of avi-tourism in the Makgadikgadi Pans is one example: see http://www.birdlife.org/community/2010/09/conservation-breakthrough-in-botswana/

14
Further research is required to identify exactly what this entails. However, there is some
evidence that existing government policy excludes local community members who wish to
build careers in this industry. For example, formal secondary school qualifications are
required to become an accredited safari guide. Local community members with many years
of bush craft may be excluded while the required training in customer relations and health
and safety does not require high levels of formal education.
1.5 The Economics of Tourism and the Environment
Nature-based tourism can only make a sustained contribution to poverty eradication if it is
itself sustainable. The 2008 Okavango Delta Management Plan (ODMP) captures many of
the issues relevant to nature-based tourism noting:
There has been minimal or no sustained research on tourism carrying capacities;
There is little done to monitor tourism activities; and that
The issues with regard to wildlife use include human-elephant conflict, wildlife-livestock conflicts, declining population of certain species, and lack of baseline information on certain species.
Economic incentives generated by CBNRM play a part in addressing some of these issues.
That is to say, communities that benefit significantly from CBRNRM will be far more willing
to invest in wildlife-friendly solutions to human-wildlife conflict. Mbaiwa (2011b) notes that
the CBNRM Policy of 2007 includes a problematic clause that states that “thirty-five percent
(35%) of the proceeds of the sale of natural resource concessions and hunting quotas may
be retained by the CBO. Sixty-five percent (65%) shall be deposited in the Fund for financing
community based environmental management and ecotourism projects throughout the
country”. Where communities experience significant losses from wildlife, a requirement to
give back 65% of concession income may simply not be viable. Likewise, the removal of
hunting quotas may pose a serious threat to the sustainability of CBNRM in areas where the
opportunities for photographic tourism are limited.
Climate change represents a serious threat to wildlife-based tourism in Botswana. One
problem is the projected increase in extreme climatic events and the direct impact on
tourism income. For example, Moswete and Dube (2011) report that the flooding in the
Okavango Delta in 2000 resulted in the closure of the Moremi Game Reserve for a period of
eight months because roads were impassable.
A 2011 report in the UK Guardian newspaper24 based on an aerial survey identified an
alarming decline in wildlife species over the past 15 years. Although the reliability of a one-
off survey is contested, Moswete and Dube (2011) identify that a number of interactive
factors, among which are drought, fires, habitat fragmentation and encroachment and
poaching, have contributed to wildlife population decline. They note scientific evidence
24
June 18th
, 2011

15
points overwhelmingly to the likelihood of increased drought in Botswana as a result of
climate change and, by implication, increasing pressure on wildlife.
It is difficult to dispute the conclusion that there is need to diversify away from dependence
on nature-based to more inclusive forms of tourism such as cultural tourism. Nonetheless,
there are interventions that help adapt to climate change. For example, transboundary
parks that make it easier for animals to migrate; fewer subsidies for livestock in areas where
water is needed for wildlife; water pricing that reflects economic costs; and waste water re-
use and rainwater harvesting that makes the most of increasingly scarce water resources.

16
2 Agriculture
2.1 Introduction
Agriculture in Botswana is highly affected by problems of climate change and environmental externalities and as a result, productivity levels have been falling relative to other economic sectors. This is despite continued government intervention to support this important sector as a contributor to economic growth and poverty eradication. Total export earnings are positive in the livestock sub-sector but the trade balance in the food sector has been negative throughout the years since the 1970s. Following the decline in agricultural productivity, real wages have fallen in this sector compared to the modern sector, and hence labour has moved out of the sector to urban areas. Hence, unemployment remains high in Botswana because the modern sector growth is less than the growth in the labour force looking for employment. In this assessment, government intervention, though necessary, is also found to exacerbate problems of increasing unsustainable natural resource use both in arable and livestock production. However, emerging opportunities such as rapid urbanization are considered to have brought with them increased production of waste water which is currently underutilized, but can introduce a potential for promotion of urban and peri-urban agriculture.
2.2 Agriculture and Economic Growth
Contribution to Gross Domestic Product (GDP)
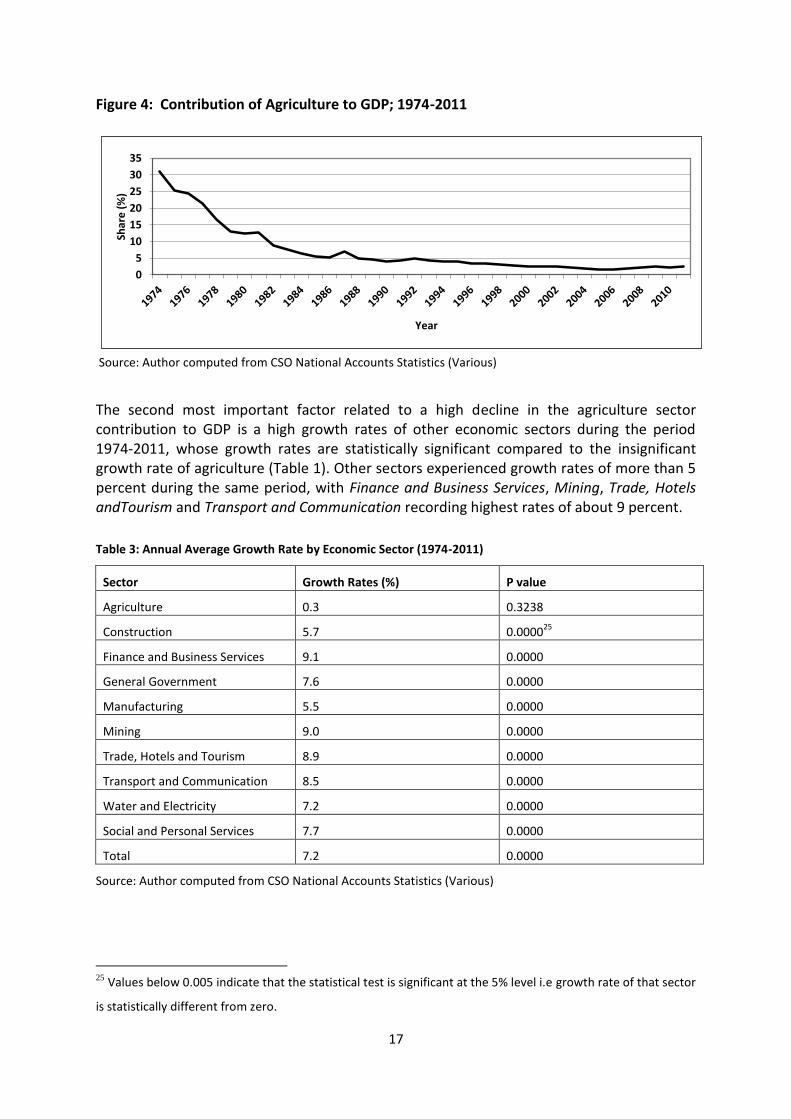
The share of agriculture sector contribution to economic growth in Botswana has fallen significantly to date, compared to the first 15 years after independence in 1966. Figure 1 illustrates that the share of agriculture to national GDP consistently declined from 31 percent in 1974 to about 2 percent in 2011. The relative decline of agriculture sector’s contribution to GDP is primarily a result of climate change effects in the form of recurring drought, and the discovery and mining of high value diamonds in Jwaneng, Orapa, and Damtshaa mines.
17
Figure 4: Contribution of Agriculture to GDP; 1974-2011
0
5
10
15
20
25
30
35
Shar
e (
%)
Year
Source: Author computed from CSO National Accounts Statistics (Various)
The second most important factor related to a high decline in the agriculture sector contribution to GDP is a high growth rates of other economic sectors during the period 1974-2011, whose growth rates are statistically significant compared to the insignificant growth rate of agriculture (Table 1). Other sectors experienced growth rates of more than 5 percent during the same period, with Finance and Business Services, Mining, Trade, Hotels andTourism and Transport and Communication recording highest rates of about 9 percent.
Table 3: Annual Average Growth Rate by Economic Sector (1974-2011)
Sector Growth Rates (%) P value
Agriculture 0.3 0.3238
Construction 5.7 0.000025
Finance and Business Services 9.1 0.0000
General Government 7.6 0.0000
Manufacturing 5.5 0.0000
Mining 9.0 0.0000
Trade, Hotels and Tourism 8.9 0.0000
Transport and Communication 8.5 0.0000
Water and Electricity 7.2 0.0000
Social and Personal Services 7.7 0.0000
Total 7.2 0.0000
Source: Author computed from CSO National Accounts Statistics (Various)
25
Values below 0.005 indicate that the statistical test is significant at the 5% level i.e growth rate of that sector
is statistically different from zero.

18
The livestock26 sub-sector has consistently accounted for the largest share, of more than 50 percent, to total agricultural GDP (Figure 5). The second position was obtained by “other27”, whose share of total agriculture sector GDP increased from 23 percent in 1994 to 41 percent in 2011. The relative growth and increase in importance of other crops such as horticulture contributed to a decline in the share of livestock contribution to agricultural GDP from about 74 percent in 1994 to 55 percent in 2011. Crops28 (arable agriculture) contribution to total agriculture sector GDP has remained at less than 5 percent in the last 16 years. A study to determine the proportion of subsistence or barter system to household income is required to understand the total estimated value of crop production (and not simply sales that are recorded in GDP).
Figure 5: Trends of Desegregated Shares of Total Agricultural GDP by Type of Activity; 1994-2011
01020304050607080
Shar
e(%
)
Year
Livestock
Crops
Other
Source: Author computed from CSO National Accounts Statistics (Various)
Climate change phenomena in Botswana such as droughts, desertification, and increases in
veterinary diseases, pests and insect infestations are likely to be associated with fluctuating
and declining export performance of the beef industry. For instance, the number of cattle
slaughtered by BMC declined from about 194 thousand in 1985/86 to 164 thousand in 2010.
Whilst some previous studies explained such declines through assumptions of
uncompetitive pricing system (BIDPA, 2006), trends in off-take fluctuate in a similar pattern
to years that were declared by government as drought years (Ministry of Finance and
Development Planning 2008). In addition, some regions such as the Ngamiland and
Okavango sub-districts, Bobirwa sub-district and parts of the North East have cut off the
cattle populations that supply the BMC, following discoveries of foot and mouth disease in
recent years. Cutting off traditional cattle suppliers to BMC could have a contribution to
observed declines in the number of cattle sold to BMC, and the growth of the local meat
industry who use District or Urban Council operated abattoirs. It could be that increasing
problems of lack of water access for livestock production, increased diseases as a result of
26
Livestock include the sales of cattle and net increase in cattle and other livestock information is not available.
27 Include information about hunting, fishing, forestry, poultry and horticulture (CSO, various).
28 Records of the sales of traditional crops

19
increased insects like ticks as a result of climate change are associated with decreasing
numbers of the cattle population.
Figure 6: Number of Cattle sold to Botswana Meat Commission; 1985/86-2010
0
50000
100000
150000
200000
250000
Source: BMC (Various)
2.3 Agriculture (Livestock, Crops and Natural Resources) and Incidence of Poverty in Botswana
Analysis of the national 2002/3 Household Income and Expenditure Survey (HIES) indicates
62% of households do not own any cattle. In 1985/6 50% of households had cattle and the
decrease since then almost certainly reflects increasing urbanization. Marumo and Monkhei
(2009) use the 2002/3 HIES data to estimate the proportion of total household income
attributable to livestock and find that while most (58%) of the poorest households do not
own any cattle, those that do are highly dependent on them for their livelihood.
Moepeng and Tisdell (2009) analyzed the association between three dominant traditional
agricultural pursuits as sources of livelihood in rural Botswana and the incidence of poverty
in a case study of Nshakazhogwe village in the Tutume Sub-District. The study made a cross
tabulation of the incidence of poverty and the dependence of heads of household on
livestock sales, and used the Pearson chi-square test. The cross tabulation results revealed
that 26.4 per cent of all households in Nshakazhogwe benefited from livestock29 sales. Of
those who had sold livestock the previous year, 31.3% were poor (Table 4). Although not
statistically significant, this result is consistent with the Marumo and Monkhei (2009)
finding.
29
Livestock in this case included small stock.

20
Table 4: Cross tabulation of Incidence of Poverty of Household Heads whether or not they had Livestock Sales
Livestock Sales
Household Head Poverty Status Total
Not Poor Poor
No
Count 177 66 243
% those without Livestock Sales 72.8% 27.2% 100.0%
% within Household Head Poverty Status
75.6% 68.8% 73.6%
Yes Count 57 30 87
% those with Livestock Sales 65.5% 34.5% 100.0%
% within Household Head Poverty Status
24.4% 31.3% 26.4%
Total Count 234 96 330
% of all 70.9% 29.1% 100.0%
% within Household Head Poverty Status
100.0% 100.0% 100.0%
Chi-Square Tests
Value df Asymp. Sig. (2-sided) Pearson Chi-Square 1.665(b) 1 .197
N of Valid Cases 330 a Computed only for a 2x2 table b 0 cells (.0%) have expected count less than 5. The minimum expected count is 25.31.
Source: Moepeng and Tisdell (2009)
Results of a cross-tabulation of whether or not household heads who received revenue from
crop sales in the previous year were in poverty in Nshakazogwe study have shown that only
8.8 per cent of all heads of household in this village benefited from this source of livelihood
(Moepeng and Tisdell, 2009). Thus outside own food production, crop production is
beneficial to a small proportion of all households. Further analysis from this study has
shown that the relative the proportion of poor heads of household that benefited from crop
sales is 10.5 per cent compared to 8.1 per cent of non-poor heads of households. Thus
among all the heads of households that benefited from crop sales, 34.5 per cent were poor.
A Pearson Chi-square test of the results revealed that these results are not statistically
significant (Table 5). Although the difference of the relative proportion of heads of
household that benefited from crop sales is not statistically significant, those who sold crops
were more frequently poor. Given the problems of climate change, and the recurrence of
drought, in Botswana, which are associated with a high risk crop failure, crop production is
characterized by results in low returns and the impact the effects of climate change is felt
more by poor families.

21
Table 5: Cross tabulation of Incidence of Poverty and Heads of Household Benefits from Crop Sales
Crop Sales
Household Head Poverty Status Total
Not Poor Poor
No
Count 215 85 300
% those without Crop Sales
71.7% 28.3% 100.0%
% within Household Head Poverty Status
91.9% 89.5% 91.2%
Yes Count 19 10 29
% those with Crop Sales
65.5% 34.5% 100.0%
% within Household Head Poverty Status
8.1% 10.5% 8.8%
Total Count 234 95 329
% of All
71.1% 28.9% 100.0%
% within Household Head Poverty Status
100.0% 100.0% 100.0%
Chi-Square Tests
Value df Asymp. Sig. (2-sided)
Pearson Chi-Square
.487(b) 1 .485
N of Valid Cases
329
a Computed only for a 2x2 table b 0 cells (.0%) have expected count less than 5. The minimum expected count is 8.37.
Table 6 depicts a cross tabulation of the incidence of poverty and whether heads of
household benefit from the sale of harvested natural resources (Moepeng and Tisdell,
2009). These results, also show that 8.2 per cent of all heads of household, in this village
case study benefit from the sale of harvested natural resources. The relative proportion of
poor heads of household that benefit from the sale of harvested natural resources is 7.3 per
cent while it is 8.5 per cent of non-poor heads of household. However, the poor heads of
household are 25.9 per cent of all heads of households that benefit from the sale of natural
resources. The reason the poor are in the minority include that harvesting of natural
resources require expensive input capital such as tractors for harvesting fuel wood for sale,
large trucks for harvesting thatching grass etc. In many cases the poor poor provide labour
and the rich own the natural harvested resources. A Pearson Chi-square test results show
the differences between poor and non-poor households are not statistically significant
(α>0.10). However, in practice, the relative involvement of the non-poor in harvesting

22
natural resources is slightly higher than for the poor. Even though, this study did not
measure the extent to which each household harvested the natural resources, observations
during the case study suggested that the per capita harvesting of natural resources is higher
for not poor households than is the case for poor households. This happens because high
income households that harvest natural resources use hired labour to harvest natural
resource such as grass cutting for thatch, firewood harvesting and river sand harvesting for
sale using movable capital such as tractors and trucks to transport these resources from the
communal areas to the market place. Conversely, the poor households used natural
resources for subsistence and relied on wheelbarrows for their transport. It would be useful
for future policy improvement to consider studies to determine the extent of natural
resource harvesting in relation to the level of income of households. Such research would
provide relevant information about addressing unsustainable natural resource harvesting,
emerging environmental problems and the high incidence of poverty.
Table 6: Cross tabulation of Household Head Poverty and the Dependence of Heads of Household
on Harvested Natural Resources Sales
Sale of Harvested Natural Resource
Household Head Poverty Status Total
Not Poor Poor
No
Count 214 89 303
% those without Natural Resource Harvest 70.6% 29.4% 100.0%
% within Household Head Poverty Status
91.5% 92.7% 91.8%
Yes Count 20 7 27
% those with Natural Resource Harvest 74.1% 25.9% 100.0%
% within Household Head Poverty Status
8.5% 7.3% 8.2%
Total Count 234 96 330
% of all 70.9% 29.1% 100.0%
% within Household Head Poverty Status
100.0% 100.0% 100.0%
Chi-Square Tests
Value df Asymp. Sig. (2-sided)
Pearson Chi-Square .143(b) 1 .706
N of Valid Cases 330
a Computed only for a 2x2 table, b 0 cells (.0%) have expected count less than 5. The minimum expected count is 7.85.
The agricultural sector remains an important stakeholder in poverty eradication in Botswana. Despite, declining trends of the incidence of poverty in Botswana, this problem remains more pronounced in rural areas than in any other part of country. The poor, especially in rural areas, depend for their daily livelihood on natural and environmental resources such as grazing lands, forests, water and soils for agriculture. The evidence from Table 5 is that a large majority of crop farming households grow crops for their own use. Hence agriculture is assumed to contribute significant amounts of own food production which do not go through the national accounts. Some of the outputs under own food

23
production that do not find their way into the national accounts include relish (morogowadinawa), watermelons, sweet reeds and others. Thus in terms of food availability, agriculture plays an important role for those who engage in it. The result of an examination of the main source of food for agricultural households in Botswana is presented in Figure 4, where food purchases are identified by 80 percent of all households surveyed as the main source. Own farm production and government ration were each identified by 10 percent of households.
Figure 7: Main source of food for agricultural households
Source: Author computed from CSO (2008a)
However, given that overall, it contributes less about 2 percent of GDP, and the large number of people who are believed to depend on it, the relative contribution of agriculture to household food security and ultimately poverty eradication is a subject that requires further research30.
Contribution to employment
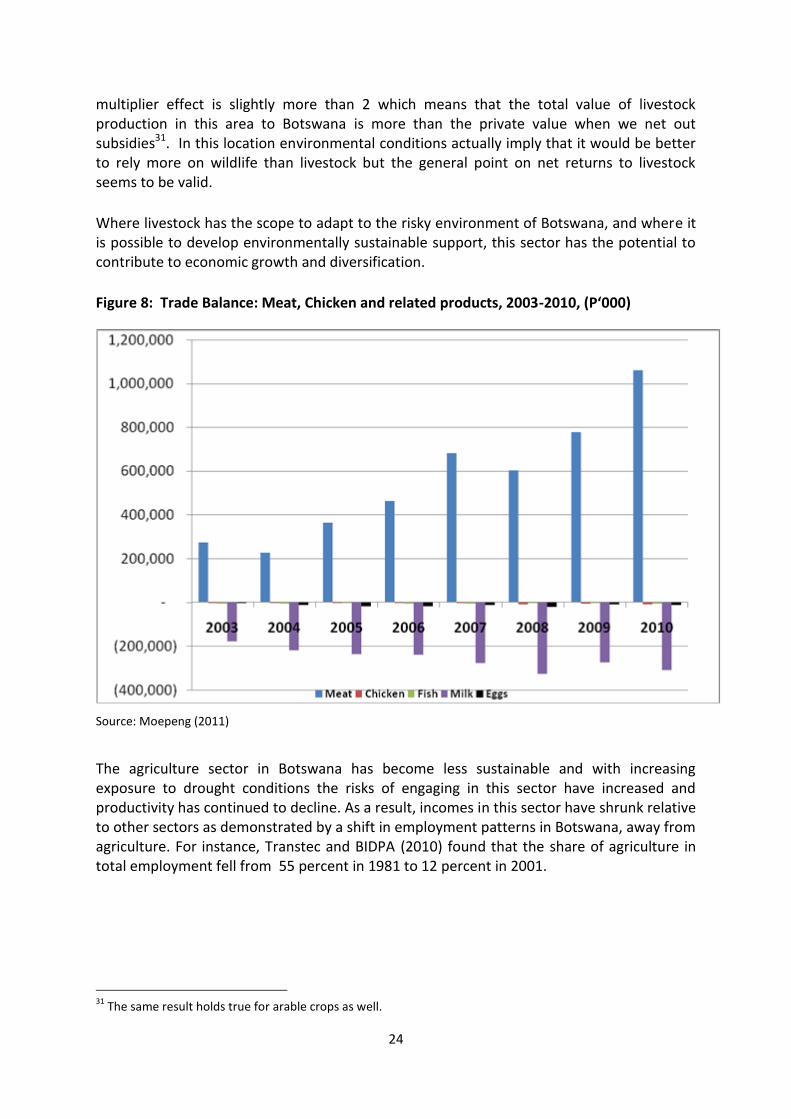
Despite declining numbers of cattle sold to BMC, the trade balance for meat continued to depict a positive trend over the years 2003 to 2010, while the trade balance for other agriculture products was negative (Figure 5). The observations of the performance of the agriculture sector using the trade balance data could imply that livestock is a globally competitive renewable natural resource that Botswana has. There are certainly linkages (such as leather production) that add value to the economy. However, whether the industry produces net economic benefits also depends on the extent of livestock subsidies and the environmental costs generated by localized over-grazing and water abstraction.
The analysis by Arntzen et al. (2010) for the Makgadikgadi Pans attempts to capture the effects of subsidies, environmental damage and multiplier effects from linkages with the rest of the economy. This found that the private value of livestock production should be reduced by roughly 50% to take account of subsidies and environmental costs. However, a significant proportion of the income generated from livestock production is spent in Botswana and this creates jobs (and further spending) in the broader economy. The
30
This research should be able to collect count data and test the significance of income from agriculture as a proportion of total household income.
24
multiplier effect is slightly more than 2 which means that the total value of livestock production in this area to Botswana is more than the private value when we net out subsidies31. In this location environmental conditions actually imply that it would be better to rely more on wildlife than livestock but the general point on net returns to livestock seems to be valid.
Where livestock has the scope to adapt to the risky environment of Botswana, and where it is possible to develop environmentally sustainable support, this sector has the potential to contribute to economic growth and diversification.
Figure 8: Trade Balance: Meat, Chicken and related products, 2003-2010, (P‘000)
Source: Moepeng (2011)
The agriculture sector in Botswana has become less sustainable and with increasing exposure to drought conditions the risks of engaging in this sector have increased and productivity has continued to decline. As a result, incomes in this sector have shrunk relative to other sectors as demonstrated by a shift in employment patterns in Botswana, away from agriculture. For instance, Transtec and BIDPA (2010) found that the share of agriculture in total employment fell from 55 percent in 1981 to 12 percent in 2001.
31
The same result holds true for arable crops as well.

25
Table 7: Number of Employees and Share of Employment by Sector for the Period 1981 to
2001
Sector
Number of Employees Share of Employment
1981 1991 2001 1981 1991 2001
Agriculture 153,956 97,626 55,300 55.4 25.70 12.31
Mining & Quarrying 11,178 13,336 13,099 4.0 3.51 2.92
Manufacturing 4,385 27,548 38,968 1.58 7.25 8.67
Construction 17,056 58,050 58,572 6.14 15.28 13.04
Wholesale & Retail 13,520 35,194 61,108 4.87 9.26 13.60
Transport & Communication 5,493 11,495 15,213 1.98 3.03 3.39
Health services 2,163 7,565 14,039 0.78 1.99 3.13
Education 5,544 23,220 37,839 2.00 6.11 8.42
Other Services 63,818 96,381 151,837 22.97 25.37 33.80
Not Stated 715 9,523 3,260 0.26 2.51 0.73
Total 277,828 379,938 449,235 100 100 100
Source: Adopted from TRANSTEC and BIDPA (2010)
However, the share of manufacturing, construction, wholesale and retail, and education, as is that for other services grew by at least more than 5 percent. A majority of employees in the agriculture sector , 63 percent, were employed at lands/cattle post, 14 percent were self employed without employees, 13 percent were in paid employment, 9 percent were self employed with employees while 1 percent were in family business. Given the nature of the livestock sector, very few people are employed and the benefit of this employment by gender could be a subject for further research. Most likely, employment in this sector is biased to males and this could exacerbate rural poverty which is most prevalent among females (Moepeng 2010).
Contribution of Agriculture to Household Income
Agriculture’s contribution to household income is generally mentioned as one of the least important sectors (Wikan 2001; Moepeng 2010). Figure 6 shows the relative frequency with which heads of households in a study of rural poverty based in a case study of Nshakashogwe in the Tutume Sub-district of the Central District (Moepeng and Tisdell 2009).

26
Figure 9: Relative Frequency with which Heads of Household Mention Different Sources
(by Type of their Income)32
56
54
45
26
15
9
8
0 10 20 30 40 50 60
Employment
Private Transfers
Govt Transfers
Livestock
Homebusiness
Crops
Natural resources
Relative Frequency (%) of Source of Household Income
Source: Moepeng and Tisdell (2009).
Results from this rural poverty survey, Figure 6, show that more than 50 per cent of all heads of household obtained some income from paid employment, approximately 26 per cent of households kept livestock while 15 per cent of heads were engaged in home businesses. Less than 10 per cent of all the heads of household were engaged in crop production. Some of the reasons for a small proportion of households engaged in crop production include loss of labour to out-migration, and drought. Less than 10 per cent of heads of household were engaged in natural resource harvesting. A different study carried by Botswana Government also revealed similar results in the importance of agriculture as a source of household income for agricultural households (CSO, 2008a). Natural resource harvesting is labour intensive, and if the young and able people have migrated to non-rural areas, may not be very attractive to those who remain in the village. Limited use of natural resources in rural areas of Botswana might also imply that such resources are now difficult to find and the results of environmentally unsustainable production and harvesting of resources are now visible. Thus rural households must adapt to more sustainable management of their natural resources and encourage adoption of technologies that will benefit from emerging opportunities availed by rapid urbanization such as waste water availability and potential for rainwater harvesting to increase productivity in the agriculture sector and ultimately the share of household income from this sector.
32
Crops excludes the value of gains from subsistence that are not included in the national accounts..

27
In Botswana agricultural activities are not main sources of income for households, including in rural areas, and they less frequently contribute to household income. This observation is valid despite an acknowledgement based on high participation rates of beneficiaries of government input support programmes that a large proportion of households are engaged in agricultural production. Thus the effects of unsustainable production and use of natural resources in this sector, and the problems of the effects of climate change such as recurring droughts have reduced the role of agriculture sector as a significant contributor to household income (cash and food) and therefore limiting the role of this sector in contributing to poverty eradication. There is a need to reconsider the role and importance of agriculture to food availability, taste and quality, food pricing and nutrition and access and how Botswana should respond to problems of climate change to improve productivity of this sector. Improved productivity and growth in agriculture can result in immediate and significant progress to economic growth, poverty eradication and improved social welfare (Motalvo and Ravallion, 2010; Bresciani and Valdes, 2007). Thirtle et al. (2001) found that a 1 percent increase in agricultural productivity reduced the proportion of those below a dollar a day by between 0.6 and 1.3 percent. So clearly it is important to seek improvement in this area. However, in Botswana, farmers face the twin limiting factors of water (common to other semi-arid areas) and very limited access to low cost labour (reflecting urbanisation, Ipelegeng, out-migration, cultural factors and the impact of AIDS)33. This suggests that new approaches to agriculture are needed.
2.4 Agriculture and the Environment
Natural Resource Degradation Issues in Agriculture
Communal land ownership, a widely practiced property rights system in agricultural production of Botswana, is an important provider of insurance for the poor because it guarantees many of them a last resort source of food and grazing opportunities. However, with increasing concentration of population in formal settlements, the introduction of markets and improved communication technologies, there is observed widespread unsustainable use of natural resources around settlements to a radius of up to 20km (Fidzani 2001). As a result the rural poor are now exposed to higher insecurity now than ever before because of problems of overgrazing in the areas surrounding settlement which results in very low productivity of the livestock sector and eventual impoverishment of small holder livestock owners.
The soil types of Botswana and their suitability to agriculture
About two thirds of the country is covered by sandy soils which are infertile. These are the red and grey desert soils on the Kalahari sands. Further in the eastern part there is a moderately dry red loamy mokata soil on the plains, or mixed chalky and sandy chawana soils, with brownish rocky seloko soils on and around hills. Various types of vegetation cover 33In addition to the effects of urban job opportunities pulling young people out of rural areas, Bationo et al (2011) identify Botswana as having lost 23% of the agricultural workforce to AIDS.

28
much of the country. These include grassland, natural woodland, forestland, savannah types, bush land, aquatic (wetlands) and man-made plantations (GoB, 2007). Vegetation resources play an important role in livestock farming and wildlife industries by their contribution to the national economy and well being of the citizens.
Various governance and policy instruments that can be used to improve the sustainable management of soils in Botswana
Studies carried out in Botswana show that land degradation is high and causing concern for the government. Thus, soil conservation is the way the government has taken to combat soil degradation. In actual fact, the government introduced the National Conservation Strategy (NCS) in 1990 (Darkoh, 2002) and Soil Conservation section of the Ministry of Agriculture was established in 200634 (Mokgwathi, 2008) to primarily address issues of soil erosion, declining soil fertility and increasing degradation of range and forest land. The Section is responsible for soil conservation and performs the following functions;
1. Develop and implement policies, strategies and programmes to combat land
degradation. 2. Promote adherence to national legislation, protocols, treaties and conventions on
land degradation. 3. Develop community based land management programmes. 4. Establish networks and collaboration both national and international on land
conservation and rehabilitation technologies. 5. Strengthen national programmes to combat desertification. 6. Develop and strengthen sand dune stabilization programmes.
Moreover, there are a number of efforts by communities to combat desertification.
34
Notwithstanding the time of establishing this section, soil conservation activities existed long before 2006
including earlier attempts to deal with gulley erosion etc.

29
The importance of subsidies; and impact on the land/soil quality and the environment
Over the past 30 years Botswana has used substantial amount of capital different Agricultural programmes such as the Accelerated Rainfed Arable Programme (ARAP), Arable Land Development Programme (ALDEP) and others. Regardless of all these interventions these programs have not significantly improved the food security situation in the country (Figure 7).
Figure 10: Trends in total production relative to demand (1979-2004)
0
20000
40000
60000
80000
100000
120000
140000
160000
180000
200000
Cereal demand
Production
Source: CSO (Various)
On the 30th June 2008, ALDEP III was terminated and replaced with Integrated Support Programme for Arable Agriculture Development (ISPAAD) to address challenges facing arable farmers and the inherent low productivity of the arable sub sector. It was envisaged that the performance of the arable sub-sector would be greatly improved by establishing Agricultural Service Centres and assisting arable farmers to acquire requisite inputs and draught power to undertake tillage operations. The components of the Integrated Support Programme for Arable Agriculture Development include; Cluster Fencing, Provision of Potable Water, Provision of Seeds, Provision of Fertilizers, Facilitation of access to Credit, Establishment of Agricultural Service Centres and Draught Power Provision (Parida and Moalafhi 2008). ISPAAD also has a Horticulture Component that provides input and equipment grants (MoA pers.com 22 May 2012). Input support of the ISPAAD horticulture component includes support of up to 60 per cent grants for purchase of fertilizer, seeds, seedlings and pesticides. Equipment grant support includes purchase of shade nets, reservoirs, piping equipment and irrigation equipment such as drip irrigation equipment.

30
Trends of Crop Purchases in Tonnes by BAMB35 from 1995 to 2008
Figure 11 depicts trends in crop purchased by BAMB for the period 1995-2008. Sorghum, a drought tolerant crop, is the dominant crop purchased by BAMB in Botswana throughout the years and other crops such as maize constitute a small proportion of crops sold to BAMB. This observation could demonstrate the scarcity of water resource in Botswana, and that efforts need to be considered to improve water availability and access to improve agricultural productivity. The continued decline is maize purchased by BAMB could be attributed to declining maize production as a result of problems of climate change observed through unreliable rainfalls and prolonged droughts. Alternative methods and technologies that promote water storage and access should be the basis for improving patterns of natural resource management and use on the achievement of Botswana’s development priorities. Figure 11: Trends of Crop Purchases by BAMB (tonnes) for the Period 1995 to 2008
Source: CSO (2011)
Impact of Agricultural Subsidies on the Environment
The problems of climate change, environmental externalities and the important role of the agricultural sector to the eradication of poverty, GDP and sustainable natural resource management has attracted attention of government support. There is abundant evidence that where available, input price subsidies/taxes and output price subsidies/ taxes will promote intensification of production processes (Lingard, 2002). As has been the case in Botswana, agricultural input subsidies increase the exploitation of natural resources and sometimes lead to unsustainable use of natural resources. For instance, the loan schemes supporting purchase of livestock for keeping in communal lands that are already overgrazed around settlements tend to exacerbate the problems of overgrazing and diminish the productive potential of those rangelands.
Following lack of grazing and desertification, the poor might tend to adopt desperate means of survival and begin to overharvest the fuel wood for sale as energy, overharvest other veld products that are available such as phane caterpillar to unsustainable levels and in some cases engage in illegal mining of riversand which can be detrimental to the environment and ecosystems. In association with this changing farmer/land user behavior will be different
35
Botswana Agricultural Marketing Board

31
patterns of environmental impacts having both local and wider implications; that is, the environmental impacts will be felt at local, river catchment, regional and global levels. Examples include nonpoint pollution effects of agricultural activity, water quality and sedimentation, and the global effects due to the carbon balances of agriculture. There is some ambiguity about the role of subsidies and environmental change; subsidies by changing price signals may lead farmers to substitute polluting inputs for non-polluting ones, or to change from production processes which give low emissions (e.g., cereals and sheep) to those giving high emissions (e.g., dairy cows) (Lingard, 2002).
Most of the empirical work or analysis of the environmental and economic impacts of agricultural subsidies is exceptionally complex, but many are undeniably damaging, for example, the practice in forested tropical countries of providing cash incentives for clearing forest land for agriculture and livestock production. Likewise, subsidies to irrigation water, in the form of less than full-cost recovery pricing, encourage over-use of scarce water, and hence, water logging and soil salinization. In contrast, a subsidy to promote and encourage kerosene consumption may be environmentally beneficial if it reduces the demand for fuel wood and deforestation. Deciding which subsidies are, or are not, environmentally benign is extremely hazardous. Boldly stated, agricultural subsidies can encourage the production of environmentally harmful pollution, lead to the excessive use of natural resources and often impose high costs on consumers, taxpayers and government budgets (OECD, 1998; Lingard, 2002 ). However, in a country like Botswana where poverty incidence is highest in rural areas, support for agricultural activities is a necessary but not sufficient meant to reduce or eradicate poverty. Many poor people use agriculture as a fall back option and indeed it is socially more acceptable to provide government transfers through a productive activity than feed the poor when they have nothing to do to benefit from government hand out. Policy dealing with poverty eradication is most effective when it avoids the development of a dependency syndrome of a society.
2.5 The Economic Costs of Natural Resource Degradation
Continued land degradation in Botswana as a result of climate change and increasing unsustainable use of the natural resources has continued to exacerbate problems of increased depreciation of the stock of natural capital. More than half of Botswana is covered with the Kalahari Desert sand which has poor water retention capacity, low nutrient levels, and low organic matter and is marginally productive. Despite that most arable farming practiced in the eastern part of the country where soils are relatively more fertile soils than the other parts, very little technologies are adopted and nearly no fertilization is practiced to regenerate the soils. Therefore, overtime land degradation has become a stern environmental problem, especially in the eastern parts as a result of climate change, increased number of livestock, overgrazing, tree-felling, inappropriate farming techniques and, mining activities. Botswana is also experiencing increasing health costs in mining town of SelibePhikwe as a result of negative impacts from mining operations that include high levels of emissions

32
(especially sulphur dioxide emissions), and risks to human and animal life as a result of unused mining sites, which have not been rehabilitated. In 2004, the level of pH, total dissolved solids, sulphates and nickel exceeded allowable concentrations although later reviews found that contamination had fallen within acceptable levels except for nitrate and sulphate levels (University of Gothenburg, 2008). Thus, for the poor, the cost of environmental degradation has been disproportionately higher in terms of lost production as a result of poor health related to polluted atmospheric air, loss of bread winners and household income, loss of production as a result of increasing fragile lands and in some cases loss of productive land beyond possibility of repair and renewal. For the most part it affects the rural poor as it reduces the productivity of soils, reduces ground water recharge due to increased runoffs and results in the replacement of perennial grasses with grasses of low nutrient value which contributes to high livestock mortality in periods of droughts.
The Outmigration of labour
Natural resource degradation in Botswana has led to labour resource redistribution in favor of urban areas (the modern sector) where the marginal product of labour is higher than in rural areas (Taylor 2001).The costs of outmigration of labour from rural areas to urban areas has been increased unemployment in the formal sector because the urban areas are not able to absorb increasing numbers of people looking for jobs. At the same time, there is increasing lack of labour in the agricultural sector of Botswana as many young people in the labour force migrate to urban areas. The effects of outmigration from agriculture sector in Botswana is similar to those of brain drain or human capital flight as people who remain in agricultural production are less educated, are older and mostly women who are also looking after young children and the sick (Moepeng 2010). Thus there is shortage of labour during cultivation, weeding and harvesting times. The costs of these to sustainable natural resource management has been lowering productivity of the agricultural sector, and hence stagnant or declining wages relative to increasing prices of goods and services and a failure of the agricultural sector to effectively contribute to poverty eradication in rural areas36. Thus, the opportunity cost of migration to modern sector jobs by young able bodied people is the loss of net income from labour-based agricultural production such as crop production. Further research is recommended to consider the per capita benefits from crop sales by income status of households in rural areas of Botswana and to identify the costs and benefits from the expanded use of foreign migrant labour in this sector.
The role of Ipelegeng and agriculture productivity
In response to problems of high unemployment, particularly among the youth in rural areas, Botswana has introduced government interventions such as Labour Intensive Relief Public Works Programme (LIRPWP) or Ipelegeng37 to serve as a vehicle that creates temporary employment and income transfers. The cost on this government intervention on agricultural productivity has been very high because instead of complementing the Agricultural
36
Agriculture is therefore typically seen as a fall-back option and an element of a multi-pronged ‘livelihood strategy’ in the rural areas. 37
Note that although the focus of Ipelegeng is officially on “short term employment support and relief”, Ipelegeng is a continuous programme and people can be engaged in it anywhere in the country. Hence some rotate with the jobs in the different areas and hence can be engaged continuously.

33
programmes, the intervention draws away poor farmers and agricultural labour from the risky agricultural pursuit to more certain, though minimal, reward from working in the LIRPWP. In some extremes, some farmers could cultivate their lands through the ISPAAD programme and then join Ipelegeng programme, leaving the fields un-weeded and not harvested. Hence, government intervention is a negative cost to agricultural productivity because it could motivate households to migrate and leave farming operations as agriculture labour is provided with equally or competitive employment reward opportunity.
Climate Change and its impact on agriculture
The wellbeing of the people, economy’s performance, and the condition of the environment in Botswana are all very closely linked to the climate. Government of Botswana (2001) already acknowledges that the country is “highly vulnerable to climate change” due to its fragile ecosystems and (semi-) aridity. Yet climate change is most likely to add to existing stresses in Botswana and cause significant changes in prevalent vegetation and rangeland cover, and affect species types, composition and distribution, as well as those depending on them. The major threats arising from these climate change problems are the high costs of unsustainable use of rangelands, agriculture land, harvesting of, woodlands/forests, water resources and pollution of the environment through emitting of gasses that are contaminate the atmospheric air quality. Desertification is a major concern to Botswana and water scarcity and land degradation are most likely to have negative impacts on GDP, poverty, health and food production (Boko, et.al, 2007). Already, the costs of different basic natural resources are rising in Botswana including water, river sand, and others. On the other hand changes in climate are likely to shock Botswana’s ecosystems, especially the Okavango Delta, with a probable negative impact on tourism as well as livelihood opportunities for the peoples residing in the area especially the CBNRM Organizations. Climate change impacts are expected to increase over years and decades to come, which will constitute a threat to development and diminish the chances of achieving the MDGs. Further work is needed to answer questions of whether Botswana is growing the right crops, and if ISPAAD provides the right seeds, or whether available water is used to its best competitive advantage.
2.6 Agricultural policy and opportunities for technology adoption
Agricultural policy in Botswana has concentrated in input support of draft power and seed distribution; and the human resource development, especially for focusing on agricultural extension. But despite extensive subsidies to support both arable and animal production, productivity in this sector have been highly affected by scarce water resources as a result of poor rains due to recurring drought and lack of labour in this sector. Lucrative livestock sector and the biotechnology adoption support programmes, development of boreholes, prevention and control of animal diseases through boundary or cordon fences, building of modern abattoirs, and providing support services have led to expansion into marginal and fragile lands. The livestock ownership is however considered to be positively associated with incomes. Therefore, support for this sector among others, serves to widen income

34
inequality which is already high in the country and has limited contribution to poverty eradication because it is not a labour intensive sector.
Despite continued climate change problems which manifest as recurring drought, changing rainfall patterns and advent of diseases the rapid urbanization of the country has brought with it the growth of waste water resources that can be utilized for irrigation especially in commercial urban agriculture. In Figure 9, current capacity of treatment plants, amounts of waste water inflow and outflow a day are illustrated. Gaborone, Francistown and the Central Districts have relatively large design capacity to collect at least 10,000 m3/day. Nearly all the treatment plants in the three areas collect more than 50 percent of their capacity. However, there is limited amount of outflow and this study’s consultations with different stakeholders, including the Department of Waste Water Resources and the Department of Crop Production do not suggest a larger proportion of the available waste water is put for productive use in agriculture. This is a new opportunity for addressing problems of water scarcity and the other is the need to consider rainwater harvesting to complement the unreliable rainwater sources and promote sustainable natural resource management.
Figure 12: Availability of Waste Water Resources by Treatment Plants by Design capacity,
Inflow and Outflow in m3/day by Districts
0
10,000
20,000
30,000
40,000
50,000
60,000
Design capacity
Inflow
Outflow
Source:DWMP (2012).
Promotion of urban agriculture in Botswana is consistent with the changing demographic patterns in Botswana as today more than 60 percent of the population is in cities and urban villages. Urban agriculture, including horticulture is very critical in promoting nutritional support and food security. In addition, women also participate in the formal sector business using the urban agriculture products and are able to earn income to support their households and escape poverty. Availability of waste water and the development of institutions and infrastructure required to distribute such water would contribute highly to economic growth and poverty eradication. Further, when the promotion of this agricultural opportunity occurs, there is also need to consider the introduction of land markets to

35
provide incentives for those who have skills and not land in the accessible areas to where waste water is produced, to enter this market.
Another way of helping agriculture adapt to climate change is to use rainwater harvesting.
Botswana has experience in this area summarized by Kumanti (undated) as follows:
“Construction of rainwater tanks in schools, clinics and administration buildings.
These tanks utilize the large roof surface areas of the roof blocks. The water is then
used by the kids in washing their dishes after eating.
Ministry of agriculture conducted a program assisting farmers in constructing
rainwater tanks country wide. The initial objective of this program was to provide
water for draught animals to allow for early ploughing. People however went on and
used the harvested water for drinking and other domestic purposes
Ministry of agriculture have also embarked on the construction of earth multi
purpose dams for livestock watering.
Rural Industries Innovation Center (RIIC), a multidisciplinary organization involved in
research and development of technology, pioneered a project in Zutshwa Kgalagadi.
In this project, brick tanks were constructed to collect run-off from the pan. This
water is used for small stock watering”. p7
There is considerable scope to use water collected in this way for low-cost drip-irrigation. Excellent overviews are provided by Andersson (2005) - for rural South Africa; Awulachew et al (2009) for generic use in Africa and Alabama A&M and Auburn Universities (2009) for the southern USA.

36
3 The Scope of Tourism and Agriculture to Contribute to Poverty
Eradication in Botswana: Some Conclusions
Cross-cutting themes
Botswana faces increasing water scarcity from the combination of rising demand from
urbanization and declining supply as a result of climate change. This threatens to
undermine the potential for peri-urban agriculture (horticulture in particular) and wildlife-
tourism to make a sustainable contribution to poverty eradication.
Solutions to these problems have been developed by other countries facing similar
pressures. They lie in managing water demand (through pricing that reflects the cost of
supply) and using innovative ways to improve supply (such as rainwater harvesting and re-
use of treated waste water). Government has recognized these in various policy documents
but an overarching and strategic focus on this issue is urgently required.
Agriculture
In contrast with every other major sector of the economy, there has been no growth in the
Agriculture sector since the mid-1970s. Current data on subsistence production is
unavailable (and should be collected and published) but data on cash sales of livestock
(accounting for more than 50% of agricultural GDP) and crops (around 5%) shows the
negative impact of drought, desertification, and increases in veterinary diseases, pests and
insect infestation – often described as climate change phenomena. Within agricultural GDP,
the share of livestock has fallen from approximately 75% to 55% (1994-2011) with the
expansion mainly of horticulture from approximately 22% to 42% over this period.
Results from Moepeng and Tisdell (2009) show that more than 50 per cent of all heads of
household obtained some income from paid employment, approximately 26 per cent of
households kept livestock while 15 per cent of heads were engaged in home businesses.
Less than 10 per cent of all the heads of household were engaged in cash crop production
but the large majority of crop farming households grow crops for their own use. This is
often a component of their livelihood strategy and government support to this sector (e.g.
ISPAAD) is widely used. As arable agriculture is typically a “last resort” and those that can
migrate or access other employment do so, policy support to this sector could well be pro-
poor although this has not been rigorously evaluated.
Policy interventions in this sector have certainly had some unintended consequences. In
response to problems of high unemployment, particularly among the youth in rural areas,
Botswana has introduced government interventions such as Labour Intensive Relief Public

37
Works Programme (LIRPWP) or Ipelegeng to serve as a vehicle that creates temporary
employment and income transfers. Unfortunately, instead of complementing the
agricultural programmes, the intervention tends to draw away poor farmers and agricultural
labour from the risky agricultural pursuit to more certain, though minimal, reward from
working in the LIRPWP. In some extremes, some farmers could cultivate their lands through
the ISPAAD programme and then join Ipelegeng programme, leaving the fields un-weeded
and not harvested.
In Botswana, farmers face the twin limiting factors of water (common to other semi-arid
areas) and very limited access to low cost labour (reflecting urbanisation, Ipelegeng, out-
migration, cultural factors and the impact of AIDS). This suggests that new approaches to
agriculture are needed. Further research is recommended to consider the per capita
benefits from crop sales by income status of households in rural areas of Botswana and to
identify the costs and benefits from the expanded use of foreign migrant labour in this
sector.
Communal land ownership, a widely practiced property rights system in agricultural
production of Botswana, is an important provider of insurance for the poor because it
guarantees many of them a last resort source of food and grazing opportunities. However,
with increasing concentration of population in formal settlements, the introduction of
markets and improved communication technologies, there is observed widespread
unsustainable use of natural resources around settlements to a radius of up to 20km
(Fidzani 2001). As a result the rural poor are now exposed to higher insecurity now than
ever before because of problems of overgrazing in the areas surrounding settlement which
results in very low productivity of the livestock sector and eventual impoverishment of small
holder livestock owners.
The wellbeing of the people, economy’s performance, and the condition of the environment
in Botswana are all very closely linked to the climate. Government of Botswana (2001)
already acknowledges that the country is “highly vulnerable to climate change” due to its
fragile ecosystems and (semi-) aridity. Yet climate change is most likely to add to existing
stresses in Botswana and cause significant changes in prevalent vegetation and rangeland
cover, and affect species types, composition and distribution, as well as those depending on
them. The major threats arising from these climate change problems are the high costs of
unsustainable use of rangelands, agriculture land, harvesting of, woodlands/forests, water
resources and pollution of the environment through emitting of gasses that are contaminate
the atmospheric air quality.
Desertification is a major concern to Botswana and water scarcity and land degradation are
most likely to have negative impacts on GDP, poverty, health and food production (Boko,
et.al, 2007). Further work is needed to answer questions of whether Botswana is growing
38
the right crops, and if ISPAAD provides the right seeds, or whether available water is used to
its best competitive advantage.
One way of helping agriculture adapt to climate change is to use rainwater harvesting. The
experience of Botswana in this area appears to be mainly for livestock watering. In
Tanzania, rainwater harvesting has been used in semi-arid areas to significantly improve
grain yields, particularly in low-rainfall years. However, this is labour intensive and we have
already seen that there is a serious labour shortage in Botswana agriculture. The most
promising opportunity is likely to be using rainwater harvesting with drip irrigation for
horticulture. The Botswana Technology Centre (BoTec) has considerable experience with
rainwater capture and it is strongly recommended that this is brought together with low-
cost drip irrigation solutions that have been successfully used in South Africa and elsewhere.
Although urbanization is increasing the demand for water in Botswana it also offers the
chance of using secondary treated waste water for irrigation. There is potential both to
increase horticultural production and to generate new livelihood opportunities. For this
reason we focus on this as a case-study which is produced as a stand-alone document.
Tourism
As foreign visitor spending accounts for 70.6% of direct tourism impact according to WTTC
(2012) and that at least a third of foreign visitor spending is nature-related, tourism related
to Botswana’s natural environment directly accounts for a minimum of 4,190 jobs and 0.6%
of GDP (around 1000 million Pula each year). No data exists on how much domestic tourism
is nature-based but taking account of the indirect and induced spending that results from
nature-related foreign visits, the total financial value of tourism related to Botswana’s
natural environment could account for as many as 5870 jobs and 1.0% of GDP (some 1700
million Pula each year).
International evidence suggests that tourism has reduced the incidence of poverty in Costa
Rica by between 1.4% and 3%. This is in a middle-income country that relies on tourism for
significantly more of its GDP than does Botswana (13% Vs 6.5%). So while we can expect
tourism to contribute to poverty eradication in Botswana it clearly can only provide one part
of the solution.
Nonetheless, the share of tourism employment in total employment is forecast to grow by
4.2% each year between 2012 and 2022. This might even be an underestimate as there is
scope for Botswana to more effectively target tourism from rapidly growing Asian
economies and Russia. In any event, this employment growth depends on attracting
foreign leisure visitors to Botswana’s natural environment which is in competition with
many other countries. We concur with Leechor and Fabricius (2005) that “Botswana’s major
tourism asset is its incredible wildlife resources. Similar wildlife experiences are only to be
found in Southern and Eastern Africa and as such Botswana’s potential competitors are
located within the region”. They provide a convincing argument that “Botswana’s African
39
wilderness status and icons are clearly the brand assets that differentiate the destination
from its competitors. The Okavango Delta, the elephants of the Chobe and the San culture
are highly marketable brand icons that contribute to the mystique and celebrity status of
the destination. Consequently, sustainable natural resource management is essential to
realize this projected growth and to maintain employment benefits over time.
Imported goods from tourism indirect spending (one component of leakage) cost Botswana
1,100 million Pula which is 54.5% of all estimated indirect and induced spending in the
tourism domestic supply chain. In South Africa, the comparable leakage figure is 10.8%. We
find there are a number of opportunities to add value to nature-based tourism that will
reduce leakages. By keeping a higher proportion of total tourism spending in local areas this
is expected to make the contribution of tourism spending to poverty eradication more
effective. These opportunities include:
Building supply relationships between lodges and local producers of fresh produce as
well as, soaps and shampoos, basket making, weaving and letoisi products (made
from local design, although cloth / material is imported).
Increasing opportunities for visitors to gain an understanding of traditional culture.
In many African countries, tourism offerings include “traditional food and dance
evenings”. This approach can simply be a way of offering tourists an additional
experience within a standard “enclave tourism” format in which few benefits are
retained locally. However, it can be provided within the CBNRM context e.g. the
Shandereka Cultural Village next to the Kaziikini community campsite. Other
examples could include kgotla storytelling evenings with local meals.
New tourism activities that build on bush craft skills and cultural tourism activities
from industrialised countries. A good example is the international “fashion” for
cookery using local wild foods. Although this can be an additional offering within
enclave tourism, the opportunity of participating and learning makes this type of
tourism well suited to CBNRM and eco-tourism. So, for example, while one of the
most successful CBNRM operations – Kaziikini campsite – provides restaurant meals,
they use mainly imported ingredients rather than the fresh veld food such as
mushrooms their guides point out to tourists.
Encouraging tourism beyond the Okavango Delta and Chobe. The San interpretation
of the natural wilderness provides a unique opportunity for cultural tourism
provided this is carefully managed with the communities concerned. Other types of
eco-tourism such as avi-tourism also provide important opportunities for
diversification.
CBNRM provides the greatest potential for nature-based tourism to contribute to poverty
eradication and for this reason we have focused on a successful example of CBNRM in a
stand-alone case study. However, to realize the potential of CBNRM more generally,
changes are required in a number of areas including:

40
Strengthening CBO governance to ensure that poor communities as a whole rather
than a small number of Board members gain from CBNRM. Top-down regulation by
central government is not an effective way of dealing with varying local conditions.
Local MEWT staff play a critical role in supervising CBOs but to be effective they
need to have community-level work as a major component of their job description
and they need to be based in the community for a significant proportion of their
time.
Government support for capacity building. On a positive note, GoB has expressed
interest in facilitating a better institutional architecture for CBNRM including for
support, oversight and marketing. MEWT has established a National Environmental
Fund which will have a CBNRM window for funding projects. Against these very
positive developments we note a tendency for Government to take a top-down
approach to CBNRM in which a lack of consultation can lead to serious unintended
consequences. The ban on hunting in a 25-kilometer radius around Protected Areas
and the requirement of all CBNRM hunting to be replaced by photographic tourism
(without taking into account the variation in local opportunities to do this) is an
example.
Developing a clear strategy for CBNRM development that demonstrates linkages to
improved governance, resilience to climate change and poverty eradication. Donor
partners have been fairly significant supporters of the CBOs engaged in CBNRM and
further support will be more achievable if such a strategy is in place.
Mentoring for CBO businesses from private companies in sectors such as mining,
financial services and manufacturing. This relationship might aim to build specific
organisational capacity or achieve business plan goals as well as providing an
informal “sounding board”.
Nature-based tourism can only make a sustained contribution to poverty eradication if it is
itself sustainable. The 2008 Okavango Delta Management Plan (ODMP) captures many of
the issues relevant to nature-based tourism noting:
There has been minimal or no sustained research on tourism carrying capacities;
There is little done to monitor tourism activities; and that
The issues with regard to wildlife use include human-elephant conflict, wildlife-livestock conflicts, declining population of certain species, and lack of baseline information on certain species.
Economic incentives generated by CBNRM play a part in addressing some of these issues.
That is to say, communities that benefit significantly from CBRNRM will be far more willing
to invest in wildlife-friendly solutions to human-wildlife conflict.

41
More generally, the evidence suggests that climate change represents a serious threat to
wildlife-based tourism in Botswana. One problem is the projected increase in extreme
climatic events such as floods or droughts - and the direct impact these have on tourism
income. In addition Moswete and Dube (2011) identify that a number of interactive factors,
among which are drought, fires, habitat fragmentation and encroachment and poaching,
have contributed to wildlife population decline. The increased likelihood of drought in
Botswana as a result of climate change will result in further declines in wildlife numbers.
Although there is need to diversify away from dependence on nature-based to more
inclusive forms of tourism such as cultural tourism, there are also interventions that help
adapt to climate change. For example, transboundary parks that make it easier for animals
to migrate; fewer subsidies for livestock in areas where water is needed for wildlife; water
pricing that reflects economic costs; and waste water re-use and rainwater harvesting that
makes the most of increasingly scarce water resources.

42
References
Alabama A&M and Auburn Universities (2009), Rainwater Harvesting for Irrigation Water, Alabama Cooperative Extension System, accessed at: http://www.aces.edu/pubs/docs/U/UNP-0026/UNP-0026.pdf
Andersson L., (2005), Low cost drip-irrigation: on farm application in South Africa, Master’s Thesis, Lulea University of Technology, accessed at: http://epubl.ltu.se/1402-1617/2005/151/LTU-EX-05151-SE.pdf
Awulachew, S.B., Lemperiere, P., and T. Tulu (2009), Irrigation methods: Drip irrigation— Options for smallholders, Module 5 – Part II in Training manual on agricultural water management. IWMI (International Water Management Institute), Addis Ababa, Ethiopia, ILRI (International Livestock Research Institute), Nairobi, Kenya and Adama University, Adama, Ethiopia, accessed at: http://cgspace.cgiar.org/bitstream/handle/10568/80/Modules1_5.pdf?sequence=6
Jaap Arntzen, Jon Barnes, Jane Turpie, Peter Ruthenberg and Tshepo Setlhogile (2010), Centre for Applied Research and Department of Environmental Affairs, Makgadikgadi Framework Management Plan Chapter 2, Volume 2, technical reports, Gaborone.
Ashley, C and Mitchell J., (2005), Can tourism accelerate pro-poor growth in Africa? , ODI Opinions 60, ODI, London, accessed at: http://www.odi.org.uk/opinion/docs/738.pdf
Blake, A., J. S. Arbache, M. T. Sinclair and V. Teles (2008), ‘Tourism and Poverty Relief’, Annals of Tourism Research , 35(1):107-126
Boko, M., I. Niang, A. Nyong, C. Vogel, A. Githeko, M. Medany, B. Osman-Elasha, R. Tabo and P. Yanda, 2007: “Africa”. Climate Change 2007: Impacts, Adaptation and Vulnerability. Contribution of Working Group II to the Fourth Assessment Report of the Intergovernmental Panel on Climate Change, M.L. Parry, O.F. Canziani, J.P. Palutikof, P.J. van der Linden and C.E. Hanson, Eds., Cambridge University Press, Cambridge UK, 433-467.
CEPAL (2007), Turismo y Condiciones Sociales en Centroamérica: Las Experiencias en Costa Rica y Nicaragua, NACIONES UNIDAS COMISIÓN ECONÓMICA PARA AMÉRICA LATINA Y EL CARIBE – UN CEPAL
Cornia, G. A., T. Addison, et al. (2004). Income Distribution Changes and their Impact in the Post-Second World War Period.Inequality, Growth, and Poverty in an Era of Liberalization and Globalisation. G. A. Cornia. Oxford, Oxford University Press.
Fidzani, N. H. (2001). Property Rights and Their Effects on the Livestock Sector in Botswana.Environmental Economics Unit Working Paper. Goteborg; Goteborg University
Johnson, S. (2009). State of CBNRM Report 2009. Botswana National CBNRM Forum, Gaborone, Botswana.
Kumanti A., (undated), Rain Water Harvesting for Rural Water Supply, Botec, Gaborone, Botswana

43
Leechor and Fabricas (2005), DEVELOPING TOURISM IN BOTSWANA : PROGRESSAND CHALLENGES, background study to the World Bank-BIDPA Botswana Export Diversification Study, accessed at: http://www.bidpa.bw/docs/archive/Economic%20Diversification/TheTourismSector.pdf
McCulloch, G., (2010), Centre for Applied Research and Department of Environmental Affairs, Makgadikgadi Framework Management Plan, Chapter 4, Volume 2, technical reports, Gaborone
Mbaiwa, J. (2004),The Success and Sustainability of Community-Based Natural Resource Management in the Okavango Delta, Botswana, South African Geographical Journal (2004) 86 (1) 44-53
Mbaiwa, J. (2005), Enclave tourism and its socio-economic impacts in the Okavango Delta, Botswana, Tourism Management 2005 Vol. 26 No. 2 pp. 157-172
Mbaiwa, J. (2011a), CBNRM in Botswana: Status Report of 2010, Maun, Okavango Research Institute
Mbaiwa, J. (2011b), CBNRM STOCKTAKING IN BOTSWANA, USAID
Mill, R. C., (2002), The Tourism System. Kendall/Hunt Publishing Company
Millington, K., McEwen, D., Libreros, M., and J. Heym (2007), BOTSWANA STRENGTHENING TOURISM STATISTICS AND FORMULATION OF AN EXPERIMENTAL TSA - 2005/2006, UNWTO
Ministry of Finance and Development Planning (2008).Drought and Household Food Security Outlook. Gaborone, Government Printer
Mitchell and Ashley (2007), “Can tourism offer pro-poor pathways to prosperity? Examining evidence on the impact of tourism on poverty.”Briefing Paper 22.Overseas Development institute, London
Moepeng, P. (2011) Achieving food security in semi-arid Botswana and the emerging economic challenges of 21st century . (Unpublished)
Moepeng, P. (2010). Rural Poverty in Botswana Saarbrücken, Germany, Lambert Academic Publishing.
Moepeng, P. and C. Tisdell (2009). Associations between Poverty and Socio-economic Variables in a typical Tswana Rural Village: New Insights Labour and Sustainable Development. M. S. Gupta. New Delhi India, Serial Publications.
Parida, B. P. and D. B. Moalafhi (2008)."Regional rainfall frequency analysis for Botswana using L-Moments and radial basis function network."Physics and Chemistry of theEarth: 7.
Rojas, L. (2009), Evolución e Importancia del Turismo en Costa Rica. San José: Estado de la Nación en Desarrollo Sostenible
Seleka, T. B. (2005). "Challenges of Agricultural Diversification in Botswana under the Proposed SADC-EU Economic Partnership Agreement (EPA)."BIDPA Working Paper 27.
Seychelles Tourism Master Plan: Facts and Findings, 2011, Seychelles Tourism Board
Smith, C. & P. Jenner 1992. The leakage of foreign exchange earnings from tourism. Travel & Tourism, Analyst No 3: 52-66. Economist Intelligence Unit, London

44
Steck, B., K. Wood, and J. Bishop (2010): Tourism: More Value for Zanzibar. Value Chain Analysis. SNV, VSO, ZATI
Stiglitz, Joseph E. (1987). "Principal and agent, The New Palgrave: A Dictionary of Economics, v. 3, pp. 966-71
TEEB (2010), The Economics of Ecosystems and Biodiversity: Ecological and Economic Foundations, edited by Pushpam Kumar, 2010, London and Washington: Earthscan
Taylor, S. (2001). Business Statistics. London, Antony Rowe Ltd.
Transtec and BIDPA (2010).Botswana Agricultural Sector Review. Gaborone, Bidpa.
TPRG (2009): The Application of Value Chain Analysis to measure Economic Benefits at TanjongPiai, Pontian, and Johor. Tourism Planning Research Group.UniversitiTeknologiMalysia
Jane Turpie, Jon Barnes, Jaap Arntzen, Bertha Nherera, Glenn-Marie Lange, and Baleseng Buzwani (2006), ECONOMIC VALUE OF THE OKAVANGO DELTA, BOTSWANA, and implications for management, IUCN and Ministry of Environment Water and Transport, Botswana
UNEP (2011), Tourism: Investing in Energy and Resource Efficiency chapter in Towards a Green Economy: Pathways to Sustainable Development and Poverty Eradication, accessed at www.unep.org/greeneconomy
UNWTO (2004), Tourism and Poverty Alleviation: Recommendations for Action. Madrid: World Tourism Organization
Wells, M. (1997): “Economic Perspectives on Nature Tourism, Conservation and Development.” Environment Department Papers 55. The World Bank
Wikan, G. (2001). Cash, crops and cattle.A study of rural livelihoods in Botswana.Holland, Norway, HerdmarkCollege. 7.
WTTC (2012), Tourism& Travel Economic Impacts, Botswana
Yaron, G. (2010), Consolidating Communal Land Conservations in Namibia Case Study: a report to WWF-UK, Godalming, WWF-UK
Yaron, G., Moepeng, P, Makepe, P, Mmopelwa D, Mookodi L and R Lekobane (2012), A Study of the Contribution of Sustainable Natural Resource Management to Economic Growth, Poverty Eradication and Achievement of NDP 10 Goals: Discussion Paper for UNEP-UNDP PEI, Bidpa and GY Associates