section i - idph i site-specific cancer ... county count rate lci uci count rate lci uci count rate...
TRANSCRIPT

I-1
SECTION I
Site-specific Cancer Incidence Rates by County
Illinois, 2001-2005

I-2
Cancer Incidence Counts and Age-adjusted Rates by County and Sex
All Races, All Sites, Illinois, 2001-2005 Figures include invasive cancer and bladder cancer in situ. Incidence counts are five-year totals. Rates are per 100,000 age-adjusted to the 2000 U.S. standard million population. Lower confidence intervals (LCI) and upper confidence intervals (UCI) are 95 percent for rates, Tiwari method. DATA SOURCE: Illinois Department of Public Health, Illinois State Cancer Registry, data as of November 2007
Both Sexes Males Females County Count Rate LCI UCI Count Rate LCI UCI Count Rate LCI UCIIllinois 302,060 487.4 485.7 489.1 154,249 580.1 577.1 583.0 147,811 426.8 424.6 429.0 Adams 2,068 487.1 465.8 509.1 1,134 609.5 574.4 646.3 934 402.6 376.0 430.7 Alexander 300 532.7 473.4 597.7 164 685.0 584.0 798.7 136 428.9 357.6 511.3 Bond 521 530.4 485.6 578.3 276 627.8 555.3 707.1 245 488.7 427.7 556.2 Boone 991 467.6 438.8 497.8 512 540.9 493.8 591.1 479 424.4 387.1 464.2 Brown 158 475.1 403.3 556.2 95 611.3 492.0 750.2 63 372.1 282.7 483.1 Bureau 1,149 510.9 481.2 542.1 596 602.2 554.6 652.9 553 453.9 415.1 495.6 Calhoun 175 511.1 436.4 595.9 94 558.8 450.4 687.6 81 483.5 379.0 609.7 Carroll 578 512.6 470.8 557.5 296 566.7 503.5 636.2 282 472.9 417.0 534.9 Cass 395 490.9 443.1 542.5 200 568.5 492.1 653.4 195 454.7 391.1 526.1 Champaign 3,741 505.6 489.5 522.2 1,991 617.9 590.8 646.0 1,750 426.7 406.7 447.4 Christian 1,230 569.2 537.5 602.5 677 722.0 668.5 778.7 553 470.2 430.2 513.1 Clark 520 485.8 444.3 530.3 292 623.0 553.3 699.3 228 390.7 339.9 447.5 Clay 494 531.5 484.4 582.2 281 696.4 617.0 783.5 213 416.6 359.1 481.3 Clinton 897 451.0 421.8 481.7 493 565.4 516.3 618.0 404 374.3 337.9 413.7 Coles 1,381 527.2 499.4 556.0 712 633.3 587.4 681.8 669 463.7 428.2 501.5 Cook 121,656 475.4 472.7 478.1 61,014 567.8 563.2 572.3 60,642 416.4 413.1 419.7 Crawford 595 483.9 445.5 524.9 316 571.3 509.9 638.1 279 430.3 379.4 486.5 Cumberland 350 536.6 481.3 596.8 182 638.5 548.6 739.1 168 478.3 406.7 559.4 DeKalb 1,845 494.9 472.4 518.1 933 576.8 539.8 615.4 912 448.3 419.3 478.7 DeWitt 499 502.4 458.9 549.2 263 597.4 527.1 674.8 236 444.7 388.1 507.6 Douglas 575 498.3 458.0 541.4 284 563.0 499.1 632.8 291 462.0 408.7 520.5 DuPage 19,795 469.4 462.8 476.1 9,733 542.0 530.9 553.3 10,062 424.6 416.2 433.0 Edgar 580 473.2 434.6 514.4 301 576.9 513.4 646.2 279 403.3 354.5 457.3 Edwards 210 467.1 404.8 537.0 118 571.8 472.7 686.7 92 389.7 310.2 484.7 Effingham 940 505.8 473.8 539.4 530 657.6 602.6 716.1 410 405.0 366.0 447.2 Fayette 593 472.6 435.0 512.6 324 580.9 519.1 648.0 269 407.2 358.3 461.2 Ford 457 498.8 452.8 548.4 237 605.2 530.4 688.1 220 436.8 377.4 503.3 Franklin 1,364 532.0 503.6 561.7 731 657.5 610.4 707.5 633 450.2 414.3 488.5 Fulton 1,256 515.6 487.0 545.6 678 620.1 574.2 668.9 578 446.9 409.6 487.0 Gallatin 244 587.2 513.4 669.2 128 683.6 567.4 817.9 116 509.3 416.5 618.3 Greene 476 530.6 483.1 581.8 244 609.7 535.2 691.9 232 475.0 413.4 543.7 Grundy 1,066 539.0 507.0 572.5 554 627.9 575.9 683.2 512 473.0 432.6 516.2 Hamilton 230 395.9 345.2 452.6 140 538.0 452.0 636.6 90 302.9 241.0 376.9 Hancock 629 482.3 444.6 522.6 355 620.6 557.5 689.4 274 394.5 347.1 446.9 Hardin 179 548.0 469.8 636.8 109 724.0 592.7 878.2 70 395.8 307.1 505.8 Henderson 240 448.9 393.4 510.9 136 556.8 465.4 662.1 104 373.1 303.5 455.5 Henry 1,525 488.7 464.2 514.3 793 580.0 540.1 622.1 732 431.0 399.4 464.6 Iroquois 933 464.0 434.1 495.6 508 562.4 514.3 613.9 425 392.0 353.9 433.4 Jackson 1,187 472.9 446.2 500.8 636 583.0 538.2 630.4 551 396.8 363.6 432.2 Jasper 279 463.2 409.8 521.9 158 577.7 491.0 675.8 121 373.4 308.1 449.2 Jefferson 1,180 505.3 476.6 535.3 644 620.4 573.2 670.4 536 423.4 387.3 462.3

I-3
Cancer Incidence Counts and Age-adjusted Rates by County and Sex All Races, All Sites, Illinois, 2001-2005
Figures include invasive cancer and bladder cancer in situ. Incidence counts are five-year totals. Rates are per 100,000 age-adjusted to the 2000 U.S. standard million population. Lower confidence intervals (LCI) and upper confidence intervals (UCI) are 95 percent for rates, Tiwari method. DATA SOURCE: Illinois Department of Public Health, Illinois State Cancer Registry, data as of November 2007
Both Sexes Males Females County Count Rate LCI UCI Count Rate LCI UCI Count Rate LCI UCIJersey 547 441.6 405.2 480.5 276 508.2 449.5 572.5 271 402.0 354.7 454.0 Jo Daviess 740 483.0 448.2 519.9 389 529.9 478.1 586.3 351 448.3 401.0 500.2 Johnson 387 545.5 492.2 603.3 211 612.0 530.8 702.3 176 513.2 438.4 597.8 Kane 8,509 492.0 481.4 502.8 4,301 573.3 555.4 591.6 4,208 436.2 423.0 449.8 Kankakee 2,877 529.5 510.3 549.3 1,551 652.7 620.3 686.4 1,326 442.8 419.1 467.6 Kendall 1,375 507.6 480.4 535.8 675 562.3 518.5 608.6 700 470.1 435.4 506.7 Knox 1,681 488.3 464.9 512.7 849 558.2 521.2 597.2 832 444.5 413.5 477.4 Lake 13,786 494.0 485.6 502.5 6,861 555.3 541.5 569.3 6,925 452.9 442.2 463.8 LaSalle 3,488 523.0 505.6 540.9 1,834 623.8 595.5 653.0 1,654 455.8 433.3 479.1 Lawrence 501 486.0 443.3 532.0 247 554.8 487.5 629.0 254 446.9 390.1 510.1 Lee 1,051 519.9 488.8 552.5 543 590.3 541.5 642.3 508 476.4 435.2 520.7 Livingston 1,115 496.3 467.3 526.7 580 596.2 548.6 646.8 535 429.1 392.4 468.4 Logan 885 514.1 480.5 549.6 475 635.5 579.5 695.5 410 430.5 388.6 475.9 McDonough 779 473.7 440.2 509.2 383 539.1 486.2 596.4 396 440.0 395.3 488.5 McHenry 5,769 497.9 484.8 511.2 2,929 575.6 553.8 598.1 2,840 444.7 428.2 461.5 McLean 3,313 512.2 494.8 530.1 1,711 619.7 590.1 650.4 1,602 439.9 418.4 462.2 Macon 3,716 564.9 546.7 583.5 1,967 688.1 657.8 719.4 1,749 486.1 463.0 510.0 Macoupin 1,593 528.6 502.6 555.6 855 636.7 594.7 681.1 738 450.0 417.0 485.1 Madison 7,066 493.6 482.1 505.2 3,638 590.5 571.3 610.1 3,428 431.1 416.6 446.0 Marion 1,401 557.7 528.4 588.2 714 657.9 610.4 708.3 687 492.1 454.5 532.0 Marshall 453 519.0 471.4 570.5 250 630.9 554.9 715.1 203 442.5 380.9 512.0 Mason 555 556.9 510.8 606.2 312 677.9 604.4 758.3 243 465.1 406.4 530.2 Massac 440 460.5 417.7 506.7 235 573.0 501.8 651.6 205 389.2 335.5 449.6 Menard 350 506.7 454.5 563.4 192 622.6 536.4 718.8 158 418.6 354.8 491.0 Mercer 524 507.6 464.5 553.7 277 572.0 506.2 644.4 247 457.4 400.7 520.2 Monroe 778 497.8 463.3 534.1 402 589.8 532.8 651.1 376 432.2 389.1 479.0 Montgomery 918 502.1 469.6 536.3 479 596.0 543.7 651.9 439 442.7 400.3 488.6 Morgan 1,030 484.3 454.9 515.2 529 575.4 527.2 626.9 501 430.3 392.3 471.3 Moultrie 439 484.3 439.0 533.2 227 580.8 507.4 662.1 212 436.3 376.7 503.0 Ogle 1,336 467.4 442.6 493.3 707 541.1 501.7 582.8 629 414.2 382.2 448.3 Peoria 5,316 535.5 521.1 550.2 2,684 630.8 607.0 655.2 2,632 475.7 457.3 494.6 Perry 631 472.4 436.0 511.2 345 586.8 526.3 652.3 286 406.5 358.8 459.1 Piatt 495 496.6 453.4 543.1 278 611.8 541.5 689.1 217 405.3 351.6 465.3 Pike 515 444.6 405.7 486.4 265 512.9 452.5 579.5 250 404.0 352.4 461.7 Pope 80 273.5 215.8 343.6 47 340.3 248.1 458.8 33 215.3 146.8 309.7 Pulaski 191 461.5 397.5 533.2 115 642.2 529.5 772.2 76 322.9 252.3 408.1 Putnam 203 530.9 459.8 610.7 113 623.1 512.6 751.8 90 459.8 367.9 569.3 Randolph 888 463.9 433.6 495.9 495 586.5 535.8 640.8 393 385.9 347.0 428.2 Richland 474 458.8 417.7 503.2 292 650.9 577.9 730.8 182 326.6 278.8 380.9 Rock Island 4,250 495.1 480.2 510.4 2,190 579.3 555.2 604.2 2,060 436.2 417.1 456.0 St Clair 6,691 513.7 501.4 526.2 3,391 620.6 599.7 642.0 3,300 444.1 429.0 459.7 Saline 850 487.0 454.2 521.7 463 637.0 580.1 698.2 387 391.5 351.5 435.1 Sangamon 5,436 525.0 511.0 539.2 2,799 643.3 619.4 667.8 2,637 451.5 434.3 469.4

I-4
Cancer Incidence Counts and Age-adjusted Rates by County and Sex All Races, All Sites, Illinois, 2001-2005
Figures include invasive cancer and bladder cancer in situ. Incidence counts are five-year totals. Rates are per 100,000 age-adjusted to the 2000 U.S. standard million population. Lower confidence intervals (LCI) and upper confidence intervals (UCI) are 95 percent for rates, Tiwari method. DATA SOURCE: Illinois Department of Public Health, Illinois State Cancer Registry, data as of November 2007
Both Sexes Males Females County Count Rate LCI UCI Count Rate LCI UCI Count Rate LCI UCISchuyler 200 413.0 356.5 476.6 99 462.8 375.4 565.7 101 383.4 309.6 471.6 Scott 159 477.6 405.3 559.7 70 461.0 358.7 584.3 89 519.4 414.8 643.3 Shelby 675 454.7 420.5 491.1 387 574.4 518.4 635.1 288 367.9 324.8 415.4 Stark 204 492.0 424.6 567.6 103 555.7 452.7 676.6 101 464.5 372.9 573.1 Stephenson 1,355 450.6 426.6 475.7 680 526.2 487.3 567.6 675 401.6 370.8 434.5 Tazewell 4,003 536.3 519.8 553.3 2,135 639.7 612.7 667.6 1,868 466.0 444.8 488.0 Union 503 435.3 397.4 476.0 288 557.6 494.5 626.8 215 337.6 292.1 388.6 Vermilion 2,492 504.7 484.9 525.1 1,286 588.6 556.7 621.9 1,206 450.5 424.7 477.4 Wabash 359 469.6 421.5 521.8 191 561.9 484.8 648.1 168 408.4 346.9 478.1 Warren 538 486.8 445.9 530.7 279 574.6 508.8 646.9 259 429.3 376.7 487.6 Washington 481 527.8 481.1 578.0 255 608.3 535.7 688.4 226 475.7 414.1 544.4 Wayne 537 469.4 429.6 512.1 276 560.5 495.9 631.5 261 418.3 366.4 476.1 White 499 464.3 423.2 508.6 265 551.3 486.5 623.0 234 406.2 352.6 466.4 Whiteside 1,717 470.5 448.3 493.6 882 543.8 508.4 581.1 835 416.8 388.1 447.1 Will 11,496 509.6 500.1 519.3 6,040 616.7 600.3 633.4 5,456 434.6 423.0 446.4 Williamson 1,909 500.8 478.3 524.0 990 591.4 554.9 629.7 919 439.7 410.9 470.2 Winnebago 7,053 478.7 467.5 490.0 3,566 554.1 535.9 572.8 3,487 429.0 414.8 443.7 Woodford 977 475.4 445.6 506.7 519 575.7 526.8 628.0 458 412.3 374.3 453.3

I-5
Cancer Incidence Counts and Age-adjusted Rates by County and Sex
Whites, All Sites, Illinois, 2001-2005 Figures include invasive cancer and bladder cancer in situ. Incidence counts are five-year totals. Rates are per 100,000 age-adjusted to the 2000 U.S. standard million population. Lower confidence intervals (LCI) and upper confidence intervals (UCI) are 95 percent for rates, Tiwari method. DATA SOURCE: Illinois Department of Public Health, Illinois State Cancer Registry, data as of November 2007
Both Sexes Males Females County Count Rate LCI UCI Count Rate LCI UCI Count Rate LCI UCI Illinois 253,800 482.9 481.1 484.8 129,076 567.1 564.0 570.3 124,724 428.9 426.5 431.3 Champaign 3,337 505.8 488.7 523.3 1,771 612.0 583.6 641.4 1,566 431.2 409.9 453.4 Cook 86,399 467.2 464.1 470.4 43,090 547.0 541.8 552.2 43,309 418.4 414.4 422.4 DuPage 18,232 477.0 470.1 484.1 8,947 549.7 538.1 561.6 9,285 432.8 424.0 441.9 Kane 7,874 485.5 474.6 496.6 3,954 561.0 542.8 579.6 3,920 434.1 420.5 448.1 Kankakee 2,504 520.8 500.5 541.7 1,341 636.3 602.4 671.6 1,163 441.5 416.1 468.1 Lake 12,447 492.6 483.9 501.5 6,157 547.5 533.3 562.0 6,290 456.7 445.4 468.2 Macon 3,356 563.6 544.4 583.3 1,760 674.1 642.7 706.6 1,596 494.4 469.7 520.3 Madison 6,623 489.2 477.4 501.2 3,405 582.0 562.5 602.1 3,218 429.7 414.7 445.0 Peoria 4,628 520.4 505.3 535.8 2,320 606.1 581.6 631.5 2,308 467.6 448.1 487.8 Rock Island 3,828 473.3 458.2 488.7 1,914 538.0 514.1 562.8 1,914 429.8 410.2 450.2 St Clair 5,007 499.8 486.0 513.9 2,541 592.6 569.6 616.2 2,466 440.6 423.1 458.7 Sangamon 5,029 522.5 508.1 537.2 2,584 635.9 611.4 661.1 2,445 452.1 434.1 470.8 Vermilion 2,271 494.7 474.3 515.8 1,160 571.4 538.8 605.5 1,111 444.6 418.0 472.5 Will 10,175 504.2 494.3 514.3 5,293 601.2 584.3 618.5 4,882 436.8 424.5 449.4 Winnebago 6,369 470.7 459.2 482.5 3,196 538.8 520.2 558.0 3,173 427.0 412.1 442.4
Cancer Incidence Counts and Age-adjusted Rates by County and Sex Blacks, All Sites, Illinois, 2001-2005
Figures include invasive cancer and bladder cancer in situ. Incidence counts are five-year totals. Rates are per 100,000 age-adjusted to the 2000 U.S. standard million population. Lower confidence intervals (LCI) and upper confidence intervals (UCI) are 95 percent for rates, Tiwari method. DATA SOURCE: Illinois Department of Public Health, Illinois State Cancer Registry, data as of November 2007
Both Sexes Males Females County Count Rate LCI UCI Count Rate LCI UCI Count Rate LCI UCIIllinois 38,250 512.2 507.0 517.5 19,497 647.8 638.3 657.3 18,753 424.8 418.7 430.9 Champaign 333 575.7 513.3 642.9 187 831.8 702.7 975.1 146 427.3 359.6 503.1 Cook 30,210 510.5 504.7 516.4 15,244 645.4 634.8 656.0 14,966 424.0 417.2 430.9 DuPage 368 456.0 397.5 519.8 174 528.0 424.4 646.3 194 405.3 336.5 482.8 Kane 369 578.1 512.3 649.2 195 747.5 623.0 886.7 174 473.3 397.9 557.5 Kankakee 337 579.4 518.0 645.6 182 726.1 620.9 842.7 155 468.3 396.6 548.5 Lake 693 486.3 448.8 525.9 358 583.4 517.9 654.2 335 419.3 373.9 468.3 Macon 328 545.5 486.9 608.9 189 808.6 691.4 938.8 139 378.9 317.8 447.8 Madison 344 505.1 452.4 561.8 167 616.0 522.5 720.2 177 432.7 370.5 501.8 Peoria 547 593.6 542.9 647.4 273 739.2 648.5 837.8 274 501.4 442.1 566.1 Rock Island 199 466.9 402.2 538.4 112 556.5 451.8 677.1 87 387.1 309.0 478.0 St Clair 1,566 546.9 519.9 574.8 779 688.3 639.5 739.6 787 456.5 425.0 489.6 Sangamon 322 514.6 458.2 575.7 173 704.8 595.8 826.2 149 396.8 334.5 466.6 Vermilion 185 595.4 511.9 687.8 102 754.2 611.6 917.3 83 493.7 392.4 611.9 Will 892 506.4 470.5 544.1 487 660.7 594.6 731.3 405 396.2 355.7 439.7 Winnebago 529 526.0 480.2 574.8 290 700.4 616.3 791.8 239 406.8 355.3 463.3

I-6
Cancer Incidence Counts and Age-adjusted Rates by County and Sex
Hispanics, All Sites, Illinois, 2001-2005 Figures include invasive cancer and bladder cancer in situ. Incidence counts are five-year totals. Rates are per 100,000 age-adjusted to the 2000 U.S. standard million population. Lower confidence intervals (LCI) and upper confidence intervals (UCI) are 95 percent for rates, Tiwari method. DATA SOURCE: Illinois Department of Public Health, Illinois State Cancer Registry, data as of November 2007
Both Sexes Males Females County Count Rate LCI UCI Count Rate LCI UCI Count Rate LCI UCI Illinois 12,986 353.5 346.5 360.6 6,422 398.4 386.9 410.2 6,564 323.1 314.3 332.0 Cook 8,949 341.0 333.0 349.2 4,466 388.4 375.0 402.0 4,483 308.0 298.0 318.2 DuPage 774 442.0 405.4 480.5 388 499.2 439.4 563.8 386 401.4 356.4 450.0 Kane 676 322.0 291.3 354.6 310 343.6 296.0 395.7 366 315.6 275.1 359.9 Lake 611 320.9 289.9 353.9 284 352.4 301.0 409.0 327 306.1 267.7 347.9 Will 512 401.7 361.5 444.7 258 465.1 398.0 538.8 254 356.4 307.7 410.0
Cancer Incidence Counts and Age-adjusted Rates by County and Sex Non-Hispanics, All Sites, Illinois, 2001-2005
Figures include invasive cancer and bladder cancer in situ. Incidence counts are five-year totals. Rates are per 100,000 age-adjusted to the 2000 U.S. standard million population. Lower confidence intervals (LCI) and upper confidence intervals (UCI) are 95 percent for rates, Tiwari method. DATA SOURCE: Illinois Department of Public Health, Illinois State Cancer Registry, data as of November 2007
Both Sexes Males Females County Count Rate LCI UCI Count Rate LCI UCI Count Rate LCI UCI Illinois 289,074 496.4 494.6 498.2 147,827 592.0 589.0 595.1 141,247 433.5 431.2 435.8 Cook 112,707 491.3 488.4 494.2 56,548 589.7 584.8 594.6 56,159 428.2 424.6 431.7 DuPage 19,021 472.1 465.3 478.9 9,345 544.8 533.4 556.3 9,676 427.1 418.5 435.8 Kane 7,833 511.1 499.7 522.7 3,991 600.8 581.6 620.5 3,842 448.4 434.2 463.0 Lake 13,175 505.9 497.2 514.8 6,577 569.1 554.9 583.7 6,598 462.8 451.6 474.2 Will 10,984 515.4 505.6 525.4 5,782 625.2 608.4 642.5 5,202 438.2 426.3 450.4

I-7
Cancer Incidence Counts and Age-adjusted Rates by County and Sex
All Races, Oral Cavity and Pharynx, 2001-2005 Figures include invasive cancer. Incidence rates are five-year totals. Rates are per 100,000 age-adjusted to the 2000 U.S. standard million population. Lower confidence intervals (LCI) and upper confidence intervals (UCI) are 95 percent for rates, Tiwari method. DATA SOURCE: Illinois Department of Public Health, Illinois State Cancer Registry, data as of November 2007
Both Sexes Males Females County Count Rate LCI UCI Count Rate LCI UCI Count Rate LCI UCI Illinois 6,647 10.6 10.4 10.9 4,579 16.2 15.7 16.7 2,068 6.0 5.7 6.3 Adams 56 13.5 10.1 17.7 34 18.6 12.9 26.2 22 9.6 5.9 14.9 Alexander 7 12.4 4.9 26.3 7 29.4 11.8 60.8 0 0.0 0.0 15.6 Bond 7 7.7 3.1 15.9 5 9.8 3.2 23.5 2 4.8 0.6 17.5 Boone 23 10.8 6.8 16.2 16 15.8 9.0 25.8 7 6.4 2.6 13.1 Brown 4 9.7 2.6 26.8 3 17.4 3.0 54.1 1 3.0 0.1 33.9 Bureau 22 10.4 6.5 15.9 15 15.0 8.4 25.0 7 6.5 2.6 13.7 Calhoun 8 22.4 9.5 46.6 6 36.1 13.0 82.7 2 9.6 1.1 43.9 Carroll 17 18.4 10.6 30.0 11 23.6 11.6 43.1 6 13.5 4.7 30.5 Cass 5 6.4 2.0 15.3 2 6.1 0.7 21.7 3 6.4 1.3 20.4 Champaign 81 10.9 8.6 13.5 56 16.7 12.5 21.6 25 5.9 3.8 8.7 Christian 25 12.2 7.9 18.2 16 17.0 9.7 27.7 9 8.4 3.8 16.4 Clark 16 14.3 8.1 23.9 11 23.4 11.6 42.4 5 7.8 2.4 20.2 Clay 13 15.8 8.4 27.4 8 20.8 9.0 41.5 5 10.6 3.4 26.1 Clinton 19 10.0 6.0 15.7 15 16.3 9.1 27.0 4 4.4 1.2 11.4 Coles 31 12.2 8.2 17.4 23 20.3 12.8 30.6 8 6.0 2.5 12.2 Cook 2,668 10.3 9.9 10.7 1,858 16.2 15.4 16.9 810 5.6 5.2 6.0 Crawford 10 8.8 4.2 16.5 7 12.8 5.2 26.7 3 5.6 1.1 17.2 Cumberland 4 7.2 1.9 18.4 3 11.6 2.3 33.9 1 2.5 0.1 17.1 DeKalb 44 11.7 8.5 15.7 23 13.3 8.4 19.9 21 10.3 6.3 15.7 DeWitt 11 11.9 5.9 21.6 10 22.0 10.5 41.0 1 2.0 0.1 12.2 Douglas 12 10.5 5.4 18.5 10 18.9 9.0 35.0 2 3.0 0.4 12.0 DuPage 416 9.6 8.7 10.6 272 14.0 12.3 15.9 144 6.1 5.2 7.2 Edgar 13 10.8 5.7 18.9 11 20.8 10.4 37.6 2 2.8 0.2 12.2 Edwards 3 6.5 1.3 20.8 2 9.5 1.1 37.6 1 4.1 0.1 27.9 Effingham 10 5.2 2.5 9.7 6 8.0 2.9 17.2 4 3.6 0.9 9.9 Fayette 14 11.8 6.4 19.9 9 15.3 7.0 29.3 5 8.6 2.7 20.7 Ford 4 4.8 1.3 12.8 3 7.7 1.6 23.2 1 2.3 0.1 14.1 Franklin 39 15.7 11.0 21.7 31 28.2 19.1 40.4 8 5.4 2.1 11.5 Fulton 17 7.0 4.0 11.4 13 11.8 6.3 20.4 4 3.3 0.8 9.1 Gallatin 2 5.3 0.6 20.6 1 6.8 0.2 37.6 1 4.4 0.1 30.8 Greene 10 11.5 5.5 21.6 6 14.7 5.4 32.7 4 9.3 2.5 24.7 Grundy 36 17.5 12.2 24.2 26 25.7 16.7 37.8 10 8.8 4.2 16.4 Hamilton 4 7.0 1.8 19.5 2 7.5 0.9 30.1 2 7.9 0.9 31.1 Hancock 14 10.9 5.9 18.8 10 18.0 8.6 33.8 4 4.6 1.2 13.9 Hardin 6 17.2 6.3 40.6 6 34.9 12.8 82.3 0 0.0 0.0 32.9 Henderson 6 11.3 4.1 26.0 4 17.1 4.5 46.5 2 7.3 0.9 30.0 Henry 40 13.6 9.7 18.7 26 18.5 12.1 27.3 14 8.5 4.5 14.7 Iroquois 21 10.7 6.6 16.6 13 14.1 7.5 24.5 8 7.5 3.2 15.6 Jackson 32 13.0 8.8 18.4 24 21.1 13.4 31.5 8 5.5 2.2 11.2 Jasper 4 6.2 1.7 16.9 1 3.9 0.1 22.2 3 7.3 1.5 25.1 Jefferson 26 11.5 7.5 16.9 17 15.9 9.2 25.6 9 7.2 3.2 14.3

I-8
Cancer Incidence Counts and Age-adjusted Rates by County and Sex All Races, Oral Cavity and Pharynx, 2001-2005
Figures include invasive cancer. Incidence rates are five-year totals. Rates are per 100,000 age-adjusted to the 2000 U.S. standard million population. Lower confidence intervals (LCI) and upper confidence intervals (UCI) are 95 percent for rates, Tiwari method. DATA SOURCE: Illinois Department of Public Health, Illinois State Cancer Registry, data as of November 2007
Both Sexes Males Females County Count Rate LCI UCI Count Rate LCI UCI Count Rate LCI UCI Jersey 16 12.7 7.3 20.9 12 21.2 10.9 37.4 4 5.4 1.4 15.0 Jo Daviess 18 11.4 6.7 18.5 11 14.9 7.3 27.6 7 7.8 3.1 17.6 Johnson 8 10.6 4.5 21.4 8 19.5 8.3 39.8 0 0.0 0.0 13.8 Kane 200 10.9 9.4 12.6 134 15.5 12.8 18.5 66 6.9 5.3 8.8 Kankakee 66 12.2 9.4 15.5 48 19.8 14.5 26.3 18 5.7 3.4 9.1 Kendall 39 14.0 9.9 19.3 25 20.2 12.7 30.3 14 9.2 5.0 15.5 Knox 41 11.8 8.5 16.2 25 15.9 10.3 23.6 16 7.5 4.1 12.7 Lake 306 10.4 9.3 11.7 210 15.0 12.9 17.3 96 6.5 5.3 8.0 LaSalle 75 11.7 9.2 14.7 49 16.7 12.4 22.1 26 7.4 4.8 11.0 Lawrence 9 9.2 4.0 18.1 7 15.8 6.3 33.2 2 5.6 0.7 19.9 Lee 29 14.5 9.7 21.0 21 22.6 14.0 34.8 8 7.5 3.2 15.1 Livingston 19 8.7 5.2 13.7 15 15.3 8.5 25.3 4 3.2 0.9 8.7 Logan 25 14.8 9.5 22.0 14 18.5 10.1 31.1 11 11.2 5.5 20.8 McDonough 16 11.2 6.3 18.4 11 16.2 8.0 29.2 5 7.2 2.3 16.9 McHenry 135 11.1 9.3 13.2 97 17.0 13.6 20.9 38 5.9 4.1 8.1 McLean 64 9.8 7.5 12.5 47 15.9 11.6 21.3 17 4.8 2.8 7.7 Macon 95 14.5 11.7 17.7 67 22.8 17.7 29.1 28 8.4 5.5 12.2 Macoupin 40 13.8 9.8 18.9 28 21.0 14.0 30.5 12 7.1 3.6 12.8 Madison 139 9.8 8.2 11.6 97 15.1 12.2 18.4 42 5.2 3.7 7.0 Marion 36 14.2 9.9 19.9 26 22.9 15.0 33.8 10 6.3 2.9 12.2 Marshall 6 7.2 2.6 16.3 4 10.4 2.8 27.7 2 4.6 0.6 18.8 Mason 12 11.9 6.1 21.3 9 18.9 8.6 36.8 3 5.6 1.1 17.9 Massac 11 12.4 6.1 22.6 8 19.9 8.6 39.7 3 4.8 0.9 16.5 Menard 3 4.0 0.8 12.4 3 8.3 1.7 25.7 0 0.0 0.0 12.0 Mercer 6 5.6 2.0 12.7 5 10.3 3.3 24.8 1 1.6 0.0 11.2 Monroe 17 10.7 6.2 17.2 11 16.5 8.1 29.7 6 6.4 2.3 14.5 Montgomery 17 9.6 5.6 15.6 10 12.6 6.0 23.2 7 7.1 2.8 15.5 Morgan 21 10.2 6.3 15.7 14 15.3 8.4 25.8 7 6.4 2.5 13.7 Moultrie 13 15.1 8.0 26.3 9 23.8 10.8 45.5 4 7.6 1.9 21.7 Ogle 40 13.9 9.9 19.0 31 22.7 15.4 32.4 9 6.3 2.8 12.0 Peoria 128 13.0 10.8 15.5 88 20.2 16.2 24.9 40 7.2 5.1 9.9 Perry 8 6.3 2.7 12.6 7 11.5 4.6 23.9 1 1.7 0.0 10.1 Piatt 8 7.7 3.3 15.7 4 9.4 2.5 24.6 4 7.1 1.9 19.6 Pike 13 13.0 6.7 22.9 10 20.4 9.7 38.2 3 7.1 1.4 21.0 Pope 1 3.2 0.1 23.6 1 6.6 0.2 47.7 0 0.0 0.0 38.7 Pulaski 4 9.2 2.5 24.7 2 10.9 1.3 40.8 2 6.9 0.8 30.5 Putnam 3 7.6 1.6 24.1 2 10.2 1.2 41.2 1 3.9 0.1 30.6 Randolph 15 8.2 4.6 13.7 14 15.5 8.5 26.2 1 0.5 0.0 5.4 Richland 8 7.6 3.2 15.5 6 13.5 4.9 30.0 2 2.8 0.3 13.0 Rock Island 99 11.8 9.5 14.4 56 14.6 11.0 19.1 43 9.7 7.0 13.2 St Clair 157 12.1 10.3 14.1 111 19.9 16.4 24.0 46 6.4 4.7 8.6 Saline 15 8.2 4.5 14.0 8 11.0 4.7 22.1 7 5.5 2.0 13.0 Sangamon 125 12.1 10.0 14.4 89 19.4 15.6 24.0 36 6.4 4.5 8.9

I-9
Cancer Incidence Counts and Age-adjusted Rates by County and Sex All Races, Oral Cavity and Pharynx, 2001-2005
Figures include invasive cancer. Incidence rates are five-year totals. Rates are per 100,000 age-adjusted to the 2000 U.S. standard million population. Lower confidence intervals (LCI) and upper confidence intervals (UCI) are 95 percent for rates, Tiwari method. DATA SOURCE: Illinois Department of Public Health, Illinois State Cancer Registry, data as of November 2007
Both Sexes Males Females County Count Rate LCI UCI Count Rate LCI UCI Count Rate LCI UCI Schuyler 5 10.1 3.1 25.8 4 21.5 5.8 56.1 1 3.3 0.1 26.2 Scott 4 11.4 3.1 30.9 4 25.1 6.8 66.9 0 0.0 0.0 26.3 Shelby 8 6.3 2.7 12.6 6 9.4 3.4 20.9 2 3.5 0.4 12.8 Stark 2 4.1 0.5 18.0 1 4.8 0.1 32.2 1 2.9 0.1 27.0 Stephenson 27 9.4 6.1 13.8 14 10.9 5.9 18.4 13 7.9 4.1 14.0 Tazewell 53 7.3 5.5 9.6 35 10.3 7.2 14.4 18 4.5 2.6 7.2 Union 19 17.6 10.5 27.8 13 25.1 13.3 43.6 6 11.0 4.0 24.7 Vermilion 58 12.3 9.3 16.0 44 20.9 15.2 28.1 14 5.2 2.8 9.0 Wabash 6 8.2 3.0 18.3 4 11.4 3.1 30.0 2 6.1 0.7 22.2 Warren 8 7.2 3.1 14.7 7 14.0 5.6 29.6 1 1.3 0.0 9.9 Washington 6 6.7 2.4 15.1 2 4.6 0.6 17.6 4 8.7 2.2 23.6 Wayne 5 4.6 1.5 11.3 4 7.7 2.1 20.9 1 2.1 0.1 12.5 White 4 3.8 1.0 10.6 2 4.4 0.5 17.2 2 3.2 0.4 14.5 Whiteside 39 10.6 7.5 14.6 25 15.3 9.9 22.7 14 6.5 3.5 11.3 Will 251 10.2 9.0 11.6 177 15.4 13.1 18.0 74 5.8 4.5 7.3 Williamson 45 12.1 8.8 16.3 33 19.6 13.5 27.7 12 5.8 3.0 10.5 Winnebago 189 12.7 11.0 14.7 122 18.1 15.0 21.7 67 8.0 6.2 10.2 Woodford 12 5.8 3.0 10.4 6 6.5 2.3 14.3 6 5.0 1.8 11.5
I-10
Cancer Incidence Counts and Age-adjusted Rates by County and Sex
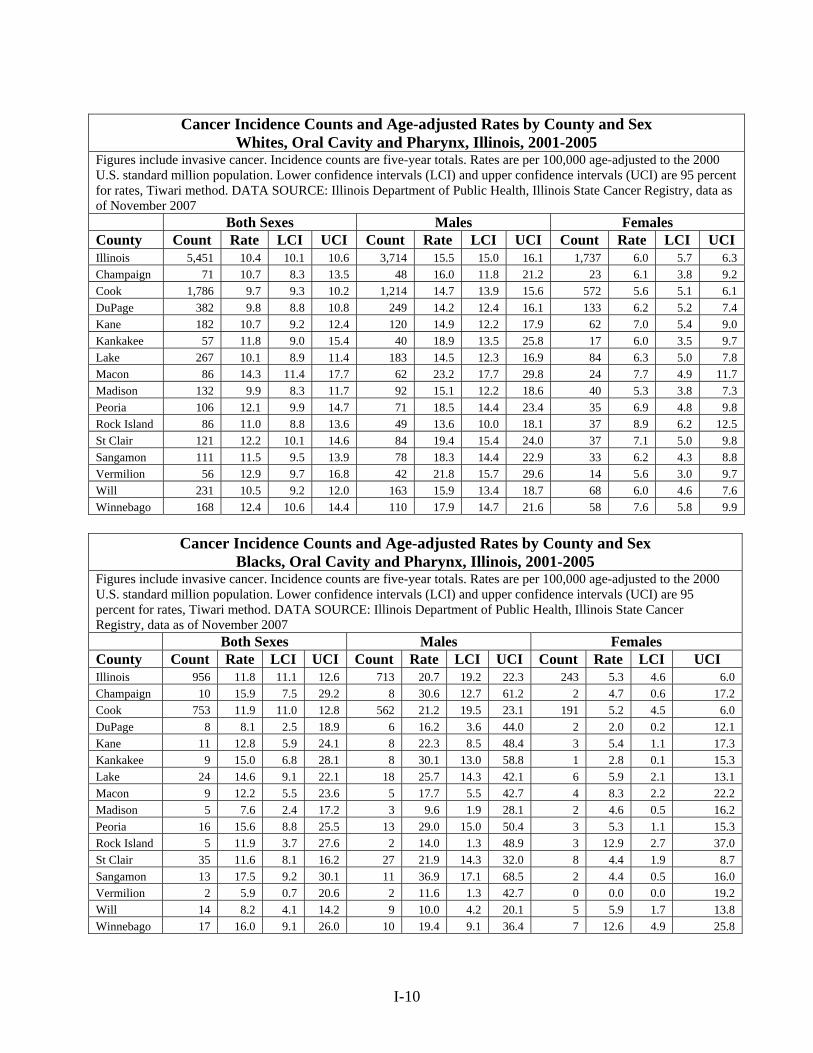
Whites, Oral Cavity and Pharynx, Illinois, 2001-2005 Figures include invasive cancer. Incidence counts are five-year totals. Rates are per 100,000 age-adjusted to the 2000 U.S. standard million population. Lower confidence intervals (LCI) and upper confidence intervals (UCI) are 95 percent for rates, Tiwari method. DATA SOURCE: Illinois Department of Public Health, Illinois State Cancer Registry, data as of November 2007
Both Sexes Males Females County Count Rate LCI UCI Count Rate LCI UCI Count Rate LCI UCI Illinois 5,451 10.4 10.1 10.6 3,714 15.5 15.0 16.1 1,737 6.0 5.7 6.3 Champaign 71 10.7 8.3 13.5 48 16.0 11.8 21.2 23 6.1 3.8 9.2 Cook 1,786 9.7 9.3 10.2 1,214 14.7 13.9 15.6 572 5.6 5.1 6.1 DuPage 382 9.8 8.8 10.8 249 14.2 12.4 16.1 133 6.2 5.2 7.4 Kane 182 10.7 9.2 12.4 120 14.9 12.2 17.9 62 7.0 5.4 9.0 Kankakee 57 11.8 9.0 15.4 40 18.9 13.5 25.8 17 6.0 3.5 9.7 Lake 267 10.1 8.9 11.4 183 14.5 12.3 16.9 84 6.3 5.0 7.8 Macon 86 14.3 11.4 17.7 62 23.2 17.7 29.8 24 7.7 4.9 11.7 Madison 132 9.9 8.3 11.7 92 15.1 12.2 18.6 40 5.3 3.8 7.3 Peoria 106 12.1 9.9 14.7 71 18.5 14.4 23.4 35 6.9 4.8 9.8 Rock Island 86 11.0 8.8 13.6 49 13.6 10.0 18.1 37 8.9 6.2 12.5 St Clair 121 12.2 10.1 14.6 84 19.4 15.4 24.0 37 7.1 5.0 9.8 Sangamon 111 11.5 9.5 13.9 78 18.3 14.4 22.9 33 6.2 4.3 8.8 Vermilion 56 12.9 9.7 16.8 42 21.8 15.7 29.6 14 5.6 3.0 9.7 Will 231 10.5 9.2 12.0 163 15.9 13.4 18.7 68 6.0 4.6 7.6 Winnebago 168 12.4 10.6 14.4 110 17.9 14.7 21.6 58 7.6 5.8 9.9
Cancer Incidence Counts and Age-adjusted Rates by County and Sex Blacks, Oral Cavity and Pharynx, Illinois, 2001-2005
Figures include invasive cancer. Incidence counts are five-year totals. Rates are per 100,000 age-adjusted to the 2000 U.S. standard million population. Lower confidence intervals (LCI) and upper confidence intervals (UCI) are 95 percent for rates, Tiwari method. DATA SOURCE: Illinois Department of Public Health, Illinois State Cancer Registry, data as of November 2007
Both Sexes Males Females County Count Rate LCI UCI Count Rate LCI UCI Count Rate LCI UCI Illinois 956 11.8 11.1 12.6 713 20.7 19.2 22.3 243 5.3 4.6 6.0 Champaign 10 15.9 7.5 29.2 8 30.6 12.7 61.2 2 4.7 0.6 17.2 Cook 753 11.9 11.0 12.8 562 21.2 19.5 23.1 191 5.2 4.5 6.0 DuPage 8 8.1 2.5 18.9 6 16.2 3.6 44.0 2 2.0 0.2 12.1 Kane 11 12.8 5.9 24.1 8 22.3 8.5 48.4 3 5.4 1.1 17.3 Kankakee 9 15.0 6.8 28.1 8 30.1 13.0 58.8 1 2.8 0.1 15.3 Lake 24 14.6 9.1 22.1 18 25.7 14.3 42.1 6 5.9 2.1 13.1 Macon 9 12.2 5.5 23.6 5 17.7 5.5 42.7 4 8.3 2.2 22.2 Madison 5 7.6 2.4 17.2 3 9.6 1.9 28.1 2 4.6 0.5 16.2 Peoria 16 15.6 8.8 25.5 13 29.0 15.0 50.4 3 5.3 1.1 15.3 Rock Island 5 11.9 3.7 27.6 2 14.0 1.3 48.9 3 12.9 2.7 37.0 St Clair 35 11.6 8.1 16.2 27 21.9 14.3 32.0 8 4.4 1.9 8.7 Sangamon 13 17.5 9.2 30.1 11 36.9 17.1 68.5 2 4.4 0.5 16.0 Vermilion 2 5.9 0.7 20.6 2 11.6 1.3 42.7 0 0.0 0.0 19.2 Will 14 8.2 4.1 14.2 9 10.0 4.2 20.1 5 5.9 1.7 13.8 Winnebago 17 16.0 9.1 26.0 10 19.4 9.1 36.4 7 12.6 4.9 25.8
I-11
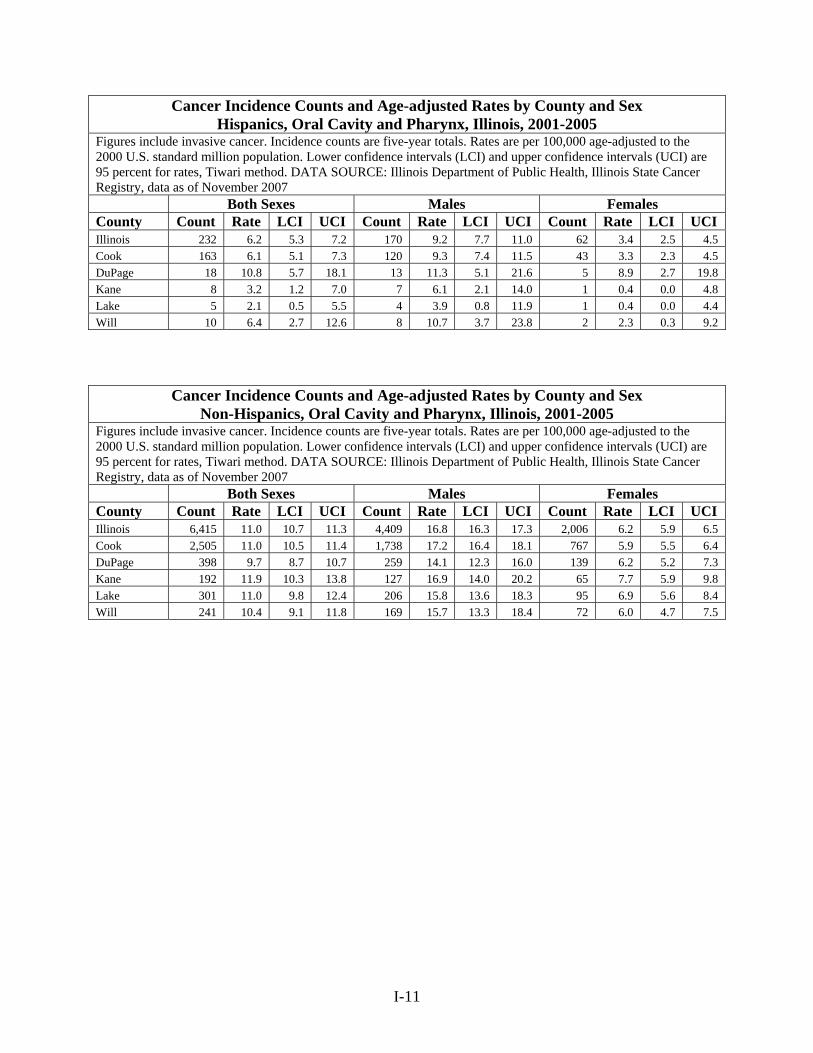
Cancer Incidence Counts and Age-adjusted Rates by County and Sex Hispanics, Oral Cavity and Pharynx, Illinois, 2001-2005
Figures include invasive cancer. Incidence counts are five-year totals. Rates are per 100,000 age-adjusted to the 2000 U.S. standard million population. Lower confidence intervals (LCI) and upper confidence intervals (UCI) are 95 percent for rates, Tiwari method. DATA SOURCE: Illinois Department of Public Health, Illinois State Cancer Registry, data as of November 2007
Both Sexes Males Females County Count Rate LCI UCI Count Rate LCI UCI Count Rate LCI UCI Illinois 232 6.2 5.3 7.2 170 9.2 7.7 11.0 62 3.4 2.5 4.5 Cook 163 6.1 5.1 7.3 120 9.3 7.4 11.5 43 3.3 2.3 4.5 DuPage 18 10.8 5.7 18.1 13 11.3 5.1 21.6 5 8.9 2.7 19.8 Kane 8 3.2 1.2 7.0 7 6.1 2.1 14.0 1 0.4 0.0 4.8 Lake 5 2.1 0.5 5.5 4 3.9 0.8 11.9 1 0.4 0.0 4.4 Will 10 6.4 2.7 12.6 8 10.7 3.7 23.8 2 2.3 0.3 9.2
Cancer Incidence Counts and Age-adjusted Rates by County and Sex Non-Hispanics, Oral Cavity and Pharynx, Illinois, 2001-2005
Figures include invasive cancer. Incidence counts are five-year totals. Rates are per 100,000 age-adjusted to the 2000 U.S. standard million population. Lower confidence intervals (LCI) and upper confidence intervals (UCI) are 95 percent for rates, Tiwari method. DATA SOURCE: Illinois Department of Public Health, Illinois State Cancer Registry, data as of November 2007
Both Sexes Males Females County Count Rate LCI UCI Count Rate LCI UCI Count Rate LCI UCI Illinois 6,415 11.0 10.7 11.3 4,409 16.8 16.3 17.3 2,006 6.2 5.9 6.5 Cook 2,505 11.0 10.5 11.4 1,738 17.2 16.4 18.1 767 5.9 5.5 6.4 DuPage 398 9.7 8.7 10.7 259 14.1 12.3 16.0 139 6.2 5.2 7.3 Kane 192 11.9 10.3 13.8 127 16.9 14.0 20.2 65 7.7 5.9 9.8 Lake 301 11.0 9.8 12.4 206 15.8 13.6 18.3 95 6.9 5.6 8.4 Will 241 10.4 9.1 11.8 169 15.7 13.3 18.4 72 6.0 4.7 7.5

I-12
Cancer Incidence Counts and Age-adjusted Rates by County and Sex
All Races, Colon and Rectum, Illinois, 2001-2005 Figures include invasive cancer. Incidence rates are five-year totals. Rates are per 100,000 age-adjusted to the 2000 U.S. standard million population. Lower confidence intervals (LCI) and upper confidence intervals (UCI) are 95 percent for rates, Tiwari method. DATA SOURCE: Illinois Department of Public Health, Illinois State Cancer Registry, data as of November 2007
Both Sexes Males Females County Count Rate LCI UCI Count Rate LCI UCI Count Rate LCI UCI Illinois 35,219 56.8 56.2 57.4 17,719 68.0 67.0 69.0 17,500 48.5 47.8 49.3 Adams 239 53.5 46.8 61.0 119 64.1 53.0 76.8 120 45.3 37.1 54.8 Alexander 40 69.7 49.6 95.6 19 79.4 47.7 124.3 21 63.0 38.2 99.3 Bond 68 67.0 52.0 85.2 32 73.0 49.8 103.1 36 63.5 44.1 89.3 Boone 122 58.8 48.8 70.2 64 71.4 54.6 91.6 58 51.0 38.7 66.0 Brown 22 66.3 41.4 101.0 15 101.7 56.3 168.0 7 38.2 15.2 84.5 Bureau 172 72.2 61.6 84.2 86 86.4 69.0 106.9 86 61.9 48.8 77.8 Calhoun 22 59.1 36.6 92.0 11 67.1 33.2 123.5 11 55.2 26.5 106.1 Carroll 60 49.2 37.4 64.0 30 55.3 37.3 79.9 30 42.5 28.3 62.9 Cass 59 68.3 51.9 88.6 32 93.5 63.9 132.1 27 55.9 36.5 83.0 Champaign 383 51.6 46.6 57.1 196 61.8 53.3 71.2 187 43.4 37.4 50.2 Christian 168 76.8 65.5 89.6 86 92.6 74.1 114.5 82 66.6 52.6 83.6 Clark 58 52.6 39.8 68.5 33 69.2 47.6 97.7 25 39.9 25.4 60.6 Clay 71 74.5 57.6 95.0 44 110.1 79.8 148.5 27 47.1 29.8 71.7 Clinton 132 65.1 54.4 77.3 66 76.3 58.9 97.2 66 56.7 43.5 72.8 Coles 186 69.3 59.6 80.2 93 84.1 67.8 103.1 93 57.8 46.3 71.5 Cook 14,275 56.0 55.1 56.9 7,022 66.9 65.4 68.5 7,253 48.4 47.2 49.5 Crawford 87 68.1 54.5 84.4 41 74.0 53.1 100.7 46 62.3 45.1 84.7 Cumberland 47 70.7 51.8 94.5 23 77.6 49.1 117.1 24 64.7 40.8 98.5 DeKalb 204 54.8 47.5 62.9 95 60.8 49.0 74.3 109 50.7 41.5 61.3 DeWitt 52 52.0 38.7 68.5 27 62.5 41.1 91.3 25 44.4 28.4 66.7 Douglas 68 56.9 44.1 72.4 27 52.6 34.6 76.7 41 57.6 40.9 79.4 DuPage 2,099 51.0 48.8 53.2 1,080 62.3 58.5 66.2 1,019 43.0 40.4 45.8 Edgar 65 51.4 39.4 66.0 32 61.2 41.9 86.7 33 43.1 29.1 62.5 Edwards 31 72.1 48.4 104.0 17 86.3 49.9 140.3 14 58.3 30.6 102.6 Effingham 125 65.1 54.1 77.6 63 78.8 60.5 100.8 62 55.3 42.1 71.5 Fayette 80 61.5 48.7 76.8 37 68.1 47.9 94.1 43 59.1 42.5 80.8 Ford 70 70.1 54.1 89.7 28 72.1 47.8 104.8 42 72.0 50.5 100.7 Franklin 205 77.7 67.2 89.4 103 93.3 76.1 113.5 102 67.0 54.1 82.4 Fulton 161 64.4 54.7 75.5 84 77.4 61.7 96.0 77 54.4 42.5 69.0 Gallatin 33 79.2 53.5 113.7 13 74.8 39.1 130.7 20 86.1 50.8 139.0 Greene 63 68.8 52.6 88.6 33 81.7 56.2 115.2 30 57.7 38.2 84.4 Grundy 130 66.6 55.6 79.1 69 81.1 62.8 102.8 61 54.3 41.4 70.1 Hamilton 27 42.1 27.5 62.8 18 67.1 39.8 107.9 9 27.9 12.3 56.9 Hancock 81 59.2 46.8 74.2 48 83.5 61.5 111.4 33 43.2 29.2 62.5 Hardin 25 77.4 49.9 116.4 13 90.8 48.0 158.8 12 70.0 35.9 128.0 Henderson 31 57.0 38.7 82.1 18 71.0 41.8 114.8 13 43.0 22.8 76.7 Henry 186 56.3 48.4 65.2 88 66.2 53.0 81.7 98 49.6 40.0 61.1 Iroquois 140 65.4 54.9 77.6 72 77.8 60.9 98.3 68 56.1 43.0 72.4 Jackson 153 59.8 50.7 70.2 76 70.3 55.3 88.0 77 50.6 39.6 63.7 Jasper 34 54.0 37.2 76.3 16 58.2 33.2 95.2 18 50.2 29.2 81.9 Jefferson 169 70.0 59.8 81.6 83 80.1 63.7 99.4 86 59.9 47.5 74.7

I-13
Cancer Incidence Counts and Age-adjusted Rates by County and Sex All Races, Colon and Rectum, Illinois, 2001-2005
Figures include invasive cancer. Incidence rates are five-year totals. Rates are per 100,000 age-adjusted to the 2000 U.S. standard million population. Lower confidence intervals (LCI) and upper confidence intervals (UCI) are 95 percent for rates, Tiwari method. DATA SOURCE: Illinois Department of Public Health, Illinois State Cancer Registry, data as of November 2007
Both Sexes Males Females County Count Rate LCI UCI Count Rate LCI UCI Count Rate LCI UCI Jersey 53 41.3 30.9 54.2 27 50.0 32.8 73.1 26 35.4 22.9 52.9 Jo Daviess 92 57.5 46.2 70.9 37 49.8 35.0 69.4 55 62.3 46.6 82.3 Johnson 49 71.2 52.6 94.4 26 80.6 52.2 118.8 23 62.4 39.5 95.3 Kane 928 56.0 52.4 59.8 469 66.0 59.8 72.6 459 48.3 43.9 53.0 Kankakee 329 60.0 53.7 66.9 175 74.3 63.6 86.2 154 47.9 40.6 56.3 Kendall 144 57.1 48.0 67.4 69 60.2 46.2 76.8 75 54.1 42.4 67.8 Knox 193 53.6 46.2 62.0 98 64.1 52.0 78.2 95 45.2 36.2 55.9 Lake 1,406 53.0 50.2 55.9 736 62.6 57.9 67.6 670 45.4 42.0 49.0 LaSalle 459 66.1 60.2 72.6 255 86.7 76.3 98.0 204 50.3 43.3 58.1 Lawrence 60 54.0 40.8 70.4 27 60.4 39.7 88.3 33 48.5 32.3 71.4 Lee 119 57.9 47.9 69.4 55 61.2 46.1 79.8 64 55.4 42.4 71.3 Livingston 149 62.9 53.0 74.0 68 69.7 54.1 88.4 81 57.4 45.2 72.2 Logan 116 64.3 53.0 77.4 71 95.1 74.2 120.1 45 41.0 29.5 55.9 McDonough 97 56.2 45.4 68.9 39 54.1 38.4 74.1 58 59.7 44.6 78.6 McHenry 650 59.5 55.0 64.4 324 66.9 59.4 75.0 326 53.3 47.6 59.4 McLean 349 54.4 48.8 60.5 170 62.9 53.7 73.2 179 47.0 40.3 54.6 Macon 431 63.9 58.0 70.3 212 75.1 65.3 86.0 219 56.2 48.9 64.4 Macoupin 245 78.3 68.7 89.1 134 100.2 83.9 118.9 111 58.2 47.4 70.9 Madison 838 57.7 53.9 61.8 430 70.8 64.2 77.9 408 48.9 44.2 54.0 Marion 176 66.3 56.7 77.2 81 74.7 59.3 93.1 95 60.5 48.4 75.0 Marshall 52 55.5 41.2 73.6 31 78.4 53.2 112.2 21 39.5 24.0 63.0 Mason 68 64.5 50.0 82.3 39 82.5 58.6 113.4 29 49.1 32.5 72.3 Massac 51 50.1 37.1 66.5 20 47.8 29.2 74.3 31 50.9 33.9 74.5 Menard 46 65.2 47.6 87.5 24 75.8 48.1 113.7 22 57.7 35.8 88.7 Mercer 61 57.5 43.9 74.2 37 75.1 52.8 104.2 24 42.4 27.0 64.2 Monroe 98 61.6 49.9 75.1 48 73.5 53.9 97.8 50 52.5 38.7 69.9 Montgomery 131 68.1 56.7 81.1 74 91.5 71.9 115.0 57 47.8 35.8 63.2 Morgan 131 59.7 49.8 71.1 62 68.4 52.4 87.8 69 54.8 42.3 70.2 Moultrie 48 49.8 36.5 66.8 23 58.4 37.0 88.1 25 46.5 29.4 70.8 Ogle 154 52.8 44.8 61.9 85 67.1 53.5 83.1 69 41.8 32.4 53.3 Peoria 539 52.6 48.2 57.3 259 61.1 53.9 69.1 280 45.8 40.4 51.6 Perry 95 69.8 56.3 85.6 50 84.1 62.4 111.1 45 57.4 41.0 78.6 Piatt 67 66.4 51.4 84.7 39 86.3 61.2 118.6 28 51.0 33.7 74.8 Pike 52 41.7 30.8 55.7 24 46.9 29.9 70.6 28 37.6 24.4 56.7 Pope 10 30.1 14.4 59.1 7 49.3 19.6 108.0 3 17.9 3.7 63.6 Pulaski 15 36.2 20.2 60.5 11 60.9 30.3 109.8 4 16.3 4.4 44.6 Putnam 26 65.6 42.8 97.4 18 96.3 56.7 154.9 8 37.6 16.0 78.3 Randolph 106 53.2 43.5 64.6 51 61.6 45.8 81.0 55 46.3 34.3 61.5 Richland 69 66.1 51.1 84.3 43 96.5 69.7 130.7 26 42.5 27.1 64.3 Rock Island 471 53.6 48.8 58.7 238 63.5 55.6 72.1 233 45.5 39.8 52.0 St Clair 830 63.0 58.8 67.5 408 76.0 68.7 83.8 422 54.0 48.9 59.4 Saline 130 71.3 59.4 85.1 67 92.4 71.6 117.6 63 58.3 44.4 75.9 Sangamon 624 59.8 55.2 64.7 306 71.7 63.8 80.2 318 51.5 45.9 57.6

I-14
Cancer Incidence Counts and Age-adjusted Rates by County and Sex All Races, Colon and Rectum, Illinois, 2001-2005
Figures include invasive cancer. Incidence rates are five-year totals. Rates are per 100,000 age-adjusted to the 2000 U.S. standard million population. Lower confidence intervals (LCI) and upper confidence intervals (UCI) are 95 percent for rates, Tiwari method. DATA SOURCE: Illinois Department of Public Health, Illinois State Cancer Registry, data as of November 2007
Both Sexes Males Females County Count Rate LCI UCI Count Rate LCI UCI Count Rate LCI UCI Schuyler 30 61.0 40.9 88.5 11 48.0 23.9 88.4 19 71.5 42.2 116.1 Scott 22 63.6 39.7 97.5 4 26.8 7.3 70.3 18 97.1 56.9 157.1 Shelby 84 54.6 43.4 68.1 43 63.7 46.1 86.4 41 47.2 33.4 65.6 Stark 29 65.8 43.8 96.2 19 96.9 58.2 153.9 10 38.3 18.0 75.7 Stephenson 170 52.7 45.0 61.5 86 67.1 53.6 83.0 84 42.6 33.7 53.5 Tazewell 439 57.5 52.3 63.2 213 65.2 56.6 74.6 226 51.6 45.0 58.9 Union 70 59.4 46.0 75.6 43 82.2 59.2 111.5 27 37.0 23.5 56.1 Vermilion 306 59.8 53.3 67.0 166 76.6 65.3 89.3 140 47.7 40.0 56.7 Wabash 44 54.8 39.6 74.3 26 76.2 49.7 112.3 18 39.6 23.1 64.6 Warren 61 51.9 39.6 67.1 29 58.2 38.9 84.0 32 47.5 32.2 68.5 Washington 71 72.8 56.6 92.4 35 83.8 58.3 117.1 36 66.6 46.2 94.0 Wayne 77 63.7 50.0 80.3 42 83.9 60.3 114.1 35 48.3 32.9 69.5 White 86 77.1 61.2 96.5 53 112.6 84.1 148.4 33 46.4 30.8 68.5 Whiteside 189 50.1 43.2 58.0 95 59.2 47.8 72.4 94 41.4 33.2 51.3 Will 1,242 57.6 54.3 60.9 671 70.9 65.3 76.8 571 47.0 43.2 51.1 Williamson 216 54.9 47.7 62.8 109 64.6 53.0 78.1 107 46.6 37.9 56.9 Winnebago 777 52.6 49.0 56.5 396 61.7 55.7 68.1 381 44.7 40.2 49.4 Woodford 106 50.3 41.1 61.0 59 65.0 49.3 84.0 47 38.2 27.8 51.5
I-15
Cancer Incidence Counts and Age-adjusted Rates by County and Sex
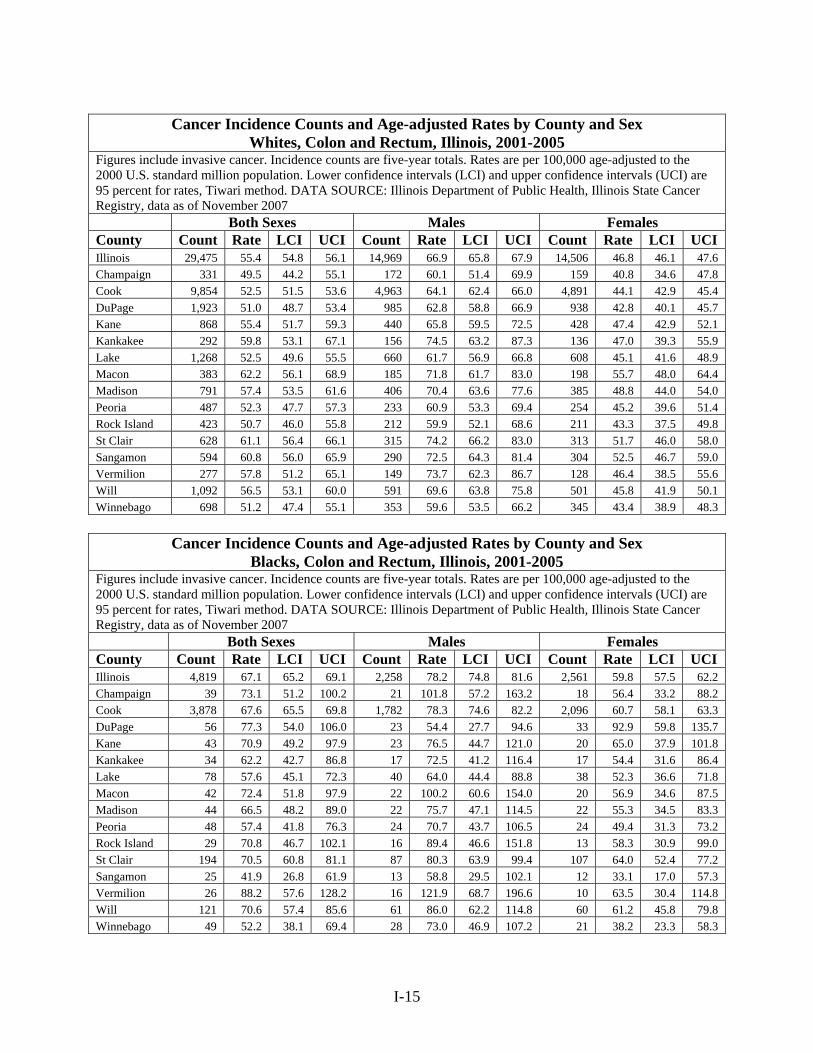
Whites, Colon and Rectum, Illinois, 2001-2005 Figures include invasive cancer. Incidence counts are five-year totals. Rates are per 100,000 age-adjusted to the 2000 U.S. standard million population. Lower confidence intervals (LCI) and upper confidence intervals (UCI) are 95 percent for rates, Tiwari method. DATA SOURCE: Illinois Department of Public Health, Illinois State Cancer Registry, data as of November 2007
Both Sexes Males Females County Count Rate LCI UCI Count Rate LCI UCI Count Rate LCI UCI Illinois 29,475 55.4 54.8 56.1 14,969 66.9 65.8 67.9 14,506 46.8 46.1 47.6 Champaign 331 49.5 44.2 55.1 172 60.1 51.4 69.9 159 40.8 34.6 47.8 Cook 9,854 52.5 51.5 53.6 4,963 64.1 62.4 66.0 4,891 44.1 42.9 45.4 DuPage 1,923 51.0 48.7 53.4 985 62.8 58.8 66.9 938 42.8 40.1 45.7 Kane 868 55.4 51.7 59.3 440 65.8 59.5 72.5 428 47.4 42.9 52.1 Kankakee 292 59.8 53.1 67.1 156 74.5 63.2 87.3 136 47.0 39.3 55.9 Lake 1,268 52.5 49.6 55.5 660 61.7 56.9 66.8 608 45.1 41.6 48.9 Macon 383 62.2 56.1 68.9 185 71.8 61.7 83.0 198 55.7 48.0 64.4 Madison 791 57.4 53.5 61.6 406 70.4 63.6 77.6 385 48.8 44.0 54.0 Peoria 487 52.3 47.7 57.3 233 60.9 53.3 69.4 254 45.2 39.6 51.4 Rock Island 423 50.7 46.0 55.8 212 59.9 52.1 68.6 211 43.3 37.5 49.8 St Clair 628 61.1 56.4 66.1 315 74.2 66.2 83.0 313 51.7 46.0 58.0 Sangamon 594 60.8 56.0 65.9 290 72.5 64.3 81.4 304 52.5 46.7 59.0 Vermilion 277 57.8 51.2 65.1 149 73.7 62.3 86.7 128 46.4 38.5 55.6 Will 1,092 56.5 53.1 60.0 591 69.6 63.8 75.8 501 45.8 41.9 50.1 Winnebago 698 51.2 47.4 55.1 353 59.6 53.5 66.2 345 43.4 38.9 48.3
Cancer Incidence Counts and Age-adjusted Rates by County and Sex Blacks, Colon and Rectum, Illinois, 2001-2005
Figures include invasive cancer. Incidence counts are five-year totals. Rates are per 100,000 age-adjusted to the 2000 U.S. standard million population. Lower confidence intervals (LCI) and upper confidence intervals (UCI) are 95 percent for rates, Tiwari method. DATA SOURCE: Illinois Department of Public Health, Illinois State Cancer Registry, data as of November 2007
Both Sexes Males Females County Count Rate LCI UCI Count Rate LCI UCI Count Rate LCI UCI Illinois 4,819 67.1 65.2 69.1 2,258 78.2 74.8 81.6 2,561 59.8 57.5 62.2 Champaign 39 73.1 51.2 100.2 21 101.8 57.2 163.2 18 56.4 33.2 88.2 Cook 3,878 67.6 65.5 69.8 1,782 78.3 74.6 82.2 2,096 60.7 58.1 63.3 DuPage 56 77.3 54.0 106.0 23 54.4 27.7 94.6 33 92.9 59.8 135.7 Kane 43 70.9 49.2 97.9 23 76.5 44.7 121.0 20 65.0 37.9 101.8 Kankakee 34 62.2 42.7 86.8 17 72.5 41.2 116.4 17 54.4 31.6 86.4 Lake 78 57.6 45.1 72.3 40 64.0 44.4 88.8 38 52.3 36.6 71.8 Macon 42 72.4 51.8 97.9 22 100.2 60.6 154.0 20 56.9 34.6 87.5 Madison 44 66.5 48.2 89.0 22 75.7 47.1 114.5 22 55.3 34.5 83.3 Peoria 48 57.4 41.8 76.3 24 70.7 43.7 106.5 24 49.4 31.3 73.2 Rock Island 29 70.8 46.7 102.1 16 89.4 46.6 151.8 13 58.3 30.9 99.0 St Clair 194 70.5 60.8 81.1 87 80.3 63.9 99.4 107 64.0 52.4 77.2 Sangamon 25 41.9 26.8 61.9 13 58.8 29.5 102.1 12 33.1 17.0 57.3 Vermilion 26 88.2 57.6 128.2 16 121.9 68.7 196.6 10 63.5 30.4 114.8 Will 121 70.6 57.4 85.6 61 86.0 62.2 114.8 60 61.2 45.8 79.8 Winnebago 49 52.2 38.1 69.4 28 73.0 46.9 107.2 21 38.2 23.3 58.3

I-16
Cancer Incidence Counts and Age-adjusted Rates by County and Sex Hispanics, Colon and Rectum, Illinois, 2001-2005
Figures include invasive cancer. Incidence counts are five-year totals. Rates are per 100,000 age-adjusted to the 2000 U.S. standard million population. Lower confidence intervals (LCI) and upper confidence intervals (UCI) are 95 percent for rates, Tiwari method. DATA SOURCE: Illinois Department of Public Health, Illinois State Cancer Registry, data as of November 2007
Both Sexes Males Females County Count Rate LCI UCI Count Rate LCI UCI Count Rate LCI UCI Illinois 1,266 39.8 37.4 42.4 719 48.4 44.4 52.7 547 32.7 29.8 35.8 Cook 856 37.7 34.9 40.6 485 46.2 41.5 51.2 371 30.8 27.5 34.3 DuPage 84 56.1 43.0 71.4 46 66.1 44.9 92.7 38 47.6 32.0 67.2 Kane 56 30.5 21.5 41.7 31 39.7 24.6 59.6 25 22.7 13.1 36.2 Lake 52 31.1 21.8 42.4 28 35.6 21.0 55.2 24 27.6 16.3 42.8 Will 51 47.8 33.8 65.0 32 57.8 35.6 87.0 19 37.6 21.3 59.9
Cancer Incidence Counts and Age-adjusted Rates by County and Sex Non-Hispanics, Colon and Rectum, Illinois, 2001-2005
Figures include invasive cancer. Incidence counts are five-year totals. Rates are per 100,000 age-adjusted to the 2000 U.S. standard million population. Lower confidence intervals (LCI) and upper confidence intervals (UCI) are 95 percent for rates, Tiwari method. DATA SOURCE: Illinois Department of Public Health, Illinois State Cancer Registry, data as of November 2007
Both Sexes Males Females County Count Rate LCI UCI Count Rate LCI UCI Count Rate LCI UCI Illinois 33,953 57.7 57.1 58.3 17,000 69.2 68.1 70.2 16,953 49.3 48.5 50.1 Cook 13,419 57.8 56.8 58.8 6,537 69.1 67.5 70.9 6,882 49.9 48.7 51.1 DuPage 2,015 50.9 48.6 53.1 1,034 62.2 58.3 66.3 981 42.8 40.1 45.6 Kane 872 58.1 54.3 62.1 438 68.8 62.2 75.8 434 49.9 45.3 54.9 Lake 1,354 54.1 51.2 57.1 708 64.0 59.2 69.2 646 46.2 42.6 49.9 Will 1,191 58.1 54.8 61.5 639 71.5 65.8 77.6 552 47.6 43.7 51.8

I-17
Cancer Incidence Counts and Age-adjusted Rates by County and Sex
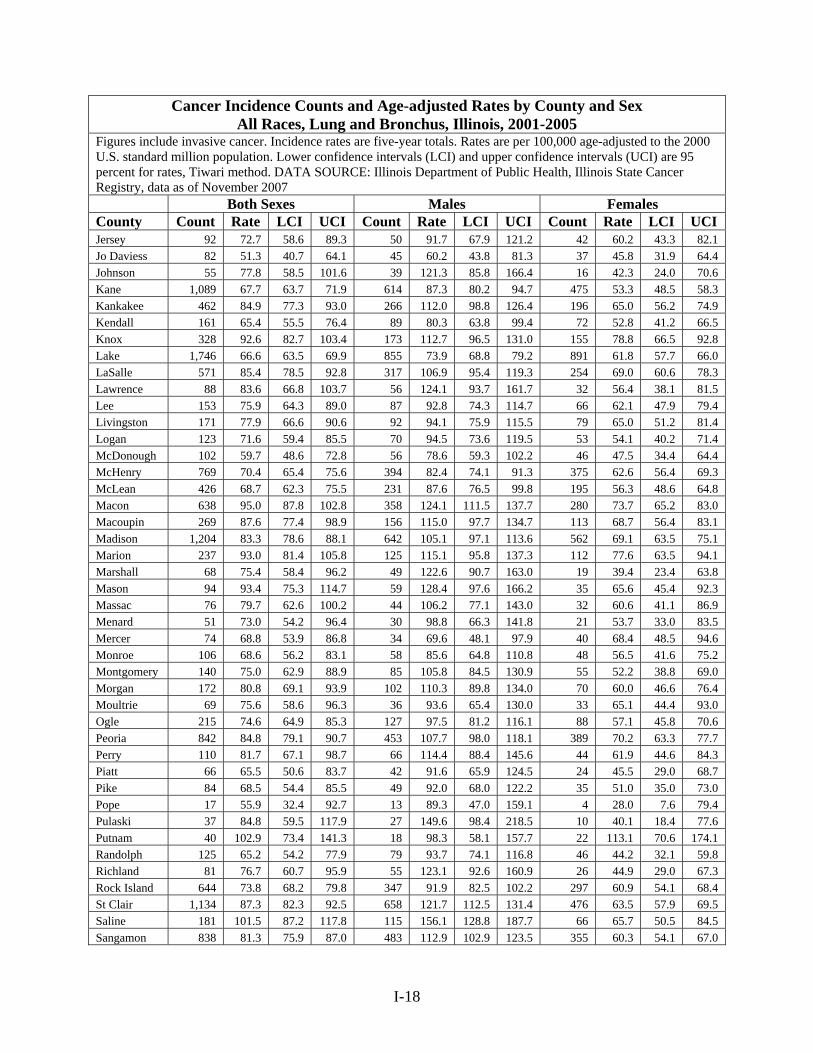
All Races, Lung and Bronchus, Illinois, 2001-2005 Figures include invasive cancer. Incidence rates are five-year totals. Rates are per 100,000 age-adjusted to the 2000 U.S. standard million population. Lower confidence intervals (LCI) and upper confidence intervals (UCI) are 95 percent for rates, Tiwari method. DATA SOURCE: Illinois Department of Public Health, Illinois State Cancer Registry, data as of November 2007
Both Sexes Males Females County Count Rate LCI UCI Count Rate LCI UCI Count Rate LCI UCI Illinois 44,351 72.3 71.6 73.0 24,323 93.1 91.9 94.3 20,028 57.8 57.0 58.6 Adams 320 74.3 66.2 83.1 177 93.9 80.5 109.0 143 61.9 51.9 73.5 Alexander 71 124.8 97.2 158.2 44 183.2 133.1 246.3 27 84.2 54.9 124.8 Bond 98 98.2 79.7 119.9 61 139.6 106.5 179.6 37 68.8 48.2 95.9 Boone 149 72.3 61.1 84.9 86 92.5 73.6 114.6 63 57.2 43.9 73.2 Brown 28 86.6 57.4 125.6 21 143.1 87.8 219.2 7 40.5 16.2 88.2 Bureau 180 77.9 66.8 90.4 107 106.0 86.8 128.3 73 56.8 44.1 72.3 Calhoun 32 86.8 58.9 124.9 22 123.2 76.9 190.3 10 51.6 23.1 103.2 Carroll 99 85.4 69.1 104.7 56 106.0 79.9 138.5 43 70.7 50.7 97.0 Cass 65 79.3 61.1 101.6 36 102.6 71.8 142.3 29 62.5 41.4 91.4 Champaign 508 70.0 64.0 76.4 280 88.3 78.1 99.3 228 56.5 49.4 64.4 Christian 264 120.2 106.0 135.8 156 165.5 140.5 193.8 108 88.6 72.2 107.9 Clark 87 80.6 64.4 99.8 55 116.3 87.6 151.9 32 54.2 36.8 77.6 Clay 87 91.0 72.6 113.0 52 127.5 95.2 167.8 35 65.7 44.8 93.7 Clinton 139 69.4 58.4 82.1 79 90.9 71.9 113.4 60 55.1 41.9 71.5 Coles 229 86.4 75.5 98.5 132 117.3 98.0 139.1 97 64.7 52.2 79.3 Cook 17,384 68.7 67.6 69.7 9,274 87.8 86.0 89.6 8,110 55.5 54.3 56.7 Crawford 93 73.7 59.4 90.6 58 104.3 79.2 135.1 35 50.9 35.2 72.1 Cumberland 58 90.7 68.8 117.6 35 123.6 86.0 172.3 23 63.8 40.2 97.1 DeKalb 232 63.5 55.6 72.2 129 82.1 68.4 97.5 103 51.5 41.9 62.5 DeWitt 87 84.1 67.3 104.1 52 119.8 89.4 157.5 35 62.6 43.3 88.2 Douglas 85 71.0 56.6 88.1 51 101.4 75.4 133.6 34 49.0 33.6 69.5 DuPage 2,449 60.9 58.4 63.3 1,264 74.6 70.4 79.0 1,185 52.1 49.1 55.2 Edgar 90 72.2 57.9 89.3 52 98.6 73.6 129.7 38 53.4 37.1 75.0 Edwards 42 88.4 63.5 120.9 30 144.2 97.2 207.7 12 40.8 20.7 76.2 Effingham 129 69.9 58.3 83.1 77 95.6 75.4 119.5 52 50.4 37.5 66.6 Fayette 100 79.3 64.4 96.7 60 107.8 82.1 139.0 40 59.6 42.1 82.3 Ford 61 65.6 49.9 85.1 35 88.4 61.5 123.5 26 53.7 34.5 80.5 Franklin 262 101.4 89.3 114.8 156 139.9 118.7 164.0 106 74.2 60.3 90.6 Fulton 221 89.7 78.1 102.6 131 119.1 99.5 141.5 90 66.5 53.1 82.6 Gallatin 48 107.6 79.0 144.4 26 126.9 82.3 189.5 22 90.8 56.5 141.6 Greene 88 98.0 78.2 121.5 49 123.6 91.2 164.0 39 75.6 53.0 105.5 Grundy 147 75.7 63.9 89.0 85 98.9 78.7 122.4 62 57.4 43.9 73.8 Hamilton 53 90.9 67.8 120.2 36 138.0 96.5 192.8 17 54.3 31.1 90.2 Hancock 87 66.1 52.8 82.1 50 87.4 64.7 115.8 37 53.5 37.3 75.0 Hardin 41 123.8 88.7 169.9 26 168.8 110.0 251.2 15 82.6 46.2 142.0 Henderson 47 84.4 61.9 113.4 32 128.2 86.9 184.0 15 51.6 28.8 88.0 Henry 220 69.4 60.5 79.4 134 96.7 81.0 114.7 86 50.0 39.8 62.2 Iroquois 133 65.8 55.0 78.3 75 82.7 65.0 104.0 58 53.2 40.1 69.7 Jackson 157 63.2 53.7 73.9 89 81.8 65.6 100.6 68 49.6 38.4 63.1 Jasper 51 80.6 59.8 106.7 31 112.8 76.6 160.8 20 57.6 34.7 91.2 Jefferson 176 74.3 63.7 86.3 113 109.9 90.5 132.3 63 47.7 36.4 61.6
I-18
Cancer Incidence Counts and Age-adjusted Rates by County and Sex All Races, Lung and Bronchus, Illinois, 2001-2005
Figures include invasive cancer. Incidence rates are five-year totals. Rates are per 100,000 age-adjusted to the 2000 U.S. standard million population. Lower confidence intervals (LCI) and upper confidence intervals (UCI) are 95 percent for rates, Tiwari method. DATA SOURCE: Illinois Department of Public Health, Illinois State Cancer Registry, data as of November 2007
Both Sexes Males Females County Count Rate LCI UCI Count Rate LCI UCI Count Rate LCI UCI Jersey 92 72.7 58.6 89.3 50 91.7 67.9 121.2 42 60.2 43.3 82.1 Jo Daviess 82 51.3 40.7 64.1 45 60.2 43.8 81.3 37 45.8 31.9 64.4 Johnson 55 77.8 58.5 101.6 39 121.3 85.8 166.4 16 42.3 24.0 70.6 Kane 1,089 67.7 63.7 71.9 614 87.3 80.2 94.7 475 53.3 48.5 58.3 Kankakee 462 84.9 77.3 93.0 266 112.0 98.8 126.4 196 65.0 56.2 74.9 Kendall 161 65.4 55.5 76.4 89 80.3 63.8 99.4 72 52.8 41.2 66.5 Knox 328 92.6 82.7 103.4 173 112.7 96.5 131.0 155 78.8 66.5 92.8 Lake 1,746 66.6 63.5 69.9 855 73.9 68.8 79.2 891 61.8 57.7 66.0 LaSalle 571 85.4 78.5 92.8 317 106.9 95.4 119.3 254 69.0 60.6 78.3 Lawrence 88 83.6 66.8 103.7 56 124.1 93.7 161.7 32 56.4 38.1 81.5 Lee 153 75.9 64.3 89.0 87 92.8 74.3 114.7 66 62.1 47.9 79.4 Livingston 171 77.9 66.6 90.6 92 94.1 75.9 115.5 79 65.0 51.2 81.4 Logan 123 71.6 59.4 85.5 70 94.5 73.6 119.5 53 54.1 40.2 71.4 McDonough 102 59.7 48.6 72.8 56 78.6 59.3 102.2 46 47.5 34.4 64.4 McHenry 769 70.4 65.4 75.6 394 82.4 74.1 91.3 375 62.6 56.4 69.3 McLean 426 68.7 62.3 75.5 231 87.6 76.5 99.8 195 56.3 48.6 64.8 Macon 638 95.0 87.8 102.8 358 124.1 111.5 137.7 280 73.7 65.2 83.0 Macoupin 269 87.6 77.4 98.9 156 115.0 97.7 134.7 113 68.7 56.4 83.1 Madison 1,204 83.3 78.6 88.1 642 105.1 97.1 113.6 562 69.1 63.5 75.1 Marion 237 93.0 81.4 105.8 125 115.1 95.8 137.3 112 77.6 63.5 94.1 Marshall 68 75.4 58.4 96.2 49 122.6 90.7 163.0 19 39.4 23.4 63.8 Mason 94 93.4 75.3 114.7 59 128.4 97.6 166.2 35 65.6 45.4 92.3 Massac 76 79.7 62.6 100.2 44 106.2 77.1 143.0 32 60.6 41.1 86.9 Menard 51 73.0 54.2 96.4 30 98.8 66.3 141.8 21 53.7 33.0 83.5 Mercer 74 68.8 53.9 86.8 34 69.6 48.1 97.9 40 68.4 48.5 94.6 Monroe 106 68.6 56.2 83.1 58 85.6 64.8 110.8 48 56.5 41.6 75.2 Montgomery 140 75.0 62.9 88.9 85 105.8 84.5 130.9 55 52.2 38.8 69.0 Morgan 172 80.8 69.1 93.9 102 110.3 89.8 134.0 70 60.0 46.6 76.4 Moultrie 69 75.6 58.6 96.3 36 93.6 65.4 130.0 33 65.1 44.4 93.0 Ogle 215 74.6 64.9 85.3 127 97.5 81.2 116.1 88 57.1 45.8 70.6 Peoria 842 84.8 79.1 90.7 453 107.7 98.0 118.1 389 70.2 63.3 77.7 Perry 110 81.7 67.1 98.7 66 114.4 88.4 145.6 44 61.9 44.6 84.3 Piatt 66 65.5 50.6 83.7 42 91.6 65.9 124.5 24 45.5 29.0 68.7 Pike 84 68.5 54.4 85.5 49 92.0 68.0 122.2 35 51.0 35.0 73.0 Pope 17 55.9 32.4 92.7 13 89.3 47.0 159.1 4 28.0 7.6 79.4 Pulaski 37 84.8 59.5 117.9 27 149.6 98.4 218.5 10 40.1 18.4 77.6 Putnam 40 102.9 73.4 141.3 18 98.3 58.1 157.7 22 113.1 70.6 174.1 Randolph 125 65.2 54.2 77.9 79 93.7 74.1 116.8 46 44.2 32.1 59.8 Richland 81 76.7 60.7 95.9 55 123.1 92.6 160.9 26 44.9 29.0 67.3 Rock Island 644 73.8 68.2 79.8 347 91.9 82.5 102.2 297 60.9 54.1 68.4 St Clair 1,134 87.3 82.3 92.5 658 121.7 112.5 131.4 476 63.5 57.9 69.5 Saline 181 101.5 87.2 117.8 115 156.1 128.8 187.7 66 65.7 50.5 84.5 Sangamon 838 81.3 75.9 87.0 483 112.9 102.9 123.5 355 60.3 54.1 67.0

I-19
Cancer Incidence Counts and Age-adjusted Rates by County and Sex All Races, Lung and Bronchus, Illinois, 2001-2005
Figures include invasive cancer. Incidence rates are five-year totals. Rates are per 100,000 age-adjusted to the 2000 U.S. standard million population. Lower confidence intervals (LCI) and upper confidence intervals (UCI) are 95 percent for rates, Tiwari method. DATA SOURCE: Illinois Department of Public Health, Illinois State Cancer Registry, data as of November 2007
Both Sexes Males Females County Count Rate LCI UCI Count Rate LCI UCI Count Rate LCI UCI Schuyler 28 58.7 38.7 86.4 19 88.8 53.1 140.8 9 33.8 15.2 68.5 Scott 21 59.3 36.5 92.2 16 105.2 60.0 172.5 5 26.1 8.1 65.6 Shelby 106 68.8 56.3 83.6 61 89.1 68.1 114.9 45 54.2 39.2 73.7 Stark 24 52.9 33.5 80.7 19 99.2 59.6 157.4 5 21.2 6.9 53.9 Stephenson 201 66.2 57.3 76.1 115 88.2 72.8 106.0 86 49.5 39.4 61.7 Tazewell 614 81.0 74.7 87.7 358 106.9 96.0 118.6 256 61.8 54.4 70.0 Union 90 75.2 60.3 93.0 50 96.1 71.2 127.4 40 60.2 42.6 83.5 Vermilion 477 94.5 86.2 103.4 265 120.1 106.0 135.6 212 75.2 65.3 86.2 Wabash 67 86.3 66.7 110.1 38 112.9 79.8 155.4 29 67.5 44.9 98.5 Warren 90 78.0 62.6 96.4 55 112.7 84.8 147.2 35 53.0 36.5 75.2 Washington 70 76.6 59.6 97.2 42 99.5 71.7 135.0 28 57.8 38.2 84.7 Wayne 97 82.5 66.6 101.3 58 115.7 87.6 150.3 39 58.7 41.2 82.0 White 105 94.6 77.2 115.3 61 123.5 94.4 159.7 44 75.4 54.4 103.0 Whiteside 275 74.0 65.5 83.4 158 96.2 81.7 112.5 117 55.2 45.5 66.6 Will 1,632 76.9 73.2 80.8 861 92.6 86.2 99.3 771 65.9 61.3 70.7 Williamson 315 80.5 71.9 90.1 188 111.4 96.0 128.7 127 58.3 48.5 69.7 Winnebago 1,104 75.1 70.7 79.6 647 101.6 93.8 109.8 457 55.8 50.8 61.2 Woodford 108 52.4 42.9 63.4 54 61.2 45.8 79.9 54 47.2 35.1 62.2

I-20
Cancer Incidence Counts and Age-adjusted Rates by County and Sex
Whites, Lung and Bronchus, Illinois, 2001-2005 Figures include invasive cancer. Incidence counts are five-year totals. Rates are per 100,000 age-adjusted to the 2000 U.S. standard million population. Lower confidence intervals (LCI) and upper confidence intervals (UCI) are 95 percent for rates, Tiwari method. DATA SOURCE: Illinois Department of Public Health, Illinois State Cancer Registry, data as of November 2007
Both Sexes Males Females County Count Rate LCI UCI Count Rate LCI UCI Count Rate LCI UCI Illinois 37,477 71.6 70.9 72.4 20,410 91.0 89.7 92.3 17,067 58.2 57.3 59.1 Champaign 429 65.6 59.5 72.1 237 82.5 72.2 93.7 192 53.0 45.7 61.2 Cook 12,033 65.3 64.2 66.5 6,273 81.1 79.1 83.1 5,760 54.7 53.3 56.1 DuPage 2,321 62.9 60.3 65.5 1,193 76.7 72.3 81.3 1,128 54.2 51.0 57.5 Kane 1,011 66.6 62.5 70.9 568 85.6 78.5 93.2 443 52.5 47.7 57.7 Kankakee 418 86.2 78.2 95.0 238 112.5 98.5 127.8 180 67.3 57.7 78.0 Lake 1,611 67.4 64.1 70.8 783 73.9 68.6 79.4 828 63.2 58.9 67.6 Macon 584 95.2 87.6 103.4 318 120.0 107.1 134.1 266 77.3 68.1 87.5 Madison 1,142 83.2 78.4 88.2 608 104.5 96.3 113.2 534 69.4 63.6 75.6 Peoria 747 83.3 77.4 89.6 399 104.7 94.6 115.6 348 69.7 62.5 77.7 Rock Island 612 74.1 68.3 80.3 329 92.2 82.5 102.8 283 61.2 54.1 68.9 St Clair 857 85.0 79.4 90.9 487 114.2 104.2 124.8 370 65.0 58.5 72.1 Sangamon 777 80.5 74.9 86.4 443 110.2 100.1 121.0 334 60.8 54.4 67.8 Vermilion 439 93.0 84.5 102.2 242 117.4 103.0 133.3 197 74.4 64.3 85.9 Will 1,485 77.7 73.8 81.8 771 92.6 85.9 99.7 714 67.6 62.7 72.8 Winnebago 1,008 74.1 69.6 78.8 587 99.5 91.6 108.0 421 55.6 50.4 61.2
Cancer Incidence Counts and Age-adjusted Rates by County and Sex Blacks, Lung and Bronchus, Illinois, 2001-2005
Figures include invasive cancer. Incidence counts are five-year totals. Rates are per 100,000 age-adjusted to the 2000 U.S. standard million population. Lower confidence intervals (LCI) and upper confidence intervals (UCI) are 95 percent for rates, Tiwari method. DATA SOURCE: Illinois Department of Public Health, Illinois State Cancer Registry, data as of November 2007
Both Sexes Males Females County Count Rate LCI UCI Count Rate LCI UCI Count Rate LCI UCI Illinois 6,235 85.4 83.3 87.6 3,507 118.7 114.7 122.8 2,728 63.3 60.9 65.7 Champaign 74 137.0 107.0 172.2 39 184.7 126.9 257.0 35 110.4 76.6 152.9 Cook 4,946 84.5 82.2 87.0 2,735 116.9 112.5 121.5 2,211 63.3 60.7 66.0 DuPage 40 71.2 46.6 102.5 23 101.7 55.0 166.5 17 50.0 25.2 85.8 Kane 67 124.0 92.9 160.9 38 163.4 105.2 238.1 29 100.6 64.9 146.5 Kankakee 43 73.0 52.6 98.3 27 104.5 67.8 152.9 16 48.7 27.8 78.6 Lake 104 81.2 65.6 99.0 59 109.2 80.2 144.2 45 62.6 45.2 84.0 Macon 53 92.1 68.7 120.4 39 162.6 114.2 223.6 14 43.6 23.7 72.3 Madison 60 93.6 71.2 120.2 33 128.6 87.2 181.4 27 71.8 47.1 103.9 Peoria 87 102.6 81.6 126.7 47 140.5 101.5 188.1 40 79.7 56.6 108.4 Rock Island 27 62.2 40.8 90.4 14 70.3 37.8 119.1 13 56.4 29.9 95.8 St Clair 272 97.6 86.2 109.9 170 153.8 131.0 179.2 102 60.7 49.5 73.7 Sangamon 59 101.2 76.4 130.8 38 163.8 112.5 228.4 21 61.0 37.5 92.6 Vermilion 38 125.3 88.5 171.2 23 173.7 108.4 260.5 15 93.1 52.1 152.0 Will 122 76.7 62.8 92.5 75 101.5 77.4 130.0 47 56.9 41.2 76.0 Winnebago 89 91.8 73.1 113.4 55 140.6 103.6 185.3 34 59.3 40.7 83.0
I-21
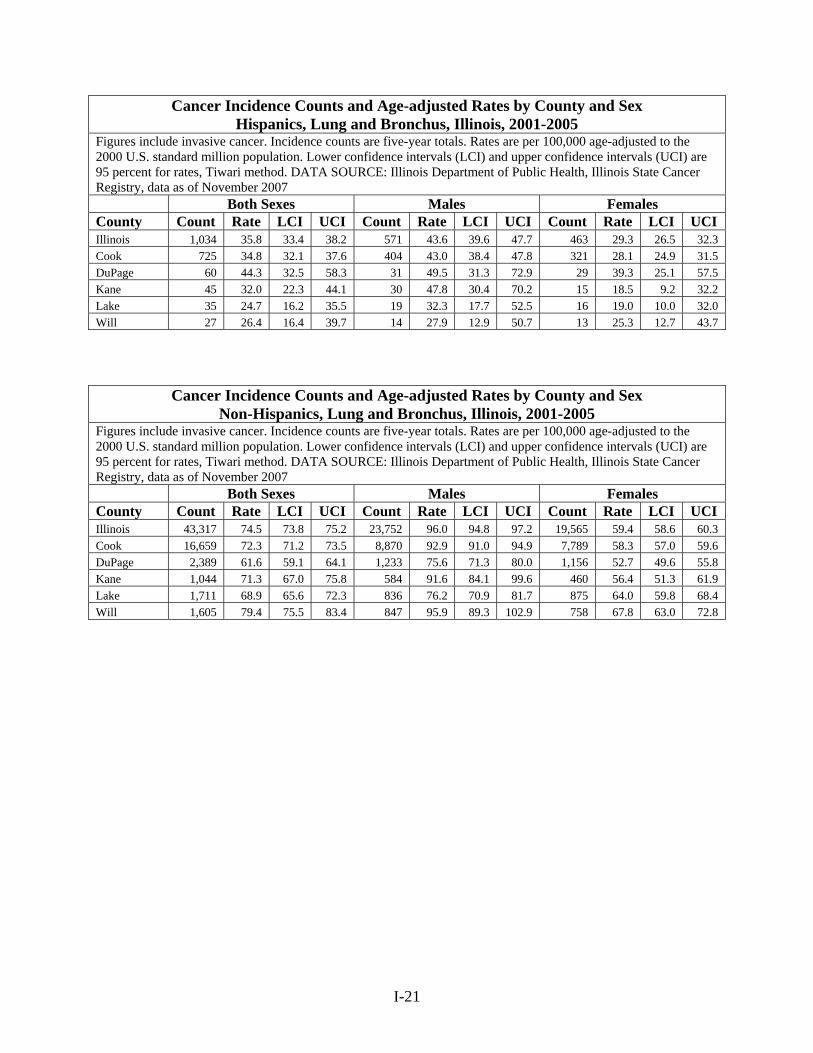
Cancer Incidence Counts and Age-adjusted Rates by County and Sex Hispanics, Lung and Bronchus, Illinois, 2001-2005
Figures include invasive cancer. Incidence counts are five-year totals. Rates are per 100,000 age-adjusted to the 2000 U.S. standard million population. Lower confidence intervals (LCI) and upper confidence intervals (UCI) are 95 percent for rates, Tiwari method. DATA SOURCE: Illinois Department of Public Health, Illinois State Cancer Registry, data as of November 2007
Both Sexes Males Females County Count Rate LCI UCI Count Rate LCI UCI Count Rate LCI UCI Illinois 1,034 35.8 33.4 38.2 571 43.6 39.6 47.7 463 29.3 26.5 32.3 Cook 725 34.8 32.1 37.6 404 43.0 38.4 47.8 321 28.1 24.9 31.5 DuPage 60 44.3 32.5 58.3 31 49.5 31.3 72.9 29 39.3 25.1 57.5 Kane 45 32.0 22.3 44.1 30 47.8 30.4 70.2 15 18.5 9.2 32.2 Lake 35 24.7 16.2 35.5 19 32.3 17.7 52.5 16 19.0 10.0 32.0 Will 27 26.4 16.4 39.7 14 27.9 12.9 50.7 13 25.3 12.7 43.7
Cancer Incidence Counts and Age-adjusted Rates by County and Sex Non-Hispanics, Lung and Bronchus, Illinois, 2001-2005
Figures include invasive cancer. Incidence counts are five-year totals. Rates are per 100,000 age-adjusted to the 2000 U.S. standard million population. Lower confidence intervals (LCI) and upper confidence intervals (UCI) are 95 percent for rates, Tiwari method. DATA SOURCE: Illinois Department of Public Health, Illinois State Cancer Registry, data as of November 2007
Both Sexes Males Females County Count Rate LCI UCI Count Rate LCI UCI Count Rate LCI UCI Illinois 43,317 74.5 73.8 75.2 23,752 96.0 94.8 97.2 19,565 59.4 58.6 60.3 Cook 16,659 72.3 71.2 73.5 8,870 92.9 91.0 94.9 7,789 58.3 57.0 59.6 DuPage 2,389 61.6 59.1 64.1 1,233 75.6 71.3 80.0 1,156 52.7 49.6 55.8 Kane 1,044 71.3 67.0 75.8 584 91.6 84.1 99.6 460 56.4 51.3 61.9 Lake 1,711 68.9 65.6 72.3 836 76.2 70.9 81.7 875 64.0 59.8 68.4 Will 1,605 79.4 75.5 83.4 847 95.9 89.3 102.9 758 67.8 63.0 72.8

I-22
Cancer Incidence Counts and Age-adjusted Rates by County and Sex
All Races, Melanoma of the Skin, Illinois, 2001-2005 Figures include invasive cancer. Incidence rates are five-year totals. Rates are per 100,000 age-adjusted to the 2000 U.S. standard million population. Lower confidence intervals (LCI) and upper confidence intervals (UCI) are 95 percent for rates, Tiwari method. DATA SOURCE: Illinois Department of Public Health, Illinois State Cancer Registry, data as of November 2007
Both Sexes Males Females County Count Rate LCI UCI Count Rate LCI UCI Count Rate LCI UCI Illinois 8,706 13.9 13.7 14.2 4,913 17.8 17.3 18.3 3,793 11.3 11.0 11.7 Adams 66 17.5 13.5 22.4 43 24.5 17.7 33.2 23 11.6 7.2 17.7 Alexander 3 5.8 1.1 17.6 1 4.1 0.1 23.5 2 7.1 0.6 28.6 Bond 12 12.1 6.2 21.4 6 13.0 4.7 28.7 6 11.7 3.9 27.3 Boone 33 15.1 10.4 21.2 19 19.5 11.6 30.6 14 12.3 6.7 20.6 Brown 3 7.5 1.5 24.0 2 14.5 1.7 50.9 1 3.0 0.1 33.9 Bureau 39 19.8 14.0 27.4 25 27.0 17.4 40.2 14 14.3 7.6 24.4 Calhoun 4 14.1 3.6 37.6 2 10.6 1.3 45.1 2 18.9 2.2 65.8 Carroll 19 18.8 11.0 30.1 14 27.8 15.1 47.7 5 11.7 3.6 28.1 Cass 18 22.9 13.5 36.5 13 36.8 19.5 63.3 5 12.5 4.0 30.0 Champaign 157 20.5 17.4 24.0 89 26.5 21.2 32.6 68 16.6 12.8 21.1 Christian 31 15.4 10.4 22.1 16 16.9 9.7 27.6 15 15.0 8.1 25.5 Clark 16 16.7 9.5 27.5 6 13.4 4.8 29.7 10 20.8 9.8 39.0 Clay 14 15.7 8.4 26.9 9 23.1 10.5 44.4 5 10.4 3.1 26.2 Clinton 28 14.4 9.5 20.9 16 17.7 10.1 28.8 12 11.6 5.8 20.8 Coles 29 11.8 7.9 17.0 16 14.5 8.2 23.5 13 10.2 5.3 17.8 Cook 2,608 10.1 9.7 10.5 1,472 13.2 12.5 13.9 1,136 7.9 7.5 8.4 Crawford 12 10.4 5.3 18.6 5 9.2 3.0 21.7 7 11.7 4.4 25.5 Cumberland 6 9.6 3.5 21.3 3 10.2 2.1 30.7 3 8.8 1.6 27.8 DeKalb 54 14.1 10.5 18.4 32 18.8 12.8 26.6 22 10.8 6.7 16.4 DeWitt 23 24.4 15.4 37.0 14 31.4 17.1 53.1 9 19.2 8.5 37.2 Douglas 12 11.0 5.6 19.5 6 12.5 4.5 27.2 6 11.7 4.2 25.6 DuPage 629 14.1 13.0 15.3 352 17.8 15.9 19.8 277 11.5 10.2 13.0 Edgar 16 14.9 8.4 24.6 11 22.2 11.0 40.0 5 8.2 2.4 20.7 Edwards 7 14.6 5.8 32.0 3 14.4 3.0 44.8 4 15.7 4.0 45.0 Effingham 30 17.0 11.5 24.3 19 23.0 13.9 36.0 11 12.4 6.1 22.4 Fayette 14 11.3 6.1 19.2 7 12.8 5.2 26.5 7 11.4 4.3 24.7 Ford 11 12.4 6.0 22.9 9 23.5 10.7 45.3 2 3.4 0.3 15.8 Franklin 45 18.6 13.5 25.2 28 25.6 17.0 37.3 17 14.1 8.0 23.2 Fulton 44 19.8 14.3 26.9 24 22.2 14.2 33.2 20 20.7 12.4 32.4 Gallatin 10 26.8 12.4 51.0 6 34.4 12.0 78.2 4 19.6 4.9 54.5 Greene 9 10.9 4.9 21.1 7 18.5 7.3 38.5 2 3.9 0.5 16.0 Grundy 35 17.0 11.9 23.7 21 20.8 12.8 32.0 14 12.9 7.0 21.8 Hamilton 5 7.8 2.5 20.2 5 18.7 6.1 46.0 0 0.0 0.0 17.8 Hancock 20 16.9 10.2 26.6 9 15.6 7.1 30.3 11 19.5 9.5 35.7 Hardin 5 17.4 5.5 42.8 2 15.6 1.9 59.3 3 19.1 3.5 62.9 Henderson 3 6.3 1.2 19.7 2 8.3 0.9 33.5 1 4.6 0.1 26.9 Henry 67 22.9 17.7 29.2 37 27.0 19.0 37.4 30 20.8 13.9 30.0 Iroquois 25 13.0 8.3 19.5 12 13.7 7.1 24.2 13 13.0 6.6 23.1 Jackson 32 13.4 9.1 18.9 21 18.5 11.4 28.2 11 8.6 4.3 15.4 Jasper 9 17.2 7.9 32.9 4 14.5 3.9 38.1 5 20.8 6.7 48.1 Jefferson 43 19.3 13.9 26.1 29 27.8 18.6 40.0 14 12.5 6.7 21.5

I-23
Cancer Incidence Counts and Age-adjusted Rates by County and Sex All Races, Melanoma of the Skin, Illinois, 2001-2005
Figures include invasive cancer. Incidence rates are five-year totals. Rates are per 100,000 age-adjusted to the 2000 U.S. standard million population. Lower confidence intervals (LCI) and upper confidence intervals (UCI) are 95 percent for rates, Tiwari method. DATA SOURCE: Illinois Department of Public Health, Illinois State Cancer Registry, data as of November 2007
Both Sexes Males Females County Count Rate LCI UCI Count Rate LCI UCI Count Rate LCI UCI Jersey 18 15.5 9.1 24.6 8 14.9 6.3 29.5 10 15.9 7.5 29.9 Jo Daviess 24 16.4 10.4 24.9 12 16.1 8.3 28.9 12 17.3 8.7 31.3 Johnson 20 28.1 17.1 43.8 13 34.1 18.0 59.2 7 20.7 8.1 44.4 Kane 272 13.9 12.3 15.7 137 15.1 12.5 18.0 135 13.1 11.0 15.5 Kankakee 75 14.1 11.0 17.6 36 16.1 11.2 22.4 39 13.9 9.9 19.1 Kendall 59 19.0 14.3 24.6 27 20.1 13.0 29.7 32 18.8 12.8 26.6 Knox 57 17.6 13.2 23.0 36 24.2 16.9 33.7 21 13.5 8.1 21.2 Lake 541 18.1 16.5 19.7 308 22.7 20.1 25.5 233 14.6 12.7 16.6 LaSalle 101 16.2 13.2 19.8 49 16.8 12.4 22.2 52 16.5 12.3 21.9 Lawrence 20 21.6 13.0 33.9 12 28.2 14.5 49.6 8 14.9 6.0 31.4 Lee 37 18.9 13.3 26.2 24 25.6 16.4 38.3 13 14.1 7.4 24.4 Livingston 35 16.3 11.3 22.7 22 22.9 14.3 34.7 13 12.0 6.3 20.7 Logan 24 14.6 9.4 21.9 15 19.7 11.0 32.5 9 10.7 4.8 20.7 McDonough 50 33.6 24.6 44.7 28 40.4 26.7 58.7 22 30.6 18.7 47.2 McHenry 241 19.0 16.7 21.7 144 25.2 21.0 29.9 97 14.2 11.5 17.4 McLean 159 23.2 19.7 27.1 92 30.3 24.3 37.3 67 17.8 13.7 22.7 Macon 112 17.8 14.6 21.5 58 20.1 15.2 26.0 54 16.8 12.5 22.1 Macoupin 62 22.4 17.1 28.9 38 28.8 20.4 39.7 24 17.9 11.3 27.0 Madison 209 15.0 13.1 17.2 119 19.4 16.0 23.2 90 12.5 10.1 15.4 Marion 59 25.7 19.4 33.4 33 31.3 21.5 44.2 26 21.9 13.9 32.7 Marshall 17 21.8 12.5 35.5 10 27.0 12.8 50.5 7 17.5 6.7 37.8 Mason 17 17.2 9.9 28.0 12 26.1 13.4 46.3 5 9.0 2.7 22.7 Massac 21 25.4 15.5 39.2 14 35.6 19.3 60.3 7 17.4 6.9 36.0 Menard 16 22.8 13.0 37.5 11 33.7 16.6 61.2 5 13.2 4.2 32.1 Mercer 26 28.9 18.7 42.7 13 28.5 15.0 49.3 13 29.7 15.6 51.3 Monroe 24 15.5 9.9 23.1 11 14.3 7.1 25.9 13 16.1 8.5 27.8 Montgomery 40 23.5 16.7 32.2 22 27.8 17.4 42.1 18 21.6 12.4 34.9 Morgan 34 16.6 11.4 23.3 18 19.6 11.6 31.1 16 15.1 8.4 25.1 Moultrie 19 23.0 13.6 36.6 5 13.5 4.4 31.8 14 32.5 17.1 56.3 Ogle 46 16.1 11.8 21.5 25 18.1 11.7 26.8 21 14.1 8.7 21.8 Peoria 200 20.8 18.0 23.9 107 24.8 20.3 30.0 93 18.4 14.8 22.6 Perry 15 11.7 6.5 19.5 6 9.8 3.6 21.6 9 14.5 6.2 28.7 Piatt 19 21.4 12.7 33.8 12 25.0 12.9 44.5 7 18.4 7.2 38.0 Pike 13 13.6 7.0 23.6 8 17.6 7.5 35.1 5 10.5 3.1 25.8 Pope 3 12.2 2.4 38.1 2 18.2 2.2 68.7 1 6.6 0.2 48.4 Pulaski 3 8.7 1.7 25.5 3 18.3 3.7 53.4 0 0.0 0.0 20.1 Putnam 7 19.4 7.7 41.1 0 0.0 0.0 25.0 7 37.2 14.6 79.9 Randolph 27 14.4 9.4 21.1 17 19.2 11.1 30.9 10 9.9 4.4 19.2 Richland 19 20.3 12.1 32.2 13 29.9 15.8 51.6 6 14.6 5.3 31.9 Rock Island 159 19.6 16.6 23.0 92 24.7 19.9 30.3 67 15.9 12.2 20.3 St Clair 158 12.2 10.4 14.3 89 16.0 12.8 19.7 69 9.9 7.7 12.6 Saline 36 21.9 15.1 30.7 24 34.2 21.8 51.2 12 13.5 6.7 24.7 Sangamon 203 20.0 17.3 23.0 117 26.4 21.8 31.8 86 16.1 12.8 19.9

I-24
Cancer Incidence Counts and Age-adjusted Rates by County and Sex All Races, Melanoma of the Skin, Illinois, 2001-2005
Figures include invasive cancer. Incidence rates are five-year totals. Rates are per 100,000 age-adjusted to the 2000 U.S. standard million population. Lower confidence intervals (LCI) and upper confidence intervals (UCI) are 95 percent for rates, Tiwari method. DATA SOURCE: Illinois Department of Public Health, Illinois State Cancer Registry, data as of November 2007
Both Sexes Males Females County Count Rate LCI UCI Count Rate LCI UCI Count Rate LCI UCI Schuyler 2 3.7 0.4 16.0 0 0.0 0.0 21.3 2 6.4 0.7 30.6 Scott 7 20.5 8.1 43.7 3 20.1 4.1 60.6 4 22.8 6.0 61.9 Shelby 23 16.0 10.1 24.4 16 24.0 13.7 39.5 7 10.4 4.1 22.2 Stark 9 24.7 11.0 48.3 6 35.7 12.7 79.8 3 17.4 3.6 52.1 Stephenson 30 10.9 7.3 15.7 15 12.2 6.8 20.2 15 10.1 5.6 17.1 Tazewell 182 25.7 22.1 29.7 89 26.3 21.1 32.4 93 26.1 21.0 32.1 Union 18 16.9 9.8 27.2 13 25.5 13.5 44.3 5 11.3 3.6 26.2 Vermilion 70 15.1 11.8 19.2 38 17.7 12.5 24.4 32 14.6 9.9 20.7 Wabash 14 17.3 9.4 29.8 8 22.7 9.8 45.5 6 13.4 4.7 31.4 Warren 26 23.3 15.1 34.7 14 28.4 15.5 48.3 12 18.9 9.4 34.7 Washington 24 28.2 18.0 42.3 14 33.1 18.1 56.1 10 24.9 11.7 46.5 Wayne 16 14.8 8.3 24.7 9 19.6 8.9 37.8 7 11.1 4.3 24.5 White 4 4.6 1.2 12.2 2 4.2 0.5 16.8 2 4.9 0.6 18.1 Whiteside 65 18.9 14.6 24.3 36 22.2 15.5 30.9 29 16.2 10.6 23.6 Will 342 13.6 12.2 15.2 199 18.1 15.5 21.0 143 10.4 8.7 12.3 Williamson 56 15.5 11.6 20.2 34 20.3 14.0 28.5 22 12.8 8.0 19.6 Winnebago 231 15.9 13.9 18.1 131 20.1 16.8 23.9 100 12.9 10.5 15.7 Woodford 44 21.9 15.8 29.6 27 30.3 19.9 44.3 17 16.6 9.4 27.1

I-25
Cancer Incidence Counts and Age-adjusted Rates by County and Sex
Whites, Melanoma of the Skin, Illinois, 2001-2005 Figures include invasive cancer. Incidence counts are five-year totals. Rates are per 100,000 age-adjusted to the 2000 U.S. standard million population. Lower confidence intervals (LCI) and upper confidence intervals (UCI) are 95 percent for rates, Tiwari method. DATA SOURCE: Illinois Department of Public Health, Illinois State Cancer Registry, data as of November 2007
Both Sexes Males Females County Count Rate LCI UCI Count Rate LCI UCI Count Rate LCI UCI Illinois 7,942 15.2 14.9 15.6 4,521 19.3 18.7 19.8 3,421 12.5 12.1 12.9 Champaign 156 23.4 19.8 27.4 89 29.7 23.8 36.6 67 19.2 14.8 24.4 Cook 2,331 12.6 12.1 13.2 1,340 16.4 15.5 17.3 991 10.1 9.5 10.7 DuPage 558 14.0 12.9 15.3 308 17.4 15.5 19.6 250 11.8 10.3 13.3 Kane 239 13.2 11.5 15.0 118 13.9 11.4 16.8 121 12.7 10.5 15.2 Kankakee 67 14.2 11.0 18.1 29 14.8 9.8 21.3 38 15.7 11.1 21.7 Lake 497 18.5 16.9 20.2 285 23.4 20.6 26.4 212 14.9 13.0 17.1 Macon 110 19.8 16.2 24.0 56 21.3 16.1 27.8 54 19.5 14.4 25.8 Madison 194 14.9 12.9 17.2 109 18.8 15.4 22.8 85 12.8 10.2 15.9 Peoria 185 22.1 19.0 25.6 103 26.8 21.9 32.6 82 19.0 15.0 23.8 Rock Island 148 19.7 16.6 23.2 85 24.5 19.6 30.4 63 16.1 12.2 20.8 St Clair 140 14.5 12.2 17.1 79 18.4 14.5 23.0 61 12.3 9.4 15.8 Sangamon 177 19.1 16.4 22.2 107 26.1 21.3 31.6 70 14.7 11.4 18.6 Vermilion 67 15.8 12.2 20.1 36 18.0 12.6 25.1 31 15.5 10.4 22.2 Will 307 13.9 12.4 15.6 185 19.0 16.2 22.1 122 10.2 8.5 12.2 Winnebago 212 16.1 14.0 18.4 124 20.8 17.3 24.8 88 12.5 10.0 15.5
Cancer Incidence Counts and Age-adjusted Rates by County and Sex Blacks, Melanoma of the Skin, Illinois, 2001-2005
Figures include invasive cancer. Incidence counts are five-year totals. Rates are per 100,000 age-adjusted to the 2000 U.S. standard million population. Lower confidence intervals (LCI) and upper confidence intervals (UCI) are 95 percent for rates, Tiwari method. DATA SOURCE: Illinois Department of Public Health, Illinois State Cancer Registry, data as of November 2007
Both Sexes Males Females County Count Rate LCI UCI Count Rate LCI UCI Count Rate LCI UCI Illinois 74 1.0 0.8 1.2 24 0.8 0.5 1.2 50 1.1 0.8 1.5 Champaign 1 1.3 0.0 7.6 0 0.0 0.0 15.7 1 2.5 0.1 13.6 Cook 60 1.0 0.8 1.3 18 0.7 0.4 1.2 42 1.2 0.9 1.6 DuPage 0 0.0 0.0 6.2 0 0.0 0.0 17.3 0 0.0 0.0 10.0 Kane 2 1.9 0.2 8.3 0 0.0 0.0 16.5 2 3.7 0.4 15.0 Kankakee 0 0.0 0.0 5.5 0 0.0 0.0 13.1 0 0.0 0.0 9.8 Lake 1 1.3 0.0 5.5 0 0.0 0.0 6.2 1 1.9 0.0 8.7 Macon 0 0.0 0.0 5.4 0 0.0 0.0 15.0 0 0.0 0.0 9.2 Madison 2 2.4 0.3 8.8 1 2.7 0.1 16.4 1 2.2 0.1 12.0 Peoria 0 0.0 0.0 3.4 0 0.0 0.0 8.6 0 0.0 0.0 5.9 Rock Island 0 0.0 0.0 8.0 0 0.0 0.0 20.3 0 0.0 0.0 14.7 St Clair 4 1.2 0.3 3.0 3 2.1 0.4 6.3 1 0.4 0.0 2.7 Sangamon 0 0.0 0.0 5.0 0 0.0 0.0 13.8 0 0.0 0.0 8.4 Vermilion 0 0.0 0.0 9.7 0 0.0 0.0 22.0 0 0.0 0.0 19.2 Will 1 0.4 0.0 2.7 0 0.0 0.0 5.2 1 0.8 0.0 4.8 Winnebago 1 0.9 0.0 4.8 1 2.1 0.1 11.9 0 0.0 0.0 5.6

I-26
Cancer Incidence Counts and Age-adjusted Rates by County and Sex Hispanics, Melanoma of the Skin, Illinois, 2001-2005
Figures include invasive cancer. Incidence counts are five-year totals. Rates are per 100,000 age-adjusted to the 2000 U.S. standard million population. Lower confidence intervals (LCI) and upper confidence intervals (UCI) are 95 percent for rates, Tiwari method. DATA SOURCE: Illinois Department of Public Health, Illinois State Cancer Registry, data as of November 2007
Both Sexes Males Females County Count Rate LCI UCI Count Rate LCI UCI Count Rate LCI UCI Illinois 153 3.5 2.8 4.2 66 3.6 2.6 4.8 87 3.5 2.7 4.4 Cook 92 2.9 2.2 3.6 45 3.0 2.1 4.2 47 2.7 1.9 3.8 DuPage 7 4.8 1.5 10.7 3 6.0 0.6 18.6 4 4.5 0.9 12.3 Kane 8 2.9 0.8 7.1 3 3.6 0.4 12.0 5 2.4 0.7 7.5 Lake 7 3.9 1.1 9.0 5 8.6 2.1 21.1 2 0.4 0.1 4.3 Will 8 4.1 1.2 9.8 2 2.1 0.2 10.0 6 5.6 1.3 15.1
Cancer Incidence Counts and Age-adjusted Rates by County and Sex Non-Hispanics, Melanoma of the Skin, Illinois, 2001-2005
Figures include invasive cancer. Incidence counts are five-year totals. Rates are per 100,000 age-adjusted to the 2000 U.S. standard million population. Lower confidence intervals (LCI) and upper confidence intervals (UCI) are 95 percent for rates, Tiwari method. DATA SOURCE: Illinois Department of Public Health, Illinois State Cancer Registry, data as of November 2007
Both Sexes Males Females County Count Rate LCI UCI Count Rate LCI UCI Count Rate LCI UCI Illinois 8,553 14.9 14.6 15.2 4,847 18.9 18.4 19.5 3,706 12.1 11.7 12.5 Cook 2,516 11.2 10.7 11.6 1,427 14.6 13.9 15.4 1,089 8.8 8.3 9.4 DuPage 622 14.9 13.7 16.1 349 18.7 16.7 20.8 273 12.1 10.7 13.7 Kane 264 16.1 14.1 18.1 134 17.5 14.6 20.8 130 14.9 12.5 17.8 Lake 534 19.5 17.8 21.2 303 24.1 21.4 27.1 231 15.9 13.9 18.1 Will 334 14.3 12.7 15.9 197 19.1 16.4 22.2 137 10.7 9.0 12.7
I-27
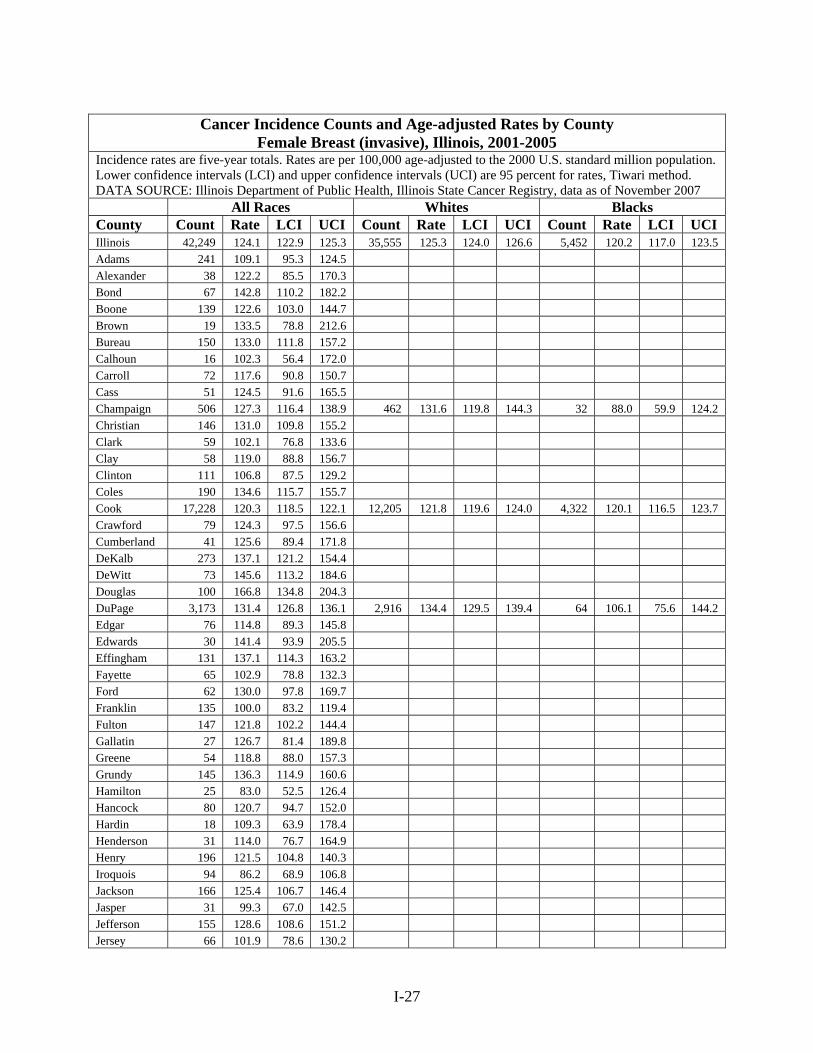
Cancer Incidence Counts and Age-adjusted Rates by County
Female Breast (invasive), Illinois, 2001-2005 Incidence rates are five-year totals. Rates are per 100,000 age-adjusted to the 2000 U.S. standard million population. Lower confidence intervals (LCI) and upper confidence intervals (UCI) are 95 percent for rates, Tiwari method. DATA SOURCE: Illinois Department of Public Health, Illinois State Cancer Registry, data as of November 2007
All Races Whites Blacks County Count Rate LCI UCI Count Rate LCI UCI Count Rate LCI UCI Illinois 42,249 124.1 122.9 125.3 35,555 125.3 124.0 126.6 5,452 120.2 117.0 123.5 Adams 241 109.1 95.3 124.5 Alexander 38 122.2 85.5 170.3 Bond 67 142.8 110.2 182.2 Boone 139 122.6 103.0 144.7 Brown 19 133.5 78.8 212.6 Bureau 150 133.0 111.8 157.2 Calhoun 16 102.3 56.4 172.0 Carroll 72 117.6 90.8 150.7 Cass 51 124.5 91.6 165.5 Champaign 506 127.3 116.4 138.9 462 131.6 119.8 144.3 32 88.0 59.9 124.2 Christian 146 131.0 109.8 155.2 Clark 59 102.1 76.8 133.6 Clay 58 119.0 88.8 156.7 Clinton 111 106.8 87.5 129.2 Coles 190 134.6 115.7 155.7 Cook 17,228 120.3 118.5 122.1 12,205 121.8 119.6 124.0 4,322 120.1 116.5 123.7 Crawford 79 124.3 97.5 156.6 Cumberland 41 125.6 89.4 171.8 DeKalb 273 137.1 121.2 154.4 DeWitt 73 145.6 113.2 184.6 Douglas 100 166.8 134.8 204.3 DuPage 3,173 131.4 126.8 136.1 2,916 134.4 129.5 139.4 64 106.1 75.6 144.2 Edgar 76 114.8 89.3 145.8 Edwards 30 141.4 93.9 205.5 Effingham 131 137.1 114.3 163.2 Fayette 65 102.9 78.8 132.3 Ford 62 130.0 97.8 169.7 Franklin 135 100.0 83.2 119.4 Fulton 147 121.8 102.2 144.4 Gallatin 27 126.7 81.4 189.8 Greene 54 118.8 88.0 157.3 Grundy 145 136.3 114.9 160.6 Hamilton 25 83.0 52.5 126.4 Hancock 80 120.7 94.7 152.0 Hardin 18 109.3 63.9 178.4 Henderson 31 114.0 76.7 164.9 Henry 196 121.5 104.8 140.3 Iroquois 94 86.2 68.9 106.8 Jackson 166 125.4 106.7 146.4 Jasper 31 99.3 67.0 142.5 Jefferson 155 128.6 108.6 151.2 Jersey 66 101.9 78.6 130.2

I-28
Cancer Incidence Counts and Age-adjusted Rates by County Female Breast (invasive), Illinois, 2001-2005
Incidence rates are five-year totals. Rates are per 100,000 age-adjusted to the 2000 U.S. standard million population. Lower confidence intervals (LCI) and upper confidence intervals (UCI) are 95 percent for rates, Tiwari method. DATA SOURCE: Illinois Department of Public Health, Illinois State Cancer Registry, data as of November 2007
All Races Whites Blacks County Count Rate LCI UCI Count Rate LCI UCI Count Rate LCI UCI Jo Daviess 98 131.1 105.6 161.3 Johnson 55 158.5 118.7 208.3 Kane 1,280 130.8 123.6 138.3 1,197 131.3 123.9 139.1 50 115.0 82.7 155.0 Kankakee 367 125.8 113.1 139.5 317 124.0 110.5 138.7 49 144.0 106.2 190.3 Kendall 207 134.3 116.4 154.1 Knox 226 124.3 108.0 142.5 Lake 2,171 137.6 131.8 143.6 1,967 139.0 132.9 145.4 105 120.5 97.9 146.5 LaSalle 454 131.0 118.9 144.0 Lawrence 62 120.3 90.7 156.9 Lee 145 139.9 117.7 165.1 Livingston 144 121.3 101.8 143.5 Logan 118 132.3 109.0 159.1 McDonough 101 112.1 90.3 137.9 McHenry 803 120.9 112.5 129.6 McLean 483 135.8 123.9 148.5 Macon 492 141.0 128.5 154.3 443 142.0 128.7 156.3 42 112.5 80.8 152.0 Macoupin 180 114.0 97.5 132.6 Madison 896 115.7 108.2 123.7 858 117.8 109.9 126.1 28 64.9 43.0 93.6 Marion 175 133.9 114.2 156.3 Marshall 58 131.6 98.9 172.6 Mason 76 146.6 114.7 185.1 Massac 52 105.8 78.1 140.7 Menard 58 155.4 117.4 202.3 Mercer 72 132.6 103.2 168.2 Monroe 114 137.4 113.2 165.4 Montgomery 122 128.3 105.6 154.7 Morgan 145 130.2 109.4 154.1 Moultrie 60 126.9 95.3 166.0 Ogle 168 114.0 97.3 132.8 Peoria 726 136.5 126.6 147.0 625 132.2 121.8 143.2 92 156.4 125.4 192.5 Perry 80 118.8 93.2 149.4 Piatt 63 120.1 91.6 155.2 Pike 63 111.7 84.6 145.1 Pope 13 89.0 46.3 159.7 Pulaski 20 92.3 55.1 145.6 Putnam 18 99.0 58.1 159.3 Randolph 101 106.5 86.1 130.3 Richland 43 79.5 56.6 109.1 Rock Island 594 128.9 118.6 140.0 556 128.5 117.8 140.0 24 108.3 68.9 161.1 St Clair 931 129.1 120.9 137.8 670 124.0 114.7 134.0 245 139.2 122.2 157.7 Saline 98 99.3 79.8 122.7 Sangamon 784 136.9 127.4 146.9 735 139.3 129.3 149.9 41 106.2 75.6 144.4 Schuyler 26 103.0 66.1 155.3 Scott 24 140.3 89.2 211.6
I-29
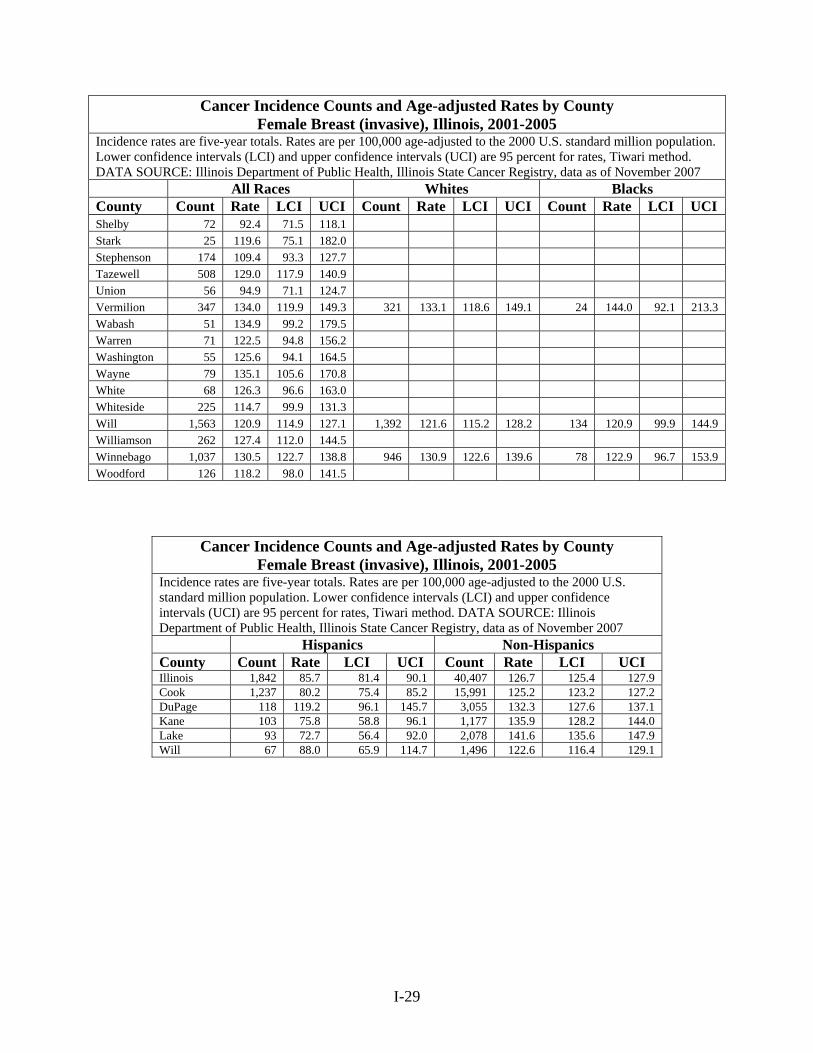
Cancer Incidence Counts and Age-adjusted Rates by County Female Breast (invasive), Illinois, 2001-2005
Incidence rates are five-year totals. Rates are per 100,000 age-adjusted to the 2000 U.S. standard million population. Lower confidence intervals (LCI) and upper confidence intervals (UCI) are 95 percent for rates, Tiwari method. DATA SOURCE: Illinois Department of Public Health, Illinois State Cancer Registry, data as of November 2007
All Races Whites Blacks County Count Rate LCI UCI Count Rate LCI UCI Count Rate LCI UCI Shelby 72 92.4 71.5 118.1 Stark 25 119.6 75.1 182.0 Stephenson 174 109.4 93.3 127.7 Tazewell 508 129.0 117.9 140.9 Union 56 94.9 71.1 124.7 Vermilion 347 134.0 119.9 149.3 321 133.1 118.6 149.1 24 144.0 92.1 213.3 Wabash 51 134.9 99.2 179.5 Warren 71 122.5 94.8 156.2 Washington 55 125.6 94.1 164.5 Wayne 79 135.1 105.6 170.8 White 68 126.3 96.6 163.0 Whiteside 225 114.7 99.9 131.3 Will 1,563 120.9 114.9 127.1 1,392 121.6 115.2 128.2 134 120.9 99.9 144.9 Williamson 262 127.4 112.0 144.5 Winnebago 1,037 130.5 122.7 138.8 946 130.9 122.6 139.6 78 122.9 96.7 153.9 Woodford 126 118.2 98.0 141.5
Cancer Incidence Counts and Age-adjusted Rates by County Female Breast (invasive), Illinois, 2001-2005
Incidence rates are five-year totals. Rates are per 100,000 age-adjusted to the 2000 U.S. standard million population. Lower confidence intervals (LCI) and upper confidence intervals (UCI) are 95 percent for rates, Tiwari method. DATA SOURCE: Illinois Department of Public Health, Illinois State Cancer Registry, data as of November 2007 Hispanics Non-Hispanics County Count Rate LCI UCI Count Rate LCI UCI Illinois 1,842 85.7 81.4 90.1 40,407 126.7 125.4 127.9 Cook 1,237 80.2 75.4 85.2 15,991 125.2 123.2 127.2 DuPage 118 119.2 96.1 145.7 3,055 132.3 127.6 137.1 Kane 103 75.8 58.8 96.1 1,177 135.9 128.2 144.0 Lake 93 72.7 56.4 92.0 2,078 141.6 135.6 147.9 Will 67 88.0 65.9 114.7 1,496 122.6 116.4 129.1
I-30
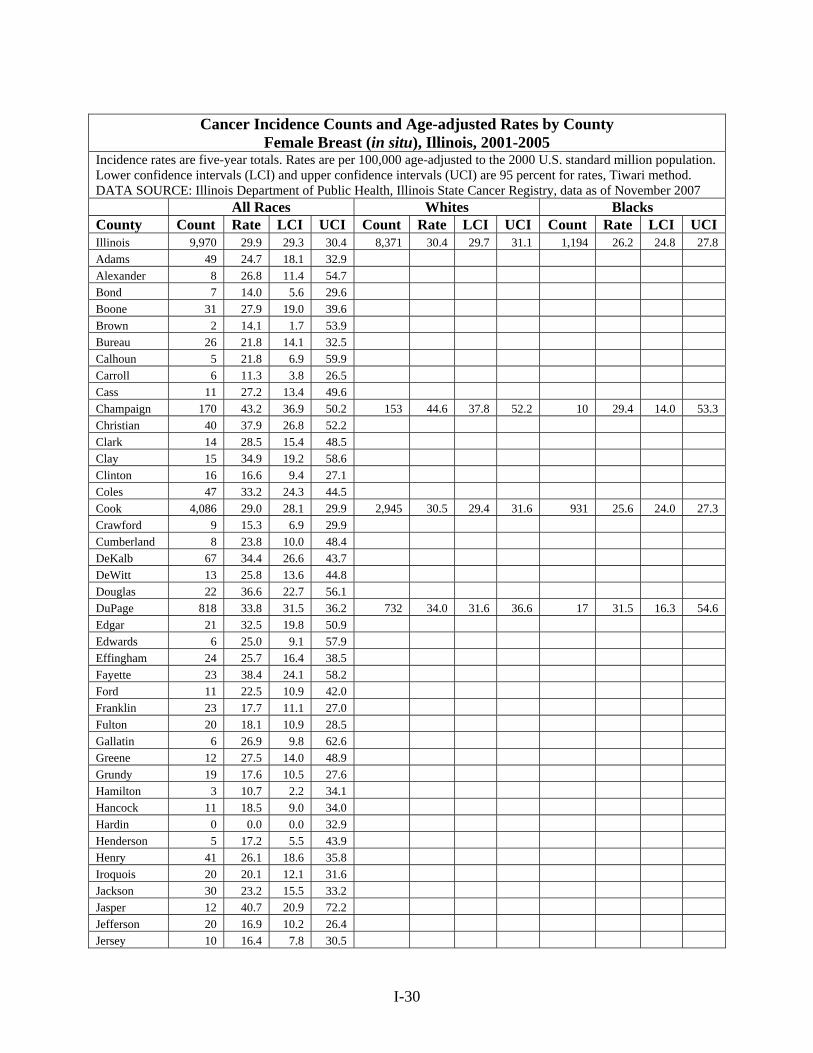
Cancer Incidence Counts and Age-adjusted Rates by County
Female Breast (in situ), Illinois, 2001-2005 Incidence rates are five-year totals. Rates are per 100,000 age-adjusted to the 2000 U.S. standard million population. Lower confidence intervals (LCI) and upper confidence intervals (UCI) are 95 percent for rates, Tiwari method. DATA SOURCE: Illinois Department of Public Health, Illinois State Cancer Registry, data as of November 2007
All Races Whites Blacks County Count Rate LCI UCI Count Rate LCI UCI Count Rate LCI UCI Illinois 9,970 29.9 29.3 30.4 8,371 30.4 29.7 31.1 1,194 26.2 24.8 27.8 Adams 49 24.7 18.1 32.9 Alexander 8 26.8 11.4 54.7 Bond 7 14.0 5.6 29.6 Boone 31 27.9 19.0 39.6 Brown 2 14.1 1.7 53.9 Bureau 26 21.8 14.1 32.5 Calhoun 5 21.8 6.9 59.9 Carroll 6 11.3 3.8 26.5 Cass 11 27.2 13.4 49.6 Champaign 170 43.2 36.9 50.2 153 44.6 37.8 52.2 10 29.4 14.0 53.3 Christian 40 37.9 26.8 52.2 Clark 14 28.5 15.4 48.5 Clay 15 34.9 19.2 58.6 Clinton 16 16.6 9.4 27.1 Coles 47 33.2 24.3 44.5 Cook 4,086 29.0 28.1 29.9 2,945 30.5 29.4 31.6 931 25.6 24.0 27.3 Crawford 9 15.3 6.9 29.9 Cumberland 8 23.8 10.0 48.4 DeKalb 67 34.4 26.6 43.7 DeWitt 13 25.8 13.6 44.8 Douglas 22 36.6 22.7 56.1 DuPage 818 33.8 31.5 36.2 732 34.0 31.6 36.6 17 31.5 16.3 54.6 Edgar 21 32.5 19.8 50.9 Edwards 6 25.0 9.1 57.9 Effingham 24 25.7 16.4 38.5 Fayette 23 38.4 24.1 58.2 Ford 11 22.5 10.9 42.0 Franklin 23 17.7 11.1 27.0 Fulton 20 18.1 10.9 28.5 Gallatin 6 26.9 9.8 62.6 Greene 12 27.5 14.0 48.9 Grundy 19 17.6 10.5 27.6 Hamilton 3 10.7 2.2 34.1 Hancock 11 18.5 9.0 34.0 Hardin 0 0.0 0.0 32.9 Henderson 5 17.2 5.5 43.9 Henry 41 26.1 18.6 35.8 Iroquois 20 20.1 12.1 31.6 Jackson 30 23.2 15.5 33.2 Jasper 12 40.7 20.9 72.2 Jefferson 20 16.9 10.2 26.4 Jersey 10 16.4 7.8 30.5
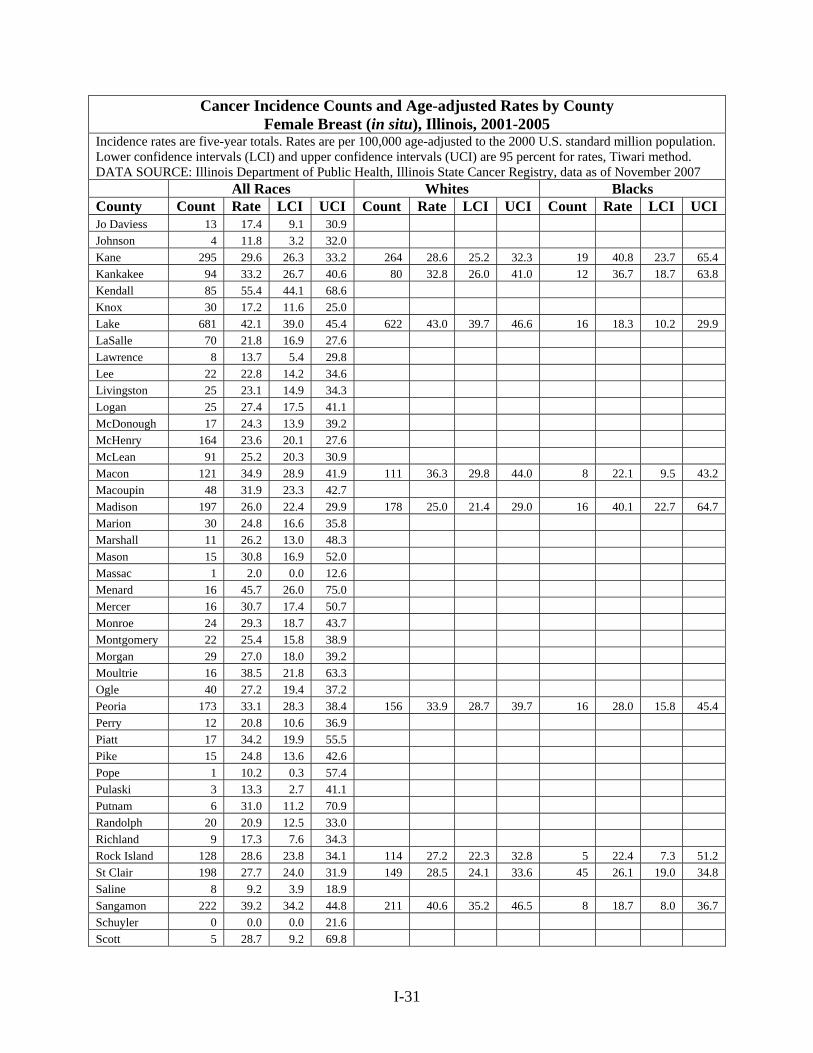
I-31
Cancer Incidence Counts and Age-adjusted Rates by County Female Breast (in situ), Illinois, 2001-2005
Incidence rates are five-year totals. Rates are per 100,000 age-adjusted to the 2000 U.S. standard million population. Lower confidence intervals (LCI) and upper confidence intervals (UCI) are 95 percent for rates, Tiwari method. DATA SOURCE: Illinois Department of Public Health, Illinois State Cancer Registry, data as of November 2007
All Races Whites Blacks County Count Rate LCI UCI Count Rate LCI UCI Count Rate LCI UCI Jo Daviess 13 17.4 9.1 30.9 Johnson 4 11.8 3.2 32.0 Kane 295 29.6 26.3 33.2 264 28.6 25.2 32.3 19 40.8 23.7 65.4 Kankakee 94 33.2 26.7 40.6 80 32.8 26.0 41.0 12 36.7 18.7 63.8 Kendall 85 55.4 44.1 68.6 Knox 30 17.2 11.6 25.0 Lake 681 42.1 39.0 45.4 622 43.0 39.7 46.6 16 18.3 10.2 29.9 LaSalle 70 21.8 16.9 27.6 Lawrence 8 13.7 5.4 29.8 Lee 22 22.8 14.2 34.6 Livingston 25 23.1 14.9 34.3 Logan 25 27.4 17.5 41.1 McDonough 17 24.3 13.9 39.2 McHenry 164 23.6 20.1 27.6 McLean 91 25.2 20.3 30.9 Macon 121 34.9 28.9 41.9 111 36.3 29.8 44.0 8 22.1 9.5 43.2 Macoupin 48 31.9 23.3 42.7 Madison 197 26.0 22.4 29.9 178 25.0 21.4 29.0 16 40.1 22.7 64.7 Marion 30 24.8 16.6 35.8 Marshall 11 26.2 13.0 48.3 Mason 15 30.8 16.9 52.0 Massac 1 2.0 0.0 12.6 Menard 16 45.7 26.0 75.0 Mercer 16 30.7 17.4 50.7 Monroe 24 29.3 18.7 43.7 Montgomery 22 25.4 15.8 38.9 Morgan 29 27.0 18.0 39.2 Moultrie 16 38.5 21.8 63.3 Ogle 40 27.2 19.4 37.2 Peoria 173 33.1 28.3 38.4 156 33.9 28.7 39.7 16 28.0 15.8 45.4 Perry 12 20.8 10.6 36.9 Piatt 17 34.2 19.9 55.5 Pike 15 24.8 13.6 42.6 Pope 1 10.2 0.3 57.4 Pulaski 3 13.3 2.7 41.1 Putnam 6 31.0 11.2 70.9 Randolph 20 20.9 12.5 33.0 Richland 9 17.3 7.6 34.3 Rock Island 128 28.6 23.8 34.1 114 27.2 22.3 32.8 5 22.4 7.3 51.2 St Clair 198 27.7 24.0 31.9 149 28.5 24.1 33.6 45 26.1 19.0 34.8 Saline 8 9.2 3.9 18.9 Sangamon 222 39.2 34.2 44.8 211 40.6 35.2 46.5 8 18.7 8.0 36.7 Schuyler 0 0.0 0.0 21.6 Scott 5 28.7 9.2 69.8

I-32
Cancer Incidence Counts and Age-adjusted Rates by County Female Breast (in situ), Illinois, 2001-2005
Incidence rates are five-year totals. Rates are per 100,000 age-adjusted to the 2000 U.S. standard million population. Lower confidence intervals (LCI) and upper confidence intervals (UCI) are 95 percent for rates, Tiwari method. DATA SOURCE: Illinois Department of Public Health, Illinois State Cancer Registry, data as of November 2007
All Races Whites Blacks County Count Rate LCI UCI Count Rate LCI UCI Count Rate LCI UCI Shelby 21 30.2 18.5 47.0 Stark 6 31.6 11.5 70.9 Stephenson 28 18.5 12.2 27.1 Tazewell 114 29.3 24.1 35.3 Union 5 9.0 2.9 21.8 Vermilion 96 39.4 31.8 48.4 86 38.2 30.4 47.5 10 61.7 29.5 111.8 Wabash 6 14.2 5.1 32.7 Warren 10 20.0 9.5 37.2 Washington 16 35.8 20.4 59.0 Wayne 6 10.0 3.6 23.2 White 8 14.8 6.2 31.0 Whiteside 50 26.7 19.7 35.5 Will 408 30.8 27.9 34.0 361 30.9 27.8 34.3 32 29.8 19.9 42.8 Williamson 44 23.6 17.0 31.9 Winnebago 296 38.1 33.9 42.7 266 38.0 33.5 42.9 27 43.0 28.1 62.7 Woodford 42 39.2 28.0 53.4
Cancer Incidence Counts and Age-adjusted Rates by County Female Breast (in situ), Illinois, 2001-2005
Incidence rates are five-year totals. Rates are per 100,000 age-adjusted to the 2000 U.S. standard million population. Lower confidence intervals (LCI) and upper confidence intervals (UCI) are 95 percent for rates, Tiwari method. DATA SOURCE: Illinois Department of Public Health, Illinois State Cancer Registry, data as of November 2007 Hispanics Non-Hispanics County Count Rate LCI UCI Count Rate LCI UCI Illinois 495 22.2 20.2 24.4 9,475 30.4 29.8 31.0 Cook 331 20.5 18.3 23.0 3,755 30.0 29.1 31.0 DuPage 37 30.4 20.2 43.6 781 33.8 31.5 36.3 Kane 25 21.8 12.3 35.0 270 30.9 27.3 34.9 Lake 28 24.1 15.2 36.0 653 43.4 40.1 46.9 Will 17 24.4 13.6 39.9 391 31.2 28.2 34.5

I-33
Cancer Incidence Counts and Age-adjusted Rates by Count
Cervix, Illinois, 2001-2005 Figures include invasive cancer. Incidence rates are five-year totals. Rates are per 100,000 age-adjusted to the 2000 U.S. standard million population. Lower confidence intervals (LCI) and upper confidence intervals (UCI) are 95 percent for rates, Tiwari method. DATA SOURCE: Illinois Department of Public Health, Illinois State Cancer Registry, data as of November 2007
All Races Whites Blacks County Count Rate LCI UCI Count Rate LCI UCI Count Rate LCI UCI Illinois 2,996 9.1 8.8 9.5 2,218 8.4 8.0 8.7 655 14.1 13.0 15.2 Adams 21 12.0 7.3 18.6 Alexander 3 8.8 1.7 29.2 Bond 5 13.7 4.3 31.6 Boone 8 6.8 2.9 13.4 Brown 0 0.0 0.0 30.5 Bureau 8 7.7 3.1 15.7 Calhoun 2 12.0 1.3 49.8 Carroll 3 7.6 1.5 22.5 Cass 8 21.3 9.0 42.6 Champaign 26 6.1 3.9 9.0 23 6.4 4.0 9.7 3 7.5 1.5 22.1 Christian 3 3.9 0.8 11.1 Clark 3 7.1 1.4 20.8 Clay 7 14.7 5.1 33.1 Clinton 4 4.7 1.2 12.1 Coles 13 10.5 5.5 18.0 Cook 1,393 10.0 9.4 10.5 810 8.6 8.0 9.2 524 14.4 13.2 15.7 Crawford 6 13.9 5.1 29.8 Cumberland 1 2.9 0.1 18.1 DeKalb 24 11.9 7.5 17.7 DeWitt 4 10.3 2.8 25.9 Douglas 5 8.8 2.7 21.0 DuPage 145 6.1 5.1 7.1 125 6.0 5.0 7.1 5 10.5 2.4 27.8 Edgar 7 14.6 5.7 30.4 Edwards 0 0.0 0.0 21.6 Effingham 3 3.3 0.7 9.8 Fayette 5 8.4 2.5 20.5 Ford 4 9.1 2.1 25.3 Franklin 11 10.1 4.9 18.2 Fulton 9 9.1 4.0 17.8 Gallatin 1 5.2 0.1 32.7 Greene 6 16.1 5.7 35.4 Grundy 10 9.6 4.6 17.7 Hamilton 3 13.3 2.6 40.0 Hancock 1 2.2 0.1 11.9 Hardin 0 0.0 0.0 32.9 Henderson 4 18.4 4.9 48.1 Henry 7 6.0 2.4 12.4 Iroquois 5 4.9 1.6 12.1 Jackson 14 10.8 5.8 18.4 Jasper 3 9.9 1.8 31.1 Jefferson 14 13.9 7.5 23.4
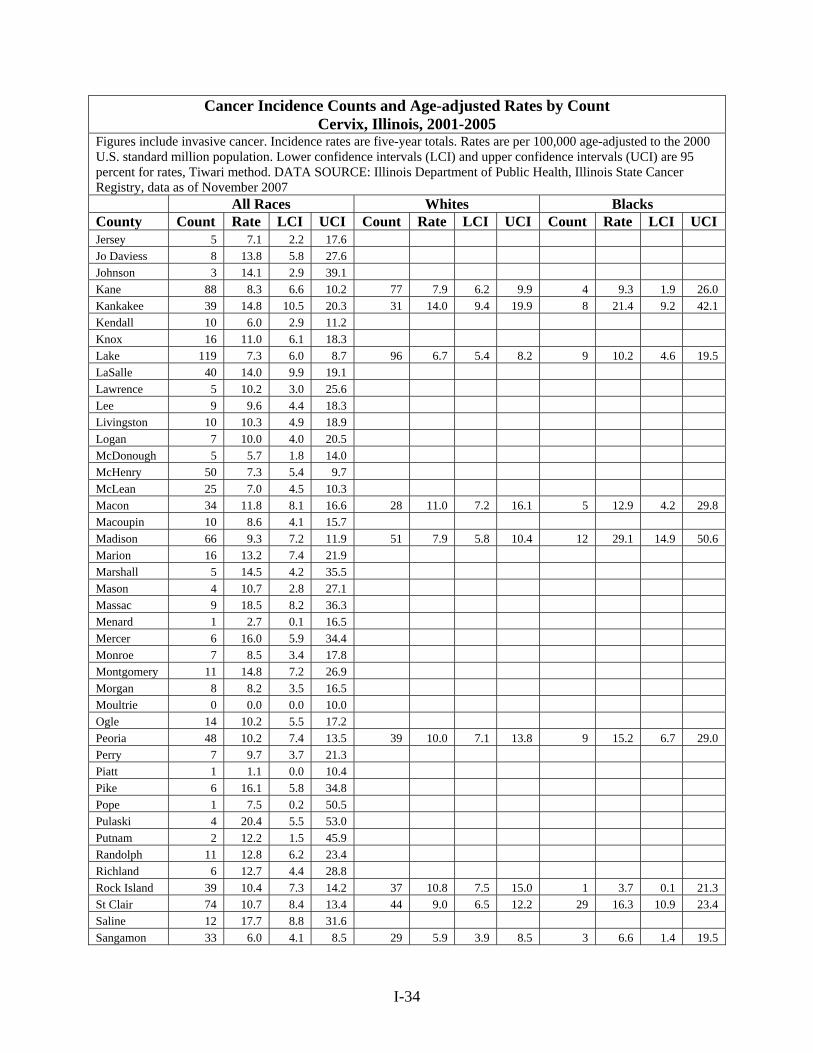
I-34
Cancer Incidence Counts and Age-adjusted Rates by Count Cervix, Illinois, 2001-2005
Figures include invasive cancer. Incidence rates are five-year totals. Rates are per 100,000 age-adjusted to the 2000 U.S. standard million population. Lower confidence intervals (LCI) and upper confidence intervals (UCI) are 95 percent for rates, Tiwari method. DATA SOURCE: Illinois Department of Public Health, Illinois State Cancer Registry, data as of November 2007
All Races Whites Blacks County Count Rate LCI UCI Count Rate LCI UCI Count Rate LCI UCI Jersey 5 7.1 2.2 17.6 Jo Daviess 8 13.8 5.8 27.6 Johnson 3 14.1 2.9 39.1 Kane 88 8.3 6.6 10.2 77 7.9 6.2 9.9 4 9.3 1.9 26.0 Kankakee 39 14.8 10.5 20.3 31 14.0 9.4 19.9 8 21.4 9.2 42.1 Kendall 10 6.0 2.9 11.2 Knox 16 11.0 6.1 18.3 Lake 119 7.3 6.0 8.7 96 6.7 5.4 8.2 9 10.2 4.6 19.5 LaSalle 40 14.0 9.9 19.1 Lawrence 5 10.2 3.0 25.6 Lee 9 9.6 4.4 18.3 Livingston 10 10.3 4.9 18.9 Logan 7 10.0 4.0 20.5 McDonough 5 5.7 1.8 14.0 McHenry 50 7.3 5.4 9.7 McLean 25 7.0 4.5 10.3 Macon 34 11.8 8.1 16.6 28 11.0 7.2 16.1 5 12.9 4.2 29.8 Macoupin 10 8.6 4.1 15.7 Madison 66 9.3 7.2 11.9 51 7.9 5.8 10.4 12 29.1 14.9 50.6 Marion 16 13.2 7.4 21.9 Marshall 5 14.5 4.2 35.5 Mason 4 10.7 2.8 27.1 Massac 9 18.5 8.2 36.3 Menard 1 2.7 0.1 16.5 Mercer 6 16.0 5.9 34.4 Monroe 7 8.5 3.4 17.8 Montgomery 11 14.8 7.2 26.9 Morgan 8 8.2 3.5 16.5 Moultrie 0 0.0 0.0 10.0 Ogle 14 10.2 5.5 17.2 Peoria 48 10.2 7.4 13.5 39 10.0 7.1 13.8 9 15.2 6.7 29.0 Perry 7 9.7 3.7 21.3 Piatt 1 1.1 0.0 10.4 Pike 6 16.1 5.8 34.8 Pope 1 7.5 0.2 50.5 Pulaski 4 20.4 5.5 53.0 Putnam 2 12.2 1.5 45.9 Randolph 11 12.8 6.2 23.4 Richland 6 12.7 4.4 28.8 Rock Island 39 10.4 7.3 14.2 37 10.8 7.5 15.0 1 3.7 0.1 21.3 St Clair 74 10.7 8.4 13.4 44 9.0 6.5 12.2 29 16.3 10.9 23.4 Saline 12 17.7 8.8 31.6 Sangamon 33 6.0 4.1 8.5 29 5.9 3.9 8.5 3 6.6 1.4 19.5
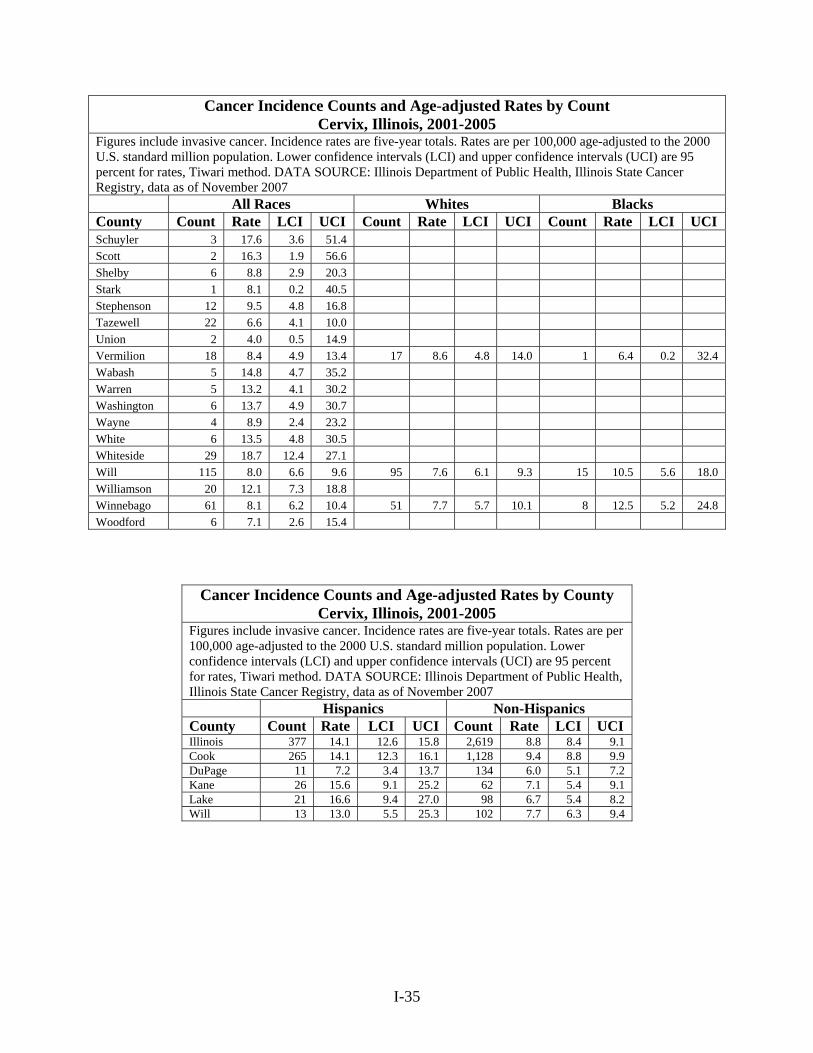
I-35
Cancer Incidence Counts and Age-adjusted Rates by Count Cervix, Illinois, 2001-2005
Figures include invasive cancer. Incidence rates are five-year totals. Rates are per 100,000 age-adjusted to the 2000 U.S. standard million population. Lower confidence intervals (LCI) and upper confidence intervals (UCI) are 95 percent for rates, Tiwari method. DATA SOURCE: Illinois Department of Public Health, Illinois State Cancer Registry, data as of November 2007
All Races Whites Blacks County Count Rate LCI UCI Count Rate LCI UCI Count Rate LCI UCI Schuyler 3 17.6 3.6 51.4 Scott 2 16.3 1.9 56.6 Shelby 6 8.8 2.9 20.3 Stark 1 8.1 0.2 40.5 Stephenson 12 9.5 4.8 16.8 Tazewell 22 6.6 4.1 10.0 Union 2 4.0 0.5 14.9 Vermilion 18 8.4 4.9 13.4 17 8.6 4.8 14.0 1 6.4 0.2 32.4 Wabash 5 14.8 4.7 35.2 Warren 5 13.2 4.1 30.2 Washington 6 13.7 4.9 30.7 Wayne 4 8.9 2.4 23.2 White 6 13.5 4.8 30.5 Whiteside 29 18.7 12.4 27.1 Will 115 8.0 6.6 9.6 95 7.6 6.1 9.3 15 10.5 5.6 18.0 Williamson 20 12.1 7.3 18.8 Winnebago 61 8.1 6.2 10.4 51 7.7 5.7 10.1 8 12.5 5.2 24.8 Woodford 6 7.1 2.6 15.4
Cancer Incidence Counts and Age-adjusted Rates by County Cervix, Illinois, 2001-2005
Figures include invasive cancer. Incidence rates are five-year totals. Rates are per 100,000 age-adjusted to the 2000 U.S. standard million population. Lower confidence intervals (LCI) and upper confidence intervals (UCI) are 95 percent for rates, Tiwari method. DATA SOURCE: Illinois Department of Public Health, Illinois State Cancer Registry, data as of November 2007 Hispanics Non-Hispanics County Count Rate LCI UCI Count Rate LCI UCI Illinois 377 14.1 12.6 15.8 2,619 8.8 8.4 9.1 Cook 265 14.1 12.3 16.1 1,128 9.4 8.8 9.9 DuPage 11 7.2 3.4 13.7 134 6.0 5.1 7.2 Kane 26 15.6 9.1 25.2 62 7.1 5.4 9.1 Lake 21 16.6 9.4 27.0 98 6.7 5.4 8.2 Will 13 13.0 5.5 25.3 102 7.7 6.3 9.4

I-36
Cancer Incidence Counts and Age-adjusted Rates by Count
Prostate, Illinois, 2001-2005 Figures include invasive cancer. Incidence rates are five-year totals. Rates are per 100,000 age-adjusted to the 2000 U.S. standard million population. Lower confidence intervals (LCI) and upper confidence intervals (UCI) are 95 percent for rates, Tiwari method. DATA SOURCE: Illinois Department of Public Health, Illinois State Cancer Registry, data as of November 2007
All Races Whites Blacks County Count Rate LCI UCI Count Rate LCI UCI Count Rate LCI UCI Illinois 42,455 159.5 158.0 161.1 33,643 147.2 145.7 148.8 6,460 218.8 213.3 224.4 Adams 338 179.6 160.9 199.9 Alexander 47 194.3 142.7 258.7 Bond 67 150.7 116.5 191.6 Boone 125 128.7 106.7 153.8 Brown 19 126.7 75.8 198.0 Bureau 134 133.6 111.9 158.5 Calhoun 31 185.9 125.8 267.2 Carroll 79 146.4 115.9 183.3 Cass 42 117.2 84.3 158.7 Champaign 625 195.2 180.1 211.2 561 194.1 178.3 210.9 57 256.9 188.6 339.4 Christian 148 155.8 131.6 183.1 Clark 75 158.6 124.6 199.3 Clay 87 210.2 168.3 259.9 Clinton 122 141.8 117.6 169.5 Coles 191 167.7 144.7 193.3 Cook 17,136 160.0 157.6 162.4 11,132 141.8 139.2 144.5 5,061 217.3 211.1 223.5 Crawford 101 182.5 148.6 222.0 Cumberland 50 175.4 130.0 231.8 DeKalb 282 180.3 159.7 202.7 DeWitt 70 156.8 122.1 198.7 Douglas 71 138.1 107.8 174.4 DuPage 2,733 149.1 143.4 155.0 2,486 149.4 143.4 155.5 67 211.8 149.5 288.7 Edgar 77 145.8 115.0 182.5 Edwards 25 117.2 75.8 175.0 Effingham 177 218.2 187.2 252.9 Fayette 97 173.8 140.8 212.2 Ford 72 181.7 142.1 229.3 Franklin 159 139.9 118.9 163.6 Fulton 187 170.2 146.6 196.6 Gallatin 32 156.6 106.4 224.6 Greene 67 163.9 126.9 208.6 Grundy 136 158.2 132.4 187.4 Hamilton 36 137.1 95.8 191.6 Hancock 119 204.7 169.5 245.4 Hardin 25 162.4 104.7 243.8 Henderson 31 121.5 81.8 175.5 Henry 211 150.8 131.1 172.7 Iroquois 138 150.0 126.0 177.6 Jackson 181 167.3 143.8 193.6 Jasper 50 179.8 133.4 237.7 Jefferson 174 166.7 142.7 193.5
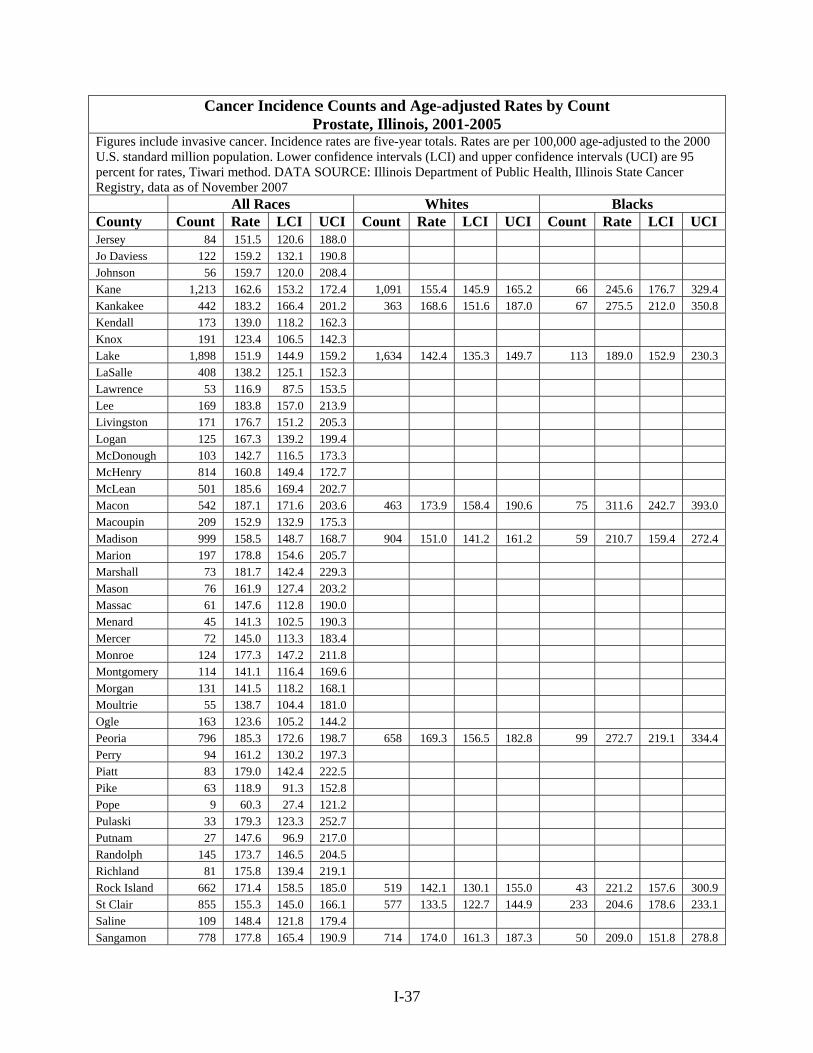
I-37
Cancer Incidence Counts and Age-adjusted Rates by Count Prostate, Illinois, 2001-2005
Figures include invasive cancer. Incidence rates are five-year totals. Rates are per 100,000 age-adjusted to the 2000 U.S. standard million population. Lower confidence intervals (LCI) and upper confidence intervals (UCI) are 95 percent for rates, Tiwari method. DATA SOURCE: Illinois Department of Public Health, Illinois State Cancer Registry, data as of November 2007
All Races Whites Blacks County Count Rate LCI UCI Count Rate LCI UCI Count Rate LCI UCI Jersey 84 151.5 120.6 188.0 Jo Daviess 122 159.2 132.1 190.8 Johnson 56 159.7 120.0 208.4 Kane 1,213 162.6 153.2 172.4 1,091 155.4 145.9 165.2 66 245.6 176.7 329.4 Kankakee 442 183.2 166.4 201.2 363 168.6 151.6 187.0 67 275.5 212.0 350.8 Kendall 173 139.0 118.2 162.3 Knox 191 123.4 106.5 142.3 Lake 1,898 151.9 144.9 159.2 1,634 142.4 135.3 149.7 113 189.0 152.9 230.3 LaSalle 408 138.2 125.1 152.3 Lawrence 53 116.9 87.5 153.5 Lee 169 183.8 157.0 213.9 Livingston 171 176.7 151.2 205.3 Logan 125 167.3 139.2 199.4 McDonough 103 142.7 116.5 173.3 McHenry 814 160.8 149.4 172.7 McLean 501 185.6 169.4 202.7 Macon 542 187.1 171.6 203.6 463 173.9 158.4 190.6 75 311.6 242.7 393.0 Macoupin 209 152.9 132.9 175.3 Madison 999 158.5 148.7 168.7 904 151.0 141.2 161.2 59 210.7 159.4 272.4 Marion 197 178.8 154.6 205.7 Marshall 73 181.7 142.4 229.3 Mason 76 161.9 127.4 203.2 Massac 61 147.6 112.8 190.0 Menard 45 141.3 102.5 190.3 Mercer 72 145.0 113.3 183.4 Monroe 124 177.3 147.2 211.8 Montgomery 114 141.1 116.4 169.6 Morgan 131 141.5 118.2 168.1 Moultrie 55 138.7 104.4 181.0 Ogle 163 123.6 105.2 144.2 Peoria 796 185.3 172.6 198.7 658 169.3 156.5 182.8 99 272.7 219.1 334.4 Perry 94 161.2 130.2 197.3 Piatt 83 179.0 142.4 222.5 Pike 63 118.9 91.3 152.8 Pope 9 60.3 27.4 121.2 Pulaski 33 179.3 123.3 252.7 Putnam 27 147.6 96.9 217.0 Randolph 145 173.7 146.5 204.5 Richland 81 175.8 139.4 219.1 Rock Island 662 171.4 158.5 185.0 519 142.1 130.1 155.0 43 221.2 157.6 300.9 St Clair 855 155.3 145.0 166.1 577 133.5 122.7 144.9 233 204.6 178.6 233.1 Saline 109 148.4 121.8 179.4 Sangamon 778 177.8 165.4 190.9 714 174.0 161.3 187.3 50 209.0 151.8 278.8

I-38
Cancer Incidence Counts and Age-adjusted Rates by Count Prostate, Illinois, 2001-2005
Figures include invasive cancer. Incidence rates are five-year totals. Rates are per 100,000 age-adjusted to the 2000 U.S. standard million population. Lower confidence intervals (LCI) and upper confidence intervals (UCI) are 95 percent for rates, Tiwari method. DATA SOURCE: Illinois Department of Public Health, Illinois State Cancer Registry, data as of November 2007
All Races Whites Blacks County Count Rate LCI UCI Count Rate LCI UCI Count Rate LCI UCI Schuyler 20 91.7 55.9 143.5 Scott 17 108.5 63.1 175.6 Shelby 111 160.9 132.3 194.2 Stark 21 112.1 69.2 173.5 Stephenson 172 130.0 111.2 151.1 Tazewell 626 185.3 171.0 200.6 Union 57 109.1 82.4 142.1 Vermilion 337 151.3 135.6 168.5 293 140.7 125.0 157.9 27 199.9 131.2 289.0 Wabash 38 109.7 77.6 151.0 Warren 66 131.7 101.8 168.1 Washington 62 146.7 112.4 188.5 Wayne 75 150.9 118.6 189.8 White 48 99.1 73.0 132.4 Whiteside 227 138.6 121.1 157.9 Will 1,661 169.4 161.0 178.1 1,349 151.4 143.1 160.0 180 242.8 204.8 285.2 Williamson 230 135.4 118.4 154.2 Winnebago 844 130.9 122.1 140.1 732 122.6 113.8 131.9 89 230.7 182.2 287.0 Woodford 157 172.5 146.4 202.0
Cancer Incidence Counts and Age-adjusted Rates by County Prostate, Illinois, 2001-2005
Figures include invasive cancer. Incidence rates are five-year totals. Rates are per 100,000 age-adjusted to the 2000 U.S. standard million population. Lower confidence intervals (LCI) and upper confidence intervals (UCI) are 95 percent for rates, Tiwari method. DATA SOURCE: Illinois Department of Public Health, Illinois State Cancer Registry, data as of November 2007 Hispanics Non-Hispanics County Count Rate LCI UCI Count Rate LCI UCI Illinois 1,647 118.4 112.2 124.9 40,808 162.2 160.6 163.8 Cook 1,199 120.3 112.9 128.0 15,937 164.9 162.4 167.5 DuPage 99 160.7 127.3 199.1 2,634 149.1 143.2 155.1 Kane 64 87.6 65.0 114.6 1,149 170.9 160.8 181.4 Lake 64 96.0 69.8 127.5 1,834 155.3 148.0 162.8 Will 62 134.8 99.4 177.2 1,599 171.4 162.8 180.4