section ecologists study relationships 13.1 …mrjsbiologyclass.weebly.com/uploads/1/1/3/5/... ·...
TRANSCRIPT
SECTION
13.1ECOLOGISTS STUDY RELATIONSHIPS
Study Guide
KEY CONCEPT
Ecology is the study of the relationships among organismsand their environment.
VOCABULARYecology ecosystemcommunity biome
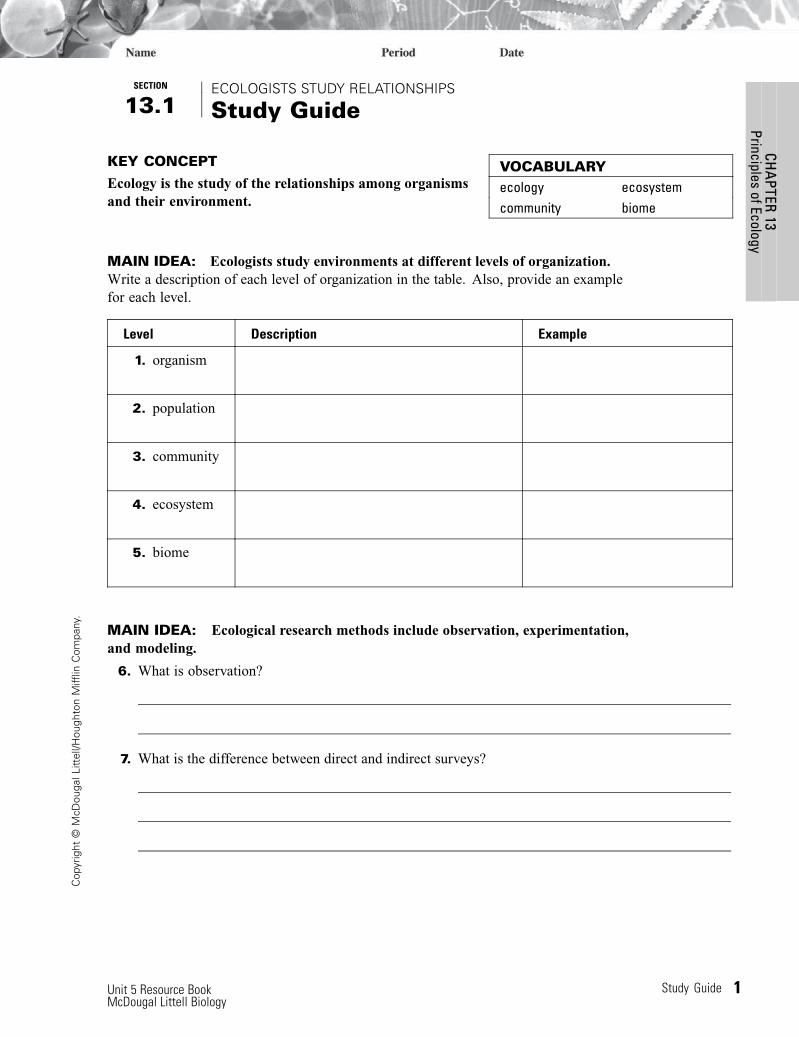
MAIN IDEA: Ecologists study environments at different levels of organization.Write a description of each level of organization in the table. Also, provide an examplefor each level.
Level Description Example
1. organism
2. population
3. community
4. ecosystem
5. biome
MAIN IDEA: Ecological research methods include observation, experimentation,and modeling.
6. What is observation?
7. What is the difference between direct and indirect surveys?
Unit 5 Resource Book Study Guide 1McDougal Littell Biology
Cop
yrig
ht©
McD
ouga
lLitt
ell/H
ough
ton
Miff
linC
ompa
ny.
CHA
PTER13
PrinciplesofEcology
STUDY GUIDE, CONTINUED
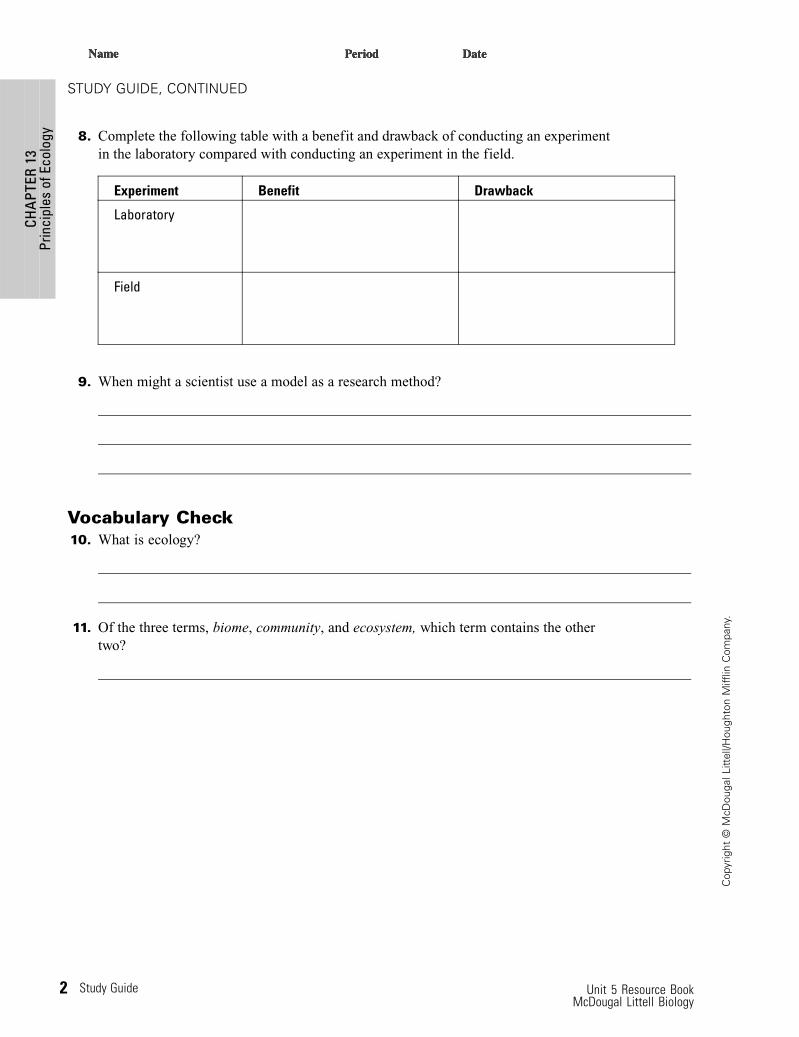
8. Complete the following table with a benefit and drawback of conducting an experimentin the laboratory compared with conducting an experiment in the field.
Experiment Benefit Drawback
Laboratory
Field
9. When might a scientist use a model as a research method?
Vocabulary Check10. What is ecology?
11. Of the three terms, biome, community, and ecosystem, which term contains the othertwo?
2 Study Guide Unit 5 Resource BookMcDougal Littell Biology
CHA
PTER
13Pr
inci
ples
ofEc
olog
y
Cop
yrig
ht©
McD
ouga
lLitt
ell/H
ough
ton
Miff
linC
ompa
ny.
SECTION
13.1ECOLOGISTS STUDY RELATIONSHIPS
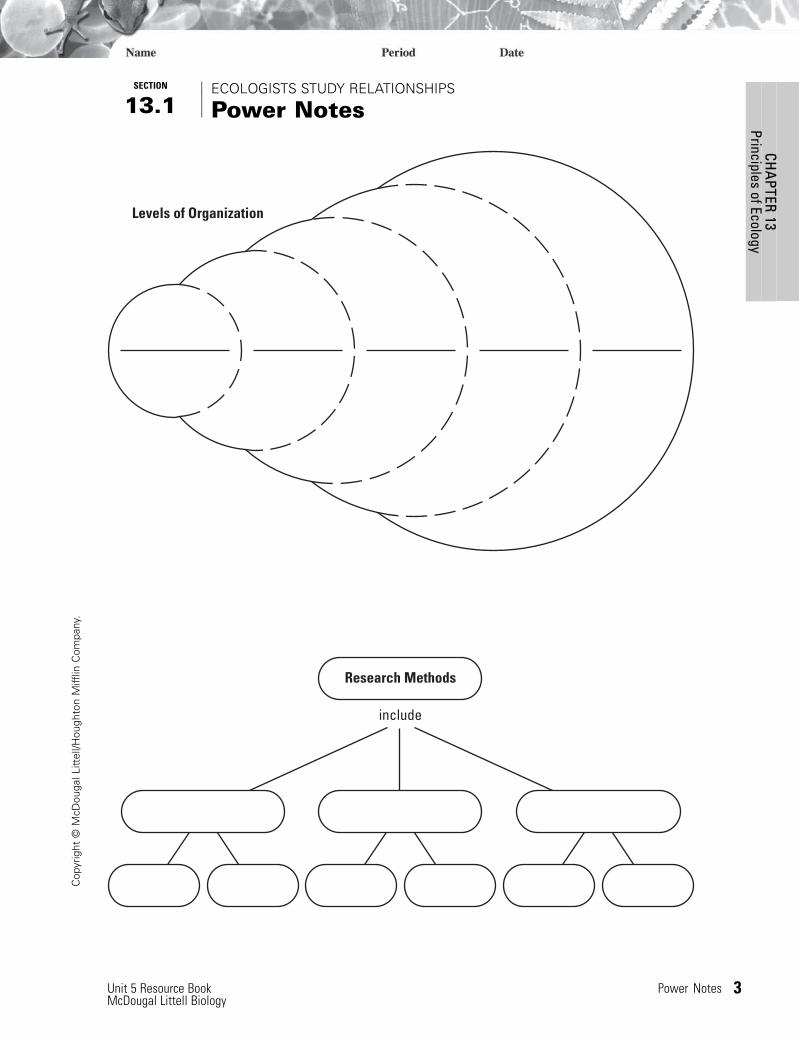
Power Notes
Levels of Organization
include
Research Methods
Unit 5 Resource Book Power Notes 3McDougal Littell Biology
Cop
yrig
ht©
McD
ouga
lLitt
ell/H
ough
ton
Miff
linC
ompa
ny.
CHA
PTER13
PrinciplesofEcology
SECTION
13.1ECOLOGISTS STUDY RELATIONSHIPS
Reinforcement
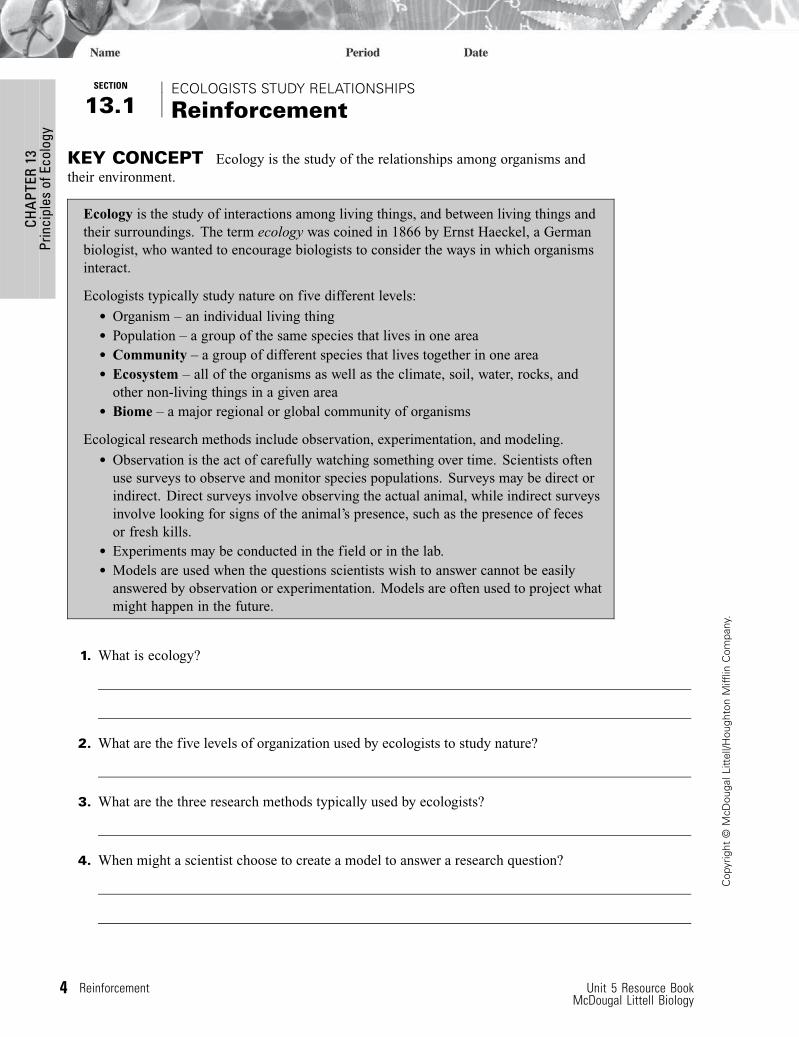
KEY CONCEPT Ecology is the study of the relationships among organisms andtheir environment.
Ecology is the study of interactions among living things, and between living things andtheir surroundings. The term ecology was coined in 1866 by Ernst Haeckel, a Germanbiologist, who wanted to encourage biologists to consider the ways in which organismsinteract.
Ecologists typically study nature on five different levels:
• Organism – an individual living thing• Population – a group of the same species that lives in one area• Community – a group of different species that lives together in one area• Ecosystem – all of the organisms as well as the climate, soil, water, rocks, and
other non-living things in a given area• Biome – a major regional or global community of organisms
Ecological research methods include observation, experimentation, and modeling.
• Observation is the act of carefully watching something over time. Scientists oftenuse surveys to observe and monitor species populations. Surveys may be direct orindirect. Direct surveys involve observing the actual animal, while indirect surveysinvolve looking for signs of the animal’s presence, such as the presence of fecesor fresh kills.
• Experiments may be conducted in the field or in the lab.• Models are used when the questions scientists wish to answer cannot be easily
answered by observation or experimentation. Models are often used to project whatmight happen in the future.
1. What is ecology?
2. What are the five levels of organization used by ecologists to study nature?
3. What are the three research methods typically used by ecologists?
4. When might a scientist choose to create a model to answer a research question?
4 Reinforcement Unit 5 Resource BookMcDougal Littell Biology
CHA
PTER
13Pr
inci
ples
ofEc
olog
y
Cop
yrig
ht©
McD
ouga
lLitt
ell/H
ough
ton
Miff
linC
ompa
ny.
SECTION
13.2BIOTIC AND ABIOTIC FACTORS
Study Guide
KEY CONCEPT
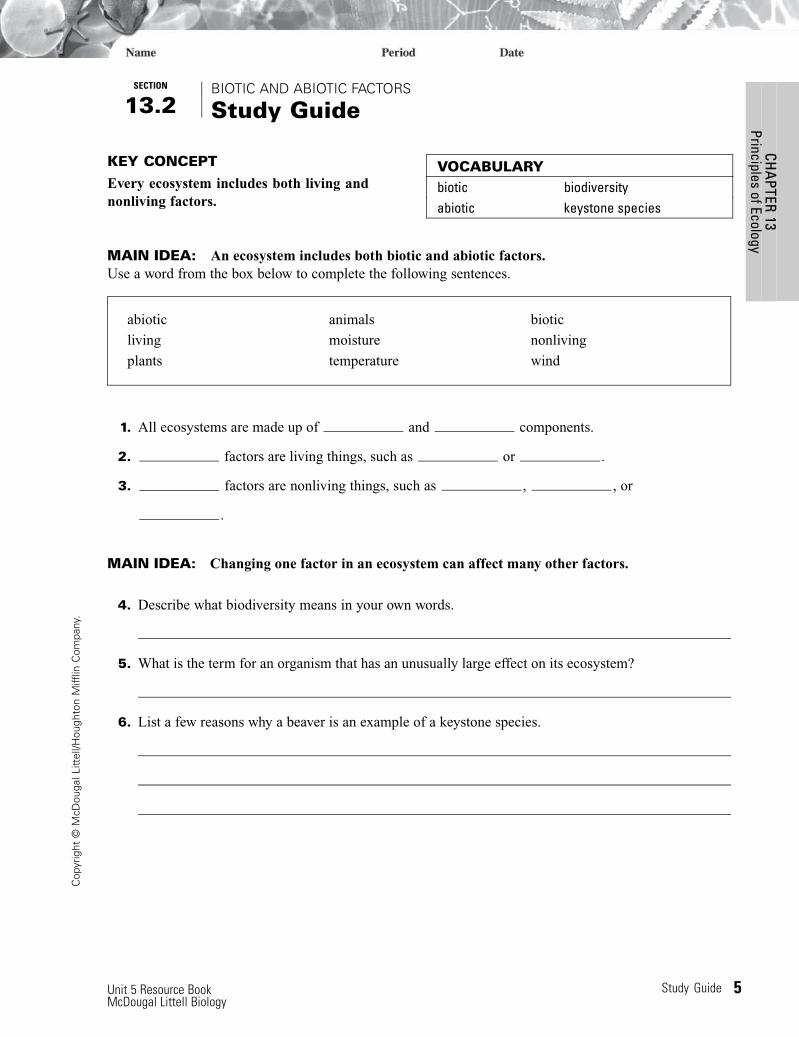
Every ecosystem includes both living andnonliving factors.
VOCABULARYbiotic biodiversityabiotic keystone species
MAIN IDEA: An ecosystem includes both biotic and abiotic factors.Use a word from the box below to complete the following sentences.
abiotic
living
plants
animals
moisture
temperature
biotic
nonliving
wind
1. All ecosystems are made up of and components.
2. factors are living things, such as or .
3. factors are nonliving things, such as , , or
.
MAIN IDEA: Changing one factor in an ecosystem can affect many other factors.
4. Describe what biodiversity means in your own words.
5. What is the term for an organism that has an unusually large effect on its ecosystem?
6. List a few reasons why a beaver is an example of a keystone species.
Unit 5 Resource Book Study Guide 5McDougal Littell Biology
Cop
yrig
ht©
McD
ouga
lLitt
ell/H
ough
ton
Miff
linC
ompa
ny.
CHA
PTER13
PrinciplesofEcology
STUDY GUIDE, CONTINUED
Vocabulary Check7. What is the difference between a biotic and an abiotic factor?
8. Take another look at the Visual Vocab on page 403. In architecture, a keystone is thestone at the center of an arch that holds the arch together. How does this definitionrelate to a keystone species?
Be CreativeIn the box below, sketch a simple ecosystem and label the abiotic and biotic factors.
6 Study Guide Unit 5 Resource BookMcDougal Littell Biology
CHA
PTER
13Pr
inci
ples
ofEc
olog
y
Cop
yrig
ht©
McD
ouga
lLitt
ell/H
ough
ton
Miff
linC
ompa
ny.
SECTION
13.2BIOTIC AND ABIOTIC FACTORS
Power Notes
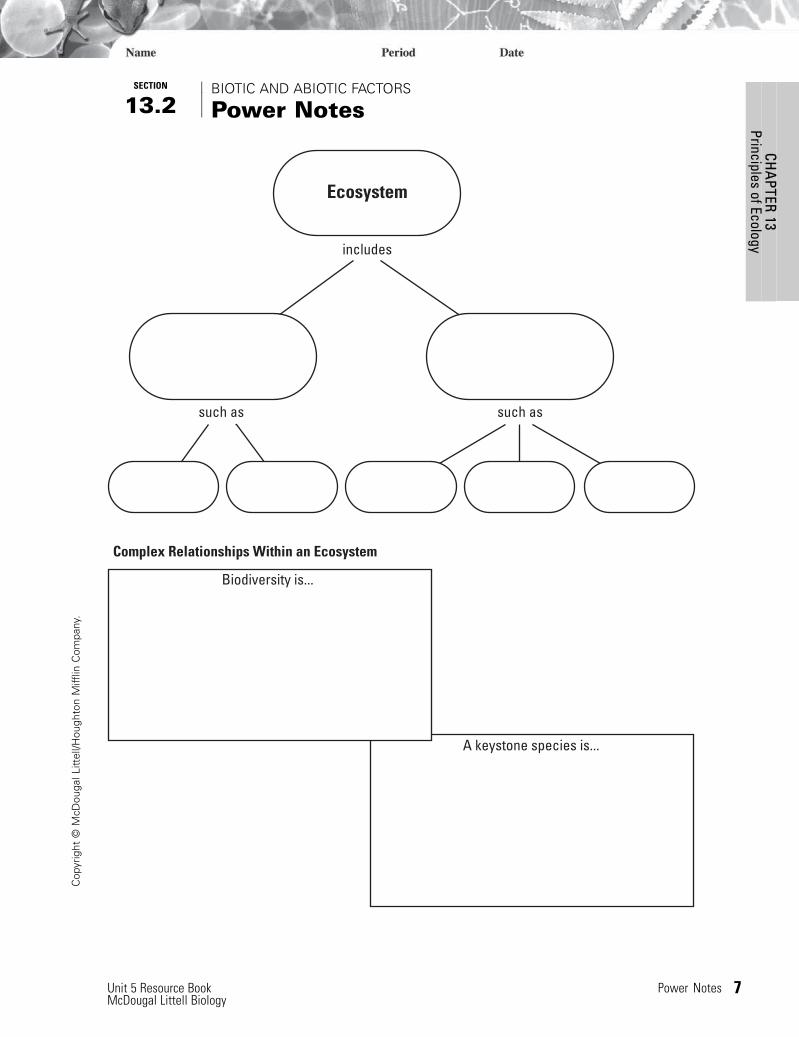
Complex Relationships Within an Ecosystem
Ecosystem
includes
such as such as
A keystone species is...
Biodiversity is...
Unit 5 Resource Book Power Notes 7McDougal Littell Biology
Cop
yrig
ht©
McD
ouga
lLitt
ell/H
ough
ton
Miff
linC
ompa
ny.
CHA
PTER13
PrinciplesofEcology
SECTION
13.2BIOTIC AND ABIOTIC FACTORS
Reinforcement
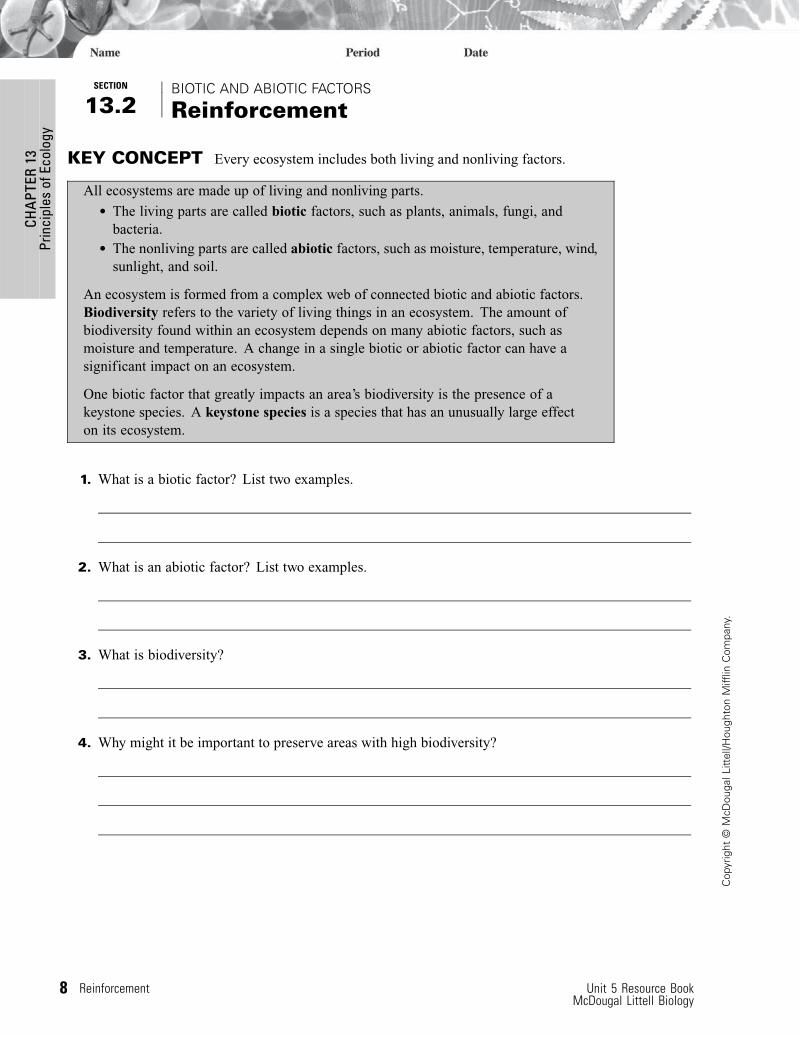
KEY CONCEPT Every ecosystem includes both living and nonliving factors.
All ecosystems are made up of living and nonliving parts.
• The living parts are called biotic factors, such as plants, animals, fungi, andbacteria.
• The nonliving parts are called abiotic factors, such as moisture, temperature, wind,sunlight, and soil.
An ecosystem is formed from a complex web of connected biotic and abiotic factors.Biodiversity refers to the variety of living things in an ecosystem. The amount ofbiodiversity found within an ecosystem depends on many abiotic factors, such asmoisture and temperature. A change in a single biotic or abiotic factor can have asignificant impact on an ecosystem.
One biotic factor that greatly impacts an area’s biodiversity is the presence of akeystone species. A keystone species is a species that has an unusually large effecton its ecosystem.
1. What is a biotic factor? List two examples.
2. What is an abiotic factor? List two examples.
3. What is biodiversity?
4. Why might it be important to preserve areas with high biodiversity?
8 Reinforcement Unit 5 Resource BookMcDougal Littell Biology
CHA
PTER
13Pr
inci
ples
ofEc
olog
y
Cop
yrig
ht©
McD
ouga
lLitt
ell/H
ough
ton
Miff
linC
ompa
ny.
SECTION
13.3ENERGY IN ECOSYSTEMS
Study Guide
KEY CONCEPT
Life in an ecosystem requires a source of energy.VOCABULARYproducer heterotrophautotroph chemosynthesisconsumer
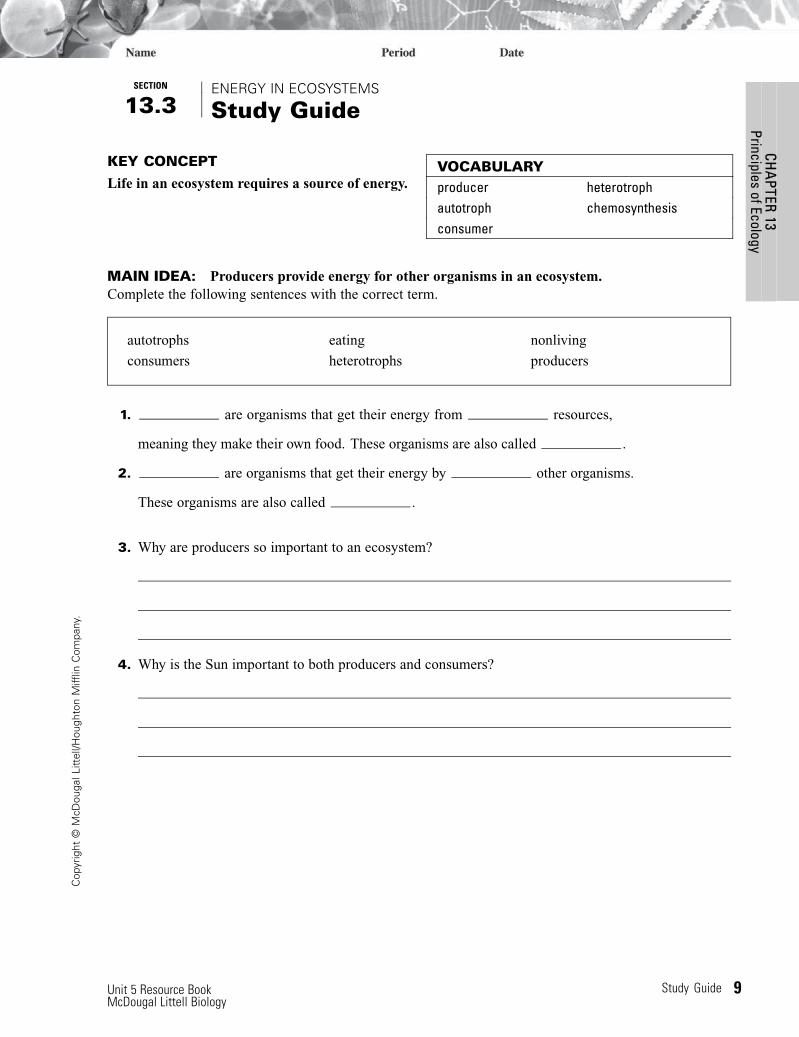
MAIN IDEA: Producers provide energy for other organisms in an ecosystem.Complete the following sentences with the correct term.
autotrophs
consumers
eating
heterotrophs
nonliving
producers
1. are organisms that get their energy from resources,
meaning they make their own food. These organisms are also called .
2. are organisms that get their energy by other organisms.
These organisms are also called .
3. Why are producers so important to an ecosystem?
4. Why is the Sun important to both producers and consumers?
Unit 5 Resource Book Study Guide 9McDougal Littell Biology
Cop
yrig
ht©
McD
ouga
lLitt
ell/H
ough
ton
Miff
linC
ompa
ny.
CHA
PTER13
PrinciplesofEcology
STUDY GUIDE, CONTINUED
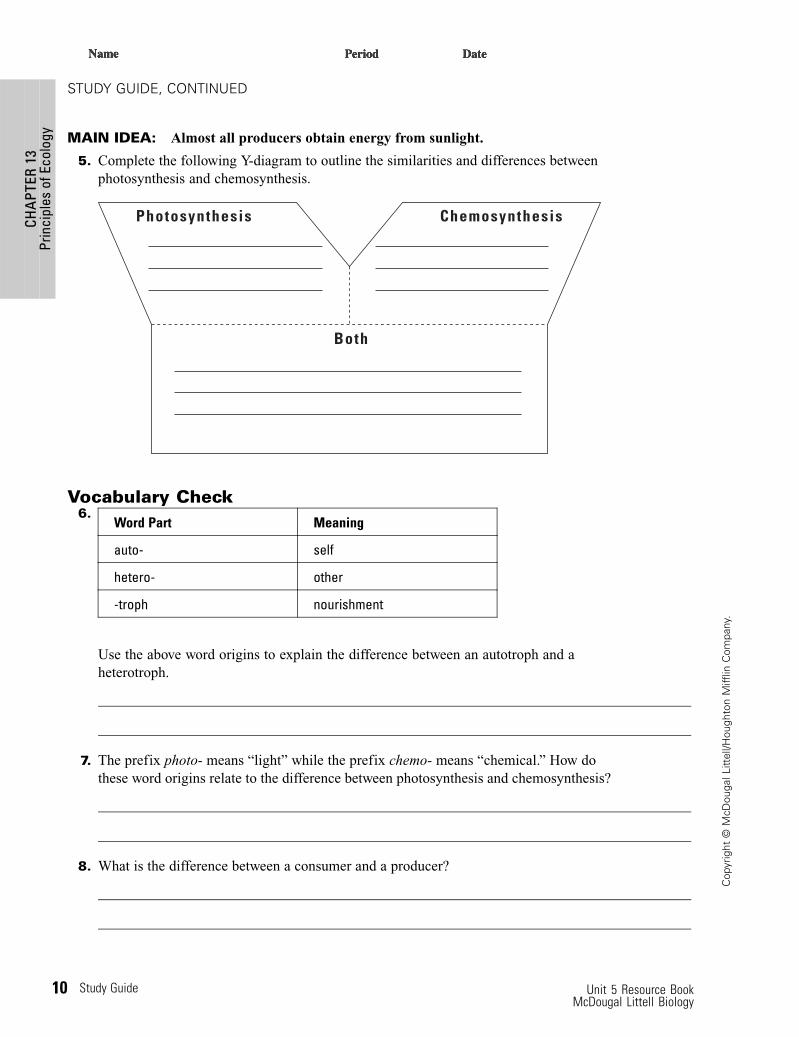
MAIN IDEA: Almost all producers obtain energy from sunlight.
5. Complete the following Y-diagram to outline the similarities and differences betweenphotosynthesis and chemosynthesis.
Photosyn thesis
Both
Chemosyn thesis
Vocabulary Check6.
Word Part Meaning
auto- self
hetero- other
-troph nourishment
Use the above word origins to explain the difference between an autotroph and aheterotroph.
7. The prefix photo- means “light” while the prefix chemo- means “chemical.” How dothese word origins relate to the difference between photosynthesis and chemosynthesis?
8. What is the difference between a consumer and a producer?
10 Study Guide Unit 5 Resource BookMcDougal Littell Biology
CHA
PTER
13Pr
inci
ples
ofEc
olog
y
Cop
yrig
ht©
McD
ouga
lLitt
ell/H
ough
ton
Miff
linC
ompa
ny.
SECTION
13.3ENERGY IN ECOSYSTEMS
Power Notes
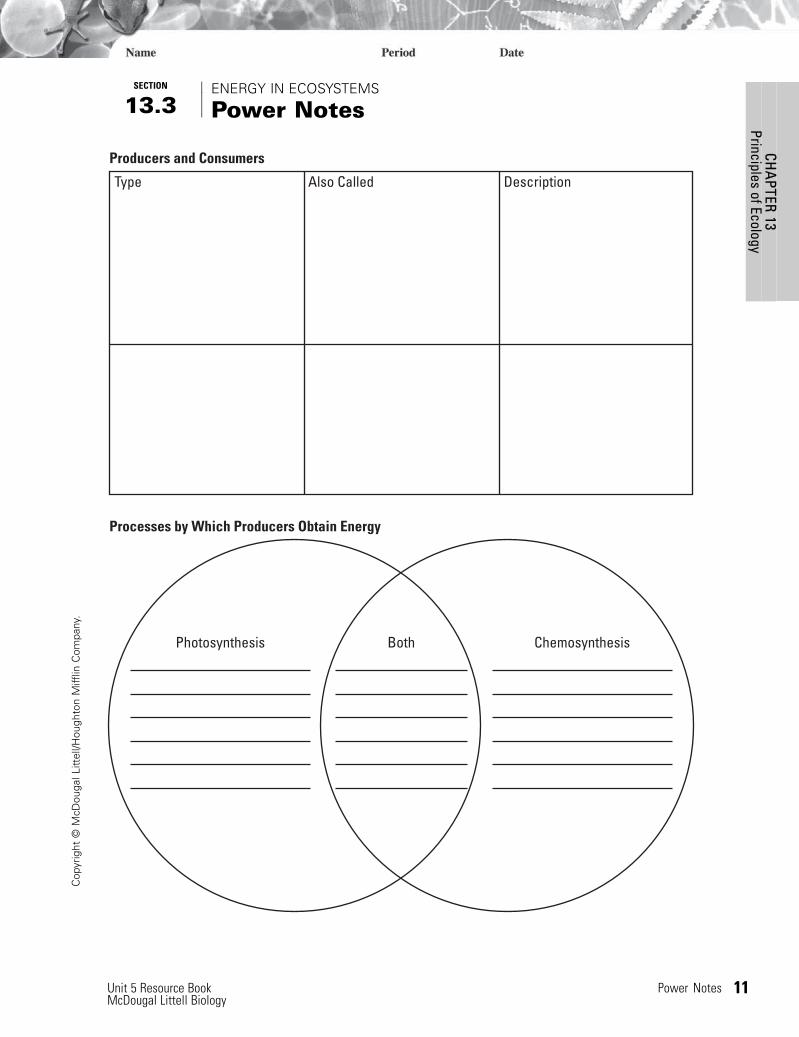
Producers and Consumers
Processes by Which Producers Obtain Energy
Type Also Called Description
BothPhotosynthesis Chemosynthesis
Unit 5 Resource Book Power Notes 11McDougal Littell Biology
Cop
yrig
ht©
McD
ouga
lLitt
ell/H
ough
ton
Miff
linC
ompa
ny.
CHA
PTER13
PrinciplesofEcology
SECTION
13.3ENERGY IN ECOSYSTEMS
Reinforcement
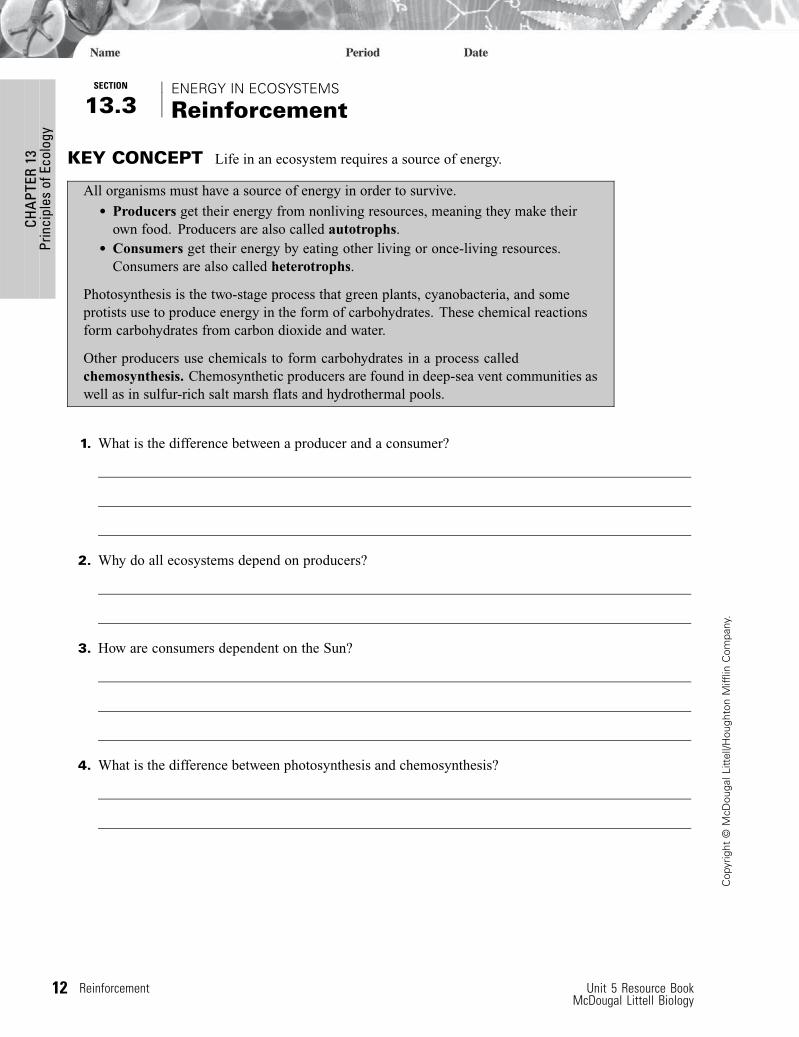
KEY CONCEPT Life in an ecosystem requires a source of energy.
All organisms must have a source of energy in order to survive.
• Producers get their energy from nonliving resources, meaning they make theirown food. Producers are also called autotrophs.
• Consumers get their energy by eating other living or once-living resources.Consumers are also called heterotrophs.
Photosynthesis is the two-stage process that green plants, cyanobacteria, and someprotists use to produce energy in the form of carbohydrates. These chemical reactionsform carbohydrates from carbon dioxide and water.
Other producers use chemicals to form carbohydrates in a process calledchemosynthesis. Chemosynthetic producers are found in deep-sea vent communities aswell as in sulfur-rich salt marsh flats and hydrothermal pools.
1. What is the difference between a producer and a consumer?
2. Why do all ecosystems depend on producers?
3. How are consumers dependent on the Sun?
4. What is the difference between photosynthesis and chemosynthesis?
12 Reinforcement Unit 5 Resource BookMcDougal Littell Biology
CHA
PTER
13Pr
inci
ples
ofEc
olog
y
Cop
yrig
ht©
McD
ouga
lLitt
ell/H
ough
ton
Miff
linC
ompa
ny.
SECTION
13.4FOOD CHAINS AND FOOD WEBS
Study Guide
KEY CONCEPT
Food chains and food webs model theflow of energy in an ecosystem.
VOCABULARYfood chain decomposerherbivore specialistcarnivore generalistomnivore trophic leveldetritivore food web
MAIN IDEA: A food chain is a model that shows a sequence of feeding relationships.Complete the following sentence with the correct terms.
1. A food chain follows the connection between one and a single chain of
within an .
Choose the correct term from the box below to fit each description.
carnivore
decomposer
detritivore
herbivore
omnivore
primary consumer
secondary consumer
tertiary consumer
trophic levels
2. I eat only plants. I am a(n) .
3. I eat only other animals. I am a(n) .
4. I eat both plants and animals. I am a(n) .
5. I eat dead organic matter. I am a(n) .
6. I break down organic matter into simpler compounds. I am a(n) .
7. I am the first consumer above the producer level. I am a(n) .
8. I am a carnivore that eats herbivores. I am a(n) .
9. I am a carnivore that eats other carnivores. I am a(n) .
10. The levels of nourishment in a food chain are called .
Unit 5 Resource Book Study Guide 13McDougal Littell Biology
Cop
yrig
ht©
McD
ouga
lLitt
ell/H
ough
ton
Miff
linC
ompa
ny.
CHA
PTER13
PrinciplesofEcology
STUDY GUIDE, CONTINUED
MAIN IDEA: A food web shows a complex network of feeding relationships.
11. How is a food web different from a food chain?
12. What happens to energy at each link in a food web?
13. What type of organism provides the base of a food web?
Vocabulary Check14. Use your knowledge of the words special and general to explain the diets of a specialist
and a generalist.
15.Word Part Meaning
herba vegetation
carnus flesh
omnis all
Use the word origins to explain the diets of each of the following consumers: herbivores,carnivores, and omnivores.
14 Study Guide Unit 5 Resource BookMcDougal Littell Biology
CHA
PTER
13Pr
inci
ples
ofEc
olog
y
Cop
yrig
ht©
McD
ouga
lLitt
ell/H
ough
ton
Miff
linC
ompa
ny.
SECTION
13.4FOOD CHAINS AND FOOD WEBS
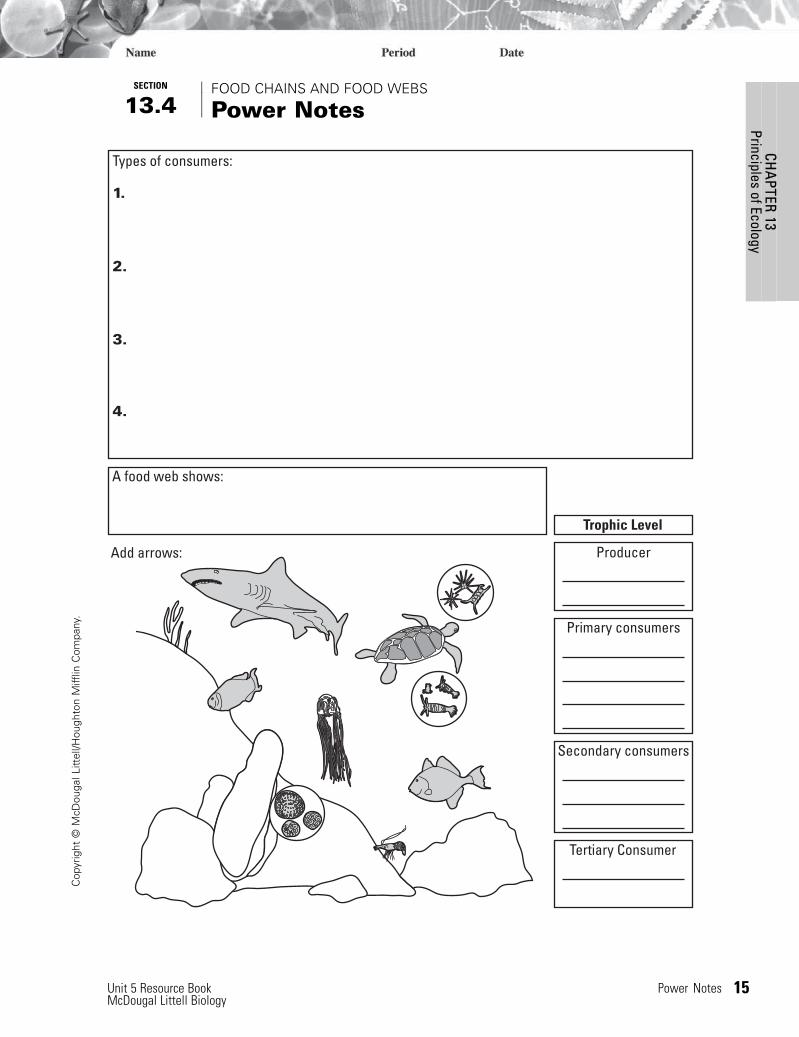
Power Notes
Add arrows:
Types of consumers:
A food web shows:
Trophic Level
Producer
1.
4.
3.
2.
Tertiary Consumer
Primary consumers
Secondary consumers
Unit 5 Resource Book Power Notes 15McDougal Littell Biology
Cop
yrig
ht©
McD
ouga
lLitt
ell/H
ough
ton
Miff
linC
ompa
ny.
CHA
PTER13
PrinciplesofEcology
SECTION
13.4FOOD CHAINS AND FOOD WEBS
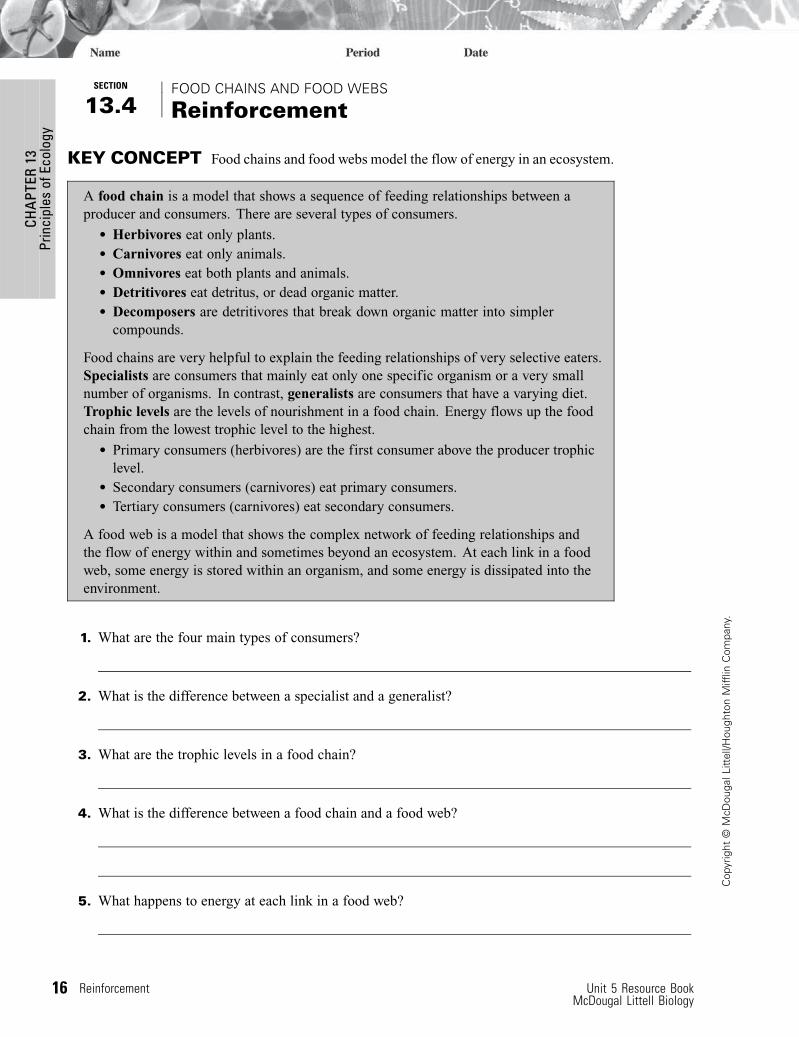
Reinforcement
KEY CONCEPT Food chains and food webs model the flow of energy in an ecosystem.
A food chain is a model that shows a sequence of feeding relationships between aproducer and consumers. There are several types of consumers.
• Herbivores eat only plants.• Carnivores eat only animals.• Omnivores eat both plants and animals.• Detritivores eat detritus, or dead organic matter.• Decomposers are detritivores that break down organic matter into simpler
compounds.
Food chains are very helpful to explain the feeding relationships of very selective eaters.Specialists are consumers that mainly eat only one specific organism or a very smallnumber of organisms. In contrast, generalists are consumers that have a varying diet.Trophic levels are the levels of nourishment in a food chain. Energy flows up the foodchain from the lowest trophic level to the highest.
• Primary consumers (herbivores) are the first consumer above the producer trophiclevel.
• Secondary consumers (carnivores) eat primary consumers.• Tertiary consumers (carnivores) eat secondary consumers.
A food web is a model that shows the complex network of feeding relationships andthe flow of energy within and sometimes beyond an ecosystem. At each link in a foodweb, some energy is stored within an organism, and some energy is dissipated into theenvironment.
1. What are the four main types of consumers?
2. What is the difference between a specialist and a generalist?
3. What are the trophic levels in a food chain?
4. What is the difference between a food chain and a food web?
5. What happens to energy at each link in a food web?
16 Reinforcement Unit 5 Resource BookMcDougal Littell Biology
CHA
PTER
13Pr
inci
ples
ofEc
olog
y
Cop
yrig
ht©
McD
ouga
lLitt
ell/H
ough
ton
Miff
linC
ompa
ny.
SECTION
13.5CYCLING OF MATTER
Study Guide
KEY CONCEPT
Matter cycles in and out of an ecosystem.VOCABULARYhydrologic cyclebiogeochemical cyclenitrogen fixation
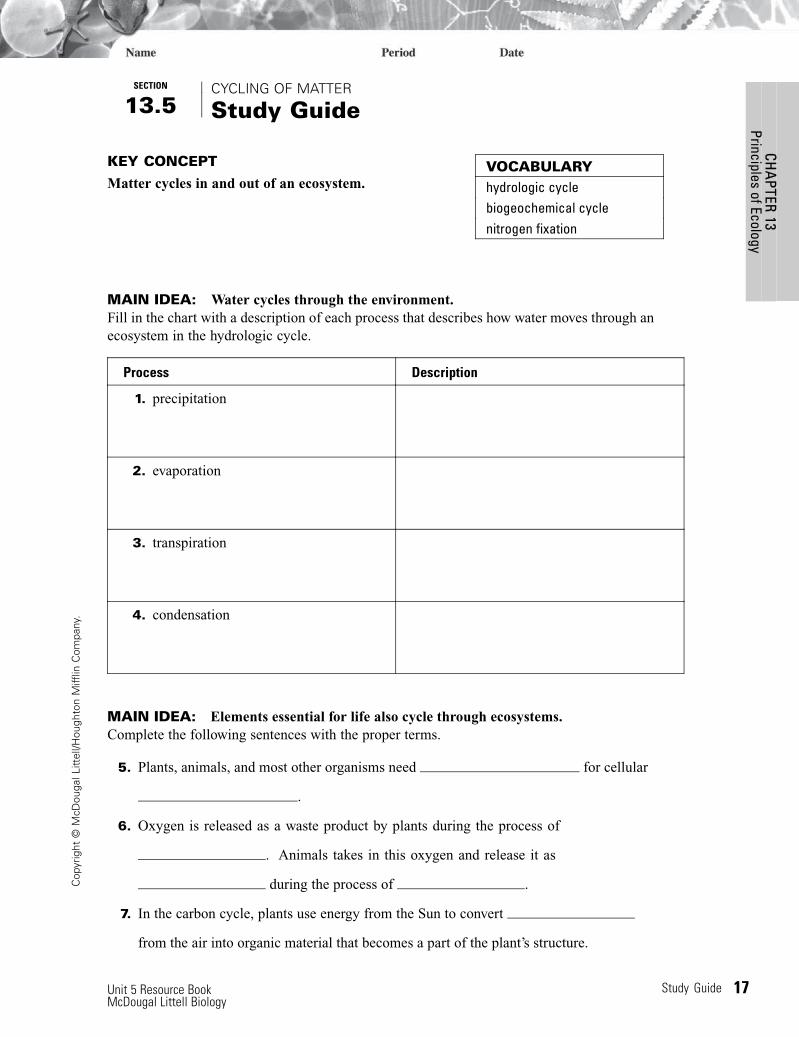
MAIN IDEA: Water cycles through the environment.Fill in the chart with a description of each process that describes how water moves through anecosystem in the hydrologic cycle.
Process Description
1. precipitation
2. evaporation
3. transpiration
4. condensation
MAIN IDEA: Elements essential for life also cycle through ecosystems.Complete the following sentences with the proper terms.
5. Plants, animals, and most other organisms need for cellular
.
6. Oxygen is released as a waste product by plants during the process of
. Animals takes in this oxygen and release it as
during the process of .
7. In the carbon cycle, plants use energy from the Sun to convert
from the air into organic material that becomes a part of the plant’s structure.
Unit 5 Resource Book Study Guide 17McDougal Littell Biology
Cop
yrig
ht©
McD
ouga
lLitt
ell/H
ough
ton
Miff
linC
ompa
ny.
CHA
PTER13
PrinciplesofEcology
STUDY GUIDE, CONTINUED
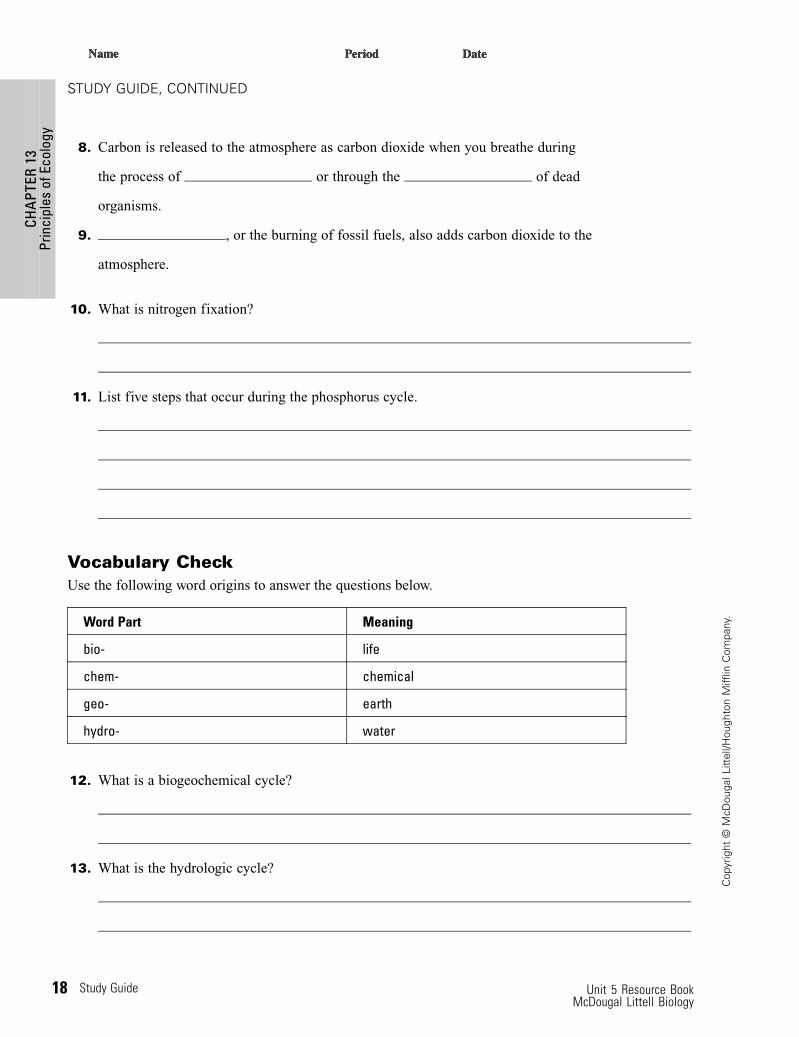
8. Carbon is released to the atmosphere as carbon dioxide when you breathe during
the process of or through the of dead
organisms.
9. , or the burning of fossil fuels, also adds carbon dioxide to the
atmosphere.
10. What is nitrogen fixation?
11. List five steps that occur during the phosphorus cycle.
Vocabulary CheckUse the following word origins to answer the questions below.
Word Part Meaning
bio- life
chem- chemical
geo- earth
hydro- water
12. What is a biogeochemical cycle?
13. What is the hydrologic cycle?
18 Study Guide Unit 5 Resource BookMcDougal Littell Biology
CHA
PTER
13Pr
inci
ples
ofEc
olog
y
Cop
yrig
ht©
McD
ouga
lLitt
ell/H
ough
ton
Miff
linC
ompa
ny.

SECTION
13.5CYCLING OF MATTER
Power Notes
Oxygen cycle: Carbon cycle:
Nitrogen cycle: Phosphorus cycle:
Hydrologic cycle:
Unit 5 Resource Book Power Notes 19McDougal Littell Biology
Cop
yrig
ht©
McD
ouga
lLitt
ell/H
ough
ton
Miff
linC
ompa
ny.
CHA
PTER13
PrinciplesofEcology
SECTION
13.5CYCLING OF MATTER
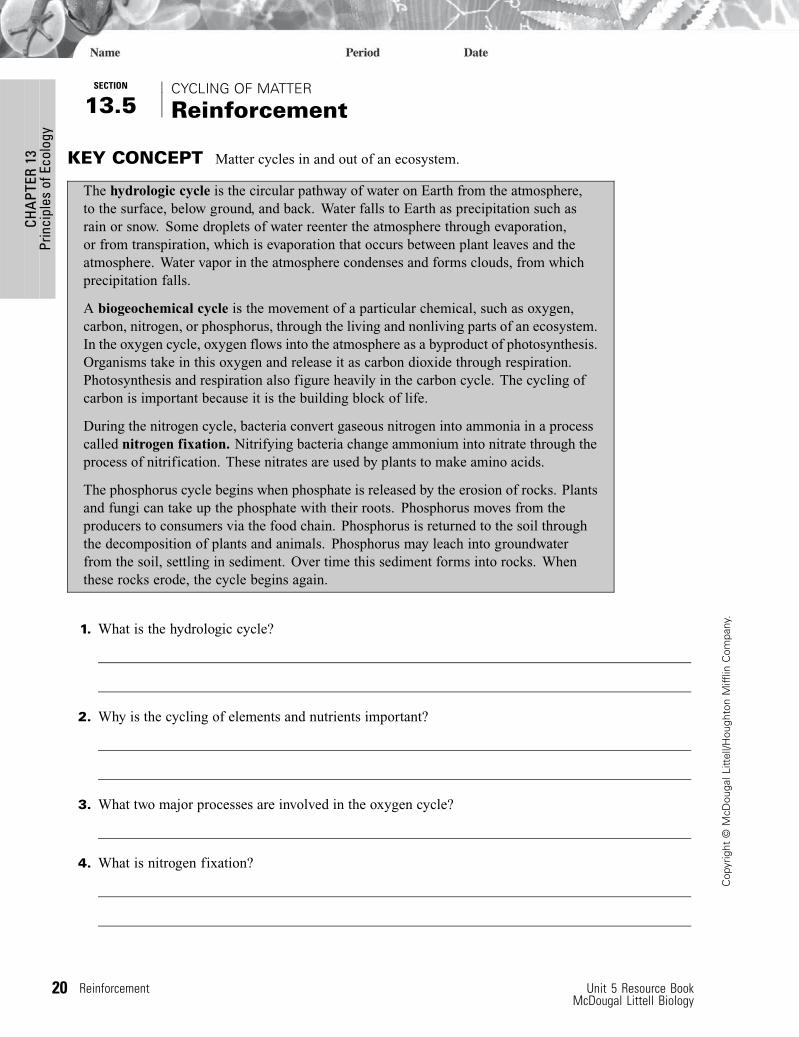
Reinforcement
KEY CONCEPT Matter cycles in and out of an ecosystem.
The hydrologic cycle is the circular pathway of water on Earth from the atmosphere,to the surface, below ground, and back. Water falls to Earth as precipitation such asrain or snow. Some droplets of water reenter the atmosphere through evaporation,or from transpiration, which is evaporation that occurs between plant leaves and theatmosphere. Water vapor in the atmosphere condenses and forms clouds, from whichprecipitation falls.
A biogeochemical cycle is the movement of a particular chemical, such as oxygen,carbon, nitrogen, or phosphorus, through the living and nonliving parts of an ecosystem.In the oxygen cycle, oxygen flows into the atmosphere as a byproduct of photosynthesis.Organisms take in this oxygen and release it as carbon dioxide through respiration.Photosynthesis and respiration also figure heavily in the carbon cycle. The cycling ofcarbon is important because it is the building block of life.
During the nitrogen cycle, bacteria convert gaseous nitrogen into ammonia in a processcalled nitrogen fixation. Nitrifying bacteria change ammonium into nitrate through theprocess of nitrification. These nitrates are used by plants to make amino acids.
The phosphorus cycle begins when phosphate is released by the erosion of rocks. Plantsand fungi can take up the phosphate with their roots. Phosphorus moves from theproducers to consumers via the food chain. Phosphorus is returned to the soil throughthe decomposition of plants and animals. Phosphorus may leach into groundwaterfrom the soil, settling in sediment. Over time this sediment forms into rocks. Whenthese rocks erode, the cycle begins again.
1. What is the hydrologic cycle?
2. Why is the cycling of elements and nutrients important?
3. What two major processes are involved in the oxygen cycle?
4. What is nitrogen fixation?
20 Reinforcement Unit 5 Resource BookMcDougal Littell Biology
CHA
PTER
13Pr
inci
ples
ofEc
olog
y
Cop
yrig
ht©
McD
ouga
lLitt
ell/H
ough
ton
Miff
linC
ompa
ny.
SECTION
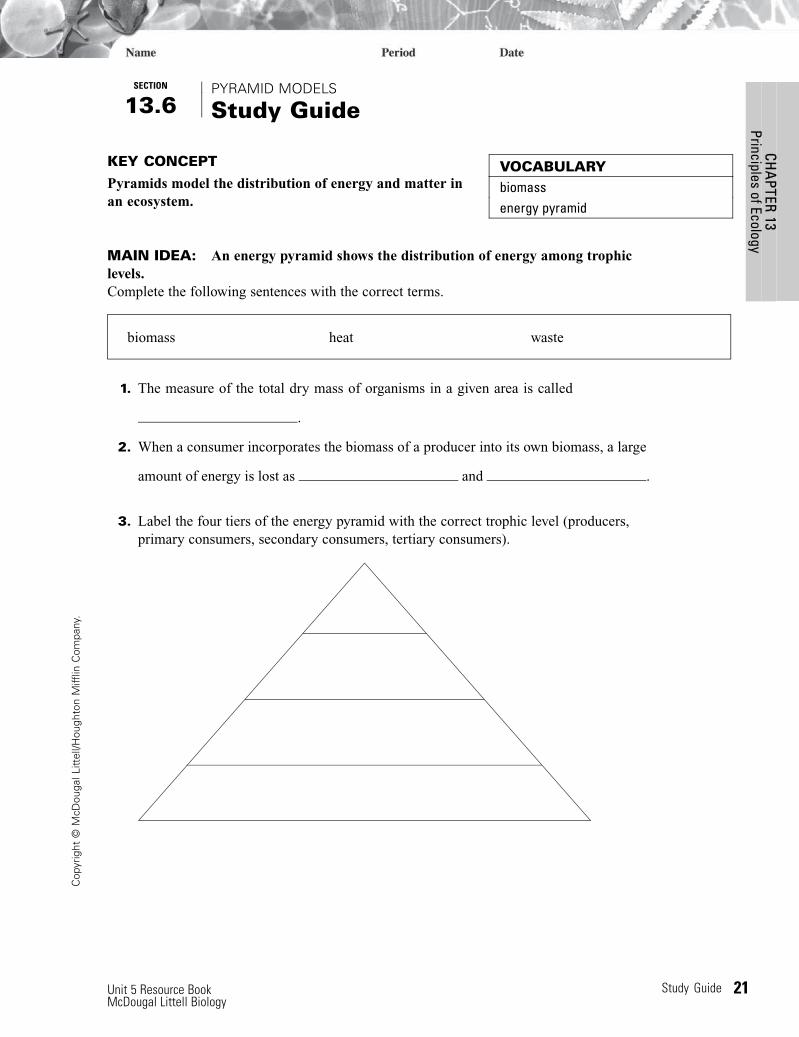
13.6PYRAMID MODELS
Study Guide
KEY CONCEPT
Pyramids model the distribution of energy and matter inan ecosystem.
VOCABULARYbiomassenergy pyramid
MAIN IDEA: An energy pyramid shows the distribution of energy among trophiclevels.Complete the following sentences with the correct terms.
biomass heat waste
1. The measure of the total dry mass of organisms in a given area is called
.
2. When a consumer incorporates the biomass of a producer into its own biomass, a large
amount of energy is lost as and .
3. Label the four tiers of the energy pyramid with the correct trophic level (producers,primary consumers, secondary consumers, tertiary consumers).
Unit 5 Resource Book Study Guide 21McDougal Littell Biology
Cop
yrig
ht©
McD
ouga
lLitt
ell/H
ough
ton
Miff
linC
ompa
ny.
CHA
PTER13
PrinciplesofEcology
STUDY GUIDE, CONTINUED
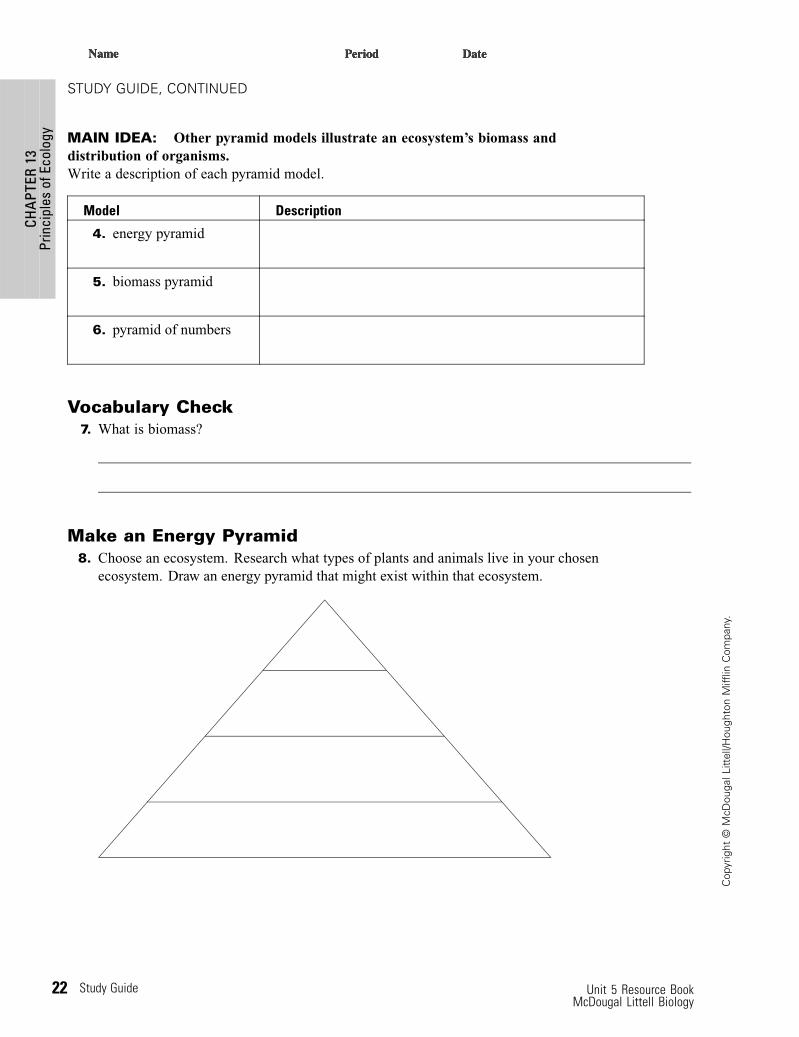
MAIN IDEA: Other pyramid models illustrate an ecosystem’s biomass anddistribution of organisms.Write a description of each pyramid model.
Model Description
4. energy pyramid
5. biomass pyramid
6. pyramid of numbers
Vocabulary Check7. What is biomass?
Make an Energy Pyramid8. Choose an ecosystem. Research what types of plants and animals live in your chosen
ecosystem. Draw an energy pyramid that might exist within that ecosystem.
22 Study Guide Unit 5 Resource BookMcDougal Littell Biology
CHA
PTER
13Pr
inci
ples
ofEc
olog
y
Cop
yrig
ht©
McD
ouga
lLitt
ell/H
ough
ton
Miff
linC
ompa
ny.
SECTION
13.6PYRAMID MODELS
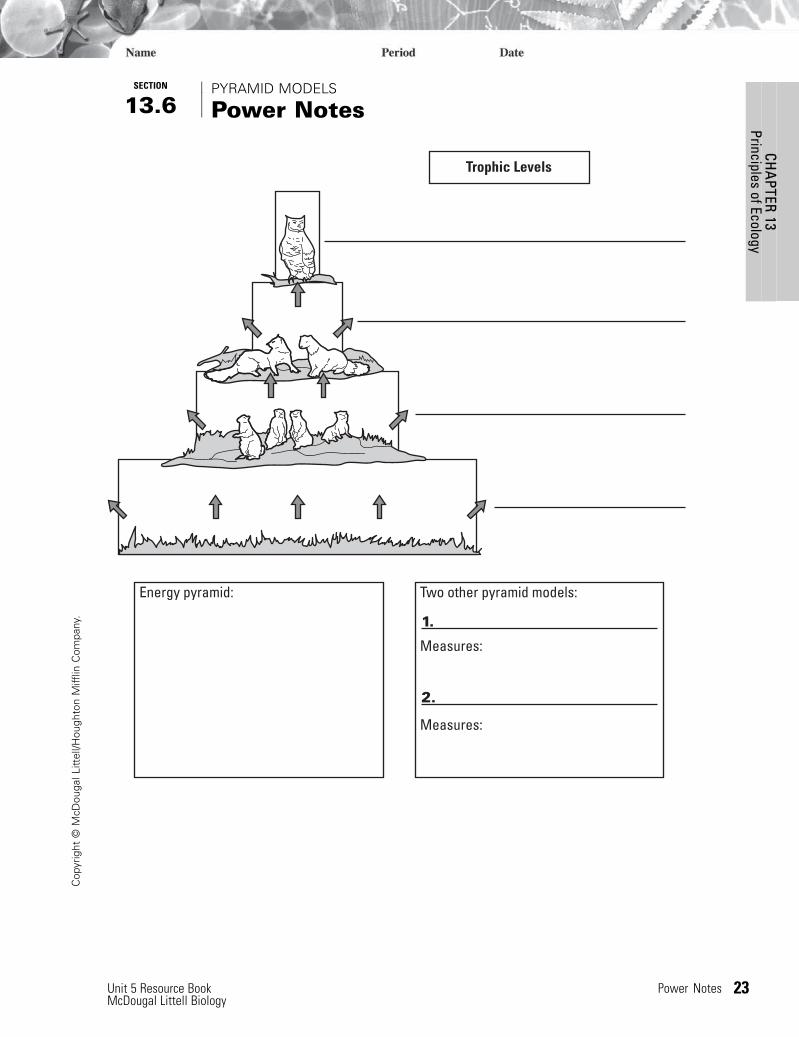
Power Notes
Trophic Levels
Energy pyramid: Two other pyramid models:
Measures:
Measures:
1.
2.
Unit 5 Resource Book Power Notes 23McDougal Littell Biology
Cop
yrig
ht©
McD
ouga
lLitt
ell/H
ough
ton
Miff
linC
ompa
ny.
CHA
PTER13
PrinciplesofEcology
SECTION
13.6PYRAMID MODELS
Reinforcement
KEY CONCEPT Pyramids model the distribution of energy and matter in anecosystem.
An energy pyramid shows the distribution of energy among trophic levels. Biomassis a measure of the total dry mass of organisms in an ecosystem. When a consumerincorporates the biomass from a producer into its own biomass, some of the energy islost as heat and waste. The loss of energy between trophic levels can be as much as 90percent, meaning only 10 percent of the available energy is transferred from one trophiclevel to another. A typical energy pyramid has a very large section at the base for theproducers, and tiers that become smaller the higher the trophic level.
Two other pyramid models are biomass pyramids and pyramids of numbers.
• A biomass pyramid compares the biomass of different trophic levels within anecosystem. This pyramid model shows the mass of producers needed to supportprimary consumers, the mass of primary consumers needed to support secondaryconsumers, and so on.
• A pyramid of numbers shows the numbers of individual organisms at each trophiclevel in an ecosystem.
1. What is an energy pyramid?
2. What is biomass?
3. Describe the flow of energy from one trophic level to another.
4. What is the difference between a biomass pyramid and a pyramid of numbers?
24 Reinforcement Unit 5 Resource BookMcDougal Littell Biology
CHA
PTER
13Pr
inci
ples
ofEc
olog
y
Cop
yrig
ht©
McD
ouga
lLitt
ell/H
ough
ton
Miff
linC
ompa
ny.
CHAPTER
13POPULATIONS AND SAMPLES
Data Analysis Practice
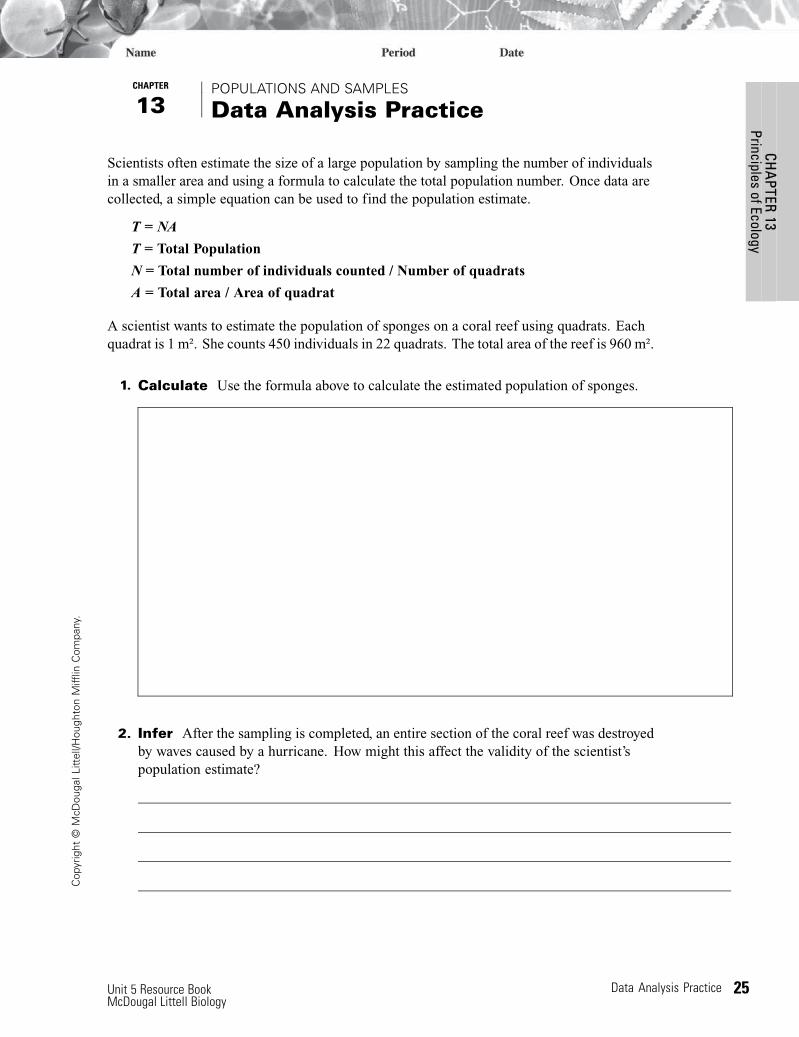
Scientists often estimate the size of a large population by sampling the number of individualsin a smaller area and using a formula to calculate the total population number. Once data arecollected, a simple equation can be used to find the population estimate.
T = NA
T = Total Population
N = Total number of individuals counted / Number of quadrats
A = Total area / Area of quadrat
A scientist wants to estimate the population of sponges on a coral reef using quadrats. Eachquadrat is 1 m². She counts 450 individuals in 22 quadrats. The total area of the reef is 960 m².
1. Calculate Use the formula above to calculate the estimated population of sponges.
2. Infer After the sampling is completed, an entire section of the coral reef was destroyedby waves caused by a hurricane. How might this affect the validity of the scientist’spopulation estimate?
Unit 5 Resource Book Data Analysis Practice 25McDougal Littell Biology
Cop
yrig
ht©
McD
ouga
lLitt
ell/H
ough
ton
Miff
linC
ompa
ny.
CHA
PTER13
PrinciplesofEcology

CHAPTER
13DESIGN A MARK-RECAPTURE STUDY
Pre-AP* Activity
*Pre-AP is a registered trademark of the College Board, which was not involved in theproduction of and does not endorse this product.
You have learned in Chapter 13 how scientists can use the mark-recapture techniqueto generate estimates of population size. Whether or not this technique is appropriateor feasible depends upon whether the population is “open” or “closed.” The size of anopen population––one whose abundance is variable due to birth, death, emigration, orimmigration––is difficult to estimate. Closed populations are, by comparison, much easierto assess.
In a closed population, the abundance of organisms is constant for the full duration of theexperiment or study. An example of this might be a species of fish in a small pond. Scientistsknow that the fish aren’t going to migrate elsewhere, so they need not worry about theabundance dropping due to emigration. They also know that, barring some unnatural event,fish that are not in the pond at the start of the experiment are not going to spontaneouslyappear prior to the recapture phase (immigration). Provided that the work is done relativelyquickly, the scientists do not have to worry about the effect of predation or other causesof death, either. (If they caught and marked 100 fish in May, but waited until August torecapture them, their estimate of population could be way off due to the loss of many markedfish to predators in the intervening months.) Finally, if the scientists also know that the fish isnot going to reproduce in the time between “mark” and “recapture”––or they at least knowthat any newborn fish will be easily distinguishable from the others––then birth will notbe a factor. Thus, the population is closed.
While closed populations do not pose nearly as many challenges as open populations,there are a number of ways that even a simple mark-recapture study can be undermined andthe data skewed by poor experimental design.
MARKS
One problem with some mark-recapture studies is the actual method of marking the animals.Some tags or bands used to mark an individual can come off due to a variety of circumstances,from moisture to temperature to the animal’s own behavior. It often takes years of trial anderror before scientists develop a tag that will actually stay on an organism until someone takesit off. Scientists must also be sure that any mark that is put on an organism does not makethat animal more or less likely to be recaptured than an unmarked organism. Moreover, atag mustn’t affect the animal’s chance of survival or natural behavior. If, for example, thetrauma of capturing and marking an animal results in it spending the duration of the studyperiod in an underground lair, so that the chance of recapture is zero, then the study needs tobe redesigned.
Scientists continue to look for less invasive ways to mark or tag organisms. Ideally, ananimal may already have a marking that distinguishes it from others. Individual humpbackwhales, for example, are readily identified by the dark blotches on the white undersides oftheir tails. These blotches are like huge fingerprints that can be spotted and photographedfrom many meters away when a whale’s tail is held aloft above the sea surface. Scientists canassemble a catalog of photographs of these markings and essentially use them to aid with
Unit 5 Resource Book Pre-AP* Activity 27McDougal Littell Biology
Cop
yrig
ht©
McD
ouga
lLitt
ell/H
ough
ton
Miff
linC
ompa
ny.
CHA
PTER13
PrinciplesofEcology
population estimates and other studies of humpback whale behavior and ecology. Othernatural markings on other species can be used the same way.
DESIGN YOUR OWN MARK-RECAPTURE STUDY
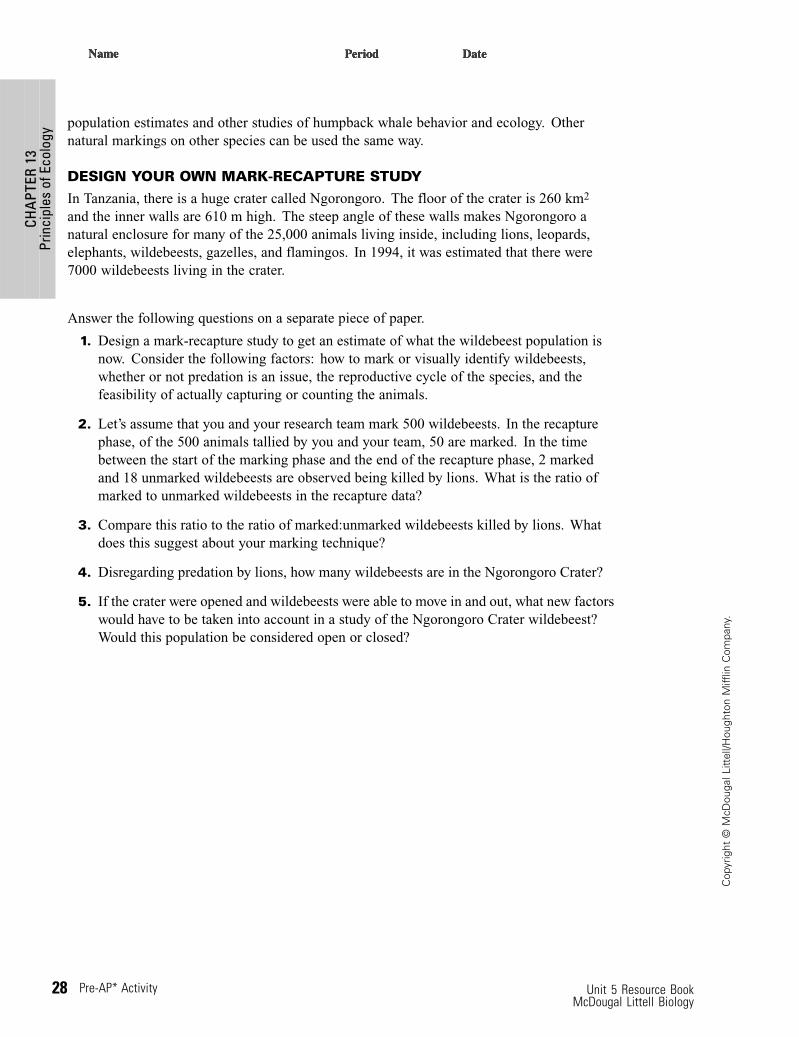
In Tanzania, there is a huge crater called Ngorongoro. The floor of the crater is 260 km2
and the inner walls are 610 m high. The steep angle of these walls makes Ngorongoro anatural enclosure for many of the 25,000 animals living inside, including lions, leopards,elephants, wildebeests, gazelles, and flamingos. In 1994, it was estimated that there were7000 wildebeests living in the crater.
Answer the following questions on a separate piece of paper.
1. Design a mark-recapture study to get an estimate of what the wildebeest population isnow. Consider the following factors: how to mark or visually identify wildebeests,whether or not predation is an issue, the reproductive cycle of the species, and thefeasibility of actually capturing or counting the animals.
2. Let’s assume that you and your research team mark 500 wildebeests. In the recapturephase, of the 500 animals tallied by you and your team, 50 are marked. In the timebetween the start of the marking phase and the end of the recapture phase, 2 markedand 18 unmarked wildebeests are observed being killed by lions. What is the ratio ofmarked to unmarked wildebeests in the recapture data?
3. Compare this ratio to the ratio of marked:unmarked wildebeests killed by lions. Whatdoes this suggest about your marking technique?
4. Disregarding predation by lions, how many wildebeests are in the Ngorongoro Crater?
5. If the crater were opened and wildebeests were able to move in and out, what new factorswould have to be taken into account in a study of the Ngorongoro Crater wildebeest?Would this population be considered open or closed?
28 Pre-AP* Activity Unit 5 Resource BookMcDougal Littell Biology
CHA
PTER
13Pr
inci
ples
ofEc
olog
y
Cop
yrig
ht©
McD
ouga
lLitt
ell/H
ough
ton
Miff
linC
ompa
ny.
CHAPTER
13BIOMASS IN CORAL REEF ECOSYSTEMS
Pre-AP Activity
One of the most diverse and productive ecosystems on Earth is the coral reef. Scientistsestimate that while coral reefs occupy less than one percent of the ocean floor, they accountfor ten percent of the fish we consume and are home to more than a third of all marinefish species.
THE CORAL REEF FOOD WEB
As you saw in Figure 13.11 on page 410, even a simplified coral reef food web is complicated.Phytoplankton and zooxanthellae––symbiotic algae that live within coral polyps––form thebase of the web, converting sunlight into energy that is then taken up, in part, by primaryconsumers such as sponges, corals, fish, sea turtles, and zooplankton. These primary (1º)consumers are then consumed by secondary (2º) consumers, which are in turn consumed bytertiary consumers (3º), and so on. There are multiple levels, and the variable diets of manyspecies can place them on more than one level. For example, a tiger shark that feeds on alarge grouper might in that instance be a quaternary (4º) consumer if the grouper ate a smallfish that ate a shrimp that ate some phytoplankton. A few days later, the tiger shark could eata sea turtle that is a primary consumer, thereby making itself a secondary consumer.
ECOLOGICAL PYRAMIDS
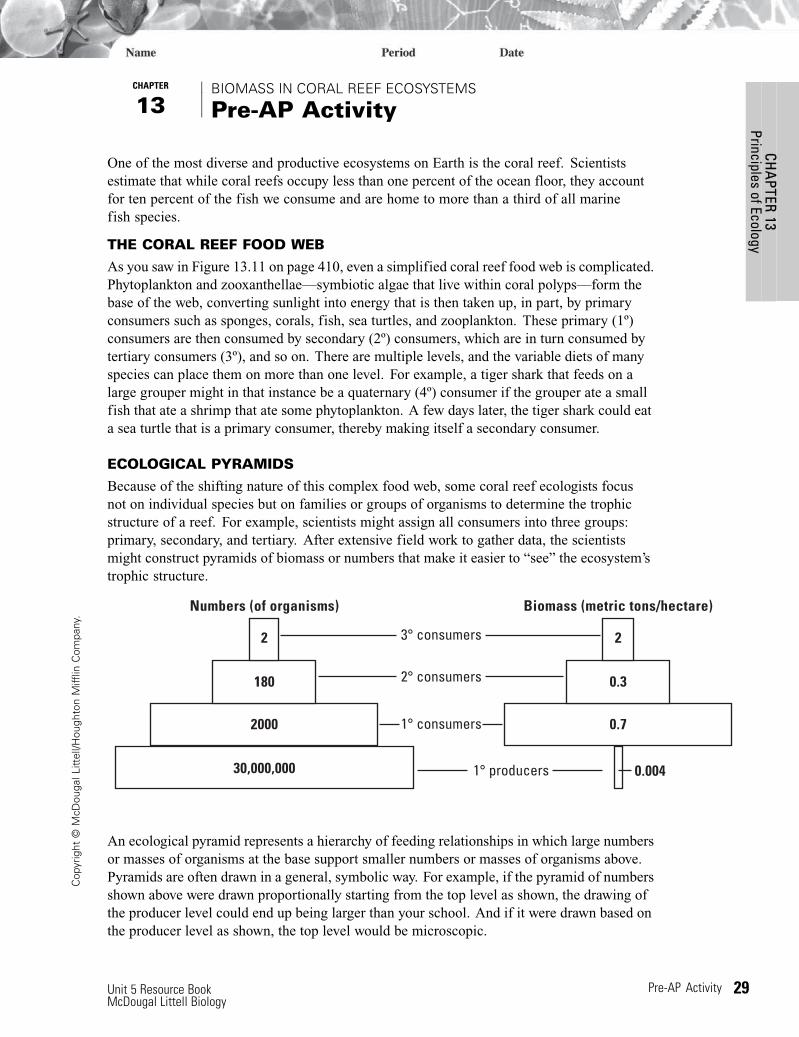
Because of the shifting nature of this complex food web, some coral reef ecologists focusnot on individual species but on families or groups of organisms to determine the trophicstructure of a reef. For example, scientists might assign all consumers into three groups:primary, secondary, and tertiary. After extensive field work to gather data, the scientistsmight construct pyramids of biomass or numbers that make it easier to “see” the ecosystem’strophic structure.
1° producers
1° consumers
2° consumers
3° consumers
30,000,000
2000
180
2
0.004
0.7
0.3
2
Numbers (of organisms) Biomass (metric tons/hectare)
An ecological pyramid represents a hierarchy of feeding relationships in which large numbersor masses of organisms at the base support smaller numbers or masses of organisms above.Pyramids are often drawn in a general, symbolic way. For example, if the pyramid of numbersshown above were drawn proportionally starting from the top level as shown, the drawing ofthe producer level could end up being larger than your school. And if it were drawn based onthe producer level as shown, the top level would be microscopic.
Unit 5 Resource Book Pre-AP Activity 29McDougal Littell Biology
Cop
yrig
ht©
McD
ouga
lLitt
ell/H
ough
ton
Miff
linC
ompa
ny.
CHA
PTER13
PrinciplesofEcology
The shape of a pyramid may also be skewed by the amount of time in which data wascollected or the lifespans of the organisms. In the biomass pyramid shown, the producer levelis relatively tiny because at any given moment the mass of phytoplankton is small. Becausephytoplankton reproduce very quickly, their biomass over time is enough to sustain theconsumers. This is analogous to the mass of food in your kitchen. On any given day it isprobably less than your family’s mass, but over the course of a year––not to mention yourlifetime––the mass of food is many times larger than the human biomass in your kitchen“ecosystem.”
Island
Biomass of Fish in the Two Groups of Hawaiian Islands (metric tons/hectare)
1°Consumers
2°Consumers
3°Consumers
TotalBiomass
French Frigate Shoals
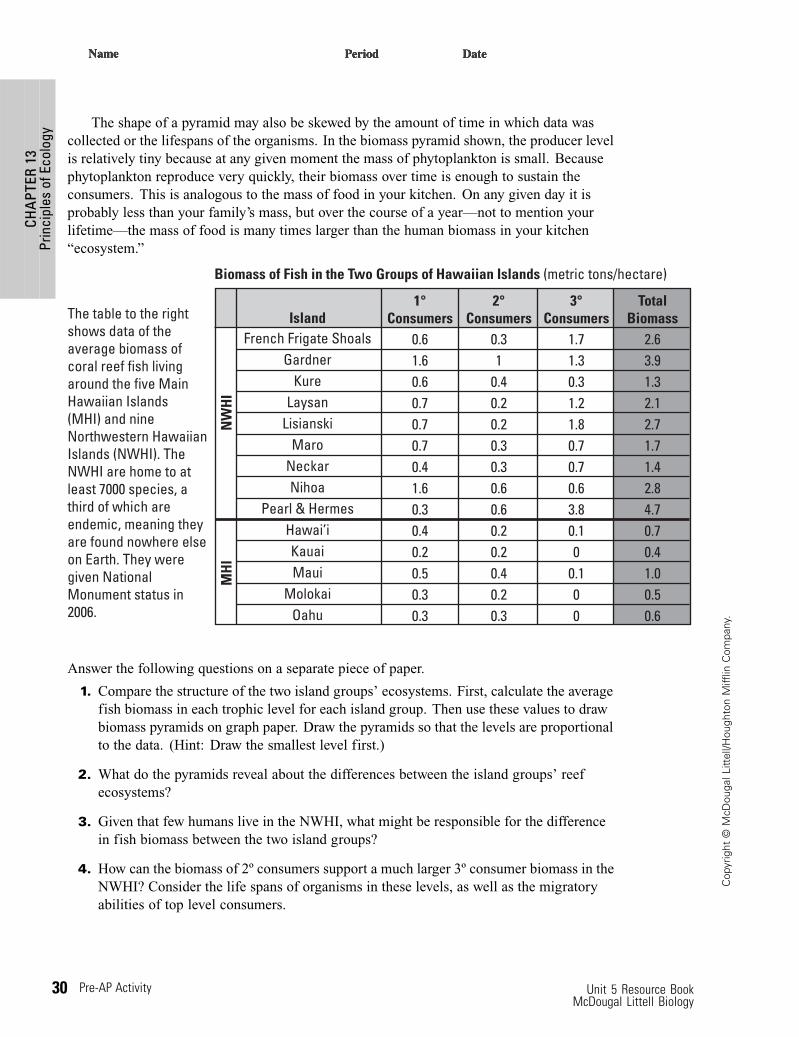
The table to the right shows data of theaverage biomass ofcoral reef fish livingaround the five MainHawaiian Islands(MHI) and nine Northwestern Hawaiian Islands (NWHI). The NWHI are home to at least 7000 species, a third of which are endemic, meaning they are found nowhere else on Earth. They were given National Monument status in 2006.
NW
HI
MH
I
0.6 0.3 1.7 2.6Gardner 1.6 1 1.3 3.9
Kure 0.6 0.4 0.3 1.3Laysan 0.7 0.2 1.2 2.1
Lisianski 0.7 0.2 1.8 2.7Maro 0.7 0.3 0.7 1.7
Neckar 0.4 0.3 0.7 1.4Nihoa 1.6 0.6 0.6 2.8
Pearl & Hermes 0.3 0.6 3.8 4.7Hawai’i 0.4 0.2 0.1 0.7Kauai 0.2 0.2 0 0.4Maui 0.5 0.4 0.1 1.0
Molokai 0.3 0.2 0 0.5Oahu 0.3 0.3 0 0.6
Answer the following questions on a separate piece of paper.
1. Compare the structure of the two island groups’ ecosystems. First, calculate the averagefish biomass in each trophic level for each island group. Then use these values to drawbiomass pyramids on graph paper. Draw the pyramids so that the levels are proportionalto the data. (Hint: Draw the smallest level first.)
2. What do the pyramids reveal about the differences between the island groups’ reefecosystems?
3. Given that few humans live in the NWHI, what might be responsible for the differencein fish biomass between the two island groups?
4. How can the biomass of 2º consumers support a much larger 3º consumer biomass in theNWHI? Consider the life spans of organisms in these levels, as well as the migratoryabilities of top level consumers.
30 Pre-AP Activity Unit 5 Resource BookMcDougal Littell Biology
CHA
PTER
13Pr
inci
ples
ofEc
olog
y
Cop
yrig
ht©
McD
ouga
lLitt
ell/H
ough
ton
Miff
linC
ompa
ny.
CHAPTER
13PRINCIPLES OF ECOLOGY
Vocabulary Practice
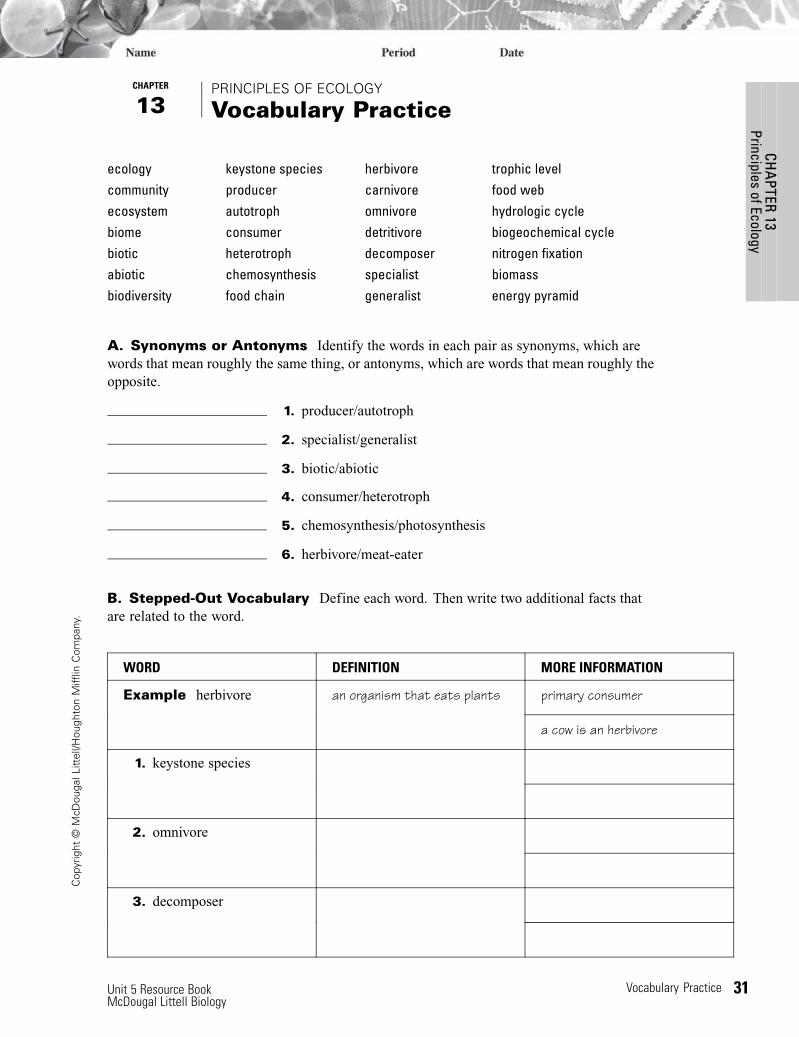
ecology keystone species herbivore trophic levelcommunity producer carnivore food webecosystem autotroph omnivore hydrologic cyclebiome consumer detritivore biogeochemical cyclebiotic heterotroph decomposer nitrogen fixationabiotic chemosynthesis specialist biomassbiodiversity food chain generalist energy pyramid
A. Synonyms or Antonyms Identify the words in each pair as synonyms, which arewords that mean roughly the same thing, or antonyms, which are words that mean roughly theopposite.
1. producer/autotroph
2. specialist/generalist
3. biotic/abiotic
4. consumer/heterotroph
5. chemosynthesis/photosynthesis
6. herbivore/meat-eater
B. Stepped-Out Vocabulary Define each word. Then write two additional facts thatare related to the word.
WORD DEFINITION MORE INFORMATION
primary consumerExample herbivore an organism that eats plants
a cow is an herbivore
1. keystone species
2. omnivore
3. decomposer
Unit 5 Resource Book Vocabulary Practice 31McDougal Littell Biology
Cop
yrig
ht©
McD
ouga
lLitt
ell/H
ough
ton
Miff
linC
ompa
ny.
CHA
PTER13
PrinciplesofEcology
VOCABULARY PRACTICE, CONTINUED
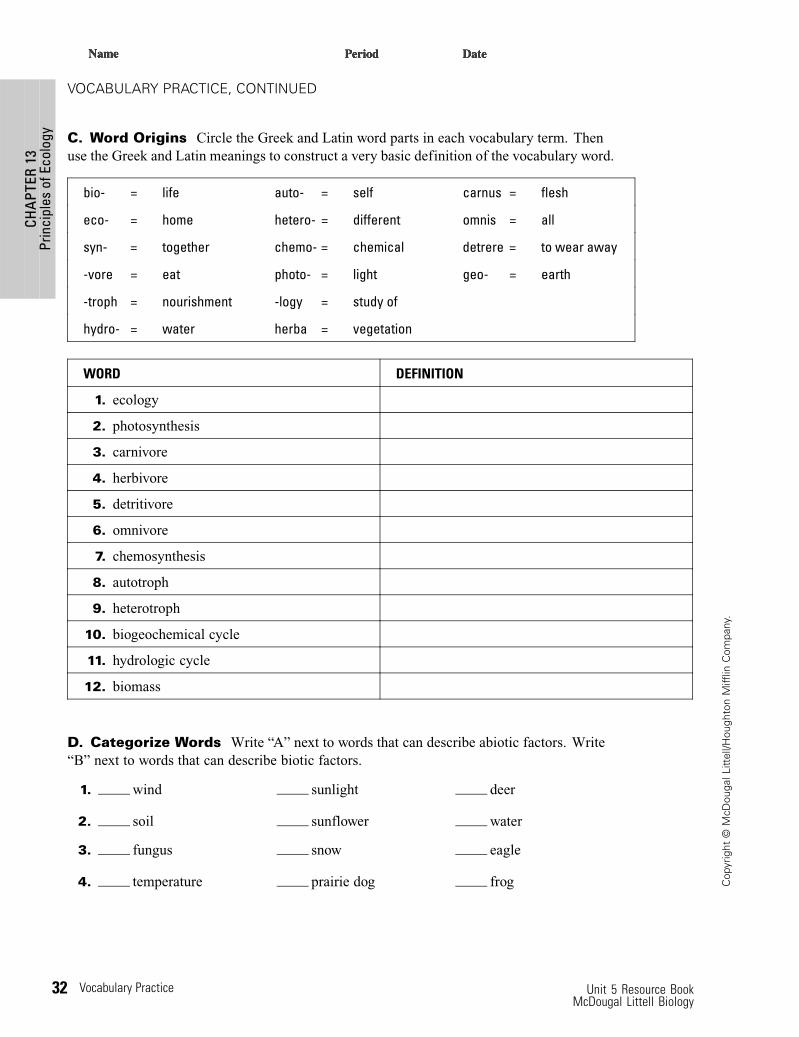
C. Word Origins Circle the Greek and Latin word parts in each vocabulary term. Thenuse the Greek and Latin meanings to construct a very basic definition of the vocabulary word.
bio- = life auto- = self carnus = flesh
eco- = home hetero- = different omnis = all
syn- = together chemo- = chemical detrere = to wear away
-vore = eat photo- = light geo- = earth
-troph = nourishment -logy = study of
hydro- = water herba = vegetation
WORD DEFINITION
1. ecology
2. photosynthesis
3. carnivore
4. herbivore
5. detritivore
6. omnivore
7. chemosynthesis
8. autotroph
9. heterotroph
10. biogeochemical cycle
11. hydrologic cycle
12. biomass
D. Categorize Words Write “A” next to words that can describe abiotic factors. Write“B” next to words that can describe biotic factors.
1. wind sunlight deer
2. soil sunflower water
3. fungus snow eagle
4. temperature prairie dog frog
32 Vocabulary Practice Unit 5 Resource BookMcDougal Littell Biology
CHA
PTER
13Pr
inci
ples
ofEc
olog
y
Cop
yrig
ht©
McD
ouga
lLitt
ell/H
ough
ton
Miff
linC
ompa
ny.
VOCABULARY PRACTICE, CONTINUED
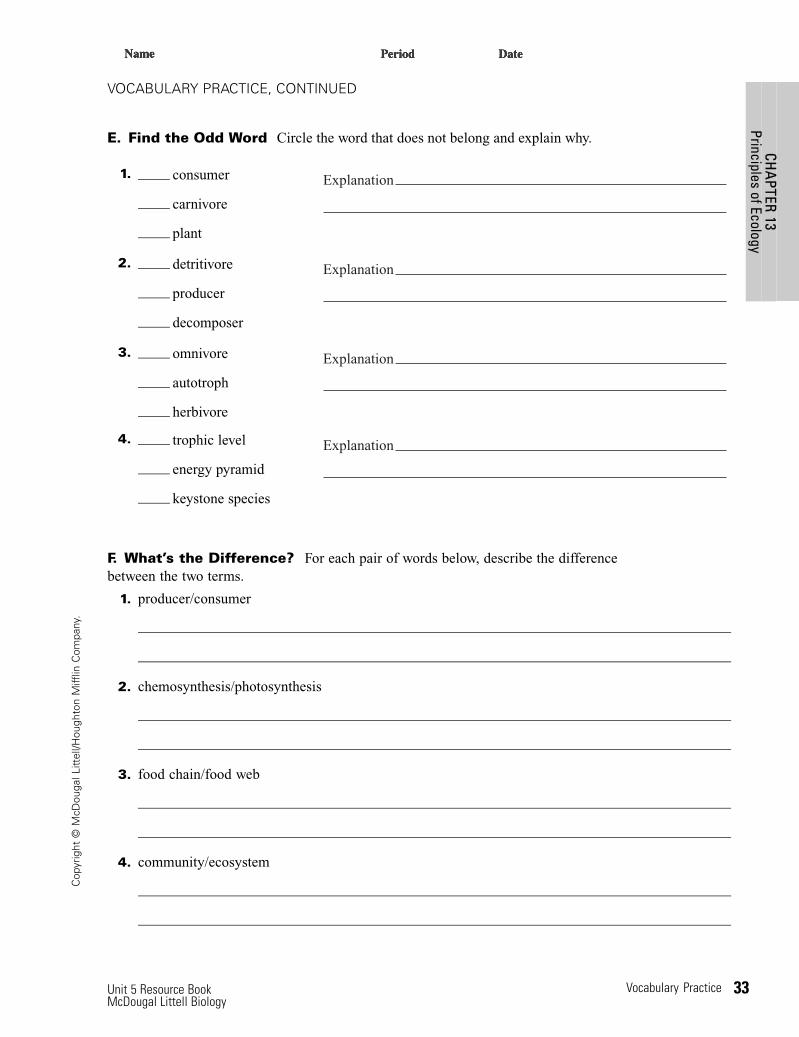
E. Find the Odd Word Circle the word that does not belong and explain why.
1. consumer
carnivore
plant
Explanation
2. detritivore
producer
decomposer
Explanation
3. omnivore
autotroph
herbivore
Explanation
4. trophic level
energy pyramid
keystone species
Explanation
F. What’s the Difference? For each pair of words below, describe the differencebetween the two terms.
1. producer/consumer
2. chemosynthesis/photosynthesis
3. food chain/food web
4. community/ecosystem
Unit 5 Resource Book Vocabulary Practice 33McDougal Littell Biology
Cop
yrig
ht©
McD
ouga
lLitt
ell/H
ough
ton
Miff
linC
ompa
ny.
CHA
PTER13
PrinciplesofEcology
VOCABULARY PRACTICE, CONTINUED
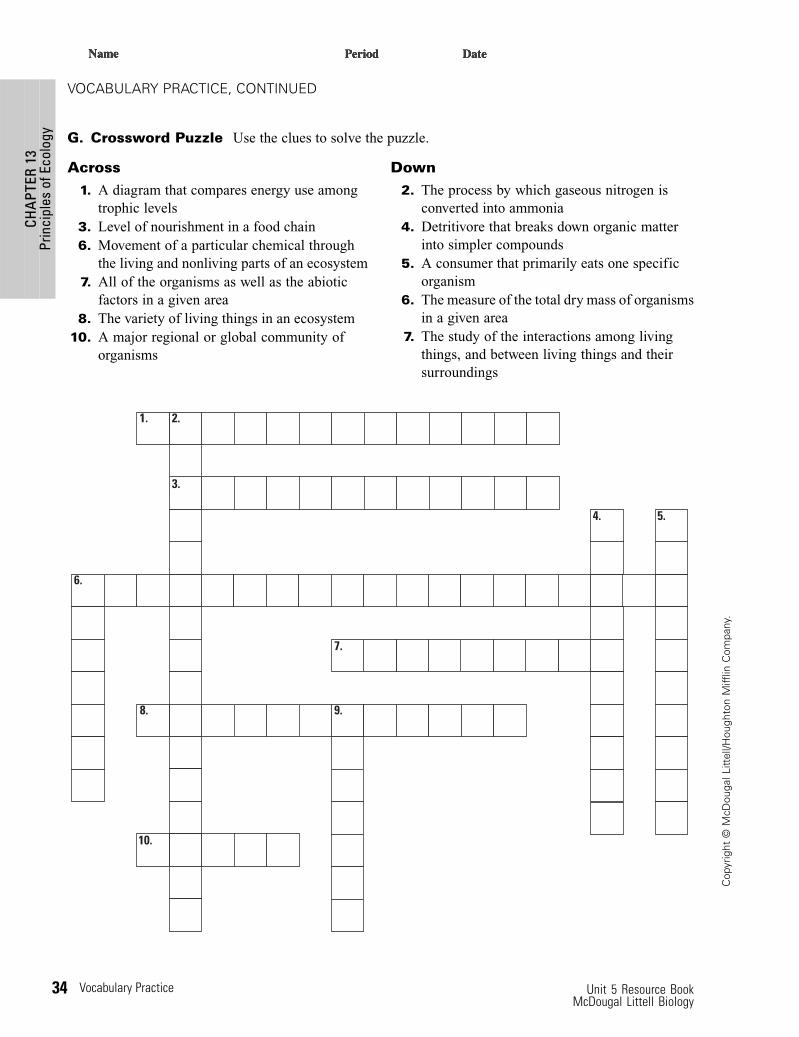
G. Crossword Puzzle Use the clues to solve the puzzle.
Across1. A diagram that compares energy use among
trophic levels3. Level of nourishment in a food chain6. Movement of a particular chemical through
the living and nonliving parts of an ecosystem7. All of the organisms as well as the abiotic
factors in a given area8. The variety of living things in an ecosystem
10. A major regional or global community oforganisms
Down2. The process by which gaseous nitrogen is
converted into ammonia4. Detritivore that breaks down organic matter
into simpler compounds5. A consumer that primarily eats one specific
organism6. The measure of the total dry mass of organisms
in a given area7. The study of the interactions among living
things, and between living things and theirsurroundings
1. 2.
3.
4.
7.
9.8.
10.
6.
5.
34 Vocabulary Practice Unit 5 Resource BookMcDougal Littell Biology
CHA
PTER
13Pr
inci
ples
ofEc
olog
y
Cop
yrig
ht©
McD
ouga
lLitt
ell/H
ough
ton
Miff
linC
ompa
ny.