section c - soil information 1) preface
TRANSCRIPT

SECTION C │ Soil Information
On-Site Sewage Management Systems Manual Page 33 of 289
SECTION C - SOIL INFORMATION
1) Preface
Soil information and its proper application can contribute to the solution of many waste
disposal problems in Georgia. It can effectively be combined with geology, engineering and
ecology to yield an integrated approach to environmental improvement. This Manual
concentrates primarily on evaluating the suitability of soils for disposal of liquid waste from
individual homes through septic tanks and subsurface soil absorption systems.
It is hoped that the following information will help to point out how to avoid the mistakes
frequently made in choosing suitable development sites where the soil is to be used for
treatment and disposal of liquid waste. Such mistakes can result in increased land use conflict,
environmental degradation and a waste of time and money.
Although these sections of the Manual were developed to provide information to all people
interested in solving relevant waste disposal problems where soil characteristics are
contributing factors, the majority of the material will probably be most useful to environmental
health specialists and other environmental health workers, surveyors, engineers, developers
and other persons and groups frequently confronted with making significant land use decisions.
2) Introduction
A. Soil and Environmental Health - Soil is a term that means different things to different
people. To some it is a material in which plants grow in a yard or a field. To some, the
color of the soil is important and they speak of red soil, yellow soil or blue clay. To others,
the soil texture is important and they speak of sandy soil, clay soil, light soil or heavy soil.
To some the soil is everything above hard rock and to others it is the plow layer. Thus, a
part of soil evaluation deals with communicating exactly what is meant by the terms “soil”,
“soil types” and “soil characteristics.”
The soil scientist, who deals with the genesis and morphology of soils, thinks of soil as that
part of the unconsolidated mantle (parent material), covering the surface of the earth, that
has been acted on by the forces of climate and vegetation, on a given relief, over a period
of time, to form a separate and distinct body (soil profile). Thus, the soil reflects the natural
environment of a unit of landscape. By observing the soil characteristics of a given unit of
landscape and knowing the environmental conditions that produce such characteristics, a
prediction of the problems of the natural environment can be made.
The rapid expansion of the population and its migration into urban and suburban areas has
created the need for environmental predictions for planning purposes. A house and lot
constitute the environment within which a family makes their home. Such conditions as
extremes of wetness or soil permeability on a home site exert a strong influence on the
environmental health of the family living on that site. Dampness, ponded water, flooding
around or under a house, use and failure of conventional septic tank systems, cracked
foundations and the inconveniences that go with these problems, are a direct outgrowth of
the soil-water relationship on a lot or within a subdivision.

SECTION C │ Soil Information
On-Site Sewage Management Systems Manual Page 34 of 289
Problems with environmental health associated with soils result from errors in man's
attempt to modify his environment. These errors are generally made by failing to predict
soil suitability and in making allowances for modifications or corrective measures. For
example, the natural environment of a lot changes in terms of wetness throughout the year
and from year to year with changes in the weather. Thus, an evaluation of the wetness of a
lot based on the presence of free water in the soil can be expected to vary throughout the
year.
Prevention of environmental health problems associated with soils and waste disposal
requires prediction of the problems before development begins. Prediction of the problems
allows for modifications to be considered prior to development. Corrective measures made
after development are more costly, as well as inconvenient to the homeowner or developer.
The use of modifications or corrective measures raises the cost of development of a site in
terms of initial investment, in terms of maintenance required and in terms of the end result
obtained.
Evaluation of land from an environmental health viewpoint requires an understanding of
the problems associated with a given unit of landscape (soil study) and an understanding
of the processes of conventional septic tank systems.
B. On-Site Disposal of Liquid Wastes - Wastewater (sewage) contains many substances that
are undesirable and potentially harmful. Present are pathogenic bacteria, infectious viruses,
putrescible organic matter, toxic chemicals and excesses of the nutrients nitrogen and
phosphorus. Any of these could create public health hazards and nuisances if the wastes
were discharged into the environment without proper treatment. To protect the public and
the environment, wastes must be treated and disposed of in a safe and effective manner.
Characteristics of Household Wastes: Normal household sewage consists of all the liquid
household waste, including waste from the toilet, bath, kitchen and laundry. This is
composed of about 99.9 percent liquids and about 0.1 percent solids. The small percentage
of solids is responsible for nuisances and, along with the microorganisms in sewage, is the
cause of health hazards. Approximately two-thirds of the solids are of organic composition.
The remainder is inorganic.
The organic compounds are the primary cause of odors and the nuisance problems
attributed to sewage. These are the compounds that require large volumes of oxygen to
make them stable, inoffensive, and non-hazardous. Organic compounds in sewage are
divided into three groups: nitrogen compounds, carbohydrates, and fats. Nitrogen
compounds include proteins, amino acids, amines, peptone, urea, etc. The carbohydrates
include sugars, starches, cellulose, etc. The fats include fats, oils, grease, soaps, detergents,
etc.
The total solids in sewage consist of dissolved (or soluble) solids, suspended (or colloidal)
solids, and the heavier settleable solids. The dissolved and suspended solids remain in the
sewage and do not settle out, while the settleable solids are removed from the sewage by
gravity. In raw sewage, about 20 percent of the total organic solids are dissolved (soluble)
solids. In aged sewage (after 24 hours in a septic tank), the dissolved solids increase to
about one-half or slightly more of the total solids initially in the sewage. This is a result of
the bacterial action on the suspended and settleable solids.

SECTION C │ Soil Information
On-Site Sewage Management Systems Manual Page 35 of 289
Treating the Wastes: A successful on-site sewage management system is one which will
render the wastes harmless while not allowing harmful pollutants to accumulate to
dangerous levels in the environment. It is important to point out that the environment is the
part of the system providing the final treatment necessary before the water is of a suitable
quality for reuse. It is a stream in the case of a municipal treatment plant and the soil in the
case of a conventional septic tank system. If the pollutant load received by the environment
is too great, pollutants will not be broken down and they will accumulate, leading to failure
of the system.
The environment will perform three functions in the treatment of wastes. It will, (1) tie up
inorganic compounds by chemical adsorption in the soil and sediments or by plant or
animal uptake, (2) dilute the waste concentrations by the addition of purer surface water or
groundwater and (3) break down the wastes and recycle the constituents. The ultimate goal
of any wastewater treatment and disposal system is to perform the latter function.
To design a safe and effective wastewater treatment and disposal system, it is necessary to
evaluate the physical characteristics of the local environment where discharge of the
partially treated wastewater is to be made. Each site has its own characteristics that limit
its potential as a treatment medium. This is particularly critical where on-site sewage
management systems are necessary. On-site systems lack the advantage of public or
community sewage systems, where wastes can be collected and conveyed to a treatment
plant located at a site, which is selected for its suitability to receive the wastes. Thus, there
are fewer restrictions for sites serviced by a public or community sewage system. On-site
systems, on the other hand, must be located near the point of waste generation and local
environmental conditions are often less than optimal. The result is that development must
often be prohibited or other means of disposal found.
Conventional Septic Tank Systems: Traditionally, the septic tank-soil absorption system
has been used to provide on-site treatment and disposal of liquid wastes. It is an ideal
system for disposal of liquid wastes since it is simple, relatively maintenance free and
inexpensive when compared to public systems. When properly designed, installed and
maintained, it is a very satisfactory system.
In general, the septic tank is used to provide partial treatment of the raw wastewater. Its
primary purpose is to protect the soil absorption system from becoming clogged by solids
suspended in the raw wastewater. The wastewater is discharged from the home directly
into the tank where it is retained for a day or more. During this time, the larger solids settle
to the bottom, where a sludge blanket develops. The greases, oils and other floating
particles rise to the top to form a scum layer.
In addition to acting as a settling chamber and providing storage for the sludge and scum,
the septic tank also digests or breaks down the solids that have been removed. Anaerobic
bacteria, organisms that live without oxygen, feed on the sludge and reduce its volume. In
the process, soluble organic matter is released from the sludge into the effluent. Methane
and carbon dioxide gases are also produced which are vented from the tank through the
house plumbing vent. Only about 40 percent of the sludge volume can be reduced in this
manner, however and about once every three to five years it is advisable to pump the tank
to remove the accumulated solids. If this is not done, the tank will fill with sludge to the

SECTION C │ Soil Information
On-Site Sewage Management Systems Manual Page 36 of 289
point where the settled solids will be suspended and washed out into absorption fields,
where they can quickly clog the soil pores.
The clarified liquid flows from the septic tank to the soil absorption field for secondary
treatment and final disposal. It is an odorous liquid, high in partially degraded waste
constituents, suspended solids, organic matter, ammonia and nitrogen. Pathogenic
(disease-causing) bacteria and viruses may also be present in high numbers, as indicated
by the incidence of fecal coliforms.
However, the conventional septic tank system has no process designed specifically to
destroy pathogenic organisms. Should any pathogenic organisms be present in the sewage,
they may be removed by the sedimentation process or be killed by the septic conditions
existing in the septic tank. However, a large number of any pathogenic organisms present
initially in the sewage are carried out of the tank in the effluent. Since the system has no
chlorination process, the destruction of these remaining pathogens, as well as the oxidation
of the effluent, must be accomplished in the soil. These pathogenic organisms gradually
die off or desiccate as the effluent filters through the soil, but during this time they are
carried for varying distances. The smaller organisms, especially the viruses, may be carried
for great (although unknown) distances. The movement of viruses seems to depend on soil
moisture and with high water tables and saturated soil conditions; viruses may move a
considerable distance. In one New York state study, it was found that viruses are able to
travel more than 200 feet in sandy soils.
Primary and secondary treatment of sewage has the same goal, whether the treatment
occurs in a sewage treatment plant, an oxidation pond or an on-site sewage management
system. That goal is the destruction of all or most of the pathogenic organisms and the
removal by oxidation of the organic matter and other detrimental chemical compounds in
the sewage. The main difference is that in a sewage treatment plant, the treatment is
controlled and regulated by man through the use of various pieces of equipment. In the on-
site sewage management system, the treatment is dependent entirely upon natural
processes. Once the system has been installed, man has virtually no control over the
functioning of the system and can do little to regulate the treatment processes that are
occurring naturally. A certain amount of preventive maintenance can be provided, but,
except for removal of accumulated solids from the tank, this is only to avoid external
interference.
For this reason, the conditions under which a system is installed must be the most favorable
to the functioning of the system. This includes not only the construction of the system,
which is controlled by man, but also the natural factors, such as soil conditions, slope of
the land, drainage, water table, etc., that are not controlled by man but can be selected by
man. The selection of these natural factors is as important to the proper functioning of the
absorption field as is the selection of the proper equipment in a sewage treatment plant.
The conventional septic tank system uses sedimentation and anaerobic decomposition in
the tank and oxidation in the absorption field to treat the sewage. The two types of treatment
occurring in the tank take place at the same time and are counter to each other. The
settleable solids in the sewage settle to the bottom of the tank, removing about 35 percent
of the solids through putrefaction and fermentation. This decomposition produces large
amounts of gases, which tend to stir up the contents of the tank as the gases rise to the top.

SECTION C │ Soil Information
On-Site Sewage Management Systems Manual Page 37 of 289
Because of the rising gases, many of the fine particles which would otherwise settle out,
remain suspended in the liquid sewage and are carried out to the absorption field in the
effluent.
To a large degree, the amount of solids being carried out to the absorption field in the
effluent is determined by the accumulated solids in the tank. The tank will never clog
completely as long as effluent is carried out to the absorption field. As the accumulated
solids gradually build up in the tank, they increase in the effluent. To some extent, the
amount of solids in the tank and in turn in the effluent being carried out to the absorption
field can be reduced by increasing the retention time in the tank. This can be done by using
a larger tank. When the tank has reached its capacity and can accumulate no more solids,
the amount of solids in the effluent will equal the amount of solids in the raw sewage
coming into the tank minus those solids that are lost by decomposition. The solids leaving
the tank in the effluent are in direct proportion to the accumulated solids in the tank and to
the solids in the raw sewage coming into the tank.
The solids being carried out in the effluent can be held to a minimum by having the tank
frequently cleaned, i.e., by having the tank pumped to remove the accumulated solids.
Except for cleaning the tank, other maintenance is not required. While several septic tank
cleaners and other chemicals are on the market to assist the decomposition process
occurring in the tank or in the absorption field, these serve no useful purpose. The
decomposition process that occurs in the tank is a natural process carried out by anaerobic
bacteria and requires no outside chemical assistance. The aerobic process occurring in the
absorption field requires only oxygen, in addition to the bacteria present, for the
decomposition process to take place. Chemicals currently on the market do not
significantly aid the process and also may have some adverse effects on the system. In fact,
some products break down or loosen the sludge layer in the septic tank, which is then
flushed into the absorption field and causes premature clogging.
Chemicals such as magnesium and calcium tend to keep the soil open so that the effluent
can be absorbed more readily by the soil. However, magnesium compounds are poorly
soluble. When combined with the sewage or the effluent, these form compounds that are
not readily soluble so that their ions are not readily liberated. This reduces their
effectiveness in opening the soil. Sodium and potassium compounds are very soluble so
that their ions are readily available. However, these have an opposite effect from
magnesium and calcium ions, causing a breakdown in the soil, which increases the chances
of clogging. In either case, a relatively large amount of the chemical is needed to cause an
effect. If any benefits are derived by the use of the chemicals, it is only on a temporary
basis and will not be a solution to any problem.
“Seeding the tank” with anaerobic bacteria is another aid that has been advocated in starting
the bacterial process of a new tank. This is done by placing old sewage or sludge or manure
in the new tank so that the anaerobic process will begin immediately. However, raw sewage
coming into the tank from the building initially contains sufficient anaerobic and
facultative bacteria so that the seeding is not necessary, although it has no adverse effects.
Raw sewage initially contains three to five parts per million (ppm) of free oxygen and is
acted upon by aerobic and facultative bacteria. This oxygen in the sewage is derived from
the liquid waste (wash water, kitchen sink waste, bath waste, etc.) rather than from the

SECTION C │ Soil Information
On-Site Sewage Management Systems Manual Page 38 of 289
human waste. However, the oxygen is soon used up by the aerobic bacteria and the less
efficient facultative and anaerobic bacteria become more active. At this point, the sewage
becomes septic.
Sewage contains an abundance of nutrients and water, providing an excellent
microbiological medium for the growth of bacteria. Raw sewage contains from 100,000 to
1,000,000 bacteria per milliliter. This increases to 10,000,000 to 10,000,000,000 per
milliliter in aged sewage. The strictly aerobic bacteria cannot grow in stale or septic sewage
and tend to die off. However, many of the strict aerobes are spore formers and exist in the
stale or septic sewage in their dormant stage. The majority of the bacteria are facultative
and grow in septic as well as raw sewage. These bacteria also grow in the sewage effluent
that passes through the tank into the soil. Other microorganisms in sewage include
protozoa, fungi, nematodes and viruses. The amoebae are the major intestinal protozoa and
exist in the sewage in the cyst stage. Although the yeasts are facultative or anaerobic, most
of the other fungi, including the molds and the non-intestinal protozoa, are aerobic. The
aerobic organisms tend to die off in the septic sewage or occur in the cyst stage. In this
stage they are largely unaffected by the septic conditions. Since the viruses grow only in
living cells they do not increase in the septic tank or in the effluent in the soil. Instead, they
tend to die off over a varying but usually long period of time.
Many genera of bacteria are present in septic sewage. Among the acid producers,
Alcaligenes, Aerobacter, Escherichia, Flavobacterium and Pseudomonas are the most
numerous. These are facultative and are also active when the effluent is oxidized. A few of
the anaerobes are also acid producers. The methane formers are less numerous and are
strict anaerobes. These include species of the genera Methanobacterium, Methanococcus
and Methanoscorcina, although other species produce methane as one of their end products.
The Desulfovibrio species are strict anaerobes and are important in the reduction of sulfur
compounds. Their end product is hydrogen sulfide, which may react with existing metallic
ions to form other sulfides, most of which are insoluble.
Since anaerobic bacteria must derive their oxygen from organic matter, they must utilize a
larger amount of organic matter than do aerobic bacteria, but their decomposition processes
are not as complete as those of aerobic bacteria. The anaerobic decomposition processes,
because of the limited source of oxygen, are much slower than are the aerobic
decomposition processes. Because of this and the short time that sewage remains in the
septic tank, the decomposition of organic matter is incomplete and must be completed
through the oxidation processes in the soil.
In the putrefactive and fermentative processes that occur in the tank, the solids are broken
down into inorganic compounds, liquids and gases. In addition to these, many of the solids
initially in the sewage remain in the effluent since these processes are not carried to
completion due to the slow action of the anaerobic bacteria.
The solids that do remain tend to be converted to suspended and dissolved solids. While
many settleable solids still remain in the effluent, they are of a smaller size than are the
settleable solids in the raw sewage. These factors make the septic tank an inefficient means
of sewage treatment.
The 40-50 percent of nitro-organic compounds (mainly proteins, amino acids and amines)
is reduced primarily to simpler compounds (methane gas, ammonia and ammonium

SECTION C │ Soil Information
On-Site Sewage Management Systems Manual Page 39 of 289
compounds) through the process of ammonification. Fermentation of the 40-50 percent
carbohydrates (starches, sugars, cellulose, etc.) is partially carried out with the liberation
of large quantities of methane, hydrogen sulfide and carbon dioxide gases. The sugars and
starches are quickly acted upon by the bacteria. The cellulose, however, is fermented much
more slowly and receives only minimal bacterial decomposition while in the tank.
The sulfur compounds are acted upon by sulfur bacteria (species of Clostridium, Proteus,
Senatia, etc.), which produce hydrogen sulfide or other sulfides from organic sulfur
compounds. These sulfides, including dissolved hydrogen sulfide gas, are carried out to the
absorption field along with the compounds not acted upon. Detergents, soaps, fats, greases
and small amounts of other chemicals that are present in the sewage are acted upon very
little by the bacteria in the tank. Those that do not rise to the top of the tank as scum are
carried to the absorption field in the effluent.
The nitrogen cycle, the carbon cycle, the phosphorus cycle and the sulfur cycle are all
essential in nature for the decomposition and the reuse of essential materials. They are also
essential in the treatment of sewage, whether this treatment is in a treatment plant or in an
on-site sewage management system. In the conventional septic tank system, these cycles
have their beginnings in the septic tank under anaerobic conditions. The cycles are
completed only under aerobic conditions in the absorption field. Aerobic conditions must
be found in the soil in the absorption field or these cycles are incomplete and the organic
and inorganic matter remains in the unstable and offensive state.
In the nitrogen cycle, the nitrogen compounds (proteins, amino acids, amides, urea, etc.)
are partially decomposed into ammonia, methane gases and into ammonium compounds in
the septic tank under anaerobic conditions. This cycle is continued in the absorption field
where the compounds are oxidized first into nitrites and then into nitrates. The cycle is
completed when plants absorb the nitrates out of the soil and convert them into plant
protein. A continuation of the cycle is the conversion of the plant protein into animal
protein. However, in the area of the absorption field only part of the nitrates is taken up by
the plants. The remainder stays in the soil. Nitrates are generally considered quite mobile
in soils and can be leached out in the groundwater as well as taken up by plants. Private
water supplies in the vicinity of absorption fields will sometimes contain nitrates. The
concentration of the nitrates in well water is variable and is dependent upon the porosity of
the soil, the concentration of the nitrogen compounds in the sewage, the amount of nitrates
absorbed by the plants and the distance of the water supply from the absorption field. A
high concentration of nitrates in drinking water should be avoided. A maximum
contaminant level of 10 milligrams nitrates per liter of water has been set by the
Environmental Protection Division, Georgia Department of Natural Resources.
The oxidation of ammonium compounds to nitrites and nitrates is the nitrification process.
In the absence of oxygen, the reverse process is brought about by anaerobic bacteria and
the nitrates and nitrites are reduced to ammonium compounds.
The sulfur cycle is also reversible. The sulfur compounds in the sewage are decomposed
to hydrogen sulfide and to other sulfide compounds under anaerobic conditions in the tank.
In the absorption field, in the presence of oxygen, the sulfur bacteria oxidize these
compounds first to sulfites and then to sulfates. Under anaerobic conditions in the
absorption field the sulfites and sulfates are reduced to sulfides. Hydrogen sulfide or other

SECTION C │ Soil Information
On-Site Sewage Management Systems Manual Page 40 of 289
sulfides present in the effluent remain unchanged if anaerobic conditions exist in the
absorption field. The black odorous substance associated with malfunctioning or poorly
functioning absorption fields is ferrous sulfide. The presence of this product in an
absorption field indicates the lack of sufficient oxygen and therefore anaerobic conditions.
Ferrous sulfide is an insoluble compound and increases the clogging of the soil.
A properly designed and constructed absorption field is a very effective biological and
physical filter, which is able to break down the organics and other chemical substances and
remove pathogenic organisms, including viruses. This is true, however, only where the
soils meet rather specific criteria. Quite often these criteria are not met and failing systems
result, causing public health hazards and nuisances.
Unfortunately, many soils in the state do not meet the necessary criteria and thus are
unsuitable for on-site liquid waste disposal, while many others are only marginally suitable
and may require extensive modification to make them suitable. We are interested in
identifying those with minimal or no restrictions and also those soils with marginal
suitability that may be successfully modified and safely used for wastewater disposal.
C. Problems and Causative Factors in Failure of Subsurface Waste Disposal Systems -
Regardless of the initial permeability of the soil, many absorption fields fail after a number
of years of use due to soil clogging. This first type of failure discussed below might be
characterized as creeping failure, or death by old age and/or lack of proper maintenance.
Failure may be evidenced by the surfacing of untreated effluent causing nuisance odors
and public health hazards. Alternatively, subsurface ponding of water in the absorption
field may cause the tank to overfill, resulting in sluggishness or stoppage of the drains in
the buildings being serviced by the conventional septic tank system. Water then backs up
in toilets and other fixtures in the buildings.
The reason for creeping failure is the gradual formation underground of an impermeable
clogged or crusted layer in the soil below and around the absorption field. Flow of water
through this clogged or crusted zone is severely restricted or even eliminated, although the
permeability of the surrounding soil remains essentially unchanged. Consequently, large
volumes of septic tank effluent accumulate in the absorption field.
Several physical, chemical and biological phenomena occur, progressively or jointly, to
produce zones of gradually decreasing permeability in soils inundated by septic tank
effluent. These processes are largely independent of the composition, constitution or
texture of the soil at the system site, the design or layout of the absorption field or the
nature of the materials and techniques used in its construction. As a result, even the most
carefully constructed systems installed in soils of optimum permeability are subject to
failure through clogging or crusting. Some of the mechanisms involved in soil clogging by
septic tank effluent are described in the following paragraphs.
Every soil is composed of myriads of particles of varying shapes and sizes. Since these
particles cannot fit together perfectly to form a solid mass, each soil is replete with a
labryinthic series of interjoining pores of capillaries, which are normally filled to varying
proportions with air or water depending upon the moisture content of the soil. Because
these capillaries or pores are interconnected, moisture such as that from rainfall can slowly
pass from higher to lower layers (horizons) in the soil and eventually into the groundwater.
Soils composed mainly of large particles (sands) have larger capillaries and conduct water

SECTION C │ Soil Information
On-Site Sewage Management Systems Manual Page 41 of 289
faster (i.e., water soaks or percolates through sandy soils at higher rates). As soil particles
size decreases, the size of the capillaries also decreases and although the number of
capillaries increases, water soaks or percolates much slower through finer grained soils
(Rates decrease in the series: coarse sand >fine sand>sandy loam>silt>silt clay>clay).
When large amounts of pure water are allowed to pass through soils composed of particles
of different sizes, the rate of percolation is found to gradually decrease. The reason for this
is that the flow of water causes smaller particles to become dislodged and to be swept into
some of the larger capillaries where they become lodged in constricted areas, effectively
blocking the capillaries.
This phenomenon causes deterioration of the physical structure of the soil and when
referred to surface soil it is given the name “puddling.” Compression of puddled soils can
cause “smearing,” i.e., more effective blockage of the soil capillaries under compression
forces. Smearing can occur during construction of on-site sewage management systems if
heavy machinery is run over or used to excavate wet soils. This compression effect can
cause reduction in flow through the walls of absorption trenches as it effectively seals off
soil capillaries.
Puddling and smearing are not the only phenomena that initiate blockage of the soil
capillaries. Although most of the solids present in household waste waters (usually about
400 ppm) settle out as sludge at the bottom of the septic tank and the bulk of fats and grease
separates as a floating scum at the top of the tank, the effluent discharged at an intermediate
height from the tank into the distribution system leading to the absorption field is not
completely free of suspended insoluble solids. Residues of vegetable matter and fibers from
toilet tissue and similar items form swollen gel-like particles not very different in density
from water. Such particles do not settle out rapidly and some are carried in the effluent into
the absorption field. Normal septic tank effluent usually contains about 140-150 ppm of
suspended solids. The capillaries in the soil of the absorption field filter out these
suspended particles very effectively, but the pores of the soil filter become stopped up by
them, reducing the rate of percolation.
Effluent from the tank also contains large numbers of bacteria. The bacterial cells also
behave like small particles. They are filtered out of the percolating effluent by the soil
capillaries, causing further blockage of the soil pores.
Both these bacteria and the natural soil bacteria present in the absorption field are provided
with a constant supply of dissolved inorganic and organic nutrients that contained in the
effluent flowing into the field. Consequently, all of these bacteria multiply very rapidly in
the soil and the resulting microbial biomass creates further barriers to the seepage of water
through the soil capillaries.
Although these phenomena cause a detrimental reduction in the rate of flow of water
through the soil, they also produce a beneficial increase in the wastewater treatment
capability of the soil. A tighter filter is more efficient at removing suspended solids while
the larger bacterial biomass is more efficient at degrading organic wastes in the septic tank
effluent.
Septic tank effluent enters the absorption field intermittently in direct relation to amount
and frequency of water usage. Effluent entering the septic tank displaces a finite volume

SECTION C │ Soil Information
On-Site Sewage Management Systems Manual Page 42 of 289
of clear liquid into the absorption field. To avoid surfacing of effluent or saturation of the
absorption field, soil percolation rate must balance the volume of the effluent to be filtered
through the soil layers. As a sequel, air enters the absorption field through soil pores to
further dry the absorption field.
As long as air continues to be drawn into the absorption field as the water soaks away, a
mixed population of aerobic microorganisms will remain in the absorption field to affect
biodegradation of the soluble and insoluble organics transported into the absorption field
with the septic tank effluent.
However, as more and more soil capillaries become plugged, the rate at which the water
seeps away becomes slower and slower so that less and less air is drawn into the absorption
field. Under these conditions, aerobic fermentation in the absorption field is gradually
replaced by anaerobic fermentation.
During microbial fermentations, microorganisms digest organic materials using part of
them for energy maintenance and part for forming their cellular mass. In order to break
down and utilize organic compounds, microorganisms must have other compounds
available to be used as electron acceptors. The oxygen present in the air is the normal
terminal electron acceptor used by all aerobic organisms in this process. The oxygen is
reduced to water and used to produce carbon dioxide (CO2) from some organic
compounds. If no air is available, microorganisms that can live in the absence of air
(anaerobic bacteria) will use other inorganic (e.g., nitrate or sulfate) or organic compounds
as electron acceptors. Reduction products associated with organic matter conversion under
anaerobic conditions include nitrogen (from nitrate), sulfide (from sulfate) and methane
(from organic), each again being accompanied by carbon dioxide (CO2) produced from
organic matter decomposition.
In absorption fields, when air is no longer drawn into the soil the range of electron acceptors
available to microorganisms in the absorption field becomes very restricted. There is no
dissolved oxygen in the septic tank effluent because any air in the water has already been
used up in fermentations in the tank. Most of the simple, readily biodegradable organic
compounds have also been converted in the tank, so that these, too, are no longer available
as electron acceptors. Only minor amounts of methane are produced in ponded effluents.
The only significant electron acceptor available in ponded fields is sulfate (4-10 ppm). This
is rapidly reduced to sulfide. Even though septic tank effluent is alkaline (pH=7.5-8.0),
owing to free ammonia in the water, free hydrogen sulfide (odor) becomes detectable in
fields that have been constantly ponded for a few months.
Sulfides are toxic to most microorganisms. Only surface bacteria, which can reduce
sulfides further to elemental sulfur, can survive in the presence of high sulfide
concentrations. The presence of free sulfide in stagnant absorption fields may therefore kill
off many of the bacteria, which would otherwise be degrading organics. Some of the free
sulfide may be converted to insoluble sulfur, causing further blockage of soil pores.
However, very little of the sulfide produced in the absorption field remains in the free state.
The bulk of it combines with ions of heavy or transition metals (e.g., iron, manganese,
nickel, copper, magnesium, zinc, etc.) present in the soil or in the wastewater (5 ppm total
metal cations in septic tank effluent). This causes the deposit of black, insoluble, inorganic
sulfides in the beds. Failed absorption fields invariably have intensely black impervious

SECTION C │ Soil Information
On-Site Sewage Management Systems Manual Page 43 of 289
layers underneath and around the gravel. The gravel itself is generally coated with black
slime. This is not surprising since incoming tank effluent already contains 2-5 ppm of
sulfide.
The insoluble sulfides contribute to further blockage of the soil capillaries, but this may
not be their most deleterious effect. Many elements tied up in insoluble form as sulfides
are required by microorganisms for their redox enzymes, the organic catalysts needed for
respiratory functions, including degradation of organic matter. Binding of trace elements
by sulfides may therefore inhibit organisms otherwise capable of destroying organic
materials in the absorption field.
One last contributor to clogging is the action of the anaerobic bacteria themselves. Many
microorganisms, especially anaerobic bacteria, produce polysaccharide slimes or gums,
which they secrete into their surroundings. These seem to function as a protective sheath
around the bacterial cell wall. When formed in situ in the absorption field, such
polysaccharides help to form an impermeable layer in the bacterial zone. Organic matter,
obtained from clogged layers of ponded fields, contain about 5% polysaccharides, some of
which may be from bacterial slimes or gums of this type.
Appearance of Clogged Zone: A combination of physical deterioration in soil structure,
soil pore blockage by solids and bacteria from the effluent, proliferation of heterotrophic
soil bacteria and deposition of insoluble sulfides and bacterial slimes, gums and metabolites
(e.g. sulfur) produces a zone of clogging in the soil which will not allow water to seep away
at a tolerable rate. Measurement of the distribution of organic matter through typical
clogged layers reveals that the bulk of this material occurs in the soil immediately next to
the gravel. The amount decreases abruptly with the distance outward or downward from
the gravel. A similar distribution is found in the amount of sulfides in the soil.
Where this type of zone occurs in a coarse textured soil, air can begin to penetrate into the
soil beneath the clogged areas restoring aerobic conditions when the flow of water
diminishes. The minor amounts of organic matter present under the zone of maximum
clogging are then apparently oxidized and degraded rapidly, so that the soil in this region
reassumes an almost natural appearance. A relatively sharp boundary then results between
this aerobic layer and the heavily blocked, black anaerobic layer. The dense anaerobic layer
becomes very hard and brittle, assuming the character of a crust in the soil. Occasionally a
narrow grey intermediate zone is observed underneath the black crust. This crust is very
strong since it is capable of retaining thousands of gallons of stagnant water, which are
ponded above it in the field under several feet of hydrostatic head. The soil above the crust
is thus permanently saturated with moisture, but that below the crust is unsaturated,
generally having about the same moisture content as similar soils at the same depth in areas
quite far removed from the field.
D. Other Causes of Failure - Other possible causes of failures with on-site sewage
management systems that use soil for final treatment include, but are not limited to:
1. Seasonal or permanent high ground water elevations;
2. Structural damage to soils with high clay content by construction equipment, especially
if soil moisture is high;
3. System improperly installed;

SECTION C │ Soil Information
On-Site Sewage Management Systems Manual Page 44 of 289
4. Inadequate design capacity for the actual sewage loading;
5. User abuse in the form of overloading, failure to perform maintenance intervals, neglect
of leaking or maladjusted plumbing fixtures, inordinate use of chemical additives or
other deleterious material and physical damages to part of the sewage system caused
by digging, grading, filling, heavy traffic or other damaging actions;
6. Flooding by storm water or other surface water sources; and
7. Adverse soil conditions such as shallow bedrock or very slowly permeable soil
conditions.
3) Soil Evaluations
A. Use of Soil Maps in Evaluating Site Suitability for Soil Absorption Systems - Soil maps are
an essential part of the environmental evaluation of an area. They represent parts of the
earth surface. Soil evaluation for on-site sewage management systems involves a specific
location in the landscape that is difficult to describe without a map.
The soil maps indicate different soil types by soil symbols and the solid lines containing
the symbol show the boundary and extent of each area. For example, Troup (Tr) represents
a deep, well-drained soil, located on upland ridge tops and hillsides of the Southern Coastal
Plains; Chatuge (Ch) represents a deep, poorly drained, nearly level soil located on low
stream terraces in mountain valleys. Interpretations of the soil maps will indicate whether
or not soil at a particular site is subject to an intermittent high groundwater table or has
rock formations near the surface. These will also help to avoid mistakes caused by variable
percolation test rates that result from the test being conducted during different seasons of
the year.
The preliminary investigation of an area with soil maps will permit the determination of
site suitability regardless of the time of year the evaluation is made. The soil map is reliable
for predicting general soil capabilities for an area of several acres. However, it generally
does not contain enough detail to predict the limitations for a specific disposal site because
different types of soil can exist within short distances. Maps are likely to be least reliable
in the vicinity of a soil boundary.
The preliminary investigation of an area with the use of soil maps can be an important tool
in reducing development costs. If the soil map indicates that a high percentage of an area
is unsuitable for conventional septic tank/soil absorption systems, it may not be
economically feasible to pursue development. This would require consideration of
alternative on-site sewage management systems or a community or public sewage
treatment system. If a community or public sewage treatment system is selected, then a lot
by lot evaluation could be eliminated.
A subdivision map or plat showing lots and roads is of little value for evaluating an area
for the development of conventional septic tank/soil absorption systems unless soil types
have been used as a basis for the evaluation. In fact, without consideration of soil types
during the preliminary investigation, this could create problems such as road and street
relocation, resubdividing and other costly changes.
B. Physiographic Provinces - The physiographic provinces or major land resources areas

SECTION C │ Soil Information
On-Site Sewage Management Systems Manual Page 45 of 289
(MLRA’s) provide a general idea of what can be expected in terms of soil conditions and
parent materials. Georgia has eight provinces that vary greatly from the mountains to the
sea. See Figure 2.C.
• Sand Mountain (MLRA 129) - This province consists of mountain plateaus with gently
sloping ridge crests at elevations of approximately 1500 to 2000 feet above sea level.
Side slopes of the plateaus are steep with escarpments of sandstone, shale and
limestone. Mean annual rainfall is approximately 54 inches.
• Southern Appalachian Ridges and Valleys (MLRA 128) - This province consists of
ridges of limestone, cherty limestone, sandstone and gently sloping valleys filled with
material eroded from the ridges. Elevations range from approximately 600 to 1500 feet
above sea level. Mean annual rainfall is between 52 and 56 inches.
• Southern Blue Ridge (MLRA 130B) - The Blue Ridge Province consists of mountain
ridges with steep slopes, foothills and narrow intervening valleys, underlain by acid
crystalline metamorphic rock. Depth to rock is shallow except over some of the
colluvial materials occurring near the bottom of slopes. Elevations range from about
700 to 4,700 feet above sea level. Mean annual rainfall is between 52 and 90 inches.
• Southern Piedmont (MLRA 136) - This province is a broad plain that has been dissected
by streams. It is an old land surface with rounded slopes that is underlain by acid
crystalline and metamorphic rock. Elevations range from about 500 to 1500 feet above
sea level. Mean annual rainfall is 44 to 56 inches. The degree of the slope has a strong
influence on the soils developed over a given parent material. On steep relief, the soils
are generally shallow and weakly developed, while on flat relief the soils are usually
deeply weathered with deep clay subsoils. Clay or fragipans are frequently associated
with flat areas and seasonal water tables are associated with these soils.
• Sand Hills (MLRA 137) - This province consists of gently sloping to steep sloping soils
derived from marine sands, loams and clays that were deposited on acid crystalline and
metamorphic rocks. Elevations range from 300 to 500 feet above sea level. Mean
annual rainfall is between 40 and 52 inches.
• Black Lands (MLRA 135A) - This province consists of irregular out-croppings of marl
and clays and shallow to moderately deep soils derived from marl and clay. Elevation
is approximately 400 feet above sea level. Mean annual rainfall is about 46 inches.
• Southern Coastal Plain (MLRA 133A) - This province consists of soils occupying broad
in stream areas having gentle to moderate slopes and underlain by marine sands, loams
and/or clays. Elevations range from approximately 250 to 500 feet above sea level.
Soils are generally deep and depth to rock is usually greater than six feet. Mean annual
rainfall is between 40 and 52 inches.
• Atlantic Coast Flatwoods (MLRA 153) - This province consists of nearly level and
shallow depression soils, which generally have seasonal high water tables and are
underlain by marine sands, loams and/or clays. Deep sandy surface soils are usually
found in this province, but loams and clays underlie most of the area and restrict
downward movement of water. Seasonal water tables and drainage are a problem.
Elevations range from sea level to about 300 feet above sea level. Mean annual rainfall
ranges between 44 and 53 inches.

SECTION C │ Soil Information
On-Site Sewage Management Systems Manual Page 46 of 289
• Tidewater Area (MLRA 153B) – This province is on a nearly level coastal plain crossed
by many broad, shallow valleys that have meandering stream channels. Most of these
valleys terminate in estuaries along the coast. Mostly unconsolidated Coastal Plain
sediments occur at the surface throughout this area. They are a mixture of river-laid
sediments in old riverbeds and on terraces, flood plains and deltas. The soils in the area
are characterized by restricted drainage; an aquic moisture regime; and mixed clay and
siliceous mineralogy. The water table typically is close to the surface. Elevation ranges
from sea level to less than 25 feet. Local relief is mainly about 3 feet or less. Average
annual precipitation in this area is 40 to 58 inches.
C. Soil Profile - A soil profile consists of a vertical section of the soil extending through all
its horizons and into the parent material. A number of similar soil borings indicate a soil
series landscape. A soil profile will have a surface soil, a subsoil and parent material.
Upland soils, other than in the coastal plains, usually have hard rock below the parent
material.
Soil borings are made in a unit of landscape to confirm expectations. A record should be
kept of the depth, color, and texture of each major horizon. The record should show the
range in depth, color and texture within a unit of landscape. Several borings may be
necessary where deviations are noted.
Soils on hilly or steep topography can frequently be expected to have thin or no subsoils.
In some places, the original surface has eroded away and the present surface layer contains
subsoil material.
Changes in the soil series may be due to changes in parent material, deposits or capping,
and depth to restrictive layers such as clay, sand, fragipans or hard rock.
The soil borings will indicate depth to hard rock. The soil color, especially subsoil color,
will indicate the presence of a seasonal water table in the soil, which causes problems
during wet weather. The soil texture will indicate possible problems with the rate of
absorption, as well as the best horizon to test for absorption rates and in which to install
absorption lines.
D. Soil Color - Soil color is a reliable guide to the natural drainage of a landscape. It can
provide clues as to whether the soil has difficulty absorbing the normal rainfall or can
absorb the rainfall without ponding at some point in the soil profile.
Soil color is directly related to the oxidation or reduction of the iron present in most soils.
The organic acids passing through the soil require the addition of oxygen from their
decomposition to carbon dioxide and water. When soil pores remain filled with water for
extended periods, the oxygen supply is restricted and the iron is reduced to help supply the
needed oxygen. This produces gray, brown or red mottles or gray matrix color.
The significance of this to the proper function of an absorption field is that colloidal organic
matter moves into the absorption field and, if not oxidized, tends to block the soil pores. In
addition, unaerated sewage effluent then travels into the ground water for reuse in a very
poor quality condition.
Uniform red, brown or yellow soil color does not insure the proper function of an
absorption field. It does indicate that the soil is able to absorb the normal rainfall without

SECTION C │ Soil Information
On-Site Sewage Management Systems Manual Page 47 of 289
ponding, but soils with bright colors (red, brown, yellow) may have slow rates of
absorption and, consequently, not be capable of absorbing the additional burden of sewage
effluent.
Red or Brown - Red or brown colors indicate good natural drainage in relation to rainfall.
Soils with these colors occur on upland ridges or side slopes and allow good runoff of
rainfall. Many soils that are red or brown in color may have slow rates of absorption.
Gray - Gray colors indicate a ponding of water in any horizon in which they occur. Soils
with gray colors occur on flat or slightly depressed low lands and most of the rainfall soaks
into these soils. The ponding of water is generally seasonal in nature and usually will not
be present in dry periods. It can occur in sands or clays and may not be directly related to
percolation tests. Gray color may also occur in the lower subsoil or at the horizon of some
soils on steep slopes and should not be interpreted as a sign of wetness in these instances.
Black - Black colors are due to organic matter that masks the true color of the soil. Organic
matter accumulates because the soils remain wet most of the time, which prevents its
breakdown. Soils with this color exist in shallow depressions or bays.
Gray and Yellow Mottling - Gray and yellow mottling indicates a seasonal ponding of
water in the soil at the depth at which the mottling occurs. Absorption lines shall not be
placed at depths where the mottling is observed because they can be expected to fill with
ground water during wet periods. To be reliable, moist soil from the subsoil of the profile
should be observed for color. In most cases, there is a direct relationship between soil color
and landscape positions.
Water may pond in soils for very short periods above the levels indicated by gray mottles.
The gray color indicates the water ponds for an extended period. Even a mottle-free soil
may be saturated for short periods after a rain.
Gray Color in Soil - The gray color or gray mottles are usually associated with ponded
water in the soil profile. It is related to the reduction of the iron in the soil from the ferric
to the ferrous form. Reduction of iron occurs when organic acids are present in a saturated
soil with limited oxygen. The organic acids are unable to secure enough oxygen from the
water and revert to the next most readily available supply from the ferric iron. Gray mottles
or colors indicate the supply of oxygen is limited during wetter portions of the year. A
higher percentage of gray in a soil indicates longer duration and greater frequency of the
ponding periods.
Soils with gray colors or mottles indicate potential problems with absorption systems.
Periods of soil saturation will interfere with the disposal of water into the soil. Soils with a
wetness problem have a low oxygen supply during saturated periods and the addition of
effluent compounds the problem, causing more rapid clogging of soil pores with organic
waste.
Gray colors or mottles indicate about four weeks of saturation on a repeating basis
throughout the year. The cause of the saturation of the soil may be due to slow percolation
in the gray mottled zone or to a restriction at some depth below the horizon which ponds
water into the mottled horizon.

SECTION C │ Soil Information
On-Site Sewage Management Systems Manual Page 48 of 289
Absorption fields installed in mottled horizons of soil will have difficulty absorbing sewage
effluent and organic waste during the periods of saturation. Saturation of the absorption
field will eliminate the safety factor provided by the gravel trench storage area and overload
the system. Repeated saturation of absorption fields with excess ground water causes
blocking of the soil pores with colloidal organic matter due to low oxygen supply.
Unsaturated conditions are necessary at both the absorption field depth as well as below
the absorption field for a reasonable distance to insure adequate filtration and treatment of
sewage effluent.
E. Natural Soil Drainage - The natural drainage of soil depends on how much of the water
falling on the soil enters the soil and how well it passes through the soil. The position of
the soil on the landscape and the degree of slope influence the former and affect the
drainage class of the soil.
Flat land or depression areas have very little runoff and may receive additional runoff from
higher ground, most of which must drain through the soil. Poorly drained soils generally
occur in these positions. Undulating or rolling land has more runoff and less water must
pass through the soil. Soils in these positions are generally well drained or moderately well
drained. On steep slopes, most of the water runs off. The amount and types of vegetation
also influence the amount of runoff.
The texture of the soil is another factor that influences the natural drainage. Sandy soils
drain better than clay soils. A well-drained clay soil may still not be absorbent enough to
pass a percolation test. Whether the subsoil is heavy (clay) or light-textured (sandy) may
influence the natural soil drainage.
Fragipans and solid rock influence the natural drainage because they restrict the downward
movement of water. If the internal drainage is limited, then the capacity of the soil to absorb
water is limited and water will stand in the soil above the restriction.
The presence of water above the restriction is reflected in the color of the soil. The colors
and where they occur in the soil are used in determining the drainage class of the soil. The
drainage classes do not refer to specific depths at which the mottling occurs but rather to
the horizons in which mottling occurs. The depth to gray mottles will affect classification
of the soil.
The question might be raised as to how the soil could be excessively drained. The
excessively drained class is a reflection of the availability of water to plants rather than of
drainage as such. It reflects drainage in that these soils do not hold enough moisture for
normal plant growth. However, soils that are excessively drained may be undesirable for
the installation of on-site sewage management systems due to the fact that the effluent may
pass through the soil too rapidly to be properly filtered and thus reaches the groundwater
before it has been adequately treated.
The drainage classes are as follows:
1. Poorly Drained Soils - Poorly drained soils can generally be expected on broad flats or
depression areas along drainage ways. Runoff water moves very slowly and the soil
remains saturated for long periods. Frequently, these soils receive additional runoff
water from higher surrounding areas. The seasonal water table is at or near the soil
surface for long periods. The surface and subsoil colors are grays with a few yellow

SECTION C │ Soil Information
On-Site Sewage Management Systems Manual Page 49 of 289
and reddish mottles. Frequently the subsoils are clay, but poorly drained soils may also
be sandy. Percolation tests are not needed on these soils because a seasonal water table
will restrict their use. Some of these soils may pass a percolation test during dry periods.
2. Somewhat Poorly Drained Soils - Somewhat poorly drained soils occur on flat to gently
sloping relief and most of these areas are subject to flooding. Water drains from the
surface soil but not from the subsoil. They are commonly mottled with gray at depths
of six (6) to twenty (20) inches from the soil surface. They have a seasonal water table
in the lower surface or upper subsoil. The entire soil generally has a yellowish or
leached appearance, indicative of internal drainage problems. The percolation tests, if
done in such soils, must be conducted above the seasonal water table elevation and be
properly saturated prior to running the tests.
3. Moderately Well-Drained Soils - Moderately well drained soils occur on nearly level
to strongly sloping topography. These soils have gray mottling in the lower subsoil
(below 20 inches), indicating a restriction to drainage below this depth. Soils with
restrictive layers, such as fragipans, may have this drainage classification but it is not
restricted to soils with fragipans. These soils generally have rather pale surface colors
but may have red, brown or yellow colors in the upper subsoil. Percolation tests on
these soils will mainly measure lateral movement of water because movement is
restricted in the lower subsoil. Deeper percolation tests may be necessary to determine
the degree of restriction to internal drainage.
4. Well-Drained Soils - Well-drained soils occur on nearly level to steep relief. They are
free of internal restrictions in natural drainage. The soils may be red, brown or yellow
in the subsoil. In some places, yellow and red mottling may occur in the lower subsoil.
These soils may need to have percolation tests run because some well drained soils are
too heavily textured (clayey) to absorb water at the necessary rates.
5. Excessively Drained Soils - Excessively drained soils generally have little or no subsoil
development and do not retain much water. Most of these soils are sandy. Many of
these soils are shallow to rock north of the fall line. Contamination of shallow ground
water aquifers is a concern where these soils are being considered for the installation
of on-site sewage management systems using soil absorption for disposal of effluent.
F. Soil Texture - Soil texture depends upon the relative proportions of sand, silt and clay
particles in a soil. These proportions can be determined by special equipment in a
laboratory. Relative differences in soil textures can be determined in the field by feeling
the soil when moist. It is of value to determine if a soil is predominantly sand, clay or silt
or is a mixture of various sizes. Within a geographic region, infiltration rate, permeability,
aeration and drainage are closely related to soil texture. The evaluation of texture is needed
to provide some indication of the rate of absorption and problems with absorption. Sandy
horizons will have larger pores than clayey soils. Thus, a clay soil can be blocked by
organic matter in the drainfield more readily and fail more rapidly. The essential part of
texture evaluation is to determine if a soil is sandy or loamy or contains enough clay to
produce a ribbon when moist.
G. Seasonal Water Tables and Free Water in Soils - Attempting to determine seasonal water
tables by the free water present in a soil at any point in time can create problems with
uniformity of evaluation. The problem is one of consistency of evaluation both in wet and

SECTION C │ Soil Information
On-Site Sewage Management Systems Manual Page 50 of 289
dry periods. Therefore, the evidence of gray colors or gray mottling is the best indicator to
determine if soils are saturated or have seasonal water tables. Free water may occur above
the depth of gray colors or mottling in wet periods and be absent in dry periods. Thus, a
reliable evaluation of seasonal water tables must include gray colors. Generally, the
presence of Chroma 2 gray color in the soil horizon is an indication of the seasonal high
water table.
Free water moves through the larger soil pores after a rain. The distance that the free water
moves downward depends on the intensity and duration of rain, the surface absorption
capacity of the soil, changes in pore size with soil texture, depth to restrictive layer and the
amount of free water already in the soil. Free water will pond on top of a soil or near the
surface causing seasonal water tables that usually can be observed during late winter or
spring. Care must be exercised in using the presence of free water to indicate a seasonal
water table. A well-drained sand may have free water moving through the profile for a day
or two following a heavy rain. Therefore, free water present in the soil shall be associated
with gray colors in the form of mottles or base color of the soil to provide consistency in
indicating seasonal water tables. When free water is present in the absence of gray soil
colors, this could indicate a slow rate of absorption.
Seasonal water tables are the result of restrictions in free water movement. The restrictions
can be clay horizons, plinthite horizons, dense sandy horizons, parent material, fragipans
and rock. Oxidation of organic waste is greatly reduced in the presence of free water. Since
one of the objectives of an absorption field is the oxidation of organic matter, the
accumulation of this waste creates problems. The soil pores are clogged with biomass from
the growth of microorganisms. Health hazards may result if a seasonally high water table
forces the sewage effluent in an absorption field to surface, causes effluent to back up into
a dwelling or commercial establishment or allows the effluent to enter and contaminate
ground water.
H. Degree and Type of Slope - Soil information and soil type have a definite relationship with
relief and landscape features. Major changes in slope usually indicate changes in soil
characteristics. Landscapes can be mentally divided into slope units for evaluation. Not
only the degree of slope, but also the type of slope should be observed. A convex slope has
a mounded shape and is shallow to parent material. A concave slope is bowl-shaped and
because of the slow movement of runoff water, there is a corresponding increase in the
amount of water moving through the soil, which weathers the parent material and forms a
deeper soil. The type of slope commonly changes from one side of a drainage way to the
other. Examples may include:
1. Flat Topography - Flat topography receives the maximum impact of climate in the form
of rainfall. Slopes are less than 2 percent. Runoff, if it occurs, is very slow and ponding
is common for long periods. The rain has time to enter the soil, resulting in more intense
and deeper weathering, which causes downward movement of clay and thick sandy
surfaces. Internal drainage problems and seasonal water tables are expected on flat
landscapes.
2. Gently Sloping Topography - Gently sloping topography appears flat but actually has
a slight convex curve to the surface. Slopes range from two to six percent. This allows
for a portion of the rainfall to run off before entering the soil. The soils on this type of

SECTION C │ Soil Information
On-Site Sewage Management Systems Manual Page 51 of 289
topography are generally weathered and deeply developed but can be expected to be
better drained than those on flat topography.
3. Sloping Topography - Sloping topography includes those with slopes in the range of
six to fifteen percent. Runoff is increased and the soils are generally shallower to parent
material. High clay content layers are common between 15 and 36 inches from the
surface. Natural waterways are a problem in subdivisions, and lot adjustment may be
necessary to avoid drainage ways. Erosion of surface soils can be a major problem in
subdivisions due to increased slopes with this type of topography.
4. Concave Relief - Concave relief describes areas of depression. These areas receive large
amounts of water and tend to be very wet. Generally, they are not acceptable for
construction of absorption fields.
I. Position in Landscape - The position of an area of land in the landscape, like the
physiographic province, gives some idea of what to expect in terms of soils. The position
may be apparent from observation or it may become apparent as soil borings are made.
Examples may include:
1. Alluvial Position / Bottom Land / Floodplain - Alluvial positions are the areas adjacent
to streams or rivers where flooding may occur. They differ slightly from colluvial
positions in that the soil material has been picked up by floodwaters, sorted by stream
flow and deposited. Sandy materials are deposited adjacent to the stream channel and
clays are deposited in the slack water adjacent to the valley walls. The alluvial soils are
formed by deposition in layers rather than by weathering of parent material. The soil
horizons are not distinct and may be nothing more than textural changes. The position
in the landscape is characteristic in that it is a flat area adjacent to the stream, with the
soil having poor definition in terms of surface soil and subsoil horizons. The soils may
range from excessively drained to poorly drained. Rates of absorption are not a problem
in dry weather in the better drained alluvial soils. The major hazards are periods of
flooding and the complete saturation of the soil that occurs during these times.
2. Colluvial Positions (Local Alluvial) - Colluvial positions are the areas along drainage
ways that periodically flood during and after a rain. Runoff water from the upland
carries small rocks and soil material down the slopes and part of this is deposited at the
base of the slope with little sorting. The result is a filling of the area with partially
sorted soil material and the development of a deep surface horizon. The soil in such a
position may range from excessively drained sand to poorly drained clay. The problem
with colluvial areas is the periodic flooding of the soil during and after a rain, the
seepage from adjacent uplands that keeps the soil moist and the natural accumulation
of organic matter. Flooding does not always remain long enough in some places to
reduce the soil and produce a gray color. The incidence of failure of absorption fields
is related to the accumulation of organic matter. Over a period of time, the absorption
field fails as the organic matter accumulates in the field and blocks lateral movement
of water. Detailed topographic maps provide a good means of locating drainage ways
in the landscape. Observing the landscape before making soil borings may indicate the
site to be the lowest point and thus the channel of runoff water. The soil borings may
indicate a deep uniform surface soil not expected in upland soils. Rates of absorption
may be good in such positions in dry weather.

SECTION C │ Soil Information
On-Site Sewage Management Systems Manual Page 52 of 289
3. Old Colluvial - Old colluvial deposits are formed from materials that have moved
down-slope by gravity and water. The material has not been sorted and may contain
angular and partially rounded rocks of all sizes. These deposits are generally associated
with mountainous areas but may occur at a considerable distance from their source.
The distinguishing features are a uniform slope gradient at the base of the mountain
and the loose rock throughout the profile. The depth of thickness of the deposit is
variable. The natural drainage ranges from well drained to poorly drained. The area of
contact with the old land surface frequently forms a tight layer, resistant to water
movement, which may be reflected in the natural drainage of the soil. Local deposits
of material occur on mountain slopes and throughout the Piedmont and Valley
provinces. The soil problems are similar to those of upland soil except that a tight layer
can be expected at the point of contact with the old land surface, which may limit
absorption. Stability of the material may be a problem when it is cut for roads or house
sites. Weathering of underlying rocks is generally deeper than that of adjacent areas
without colluvial depositions.
4. Terrace Positions - The terrace positions are the old alluvial positions that have been
left by the down cutting of streams. The result is that only the low terrace positions
may flood under normal rainfall. The terrace positions are generally underlain by gravel
depositions. The topography is characterized by the almost flat relief and the location
adjacent to streams but at a higher elevation. The soils range from well drained to
poorly drained, with the better drained soils adjacent to the stream and more poorly
drained soils adjacent to the valley walls. The soils have developed surface and subsoil
horizons similar to upland soils. They are frequently underlain by rounded gravel
depositions. The problems of these soils are similar to those of the upland soils. The
gravel deposits may be loose or compact and dense. Many soils in this position have
fragipans. The lower terraces are subject to flooding.
5. Upland Positions - This term includes all areas not covered by other positions. The
soils developed in these positions result from the soil-forming factors working on
parent material. The natural drainage may range from excessively drained to very
poorly drained and is not related to elevation. The upland soils are strongly influenced
by and reflect the type of parent material from which they were formed and are also
influenced by the degree of slope.
4) Soil Investigations
A. Definitions:
1. “Certified Soil Classifier” means a person who holds at least a Bachelor of Science
degree from an accredited college or university with a major in agronomy, soil science
or related field of science, as approved by the Soil Classifiers Certification Advisory
Committee.
a. Must complete a minimum of 30 semester credit hours or equivalent quarter hours
in the biological, physical, chemical and earth sciences with a minimum of 15
semester hours or equivalent quarter hours in soil courses meeting the following
distribution:

SECTION C │ Soil Information
On-Site Sewage Management Systems Manual Page 53 of 289
(1) A minimum of one course in soil classification, morphology, genesis and
mapping;
(2) The remaining soil course credits must be in at least three of the following eight
categories: introductory soil science; soil fertility; soil microbiology; soil
chemistry; soil physics; soil management, soils and land use or soils and the
environment; soil mineralogy; or a three-credit maximum in independent study,
geology, or hydrology.
b. Must have four (4) or more years of full time or equivalent part time experience
performing the following under the supervision of a Certified Soil Classifier, who
has met the educational and experience requirements: actively mapping, identifying
and classifying soil features in the field and interpreting the influence of soil
features on soil uses.
c. Must pass a written examination administered by the Soil Classifiers Certification
Advisory Committee.
d. Must be certified as a Soil Classifier by the Environmental Health Section,
Department of Public Health.
2. “Certified Soil Classifier-in-Training” means a person who holds at least a Bachelor of
Science degree from an accredited college or university with a major in soil science or
related field of science, as approved by the Soil Classifiers Certification Advisory
Committee.
a. Must complete a minimum of 30 semester credit hours or equivalent quarter hours
in the biological, physical, chemical and earth sciences with a minimum of 15
semester hours or equivalent quarter hours in soil science courses meeting the
following distribution:
(1) A minimum of one course in soil classification, morphology, genesis and
mapping;
(2) The remaining soil science credits must be in at least three of the following
eight categories: introductory soil science; soil fertility; soil microbiology; soil
chemistry; soil physics; soil management, soils and land use or soils and the
environment; soil mineralogy; or a three-credit maximum in independent study,
geology, or hydrology.
b. Must pass a written examination administered by the Soil Classifiers Certification
Advisory Committee.
c. Must work under the direct supervision of a Certified Soil Classifier.
d. Must be approved as a Soil Classifier-in-Training by the Soil Classifiers
Certification Advisory Committee.
B. Soil Investigation Requirements:
1. Subdivisions:
a. Pre-Development Review - It is recommended that developers considering
subdivision or mobile home park development obtain at least a preliminary soil

SECTION C │ Soil Information
On-Site Sewage Management Systems Manual Page 54 of 289
study from a Certified Soil Classifier, Registered Engineer or Registered Geologist
prior to developmental improvements.
b. Final Review - A soil map and soil descriptions based on a high intensity soil study
are required for subdivisions and mobile home parks prior to approval of such
development by the county health authority. The soil map shall be overlaid onto a
copy of the final subdivision plat and the approved professional (Certified Soil
Classifier, Registered Engineer or Registered Geologist) must affix their signature
and seal on the final plat.
c. Minimum Requirements for a High Intensity Soil Study (Level 3) - A high intensity
soil study shall be identified as a Level 3 soil survey and map. A Level 3 soil survey
and/or soil map are based on a comprehensive soils investigation of a given
landscape. The purpose of the soil survey is to identify, delineate and interpret the
suitability of the soil series found on the site as it pertains to use for on-site sewage
management systems. The soil survey must meet or exceed specified accuracy and
quality standards for the data from which the County Board of Health permits on-
site sewage management systems. All Level 3 soil surveys and related interpretive
data shall be based on the Georgia Department of Public Health Manual for On-
Site Sewage Management Systems, National Cooperative Soil Survey standards
and the current Soil Survey Manual (Soil Survey Staff, 1993). Soil series used to
name map units must be classified according to the most recent edition of Soil
Taxonomy (Soil Survey Staff, 1999), with map unit boundaries and map features
plotted on a map at a scale that may range from one inch equals ten feet (1”=10’)
to one inch equals one hundred feet (1”=100’). Smaller map scales (1”=200’,
1”=500’, etc.) are not acceptable. Level 3 soil surveys must be based on a two-foot
contour interval topographic map. The topographic map and boundary survey must
be provided before the beginning of any fieldwork. The soil survey must include a
title block or caption that includes the project and/or client name, location of the
project, date of the survey, narrative, bar scale and north arrow. The soil survey
shall include any features that may affect the location or performance of on-site
sewage management systems. Examples are: the location of springs, wells, existing
structures, rock outcrops, ephemeral drains, gullies and visible trash pits. The soil
survey must include a legend that defines any symbols used to illustrate these
features on the soil map. The soil survey and soil map must bear the name, stamp,
address and telephone number of the Certified Soil Classifier, Registered Engineer
or Registered Geologist performing the survey. The “Official” Level 3 soil survey
used for on-site sewage management system permitting is that which bears the
original seal and signature of the individual performing the work. The Certified Soil
Classifier, Registered Engineer or Registered Geologist shall affix their signature
and seal only on soil surveys that are their work or work performed under their
direct supervision. Any revision to a Level 3 soil survey must be clearly designated
as such and dated. The Level 3 soil survey must include a table or narrative that
describes site-specific properties of each map unit (named for soil series) mapped
at the site. For each map unit, the table or narrative must include the following: soil
series name (symbols are not allowed), the percent slope or slope range (symbols
are not allowed), minimum depth (range is unnecessary) to seasonal saturation

SECTION C │ Soil Information
On-Site Sewage Management Systems Manual Page 55 of 289
(seasonal high water table), minimum depth (range is unnecessary) to auger refusal
or impervious layer (soft or hard bedrock or other horizons that restrict water
movement), recommended installation depth (if applicable) and estimated
percolation rate at the recommended installation depth (if applicable). The
estimated percolation rate shall be based on the most limiting soil horizon that
comes into contact with the absorption trench sidewall, bottom and for a distance
one (1’) foot below the recommended installation depth. The upper and lower depth
limits of the horizon in which installation is recommended shall be provided for
each map unit. The depth range over which installation is recommended must be at
least 24 inches to encompass a 12-inch sidewall thickness and 12 inches of soil
below the trench bottom. If the 24-inch thickness installation zone includes a
horizon with lower percolation rate than the optimum, the maximum percolation
rate in the depth interval must be used for on-site system design. Minimum depths
to bedrock or seasonal saturation shall be provided for each map unit and specific
depths identified for each boring on the soil map. Phases of soil series are an
acceptable method to map depths more narrow than those used to define the series.
Variants of series have different interpretations than the named series and these
differences shall be reflected in the interpretive table. An interpretive statement
describing the limitations for utilization of on-site sewage management systems
shall be provided for each soil series map unit. This interpretive statement may
contain notes, observations or other pertinent information reflecting the soil
properties of the map unit that affect its ability to function for wastewater disposal.
These map unit interpretation statements must be based on the soil properties and
landscape positions observed on site by the approved professional. Map unit
interpretive statements shall be expressed in a narrative format on the soil survey
report or soil map. The number of soil observations required for the Level 3 soil
survey will depend on the soil conditions encountered during the study and
landscape complexity at the site. At least four (4) pedons shall be evaluated and
classified for each one (1) acre mapped. For example, if an area is 1.5 acres, a
minimum of 6 test borings must be evaluated and classified. If the site is less than
one acre, a minimum of four (4) pedons shall be evaluated and classified. However,
the Soil Classifier, Registered Engineer or Registered Geologist shall perform as
many soil boring observations as necessary to ensure the named soil series or a soil
series with similar or more favorable properties are verifiable onsite. All soil
observations must be numbered and flagged on site and their location illustrated
with a symbol and corresponding boring number on the finished soil map. All
permanent and reproducible ground control points utilized to locate soil
observations will be shown on the finished soil map so these observation points can
be reestablished at a later date. All soil maps must contain a statement describing
the method and/or instruments used to locate each soil observation from control
points. Boundaries between map units are commonly gradual instead of abrupt as
implied by a line drawn on a map. In addition, the boundary between map units
may be difficult to locate exactly unless definitive landscape features are present or
closely spaced soil observations are made to locate the boundary. To ensure that
on-site sewage systems are not installed in soils unsuitable for their use, soil
delineation lines between suitable soils, limited suitable soils and unsuitable soils

SECTION C │ Soil Information
On-Site Sewage Management Systems Manual Page 56 of 289
shall be accurate to within 20 feet of the delineated soil boundary. If through
additional closely spaced soil observations the site evaluator can document the area
within 20 feet of the boundary has soils suitable for an on-site sewage system
(conventional or alternative), the system may be installed closer than 20 feet from
the suitable-limited suitable-unsuitable boundary. The location of all observations
used to determine near boundary soil suitability must be shown on the final soil
map and characteristics observed must be summarized in the site report. All soil
observations shall be a minimum depth of 72 inches unless a refusal layer, including
seasonal saturation horizon, is identified. If the lower limit of the recommended
installation depth is greater than 48 inches, the soil observation must be extended
to not less than 24 inches beneath this lower limit. Backhoe pits may be substituted
for observations from auger borings. Mechanical augers, which disturb soil
structure, shall not be used. The Soil Classifier, Registered Engineer or Registered
Geologist must keep field notes for each soil observation that include: boring
number, soil series name, percent slope, depth and type of restrictive horizons
present and morphological properties of major subsoil horizons (upper and lower
depth, texture, matrix and redoximorphic feature color [Munsell notation]). All
surveys and related interpretive data shall meet National Conservation soil survey
(NCSS) and United States Department of Agriculture (USDA) Soil Survey Manual
standards for map purity. Map units will not have more than 15 percent inclusions
of soils with different interpretation for on-site sewage management systems from
the named series.
d. Minimum Requirements for Special Soil Investigations (Level 4) - A special soil
study shall be identified as a Level 4 soil survey. The County Board of Health may
require special soil studies when alternative on-site sewage management systems
are proposed and additional soil data are needed to adequately address site
suitability and/or system design. The County Environmental Health Specialist
should be consulted prior to the initiation of the special investigation. The special
investigation will typically be made for a specific location within an individual lot
or parcel in the area proposed for the installation of an on-site sewage management
system. Special investigations may include measurement of percolation rate for
specific horizons, excavations to determine bedrock hardness and continuity,
monitoring seasonal groundwater tables or other similar data that may be needed to
aid in the interpretation of soil suitability and the protection of ground and surface
water. Finished soil reports will have clear and obvious designations as to
information that is Level 3 and/or Level 4. A Level 4 soil survey expands on the
existing Level 3 soil survey in thoroughness and/or detail. Results of the Level 4
soil investigation should be presented in a format similar to that of the Level 3 soil
investigation, including a map with more detailed soil delineations and/or location
of measurements, an interpretive table and, if needed, narrative statements
describing methods and results that impact suitability for an on-site sewage
management system. The Level 4 soil survey shall meet all minimum requirements
of the Level 3 soil survey, with the exception that test boring sites from the previous
Level 3 investigation may be used for the Level 4 investigation. There is no
minimum number of pedon observations required for a Level 4. At a Level 4
intensity, individual soil series are expected to be mapped and delineated with such

SECTION C │ Soil Information
On-Site Sewage Management Systems Manual Page 57 of 289
a degree of accuracy that, at any location chosen to investigate within a given map
unit, the named soil series or one with similar or more favorable properties for the
installation of an on-site wastewater management system must be verifiable. The
name, official seal and signature of the Certified Soil Classifier, Registered
Engineer or Registered Geologist performing the investigation must be on the
report.
2. Soil Data Acceptability for Individual Lots:
a. Soil evaluations on individual lots shall be performed by the following
individuals:
(1) A Certified Soil Classifier, Registered Engineer or Registered Geologist if a
Level 3 soil survey is required.
(2) With the approval of the County Board of Health, an Environmental Health
Specialist I or higher, District Environmental Health Director, DPH
Environmental Health Program Director, meeting the following requirements,
may conduct soil investigations for individual lots for single family residences:
i. A Level II Inspector Certification; and
ii. Successfully passes a field examination demonstrating the ability to
identify soil texture and expected percolation rate, identify
redoximorphic features and identify restricted or impervious soil
horizons.
b. Individuals who are approved by the County Board of Health that perform soil
evaluations on individual lots for single family residences shall follow the
following protocols:
(1) A minimum of three soil borings shall be dug in the proposed location of the
on-site sewage management system absorption field and duplicate absorption
field area;
(2) All borings shall be dug to a minimum depth of 72 inches unless a refusal layer
is identified or to not less than 24 inches beneath the planned absorption trench
bottom installation depth.
(3) A soil report shall be made containing:
i. A sketch identifying boring locations; and
ii. A table identifying boring number, expected percolation rate and depth
at which it occurs, the depth of seasonal high water table and depth of
any refusal layer; and
iii. Sites with poor percolation, redoximorphic features or impervious soil
horizons within 24 inches of the planned absorption trench bottom, a
seasonal high water table within 30 inches of the original ground surface
or any other questionable soil features will be referred to a Certified Soil
Classifier, Registered Engineer or Registered Geologist for evaluation.
3. Evaluation of soil for use as fill material

SECTION C │ Soil Information
On-Site Sewage Management Systems Manual Page 58 of 289
a. Evaluation of soil for use as fill material on individual lots may be performed by
the following individuals:
(1) A Certified Soil Classifier, Registered Engineer or Registered Geologist
(2) With approval of the County Board of Health, a Level II Certified
Environmental Health Specialist I or higher, who has successfully completed
training and demonstrated proficiency in soil fill evaluation may approve soil
for fill material.
b. Individuals approved by the County Board of Health to perform soil evaluations of
fill material shall follow the following protocols:
(1) A minimum of four (4) borings shall be dug within the in-place fill material.
(2) All borings shall be dug to a minimum depth twelve (12) inches below the
original soil surface.
(3) A fill site evaluation form shall be completed:
i. Evidence that the vegetative topsoil has been removed and fill area
properly tilled.
ii. The soil fill is examined for texture and fines; percolation rate estimated.
iii. The size of the filled area identified and filled area properly sloped.
5) Glossary of Soil Terms
Aeration (soil). The exchange of air in soil with air from the atmosphere. The air in a well
aerated soil is similar to that in the atmosphere; the air in a poorly aerated soil is considerably
higher in carbon dioxide and lower in oxygen.
Aggregate (soil). Many fine particles held in a single mass or cluster. Natural soils aggregate, such
as granules, blocks or prisms, are called peds. Clods are aggregates produced by tillage or logging.
Alluvium. Material, such as sand, silt or clay, deposited on land by streams.
Bottom land. The normal flood plain of a stream, subject to flooding.
Clay. As a soil separate, mineral soil particles less than 0.002 millimeter in diameter. As a soil
textural class, soil material that is 40 percent or more clay, less than 45 percent sand and less than
40 percent silt.
Colluvium. Soil material, rock fragments or both moved by creep, slide or local wash and
deposited at the base of steep slopes.
Depth to rock. Bedrock is to near the surface for the specified use.
Dissimilar Soil. Soil that is different from the named soil series in both properties and major
interpretations.
Drainage class (natural). Refers to the frequency and duration of periods of saturation or partial
saturation during soil formation, as opposed to altered drainage, which is commonly the result of
artificial drainage or irrigation but may be caused by the sudden deepening of channels or the
blocking of drainage outlets. Seven classes of natural soil drainage are recognized:

SECTION C │ Soil Information
On-Site Sewage Management Systems Manual Page 59 of 289
Excessively drained. Water is removed from the soil very rapidly. Excessively drained soils
are commonly very coarse textured, rocky or shallows. Some are steep. All are free of the
mottling related to wetness.
Somewhat excessively drained. Water is removed from the soil rapidly. Many somewhat
excessively drained soils are sandy and rapidly pervious. Some are shallow. Some are so steep
that much of the water they receive is lost as runoff. All are free of the mottling related to
wetness.
Well-drained. Water is removed from the soil readily but not rapidly. It is available to plants
throughout most of the growing season and wetness does not inhibit growth of roots for
significant periods during most growing seasons. Well drained soils are commonly medium
textured. They are mainly free of mottling.
Moderately well-drained. Water is removed from the soil somewhat slowly during some
periods. Moderately well drained soils are wet for only a short time during the growing season,
but periodically they are wet long enough that most mesophytic crops are affected. They
commonly have a slowly pervious layer within or directly below the solum or periodically
receive high rainfall or both.
Somewhat poorly drained. Water is removed slowly enough that the soil is wet for significant
periods during the growing season. Wetness markedly restricts the growth of mesophytic crops
unless artificial drainage is provided. Somewhat poorly drained soils commonly have a slowly
pervious layer, a high water table, additional water from seepage, nearly continuous rainfall or
a combination of these.
Poorly drained. Water is removed so slowly that the soil is saturated periodically during the
growing season or remains wet for long periods. Free water is commonly at or near the surface
for long enough during the growing season that most mesophytic crops cannot be grown unless
the soil is artificially drained. The soil is not continuously saturated in layers directly below
plow depth. Poor drainage results from a high water table, a slowly pervious layer within the
profile, seepage, nearly continuous rainfall or a combination of these.
Very poorly drained. Water is removed from the soil so slowly that free water remains at or on
the surface during most of the growing season. Unless the soil is artificially drained, most
mesophytic crops cannot be grown. Very poorly drained soils are commonly level or depressed
and are frequently ponded. Yet, where rainfall is high and nearly continuous, they can have
moderate or high slope gradients.
Flood plain. A generally flat plain or depression susceptible to being flooded from any source,
including small and intermittent watercourses and coastal areas subject to intermittent tidal action.
Fragipan. A loamy, brittle subsurface horizon low in porosity and content of organic matter and
low or moderate in clay but high in silt or very fine sand. A fragipan appears cemented and restricts
roots. When dry, it is hard or very hard and has a higher bulk density than the horizon or horizons
above. When moist, it tends to rupture suddenly under pressure rather than to deform slowly.
Hardpan. A hardened or cemented soil horizon or layer. The soil material is sandy, loamy or
clayey and is cemented by iron oxide, silica, calcium carbonate or another substance.
Horizon (soil). A layer of soil, approximately parallel to the surface, having distinct characteristics
produced by soil-forming processes. In the identification of soil horizons, an upper case letter

SECTION C │ Soil Information
On-Site Sewage Management Systems Manual Page 60 of 289
represents the major horizons. Numbers or lower case letters that follow represent subdivisions of
the major horizons. An exploration of the subdivisions is given in the Soil Survey Manual. The
major horizons of mineral soil are as follows:
O horizon. An organic layer of fresh and decaying plant residue at the surface of a mineral soil.
A horizon. The mineral horizon at or near the surface in which an accumulation of humified
organic matter is mixed with the mineral material. Also, a plowed surface horizon, most of
which was originally part of a B horizon.
E horizon. The mineral horizon in which the main feature is loss of silicate clay, iron,
aluminum or some combination of these.
B horizon. The mineral horizon below an O, A or E horizon. The B horizon is in part a layer
of transition from the overlying horizon to the underlying C horizon. The B horizon also has
distinctive characteristics such as: (1) accumulation of clay, sesquioxides, humus or a
combination of these; (2) prismatic or blocky structure; (3) redder or browner colors than those
in the A horizon; or (4) a combination of these. The combined A and B horizons are generally
called the solum or true soil. If a soil does not have a B horizon, the A horizon alone is the
solum.
C horizon. The mineral horizon or layer, excluding indurated bedrock, that is little affected by
soil-forming processes and does not have the properties typical of the A or B horizon. The
material of a C horizon may be either like or unlike that in which the solum formed. If the
material is known to differ from that in the solum, the Arabic numeral 2 precedes the letter C.
R layer. Consolidated rock beneath the soil. The rock commonly underlies a C horizon but can
be directly below an A or a B horizon.
Impervious soil. A soil through which water, air or roots penetrate slowly or not at all. No soil is
absolutely impervious to air and water all the time.
Infiltration. The downward entry of water into the immediate surface of soil or other material, as
contrasted with percolation, which is movement of water through soil layers or material.
Infiltration capacity. The maximum rate at which water can infiltrate into a soil under a given set
of conditions.
Infiltration rate. The rate at which water penetrates the surface of the soil at any given instant,
usually expressed in inches per hour. The rate can be limited by the infiltration capacity of the soil
or the rate at which water is applied at the surface.
Intake rate. The average rate of water entering the soil under irrigation. Most soils have a fast
initial rate; the rate decreases with application time. Therefore, intake rate for design purposes is
not a constant but is a variable depending on the net irrigation application. The rate of water intake
in inches per hour is expressed as follows:
Less than 0.2 very low
0.2 to 0.4 low
0.7 to 0.75 moderately low
0.75 to 1.25 moderate

SECTION C │ Soil Information
On-Site Sewage Management Systems Manual Page 61 of 289
1.25 to 1.75 moderately high
1.75 to 2.5 high
More than 2.5 very high
Loam. Soil material that is seven to 27 percent clay particles, 28 to 50 percent silt particles and
less than 52 percent sand particles.
Loamy. Soils ranging from moderately coarse textured to moderately fine textured soils.
Medium textured soil. Very fine sandy loam, loam, silt loam or silt.
Metamorphic rock. Rock of any origin altered in mineralogical composition, chemical
composition or structure by heat, pressure and movement. Nearly all such rocks are crystalline.
Moderately coarse textured soil. Sandy loam and clay loam and silty clay loam.
Moderately fine textured soil. Clay loam, sandy clay loam and silty clay loam.
Morphology, soil. The physical make up the soil, including the texture, structure, porosity,
consistence, color and other physical, mineral and biological properties of the various horizons
and the thickness and arrangement of those horizons in the soil profile.
Mottling, soil. Irregular spots of different colors that vary in number and size. Mottling generally
indicates poor aeration and impeded drainage. Descriptive terms are as follows: abundance, few,
common and many; size, fine, medium and coarse; and contrast, faint, distinct and prominent. The
size measurements are of the diameter along the greatest dimension. Fine indicates less than five
millimeters (about 0.2 inch); medium, from five to 15 millimeters (about 0.2 to 0.6 inch); and
coarse, more than 15 millimeters (about 0.6 inch).
Muck. Dark colored, finely divided, well decomposed organic soil material.
Organic matter. Plant and animal residue in the soil in various stages of decomposition.
Pan. A compact, dense layer in a soil that impedes the movement of water and the growth of roots.
For example, hardpan, fragipan, claypan, plowpan, and land traffic pan.
Parent material. The unconsolidated organic and mineral material from which soil forms.
Ped. An individual natural soil aggregate, such as granule, a prism or a block.
Pedon. The smallest volume that can be called a soil. A pedon is three-dimensional and large
enough to permit study of all horizons. Its area ranges from about 10 to 100 square feet (1 square
meter to 10 square meters) depending on the variability of the soil.
Percolation. The downward movement of water through the soil.
Permeability. The quality of the soil that enables water to move downward through the profile.
Permeability is measured as the number of inches per hour that water moves downward through
the saturated soil. Terms describing permeability are:
Very slow - less than 0.06 inch/hr.
Slow - 0.06 to 0.2 inch/hr.
Moderately slow - 0.2 to 0.6 inch/hr.
Moderate - 0.6 to 2.0 inches/hr.

SECTION C │ Soil Information
On-Site Sewage Management Systems Manual Page 62 of 289
Moderately rapid - 2.0 to 6.0 inches/hr.
Rapid - 6.0 to 20 inches/hr.
Very rapid - more than 20 inches/hr.
Similar Soil. Soil that is different from the named soil but has the same interpretations as the
named soil series.
Plinthite. The sesquioxide-rich, humus-poor, highly weathered mixture of clay with quartz and
other diluents. It commonly appears as red mottles, usually in platy, polygonal or reticulate
patterns. Plinthite changes irreversibly to an ironstone hardpan or to irregular aggregates on
repeated wetting and drying, especially if it is exposed to heat from the sun. In a moist soil, plinthite
can be cut with a spade. It is a form of laterite.
Ponding. Standing water on soils in closed depressions. Unless the soils are artificially drained,
the water can be removed only by percolation or evapotranspiration.
Poor filter. Because of rapid permeability the soil may not adequately filter effluent from a waste
disposal system.
Profile, soil. A vertical section of the soil extending through all its horizons and into the parent
material.
Runoff. The precipitation discharged into stream channels from an area. The water that flows off
the surface of the land without sinking into the soil is called surface runoff. Water that enters the
soil before reaching surface streams is called groundwater runoff or seepage flow from
groundwater.
Sand. As a soil separate, this is individual rock or mineral fragments from 0.5 millimeter to 2.0
millimeters in diameter. Most sand grains consist of quartz. As a soil textural class, a soil that is
85 percent or more sand and not more than 10 percent clay.
Sandstone. Sedimentary rock containing predominantly sand-size particles.
Sedimentary rock. Rock made up of particles deposited from suspension in water. The chief kinds
of sedimentary rock are conglomerate, formed from gravel; sandstone, formed from sand; shale,
formed from clay, and limestone, formed from soft masses of calcium carbonate. There are many
intermediate types. Some wind-deposited sand is consolidated into sandstone.
Seepage. The movement of water through the soil. Seepage adversely affects the specified use.
Series, soil. A group of soils that have profiles that are almost alike, except for differences in
texture of the surface layer or of the underlying material. All the soils of a series have horizons
that are similar in composition, thickness and arrangement.
Shale. Sedimentary rock formed by the hardening of a clay deposit.
Shrink-swell. The shrinking of soil when dry and the swelling when wet. Shrinking and swelling
can damage roads, dams, building foundations and other structures. It can also damage plant roots.
Silica. A combination of silicon and oxygen. The mineral form is called quartz.
Slope. The inclination of the land surface from the horizontal. Percentage of slope is the vertical
distance divided by horizontal distance and then multiplied by 100. Thus, a slope of 20 percent is
a drop of 20 feet in 100 feet or horizontal distance.

SECTION C │ Soil Information
On-Site Sewage Management Systems Manual Page 63 of 289
Subsoil. Technically, the B horizon; roughly, the part of the solum below plow depth.
Subsurface layer. Technically, the A2 or E horizon. Generally, refers to a leached horizon lighter
in color and lower in content of organic matter than the overlying surface layer.
Surface layer. The soil ordinarily moved in tillage or its equivalent in uncultivated soil, ranging
in depth from four to 10 inches (10 to 25 per centimeters). Frequently designated as the plow layer
or the Ap horizon.
Taxajunct. A soil that is different in some minor property but has the same interpretations as the
named soil series.
Terrace. An embankment or ridge, constructed across sloping soils on the contour or at a slight
angle to the contour. The terrace intercepts surface runoff so that water soaks into the soil or flows
slowly to a prepared outlet.
Texture, soil. The relative proportions of sand, silt and clay particles in a mass of soil. The basic
textural classes, in order of increasing proportion of fine particles, are sand, loamy sand, sandy
loam, loam, silt loam, silt, sand clay loam, clay loam, silty clay loam, sandy clay, silty clay and
clay. The sand, loamy sand and sandy loam classes may be further divided by specifying coarse,
fine or very fine.
Topsoil. The upper part of the soil, which is the most favorable material for plant growth. It is
ordinarily rich in organic matter and is used to top dress road banks, lawns and land affected by
mining.
Variant. A soil that has a major difference in properties and interpretations than the named soil
series.
Weathering. All physical and chemical changes produced in rocks or other deposits at or near the
earth’s surface by atmospheric agents. These changes result in disintegration and decomposition
of the material.
6) Saturated Hydraulic Conductivity Guidance
Guidelines for Measurement of Saturated Hydraulic Conductivity by the Constant Head
Permeameter Method for On-Site Sewage Management Systems in Georgia
A. Purpose - The purpose of this section is to assist certified or registered professionals in the
collection, interpretation, and submission of saturated hydraulic conductivity (Ks) data to
the local environmental health specialists for permitting on-site sewage management
systems (OSSMS). This guidance section is specific to the constant-head well permeameter
method (also known as “borehole permeameter method” or “constant-head borehole
infiltration test”). These recommendations were developed by private and public industry
professionals as well as Department of Public Health (DPH) staff. Ks data may only be
collected and reported by certified soil scientists, registered professional geologists, or
registered professional engineers currently approved by the department to conduct soil
evaluations. With appropriate documentation, certified and registered professionals may
submit alternative methods of Ks data collection that are not covered in this section. The
following guidance is not intended to replace education or experience and should be used
in conjunction with professional judgement.

SECTION C │ Soil Information
On-Site Sewage Management Systems Manual Page 64 of 289
B. Equipment - A commercially available permeameter or similar device for maintaining a
constant depth of water in a cylindrical auger hole at a desired depth and measuring the
flow rate of water into the soil. An auger set (including a cutting head, planer or hole
cleaner, brush, and extensions) for boring a cylindrical hole typically 2 to 4 inches in
diameter. Any additional equipment specified/recommended in the respective procedure or
by the manufacturer of the permeameter.
C. Evaluation Procedure
1. Measurement location and replication - Field assessment of the variability of soil type,
landscape position and proposed system capacity by the approved professional
determines the appropriate location of measurements and number of replicates
necessary to characterize the hydraulic conductivity of the primary absorption field and
repair area. Guidance from the NRCS Field Book for Describing and Sampling Soils,
Version 3.0, suggests five (5) or more Ks measurements are required to capture natural
variation. Justification should be provided for the number and locations of the
measurements performed. At a minimum, measure Ks at the depths as described below.
a. Daily design peak flow ≤ 750 gpd – DPH recommends measurements of Ks at five
(5) locations that best characterize the soil and site conditions within the area to be
used for the primary and repair OSSMS installation at the site. If the area to be used
for the proposed primary and secondary systems is not contiguous, DPH advises
taking measurements at an additional five (5) locations in the secondary area.
Describe and justify deviations from the procedures suggested here.
b. Daily design peak flow > 750 gpd – DPH recommends measurements of Ks at five
(5) locations that best characterize the soil and site conditions within the area to be
used for the primary OSSMS installation at the site. Additionally, measure Ks at
five (5) locations within the area to be used for the secondary OSSMS installation,
regardless of whether the secondary system area is contiguous with the primary
area. Please describe and justify deviations from the procedures suggested here.
2. Measurement depths - Conduct measurements in the most restrictive soil horizon that
encounters the proposed absorption trench sidewall and for one foot below the
proposed absorption trench bottom elevation. Because of potential water flow to the
surface, only Ks measurements at depths greater than six (6) inches from the ground
surface are generally considered valid. Where appropriate, conduct measurements
within a single horizon. Avoid inclusion of more than one (1) horizon (i.e., straddling
two [2] or more horizons) if the thickness of the master (O, A, E, B, or C) horizon under
consideration is greater than the required depth of the water in the hole. Thin horizons
with similar soil properties may be bridged if necessary. Select the depth of water in
the hole as described in the recommendations outlined in the respective procedures and
maintain it constantly throughout the test. For commercial devices, consult the
manufacturer’s manual for selection of an appropriate water depth. Provide a
description of any deviation from respective recommendations.

SECTION C │ Soil Information
On-Site Sewage Management Systems Manual Page 65 of 289
3. Steady state - Achieve steady state equilibrium at each test. Provide an explanation if
steady state equilibrium is not achieved. Where the measurement is conducted under a
constant depth of water, steady state condition for Ks can be defined as the time during
which the rate of water flow from the hole reaches a constant value (i.e., no longer
changes with time). Steady state is achieved when three (3) consecutive flow rate
measurements are the same. Alternately, after allowing saturation of the soil around the
hole, flow rate should reach a quasi-steady state condition during which it varies around
an average value. To determine this average, it is best to plot the rate of water flow (or
the calculated Ks values) versus time and pass a smooth curve through them using a
manually (referred to as fitting a curve by eye) or a mathematically (e.g., statistically)
best fitted curve. The steady state flow rate is reached if the tail end of this fitted curve
is nearly horizontal without showing an upward or downward trend. Use the arithmetic
mean flow rate for the last three (3) to five (5) measurements after reaching steady state
to calculate Ks. Longer saturation times should be considered for soils with mixed clay
mineralogy and moderate to high shrink-swell potential (Amoozegar 1997) or for
droughty conditions.
4. Measurement recording frequency - Measure Ks at time intervals outlined in the
respective procedures or manufacturer’s instrument-specific manual. In general, for
Group II and III soil textures, measure and record at intervals of 15 minutes (or at least
100 cm³ of water flow into the soil) for a minimum run time of one (1) hour or until
steady state is achieved. For Group IV soil textures, measure and record at intervals of
30 minutes (or at least 100 cm³ of water flow into the soil) for a minimum run time of
four (4) hours and until steady state is achieved.
5. Data analysis – If multiple readings vary by an order of magnitude or more, additional
measurements should be considered to achieve an acceptable level of confidence as
determined by the professional. Because the soil property Ks is logarithmically
distributed, the geometric mean of flow measurements must be used for calculations.
For example, the geometric mean of the number set {1,2,3,4,5} would be as follows:
√1 × 2 × 3 × 4 × 55
= 2.6
D. Record Keeping
1. Data log - At a minimum, a report should include, but is not limited to: date, time, and
weather conditions when data were collected, description of methodology, equipment
type used, soil profile descriptions for all borings including measurement borings,
locator map showing location of all Ks measurements and borings, adequate
description of constants and equations used.
2. Report the following for each measurement - Auger hole diameter, depths of
measurements, depth of water in the hole under the constant head, saturation start time
and steady state time, clock time, reservoir readings, change in time, change in the
water level in the permeameter, flow volume, flow rate (flow volume/time), graph of
rate of water flow (or calculated Ks values) vs. time.
E. Results and Interpretations

SECTION C │ Soil Information
On-Site Sewage Management Systems Manual Page 66 of 289
1. Recommended equation for calculation of Ks:
Reynolds and Elrick (2002) Equation:
𝐾𝑠 =𝑄𝑠
(𝜋𝑟2+ 𝐻𝜆𝑐
𝐺+
𝐻2
𝐺)
Where 𝑸𝒔 is the steady volumetric flow rate in volume of water per unit time, H is the
height of water ponded in the borehole, r is the radius of the hole in centimeters, 𝝀𝒄 is the
soil macroscopic capillary length, and G is the unitless geometric factor. Bosch and West
(1997) developed an equation to determine the value of G:
𝐺 = 1
2𝜋 [𝐴1 + 𝐴2 (
𝐻
𝑟) + 𝐴3 (
𝐻
𝑟)
2
+ 𝐴4 (𝐻
𝑟)
3
]
The values of the coefficients 𝐴1, 𝐴2, 𝐴3, and 𝐴4 in this polynomial depend on texture
and structure and are shown in the table below, along with values for 𝜆𝑐.
Soil Texture/Structure 𝜆𝑐 (cm) 𝐴1 𝐴2 𝐴3 𝐴4
I. Coarse and gravelly sands; may also include
some highly structured soils with large cracks
and/or macropores
2.8 0.079 0.516 -0.048 0.002
II. Most structured soils from clays through
loams; also includes unstructured medium
and fine sands
8.3 0.083 0.514 -0.053 0.002
III. Soils which are both fine textured (clayey)
and unstructured 25 0.094 0.489 -0.053 0.002
2. Comparison of Ks and Percolation Rate – A mathematically modeled relationship
between percolation rate and Ks was developed using the equations of Reynolds (2016)
and can be referenced in the Table under paragraph E.4. If measured values are slower
than anticipated based on observed soil morphology, DPH recommends using the
measured values with appropriate adjustments for soil conditions and site limitations.
If, however, measured values are higher than anticipated, DPH recommends the
professional consider using those predicted from assessing soil morphology in the field
along with appropriate site-specific adjustments. The reported percolation rate may not
exceed the maximum values for each soil texture group as listed in the Georgia Manual
for On-Site Sewage Management Systems or approved product sizing tables.
3. Reporting of Results – If required, the Ks report used to support soil interpretations
must be submitted with the Level 4 (special study) used for site permitting. Complete
reports include the date of completion and signature and seal of the Certified Soil

SECTION C │ Soil Information
On-Site Sewage Management Systems Manual Page 67 of 289
Classifier, Professional Geologist, or Professional Engineer providing the service. The
Soil Classifier, Engineer, or Geologist who performed the submitted Level 4 soil report
is responsible for measured data interpretations and the determination of percolation
rate or loading rate (reported in gallons/ft²/day). The Level 4 soil report must meet or
exceed all requirements listed in Section C of the Manual for On-Site Sewage
Management Systems.
4. Percolation Rate compared with Ks Table User Notes – This correlation was derived
from calculating the volume of water per unit time passing through a borehole with
radius of 5.1 cm (2 inches) and a constant pressure head of 15.2 cm (6 inches). It was
also assumed the soil had been prewetted. These conditions match those prescribed in
the Modified Taft Engineering Center Method, which is the currently approved method
for determining soil percolation rate in the Georgia Manual for On-Site Sewage
Management Systems. The Reynolds and Elrick (2016) equation was used to determine
Ks. This table should not be used as a reference for Ks values calculated with other
equations.
Soil Group-
Percolation Rate Ranges
(minutes/inch)
Group I – Sands
Sand and Loamy Sand
<10
Group II – Coarse Loams
Sandy Loam and Loam
10-30
Group III – Fine Loams
Clay Loam, Silt Loam,
Sandy Clay Loam,
Silty Clay Loam, Silt
30-60
Group IV – Clays
Sandy Clay, Clay,
Silty Clay with 1:1 minerals
>60
Percolation Rate Associated Ks value
(minutes/inch) (cm/day) (in/day)
5 39.55 15.57
10 19.77 7.78
15 11.32 4.46
20 8.49 3.34
25 6.79 2.67
30 5.66 2.23
35 4.85 1.91
40 4.24 1.67
45 3.77 1.49
50 3.39 1.34
55 3.09 1.22
60 2.83 1.11
65 2.61 1.03
70 2.42 0.95
75 2.26 0.89
80 2.12 0.84
85 1.82 0.71
90 1.71 0.68
95 1.62 0.64
100 1.54 0.61
105 1.47 0.58
110 1.40 0.55
115 1.34 0.53
120 1.29 0.51

SECTION C │ Soil Information
On-Site Sewage Management Systems Manual Page 68 of 289
7) Tables, Figures and Forms
Table 1.C Soil Series Suitability Codes
These codes are general statements of soil suitability and limitations for their use for on-site
systems. As such, they are based on the range of conditions given for the soils as they occur state-
wide. Suitability codes and installation recommendations submitted to County Boards of Health
by qualified individuals should be based on data from their site-specific evaluation and may
commonly differ from the general statements below.
Suitability Codes
A
These soils are suitable for installation of on-site systems with proper system design,
installation, and maintenance. Position of the site or other soil and landscape
considerations may require the drainfield area to be greater than the minimum
and/or the drainfield design to require equal distribution or level field installation.
C
Because of flooding, shallow seasonal water tables, soil horizons with very slow
percolation rate, perched water tables, or imperfect drainage, these soils are not
suitable for installation of a conventional on-site system without site modifications,
special designs or installation. Properties of the soil and site may require the
drainfield area to be greater than the minimum and/or the drainfield design to
require equal distribution or level field installation. Non-conventional systems and
installation must be approved by the local Environmental Health Specialist.
F Because of soil limitations, these soils are unsuitable for installation of an on-site
system.
H
These soils have bedrock limitations and are not suitable for installation of a
conventional on-site system without special design or installation. Properties of the
soil and site may require the drainfield area to be greater than the minimum and/or
the drainfield design to require equal distribution or level field installation. Non-
conventional system design and installation must be approved by the local
Environmental Health Specialist.
G Because of severe slope conditions, on-site installation is not recommended.
J
These soils commonly have percolation rates that are too slow for installation of a
conventional on-site system without special design or installation. Some areas may
have favorable rates, which can be identified through intensive investigation.
Properties of the soil and site may require the drainfield area to be greater than the
minimum and/or the drainfield design to require equal distribution or level field
installation. Non-conventional system design and installation must be approved by
the local Environmental Health Specialist.
K
These soils are suitable for installation of an on-site system. Shallow bedrock is
common in this area; however, small areas of soils with shallow bedrock may occur
as inclusions in these map units. It is recommended that intensive investigations be
made or that the on-site system is installed prior to home construction to ensure
bedrock limitations are not present on the site.
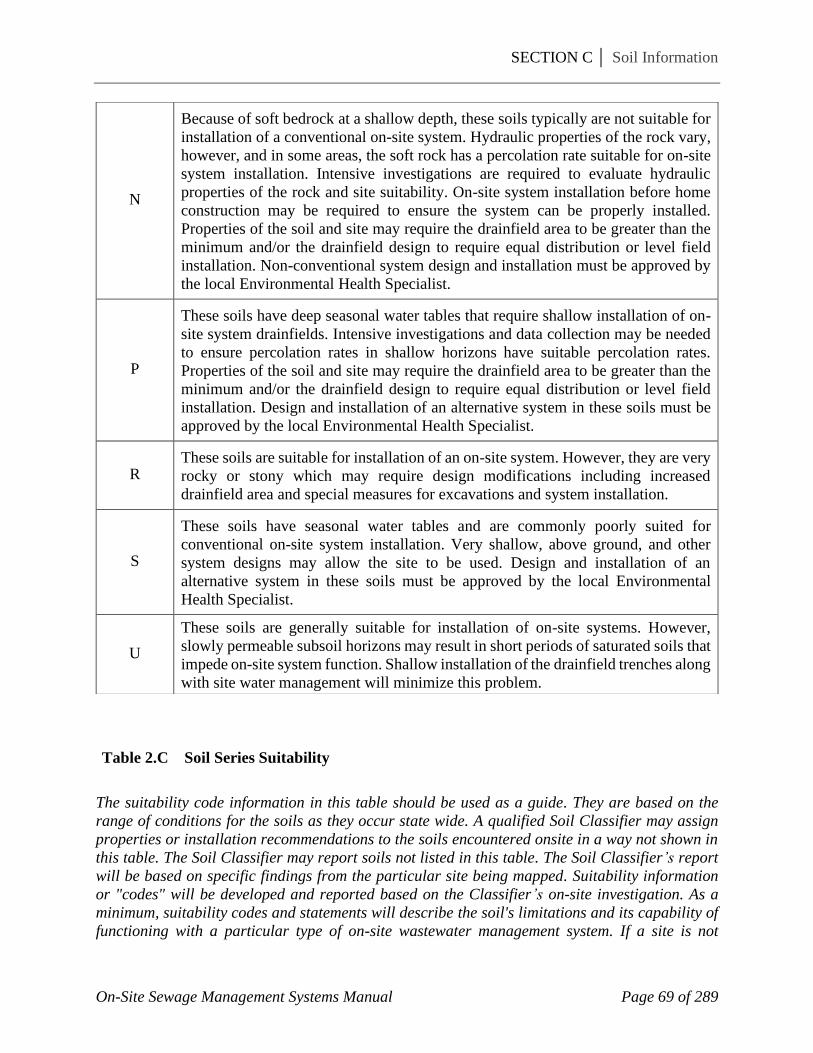
SECTION C │ Soil Information
On-Site Sewage Management Systems Manual Page 69 of 289
Table 2.C Soil Series Suitability
The suitability code information in this table should be used as a guide. They are based on the
range of conditions for the soils as they occur state wide. A qualified Soil Classifier may assign
properties or installation recommendations to the soils encountered onsite in a way not shown in
this table. The Soil Classifier may report soils not listed in this table. The Soil Classifier’s report
will be based on specific findings from the particular site being mapped. Suitability information
or "codes" will be developed and reported based on the Classifier’s on-site investigation. As a
minimum, suitability codes and statements will describe the soil's limitations and its capability of
functioning with a particular type of on-site wastewater management system. If a site is not
N
Because of soft bedrock at a shallow depth, these soils typically are not suitable for
installation of a conventional on-site system. Hydraulic properties of the rock vary,
however, and in some areas, the soft rock has a percolation rate suitable for on-site
system installation. Intensive investigations are required to evaluate hydraulic
properties of the rock and site suitability. On-site system installation before home
construction may be required to ensure the system can be properly installed.
Properties of the soil and site may require the drainfield area to be greater than the
minimum and/or the drainfield design to require equal distribution or level field
installation. Non-conventional system design and installation must be approved by
the local Environmental Health Specialist.
P
These soils have deep seasonal water tables that require shallow installation of on-
site system drainfields. Intensive investigations and data collection may be needed
to ensure percolation rates in shallow horizons have suitable percolation rates.
Properties of the soil and site may require the drainfield area to be greater than the
minimum and/or the drainfield design to require equal distribution or level field
installation. Design and installation of an alternative system in these soils must be
approved by the local Environmental Health Specialist.
R These soils are suitable for installation of an on-site system. However, they are very
rocky or stony which may require design modifications including increased
drainfield area and special measures for excavations and system installation.
S
These soils have seasonal water tables and are commonly poorly suited for
conventional on-site system installation. Very shallow, above ground, and other
system designs may allow the site to be used. Design and installation of an
alternative system in these soils must be approved by the local Environmental
Health Specialist.
U
These soils are generally suitable for installation of on-site systems. However,
slowly permeable subsoil horizons may result in short periods of saturated soils that
impede on-site system function. Shallow installation of the drainfield trenches along
with site water management will minimize this problem.

SECTION C │ Soil Information
On-Site Sewage Management Systems Manual Page 70 of 289
suitable for use, the suitability code will state the nature of the soil limitation. Recommendations,
specific details and concerns surrounding any particular site which deal with system performance
and longevity are explained within the suitability code for the soil series.
Soil Series
See Suitability
Codes and Installation
Information
MLRA
Major Land Resource
Area
Slope
%
Ranges
of the
soil
type
Depth to
Bedrock
(ranges)
Bedrock
Hardne
ss
Depth to
Seasonal
High H2O
Table
(inches)
Suitability
Code and
Installation
Information
HAMBLEN Sand Mountain 0-3% >60" 24-36" C
HARTSELLS Sand Mountain 2-45% 20-40" HARD >72" H
HECTOR Sand Mountain 1-60% 10-20" HARD >72" H
HECTOR (STONY) Sand Mountain 2 - 60% 10-20" HARD >72" H
LINKER Sand Mountain 1-40% 20-40" HARD >72" H
NAUVOO Sand Mountain 2-35% 40-60" SOFT >72" A
ALBERTVILLE Ridges and Valleys 2-25% 40-60" SOFT >72" N
ALLEN Ridges and Valleys 2-40% >60" >72" A
APISON Ridges and Valleys 2-25% 20-40" SOFT >72" H
ARAGON Ridges and Valleys 2-25% >60" >72" J
ARKABUTLA Ridges and Valleys 0-2% >60" 12-18" C
ARMUCHEE Ridges and Valleys 5-60% 20-36" SOFT >72" H
BARFIELD Ridges and Valleys 1-50% 8 - 20" HARD > 72" H
BELLAMY Ridges and Valleys 0 - 6% > 60" 18 - 36" C
BIGFORK Ridges and Valleys 40 - 60" HARD > 72" A
BODINE Ridges and Valleys 5-70% >60" >72" A
CAPSHAW Ridges and Valleys 0-12% 40-80" HARD 24-42" unsuitable
CARTECAY Ridges and Valleys 0-5% >60" 6-18" C
CEDARBLUFF Ridges and Valleys 0-2% >60" 6-12" C
CHENNEBY Ridges and Valleys 0-2% >60" 12-30" C
CHEWACLA Ridges and Valleys 0-2% >60" 6-24" C
CONASAUGA Ridges and Valleys 0-45% 20-40" SOFT >72" unsuitable
CRAIGSVILLE Ridges and Valleys 0 - 5% > 60" > 72" C
CRAIGSVILLE
(GRAVELLY) Ridges and Valleys 0-5% >60" >72" C
CUNNINGHAM Ridges and Valleys 2-25% 40-60" SOFT >72" J
DECATUR Ridges and Valleys 1-25% >60" >72" A
DEKALB Ridges and Valleys 0-80% 20-40" HARD >72" H
DEWEY Ridges and Valleys 2-40% >60" >72" A
DOCENA Ridges and Valleys 0-6% >60" 18-36" C
DOWELLTON Ridges and Valleys 0-8% 40-60" HARD 6-12" unsuitable
EMORY Ridges and Valleys 0-5% >60" 60-72" C
ENDERS Ridges and Valleys 1-65% 40 - >60" SOFT >72" J
ENNIS Ridges and Valleys 0-5% >60" >72" C
ETOWAH Ridges and Valleys 0-35% >60" >72" A
EUHARLEE Ridges and Valleys 2-10% >60" >72" A
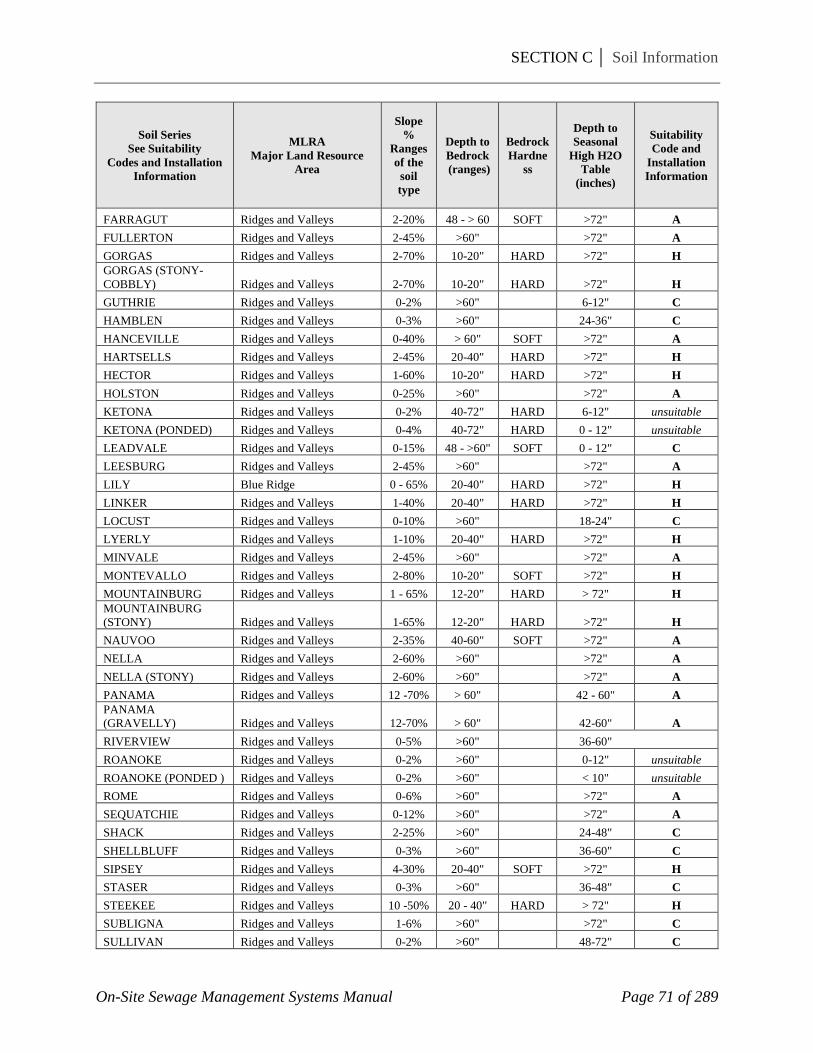
SECTION C │ Soil Information
On-Site Sewage Management Systems Manual Page 71 of 289
Soil Series
See Suitability
Codes and Installation
Information
MLRA
Major Land Resource
Area
Slope
%
Ranges
of the
soil
type
Depth to
Bedrock
(ranges)
Bedrock
Hardne
ss
Depth to
Seasonal
High H2O
Table
(inches)
Suitability
Code and
Installation
Information
FARRAGUT Ridges and Valleys 2-20% 48 - > 60 SOFT >72" A
FULLERTON Ridges and Valleys 2-45% >60" >72" A
GORGAS Ridges and Valleys 2-70% 10-20" HARD >72" H
GORGAS (STONY-
COBBLY) Ridges and Valleys 2-70% 10-20" HARD >72" H
GUTHRIE Ridges and Valleys 0-2% >60" 6-12" C
HAMBLEN Ridges and Valleys 0-3% >60" 24-36" C
HANCEVILLE Ridges and Valleys 0-40% > 60" SOFT >72" A
HARTSELLS Ridges and Valleys 2-45% 20-40" HARD >72" H
HECTOR Ridges and Valleys 1-60% 10-20" HARD >72" H
HOLSTON Ridges and Valleys 0-25% >60" >72" A
KETONA Ridges and Valleys 0-2% 40-72" HARD 6-12" unsuitable
KETONA (PONDED) Ridges and Valleys 0-4% 40-72" HARD 0 - 12" unsuitable
LEADVALE Ridges and Valleys 0-15% 48 - >60" SOFT 0 - 12" C
LEESBURG Ridges and Valleys 2-45% >60" >72" A
LILY Blue Ridge 0 - 65% 20-40" HARD >72" H
LINKER Ridges and Valleys 1-40% 20-40" HARD >72" H
LOCUST Ridges and Valleys 0-10% >60" 18-24" C
LYERLY Ridges and Valleys 1-10% 20-40" HARD >72" H
MINVALE Ridges and Valleys 2-45% >60" >72" A
MONTEVALLO Ridges and Valleys 2-80% 10-20" SOFT >72" H
MOUNTAINBURG Ridges and Valleys 1 - 65% 12-20" HARD > 72" H
MOUNTAINBURG
(STONY) Ridges and Valleys 1-65% 12-20" HARD >72" H
NAUVOO Ridges and Valleys 2-35% 40-60" SOFT >72" A
NELLA Ridges and Valleys 2-60% >60" >72" A
NELLA (STONY) Ridges and Valleys 2-60% >60" >72" A
PANAMA Ridges and Valleys 12 -70% > 60" 42 - 60" A
PANAMA
(GRAVELLY) Ridges and Valleys 12-70% > 60" 42-60" A
RIVERVIEW Ridges and Valleys 0-5% >60" 36-60"
ROANOKE Ridges and Valleys 0-2% >60" 0-12" unsuitable
ROANOKE (PONDED ) Ridges and Valleys 0-2% >60" < 10" unsuitable
ROME Ridges and Valleys 0-6% >60" >72" A
SEQUATCHIE Ridges and Valleys 0-12% >60" >72" A
SHACK Ridges and Valleys 2-25% >60" 24-48" C
SHELLBLUFF Ridges and Valleys 0-3% >60" 36-60" C
SIPSEY Ridges and Valleys 4-30% 20-40" SOFT >72" H
STASER Ridges and Valleys 0-3% >60" 36-48" C
STEEKEE Ridges and Valleys 10 -50% 20 - 40" HARD > 72" H
SUBLIGNA Ridges and Valleys 1-6% >60" >72" C
SULLIVAN Ridges and Valleys 0-2% >60" 48-72" C

SECTION C │ Soil Information
On-Site Sewage Management Systems Manual Page 72 of 289
Soil Series
See Suitability
Codes and Installation
Information
MLRA
Major Land Resource
Area
Slope
%
Ranges
of the
soil
type
Depth to
Bedrock
(ranges)
Bedrock
Hardne
ss
Depth to
Seasonal
High H2O
Table
(inches)
Suitability
Code and
Installation
Information
SUNLIGHT Ridges and Valleys 8 - 60% 10 - 20" SOFT > 72" H
TAFT Ridges and Valleys 0 - 2% > 60" 12 - 24" C
TALBOTT Ridges and Valleys 0-70% 20-40" HARD >72" unsuitable
TANYARD Ridges and Valleys 0 - 2% > 60" 18 - 30" C
TIDINGS Ridges and Valleys 2-70% 40-60" HARD >72" A
TOCCOA Ridges and Valleys 0-4% >60" 30-60" C
TOWNLEY Ridges and Valleys 2-60% 20-40" SOFT >72" unsuitable
TOWNLEY
(GRAVELLY) Ridges and Valleys 2-60% 20-40" SOFT >72" unsuitable
TUPELO Ridges and Valleys 0-6% >60" 12-24" unsuitable
WAX Ridges and Valleys 0-6% >60" 18-36" C
WAYNESBORO Ridges and Valleys 2-30% >60" >72" A
WEHADKEE Ridges and Valleys 0-2% >60" 0-12" unsuitable
WHITWELL Ridges and Valleys 0-6% >60" 24-36" C
WOLFTEVER Ridges and Valleys 0-12% >60" 30-42" C
ARKAQUA Blue Ridge 0-5% >60" 18-24" C
ASHE Blue Ridge 2-95% 20-40" HARD >72" H
ASHE (VERY STONY) Blue Ridge 2-95% 20-40" HARD >72" H
BANDANA Blue Ridge 0-5% >60" 18-24" C
BILTMORE Blue Ridge 0-5% >60" >42" C
BRADDOCK Blue Ridge 0-35% >60" >60" J
BRADSON Blue Ridge 0-35% >60" >60" J
BRASSTOWN Blue Ridge 2 - 95% 40-60" SOFT > 72 K
BREVARD Blue Ridge 0-35% >60" >60" A
BULADEAN Blue Ridge 2 - 95% 40-60" SOFT > 72 K
BURTON Blue Ridge 5-95% 20-40" HARD >72" H
CASHIERS Blue Ridge 2 - 95% > 60" > 72" A
CATASKA Blue Ridge 2 -95% 10-20" SOFT >72" H
CHANDLER Blue Ridge 2-95% >60" >72" A
CHATUGE Blue Ridge 0-15% >60" 12-24" C
CHEOAH Blue Ridge 8-95% 40-60" SOFT >72" K
CHESTNUT Blue Ridge 2-95% 20-40" SOFT >72" H
CLEVELAND Blue Ridge 2-95% 10 - 20" HARD >72" H
CLIFFIELD Blue Ridge 2-95% 20 - 40" HARD >72" H
CLIFTON Blue Ridge 2 - 60% >60" >72" A
CODORUS Blue Ridge 0-5% >60" 12-24" C
COLVARD Blue Ridge 0-5% >60" >48" C
COWEE Blue Ridge 2-95% 20-40" SOFT >72" H
CULLASAJA Blue Ridge 0-35% >60" >60" R
CULLOWHEE Blue Ridge 0-5% >60" 18-24" C
DELANCO Blue Ridge 0-15% >60" 12-30" C

SECTION C │ Soil Information
On-Site Sewage Management Systems Manual Page 73 of 289
Soil Series
See Suitability
Codes and Installation
Information
MLRA
Major Land Resource
Area
Slope
%
Ranges
of the
soil
type
Depth to
Bedrock
(ranges)
Bedrock
Hardne
ss
Depth to
Seasonal
High H2O
Table
(inches)
Suitability
Code and
Installation
Information
DELLWOOD Blue Ridge 0-5% >60" 24-48" C
DILLARD Blue Ridge 0-15% >60" 24-36" C
DILLSBORO Blue Ridge 0-35% >60" >60" A
DYKE Blue Ridge 0-35% >60" >60" A
DYKE (STONY) Blue Ridge 0-35% >60" >72" A
EDNEYTOWN Blue Ridge 2 - 95% >60" >72" A
EDNEYTOWN
(VERY STONY) Blue Ridge 2-80% >60" >72" A
EDNEYVILLE Blue Ridge 2-95% >60" >72" A
EDNEYVILLE
(STONY) Blue Ridge 2-95% >60" >72" A
ELLIJAY Blue Ridge 2-95% >60" >72" J
ELSINBORO Blue Ridge 0-35% >60" >60" A
EVARD Blue Ridge 2-95% >60" >72" A
FANNIN Blue Ridge 2-95% >60" >72" A
FRENCH Blue Ridge 0-5% >60" 12-30" C
GREENLEE Blue Ridge 0-35% >60" >60" R
HANMILLER Blue Ridge 2 - 95% 20 - 40" SOFT >72" H
HATBORO Blue Ridge 0-5% >60" 0-6" C
HAYESVILLE Blue Ridge 2-60% >60" >72" A
HAYWOOD Blue Ridge 0-35% > 60" >60" A
HAYWOOD (STONY) Blue Ridge 2-45% >60" >72" A
HEMPHILL Blue Ridge 0-15% >60" 0-12" unsuitable
HIWASSEE Blue Ridge 0-35% >60" >60" J
HUNTDALE Blue Ridge 2 - 95% >60" >72" A
IOTLA Blue Ridge 0-5% >60" 18-24" C
JEFFERSON Blue Ridge 2-75% >60" >72" A
JEFFERY Blue Ridge 2 - 95% 20 - 40" HARD >72" H
JUNALUSKA Blue Ridge 2 - 95% 20-40" SOFT >72" H
KEENER Blue Ridge 0-35% >60" >60" A
KIWKORA Blue Ridge 0-15% >60" 0-12 unsuitable
LILY Blue Ridge 0-65% 20-40" HARD >72" H
LONON Blue Ridge 0-35% >60" >60" A
LOSTCOVE Blue Ridge 0-35% >60" >60" R
MAYMEAD Blue Ridge 0-35% >60" >60" A
MICAVILLE Blue Ridge 2 - 95% 40 - 60 SOFT > 72" K
NANTAHALA Blue Ridge 2 - 60% 40 - 60" SOFT > 72" J, K
NIKWASI Blue Ridge 0-5% >60" 0 - 12" C
NORTHCOVE Blue Ridge 0-35% >60" >60" R
OSTIN Blue Ridge 0-5% >60" >42" C
PIGEONROOST Blue Ridge 2 - 95% 20-40" SOFT >72" H
PLOTT Blue Ridge 2 - 95% > 60" >72" A

SECTION C │ Soil Information
On-Site Sewage Management Systems Manual Page 74 of 289
Soil Series
See Suitability
Codes and Installation
Information
MLRA
Major Land Resource
Area
Slope
%
Ranges
of the
soil
type
Depth to
Bedrock
(ranges)
Bedrock
Hardne
ss
Depth to
Seasonal
High H2O
Table
(inches)
Suitability
Code and
Installation
Information
PORTERS Blue Ridge 2 - 95% 40-60" HARD >72" K
PORTERS (STONY) Blue Ridge 6-95% 40-60" HARD >72" K
RABUN Blue Ridge 2-50% >60" >72" A
RABUN (STONY) Blue Ridge 7-70% >60" >72" A
RAMSEY Blue Ridge 3 - 70% 10 - 20" HARD > 72" H
RAMSEY (STONY) Blue Ridge 3-70% 10-20" HARD >72" H
REDDIES Blue Ridge 0-5% >60" 24-42" C
ROSMAN Blue Ridge 0-5% >60" 30-60" C
SALUDA Blue Ridge 2 - 95% 10-20" SOFT >72" H
SAWTEETLAH Blue Ridge 0-35% >60" >60" A
SAVNOOK Blue Ridge 0-35% >60" >60" A
SHELOCTA Blue Ridge 0-35% >60" >60" A
SHINBONE Blue Ridge 2 - 95% 40 - 60" SOFT > 72" K
SHOUNS Blue Ridge 0-35% >60" >60" A
SOCO Blue Ridge 2 - 95% 20 - 40" SOFT > 72" H
SPIVEY Blue Ridge 0-35% >60" >60" R
STATLER Blue Ridge 0-35% >60" >60" A
STELCOAH Blue Ridge 2-95% 40-60" SOFT >72" K
SUCHES Blue Ridge 0-5% >60" 30-48" C
SYLCO Blue Ridge 2-95% 20-40" HARD >72" H
SYLVA Blue Ridge 0-10% >60" 0-12" C
TALLADEGA Blue Ridge 6-80% 20-40" SOFT >72" H
TATE Blue Ridge 0-35% >60" >60" A
THUNDER Blue Ridge 0-35% >60" >60" R
THURMONT Blue Ridge 0-35% >60" >60" A
TOECANE Blue Ridge 0-35% >60" >60" R
TOCCOA Blue Ridge 0-4% >60" 30-60" C
TOXAWAY Blue Ridge 0-5% >60" 0-6" C
TRANSYLVANIA Blue Ridge 0-5% >60" 24-36" C
TRIMONT Blue Ridge 2-95% >60" >72" A
TSALI Blue Ridge 2-95% 10-20" SOFT >72" H
TUCKASEGEE Blue Ridge 0-35% >60" >60" A
TUSQUITEE Blue Ridge 0-35% >60" >60" A
TUSQUITEE (STONY) Blue Ridge 2-95% >60" >72" A
UNAKA Blue Ridge 2-95% 20-40" HARD >72" H
UNISON Blue Ridge 0-35% >60" >60" A
WATAUGA Blue Ridge 2-95% >60" >72" A
WHITEOAK Blue Ridge 0-35% >60" >60" A
WHITESIDE Blue Ridge 0-10% >60" 18-36" C
ALAMANCE Southern Piedmont 0 - 15% > 60 > 72" A
ALCOVY Southern Piedmont 2-10% >60" 24 - 36" C

SECTION C │ Soil Information
On-Site Sewage Management Systems Manual Page 75 of 289
Soil Series
See Suitability
Codes and Installation
Information
MLRA
Major Land Resource
Area
Slope
%
Ranges
of the
soil
type
Depth to
Bedrock
(ranges)
Bedrock
Hardne
ss
Depth to
Seasonal
High H2O
Table
(inches)
Suitability
Code and
Installation
Information
ALLEN Southern Piedmont 2-40% >60" >72"
ALTAVISTA Southern Piedmont 0-10% >60" 18-30" C
APPLING Southern Piedmont 0-25% >60" >72" A
ASHLAR Southern Piedmont 0-70% 20-40" HARD >72" H
AUGUSTA Southern Piedmont 0-2% >60" 12-24" C
BADIN Southern Piedmont 2-55% 40 - 60" HARD >72" unsuitable
BETHLEHEM Southern Piedmont 2 - 45% 20 - 40" SOFT >72" N
BUCKHEAD Southern Piedmont 6-45% > 60" > 72" A
BUNCOMBE Piedmont & Coastal Plain 0 - 6% > 60" > 72" C
CARTECAY Southern Piedmont 0-5% >60" 6-18" unsuitable
CATAULA Southern Piedmont 2-25% > 60" 24 - 48 C
CECIL Southern Piedmont 0-25% >60" >72" A
CHENNEBY Southern Piedmont 0-2% >60" 12-30" unsuitable
CHESTATEE Southern Piedmont 10 -50% >60" >72" A
CHEWACLA Southern Piedmont 0-2% >60" + 12" - 24" unsuitable
COLFAX Southern Piedmont 0-15% >60" 6 - 18" C
CONGAREE Southern Piedmont 0-4% >60" 30 - 48" C
DAVIDSON Southern Piedmont 2-25% >60" >72"
DURHAM Southern Piedmont 0-10% >60" >72" A
DURHAM (PERCHED) Southern Piedmont 0 - 10% > 60" 48 - 72 C
ENON Southern Piedmont 2-45% >60" >72" J
FORK Southern Piedmont 0-7% >60" 12-24" C
GEORGEVILLE Southern Piedmont 2 - 50% >60" >72" A
GOLDSTON Southern Piedmont 2-60% 20 - 40" HARD >72" unsuitable
GROVER Southern Piedmont 2-45% >60" >72" A
GUNDY Southern Piedmont 6 - 40% 40 - 72" SOFT > 72"
GWINNETT Southern Piedmont 2-60% 40-60" SOFT >72" A or N
HARD LABOR
phase one Southern Piedmont 0 - 15% > 72" NA 30 - 48" C
HARD LABOR
phase two Southern Piedmont 0 - 15% > 72" NA 48- 60" P
HELENA Southern Piedmont 0-15% >60" 18-30" unsuitable
HERNDON Southern Piedmont 2-25% >60" >72" A
HIWASSEE Southern Piedmont 2-50% >60" >72" A
HULETT Southern Piedmont 2-15% >60" >72" A
IREDELL Southern Piedmont 0-15% 40 - 60" SOFT 12 - 24" unsuitable
KIRKSEY Southern Piedmont 0 - 10% 40 - 60" HARD 18 - 36" J
LLOYD Southern Piedmont 2-50% > 60" > 72" A
LOUISA Southern Piedmont 6-80% 10-20" SOFT >72" N
LOUISBURG Southern Piedmont
26 -
45% > 60" >72"
MADISON Southern Piedmont 2-60% >60" >72" A

SECTION C │ Soil Information
On-Site Sewage Management Systems Manual Page 76 of 289
Soil Series
See Suitability
Codes and Installation
Information
MLRA
Major Land Resource
Area
Slope
%
Ranges
of the
soil
type
Depth to
Bedrock
(ranges)
Bedrock
Hardne
ss
Depth to
Seasonal
High H2O
Table
(inches)
Suitability
Code and
Installation
Information
MASADA Southern Piedmont 0-25% >60" >72" C
MECKLENBURG Southern Piedmont 2-25% >60" >72" J
MOLENA Southern Piedmont 0-35% >60" >72" A
MUSELLA Southern Piedmont 2-80% 14 - 20" SOFT >72" H
NASON Southern Piedmont 0-50% 40-60" SOFT >72" N
ORANGE Southern Piedmont 0 - 15% 40 - 60 HARD 12 - 36" unsuitable
PACOLET Southern Piedmont 2-80% >60" >72" A
PAGELAND Southern Piedmont 0-15% 20-40" SOFT 18-36" unsuitable
POINDEXTER Southern Piedmont 2 - 60" 40 - 60" HARD > 72" H
RAWLINGS Southern Piedmont 6-45% 20-40" HARD > 72" H
RION Southern Piedmont 2-60% >60" >72" A
RIVERVIEW Southern Piedmont 0-5% >60" 36-60" C
ROANOKE Southern Piedmont 0-2% >60" 0-12" unsuitable
SAW Southern Piedmont 2 - 45% 20 - 40 HARD > 72" H
SEDGEFIELD Southern Piedmont 0-10% >60" 12-18" unsuitable
SHELLBLUFF Southern Piedmont 0-3% >60" 36-60" C
STARR Southern Piedmont 0-8% >60" >72" C
STATE Southern Piedmont 0-10% >60" 42 - 72" C
SWEETAPPLE Southern Piedmont 6-60% 24-50" SOFT >72" N
TALLAPOOSA Southern Piedmont 5-80% 10-20" SOFT >72" N
TATUM Southern Piedmont 0-50% 40-60" SOFT >72" N
TOCCOA Southern Piedmont 0-4% >60" 30-60" C
VANCE Southern Piedmont 2-25% >60" >72" J
WAKE Southern Piedmont 2-45% 11 - 20" HARD >72" unsuitable
WATEREE Southern Piedmont 2-95% 20-40" SOFT >72" N
WEDOWEE Southern Piedmont 0-60% >60" >72" A
WEHADKEE Southern Piedmont 0-2% >60" 0-12" unsuitable
WICKHAM Southern Piedmont 0-25% >60" >72" A
WILKES Southern Piedmont 2-60% 40 - 60 HARD >72" N
WINNSBORO Southern Piedmont 2 - 25% 40 - 60" SOFT > 72" J
WORSHAM Southern Piedmont 0-8% >60" 0-12" unsuitable
WYNOTT Southern Piedmont 2-45% 20-40" SOFT >72" unsuitable
ZION Southern Piedmont 2-45% 20-40" HARD >72" unsuitable
AILEY Sand Hills 0-25% >60" 48 - 72" A
BIBB Sand Hills 0-2% >60" 0 - 8" unsuitable
BIGBEE Sand Hills 0-5% >60" 20 - 40" C
CHASTAIN Sand Hills 0-2% >60" 0-12" unsuitable
CHEWACLA Sand Hills 0-2% >60" + 12" - 24" unsuitable
CONGAREE Sand Hills 0-4% >60" 30 - 48" C
COWARTS Sand Hills 1 - 25% 40 - 60"
DOGUE Southern Coastal Plain 0-15% >60" 18-36" unsuitable

SECTION C │ Soil Information
On-Site Sewage Management Systems Manual Page 77 of 289
Soil Series
See Suitability
Codes and Installation
Information
MLRA
Major Land Resource
Area
Slope
%
Ranges
of the
soil
type
Depth to
Bedrock
(ranges)
Bedrock
Hardne
ss
Depth to
Seasonal
High H2O
Table
(inches)
Suitability
Code and
Installation
Information
DOTHAN Sand Hills 0 - 12% 36 - 60" U
ESTO Sand Hills 2-25% >60" >72 J
EUNOLA Sand Hills 0-6% >60" 18-30" C
EUSTIS Sand Hills 0 - 30% >60" > 72" A
FACEVILLE Sand Hills 0-15% >60" >72" A
FUQUAY Sand Hills 0-10% >60" 48 - 72" A
GRADY Sand Hills 0-2% >60" 0-12" unsuitable
GREENVILLE Sand Hills 0 - 18% >60" >72" A
IUKA Sand Hills 0 - 2% > 60" 12 - 36" C
KINSTON Sand Hills 0-2% >60" 0-12" unsuitable
LAKELAND Sand Hills 0 - 85% >60" >72" A
LEVY Sand Hills 0-2% >60" + 24" - 0" C or F
LUCY Sand Hills 0 - 45% >60" >72" A
MASADA Sand Hills 0-25% >60" >72" A
NANKIN Sand Hills 0-60% >60" 40 - 60" J
NORFOLK Sand Hills 0-10% >60" 48-72" A
OCHLOCKONEE Sand Hills 0 - 3% >60" 36 - 60" C
OCILLA Sand Hills 0-10% >60" 12-30" C
ORANGEBURG Sand Hills 0 - 25% > 60" > 72" A
OSIER Sand Hills 0 - 2% > 60" < 12" unsuitable
PELHAM Sand Hills 0-2% >60" 0-12" C, or F
PELION Sand Hills 0-15% >60" 12-30" C
RED BAY Sand Hills 0-15% >60" >72" A
RIVERVIEW Sand Hills 0-5% >60" 36-60" C
STILSON Sand Hills 0-8% >60" 30-36" C or S
SUSQUEHANNA Sand Hills 1-17% >60" >72" unsuitable
TROUP Sand Hills 0-40% >60" >72" A
VAUCLUSE Sand Hills 2 - 25% >60" > 72"
WAGRAM Sand Hills 0 -15% >60 > 72" A
WAHEE Sand Hills 0 - 4% 72" 12 - 18" C or J
AILEY Southern Coastal Plain 0-25% >60" 48 - 72" A
ALAPAHA Southern Coastal Plain 0-3% >60" 0-12" C
ALBANY Southern Coastal Plain 0-6% >60" 18 - 30" C
AMERICUS Southern Coastal Plain 0-25% >60" >72" A
ARDILLA Southern Coastal Plain 0-5% >60" 12-24" C
ARUNDEL Southern Coastal Plain 2-35% 20-40" HARD >72" unsuitable
BAYBORO Southern Coastal Plain 0-2% >60" 0-12" unsuitable
BETHERA Southern Coastal Plain 0-2% >60" 0-18" unsuitable
BIBB Southern Coastal Plain 0-2% >60" 0 - 8" unsuitable
BIGBEE Southern Coastal Plain 0-5% >60" 20 - 40" C
BINNSVILLE Southern Coastal Plain 1 - 17% 7 - 20" SOFT 20" unsuitable

SECTION C │ Soil Information
On-Site Sewage Management Systems Manual Page 78 of 289
Soil Series
See Suitability
Codes and Installation
Information
MLRA
Major Land Resource
Area
Slope
%
Ranges
of the
soil
type
Depth to
Bedrock
(ranges)
Bedrock
Hardne
ss
Depth to
Seasonal
High H2O
Table
(inches)
Suitability
Code and
Installation
Information
BLADEN Southern Coastal Plain 0-2% >60" 0-12" C
BLANEY Southern Coastal Plain 0-25% >60" >72"
BLANTON Southern Coastal Plain 0-20% >60" 48 - 72" A
BLANTON (Moderately
Wet) Southern Coastal Plain 0-20% >60" 30 - 48" C, or S
BONIFAY Southern Coastal Plain 0-12% >60" 48-60" A
BONNEAU Southern Coastal Plain 0-12% > 60" 42 - 60" A
BOSWELL Southern Coastal Plain 1 - 17 % > 60" >72 unsuitable
BUNCOMBE Southern Coastal Plain 0 - 6% > 72" C
CAHABA Southern Coastal Plain 0-8% >60" >72 A
CARNEGIE Southern Coastal Plain 2-12% >60" 40 - 60" U
CENTENARY Southern Coastal Plain 0-5% >60" 42 - 60" A
CHASTAIN Southern Coastal Plain 0-2% >60" 0-12" unsuitable
CHEWACLA Southern Coastal Plain 0-2% >60" + 12" - 24" unsuitable
CHIPLEY Southern Coastal Plain 0-8% >60" 18 - 36" C
CHISOLM Southern Coastal Plain 0 - 10% >60" 36 - 60"
CLARENDON Southern Coastal Plain 0-6% >60" 24-36" C
COWARTS Southern Coastal Plain 1 - 25% 40 - 60" N
COXVILLE Southern Coastal Plain 0 - 2% >60" 0 - 12" unsuitable
DASHER Southern Coastal Plain 0-1% >60" + 12 to 12" unsuitable
DOGUE Southern Coastal Plain 0-15% >60" 18-36" C
DOTHAN Southern Coastal Plain 0 - 12% 36 - 60" U
DUNBAR Southern Coastal Plain 0 - 2% 12 - 30" C, J
DUPLIN Southern Coastal Plain 0 - 7% >60" 24 - 36" C, J
ECHAW Southern Coastal Plain 0-2% >60" 30 - 60" C
ELLABELLE Southern Coastal Plain 0-2% >60" <6" unsuitable
ESTO Southern Coastal Plain 2-25% >60" >72 J
EULONIA Southern Coastal Plain 0-6% >60" 18 - 42" C, J
EUSTIS Southern Coastal Plain 0 - 30% >60" > 72" A
EUTAW Southern Coastal Plain 0 - 2% >60" 6 - 18" unsuitable
FACEVILLE Southern Coastal Plain 0-15% >60" >72" A
FLOMATON Southern Coastal Plain 2 - 40% > 60" >72" A
FOXWORTH Southern Coastal Plain 0 - 25% > 60" 40 - 72" A
FREEMANVILLE Southern Coastal Plain 0 - 12% > 60" 40 - 60" U
FUQUAY Southern Coastal Plain 0-10% >60" 48 - 72" A or U
GOLDSBORO Southern Coastal Plain 0 - 10% > 60" 18 - 30" C
GRADY Southern Coastal Plain 0-2% >60" 0-12" unsuitable
GREENVILLE Southern Coastal Plain 0 - 18% >60" >72" A
GRITNEY Southern Coastal Plain 0 - 15% > 60" 18 - 36" C, or J
HENDERSON Southern Coastal Plain 2 - 20% > 60" > 72" unsuitable
HEROD Southern Coastal Plain 0-2% >60 0-12" unsuitable

SECTION C │ Soil Information
On-Site Sewage Management Systems Manual Page 79 of 289
Soil Series
See Suitability
Codes and Installation
Information
MLRA
Major Land Resource
Area
Slope
%
Ranges
of the
soil
type
Depth to
Bedrock
(ranges)
Bedrock
Hardne
ss
Depth to
Seasonal
High H2O
Table
(inches)
Suitability
Code and
Installation
Information
HORNSVILLE Southern Coastal Plain 0 - 8% > 60" 30 - 42" C, or J
IRVINGTON Southern Coastal Plain 0 - 5% > 60" 18 - 36" C
IUKA Southern Coastal Plain 0 - 2% > 60" 12 - 36" C
IZAGORA Southern Coastal Plain 0 - 8% >60" 24-36" C
JOHNS Southern Coastal Plain 0 - 2% > 60" 12 - 36" C
JOHNSTON Southern Coastal Plain 0 - 2% > 60" 0 - 12" unsuitable
KERSHAW Southern Coastal Plain 0 - 15% > 60" > 72"
KINSTON Southern Coastal Plain 0-2% >60" 0-12" unsuitable
KOLOMOKI Southern Coastal Plain 0 - 5% >60" 60 - 72" A
KUREB Southern Coastal Plain 0-20" >60" >72"
LAKELAND Southern Coastal Plain 0 - 85% >60" >72"
LEAF Southern Coastal Plain 0 - 2% >60" 6 - 18" unsuitable
LEEFIELD Southern Coastal Plain 0 - 12% >60" 18 - 30" C
LEON Southern Coastal Plain 0-5% >60" 12 - 24" C
LEON (HYDRIC) Southern Coastal Plain 0 - 2% >60" 0 - 6" unsuitable
LOWNDES Southern Coastal Plain 0 - 17% > 60" > 72" A
LUCY Southern Coastal Plain 0 - 45% >60" >72" A
LYNCHBURG Southern Coastal Plain 0-2% >60" 6 - 18" C
MARLBORO Southern Coastal Plain 0 - 10% >60" 48 - 72" A
MASCOTTE Southern Coastal Plain 0-2% >60 6 - 18" C
MAXTON Southern Coastal Plain 0 - 6% >60" 60 - 72" A
MEGGETT Southern Coastal Plain 0-3% >60" 0-12" C, or J
MUCKALEE Southern Coastal Plain 0 - 2% >60" 0-12" unsuitable
MYATT Southern Coastal Plain 0 - 2% > 60" 0 - 12" unsuitable
NANKIN Southern Coastal Plain 0-60% >60" 40 - 60" J
NOBOCO Southern Coastal Plain 0 - 6% > 60" 30 - 40" C or S
NORFOLK Southern Coastal Plain 0-10% >60" 48-72" A
OCHLOCKONEE Southern Coastal Plain 0 - 3% >60" 36 - 60" unsuitable
OCILLA Southern Coastal Plain 0 - 10% >60" 12 - 30" C
OGEECHEE Southern Coastal Plain 0-2% >60" + 12" - 12" unsuitable
OKTIBBEHA Southern Coastal Plain 1 - 30% >60" > 72" unsuitable
OLUSTEE Southern Coastal Plain 0 - 2% > 60" 6 - 18" C
ORANGEBURG Southern Coastal Plain 0 - 25% > 60" > 72" A
OSIER Southern Coastal Plain 0 - 2% > 60" < 12" unsuitable
OUSLEY Southern Coastal Plain 0-5% >60" 18 - 36" C
PELHAM Southern Coastal Plain 0-2% >60" + 12" - 18" unsuitable
PERSANTI Southern Coastal Plain 0 - 6% > 60" 18 - 36" unsuitable
PICKNEY Southern Coastal Plain 0-2% > 60" < 10" to 20" unsuitable
PLUMMER Southern Coastal Plain 0-5% >60" 0-12" C
RAINS Southern Coastal Plain 0-2% >60" 0-12" C
RED BAY Southern Coastal Plain 0-15% >60" >72" A

SECTION C │ Soil Information
On-Site Sewage Management Systems Manual Page 80 of 289
Soil Series
See Suitability
Codes and Installation
Information
MLRA
Major Land Resource
Area
Slope
%
Ranges
of the
soil
type
Depth to
Bedrock
(ranges)
Bedrock
Hardne
ss
Depth to
Seasonal
High H2O
Table
(inches)
Suitability
Code and
Installation
Information
REMBERT Southern Coastal Plain 0-2% 0 - 12" unsuitable
RIDGELAND Southern Coastal Plain 0-2% >60" 18-30" C
RIGDON Southern Coastal Plain 0 - 2% 18 - 30" C
RUTLEGE Southern Coastal Plain 0 - 2% > 60" 0 - 6" unsuitable
SHELLBLUFF Southern Coastal Plain 0-3% >72" 36 - 60" C
STILSON Southern Coastal Plain 0-8% >60" 30-36" C or S
SUFFOLK Southern Coastal Plain 0 - 50% >60" > 72" A
SUMTER Southern Coastal Plain 1 - 40%
SUNSWEET Southern Coastal Plain 2-25% 40 - 60" J
SURRENCY Southern Coastal Plain 0 - 1% 0 - 6" unsuitable
SUSQUEHANNA Southern Coastal Plain 1-17% >60" >72" unsuitable
TAWCAW Southern Coastal Plain 0 - 2% >72" 18 - 30" unsuitable
TELFAIR Southern Coastal Plain 2-15% 20-40" HARD 12 - 36" unsuitable
TIFTON Southern Coastal Plain 0 - 8% >72" 40 - 60" A or U
TORHUNTA Southern Coastal Plain 0 - 2% >60" 6 - 18" C
TROUP Southern Coastal Plain 0-40% >60" >72" A
VALDOSTA Southern Coastal Plain 0 - 5 % >60" >72" A
VARINA Southern Coastal Plain 0-10% >60" 48 - 60" A or U
VAUCLUSE Southern Coastal Plain 2 - 25% >60" > 72"
WAGRAM Southern Coastal Plain 0 -15% >60 > 72" A
WAHEE Southern Coastal Plain 0 - 4% 72" 12 - 18" C, or J
WEHADKEE Southern Coastal Plain 0 - 2% > 60 0 - 12" unsuitable
WICKSBURG Southern Coastal Plain 0-12% >60 40 - 60" A or U
AILEY Atlantic Coastal Plain 0 - 25% > 60" 48 - 72" A
ALBANY Atlantic Coastal Plain 0 - 6% >72" 18 - 30" C
ALLANTON Atlantic Coastal Plain >60 0 - 6" unsuitable
ARDILLA Atlantic Coastal Plain 0 - 5% 12 - 24" C
BAYBORO Atlantic Coastal Plain 0 - 2% >60" 0 - 12" unsuitable
BETHERA Atlantic Coastal Plain 0 - 2% >60" 0 - 18" unsuitable
BIBB Atlantic Coastal Plain 0 - 1% >72" .5 - 1" unsuitable
BLADEN Atlantic Coastal Plain 0 - 2% >72" 0 - 12" unsuitable
BLANTON Atlantic Coastal Plain 0 - 45% >72" 30 - 72" A
BOHICKET Atlantic Coastal Plain 0 - 2% > 60" unsuitable
BONIFAY Atlantic Coastal Plain 0 - 12% >72" 40 - 60" A
BROOKMAN Atlantic Coastal Plain 0 - 2% > 60" >72" 0 - 12" unsuitable
CAINHOY Atlantic Coastal Plain 0 - 10% > 60" 40 - 60" A
CAPE FEAR Atlantic Coastal Plain 0 - 2% > 60" 0 - 12" unsuitable
CAPERS Atlantic Coastal Plain 0 - 2% > 60" + 12" - 12" unsuitable
CARNEGIE Atlantic Coastal Plain 2 - 12% 40 - 60" U
CENTENARY Atlantic Coastal Plain 0-5% 42 - 60" A
CHASTAIN Atlantic Coastal Plain 0 - 2% 0 - 12" unsuitable

SECTION C │ Soil Information
On-Site Sewage Management Systems Manual Page 81 of 289
Soil Series
See Suitability
Codes and Installation
Information
MLRA
Major Land Resource
Area
Slope
%
Ranges
of the
soil
type
Depth to
Bedrock
(ranges)
Bedrock
Hardne
ss
Depth to
Seasonal
High H2O
Table
(inches)
Suitability
Code and
Installation
Information
CHIPLEY Atlantic Coastal Plain 0 - 8% 18 - 36" C
CLARENDON Atlantic Coastal Plain 0 - 6% 24 - 36" C
COWARTS Atlantic Coastal Plain 1 - 25% 40 - 60" N
COXVILLE Atlantic Coastal Plain 0 - 2% >72" 0 - 12" unsuitable
CRAVEN Atlantic Coastal Plain 0 - 12% > 60" 24 - 36" C
CROATAN Atlantic Coastal Plain 0 - 12" unsuitable
DASHER Atlantic Coastal Plain 0 - 1% + 12" - 12" unsuitable
DOTHAN Atlantic Coastal Plain 0 - 12% 36 - 60" U
DUCKSTON Atlantic Coastal Plain 0 - 2% > 60" 0 - 6" unsuitable
DUNBAR Atlantic Coastal Plain 0 - 2% > 60" 12 - 24" C
ECHAW Atlantic Coastal Plain 0 - 2% 30 - 60" C
ELLABELLE Atlantic Coastal Plain 0 - 2% + 12" - 6" unsuitable
EULONIA Atlantic Coastal Plain 0 - 6% 18 - 42" C
FOXWORTH Atlantic Coastal Plain 0 - 25% 40 - 60" A
FRIPP Atlantic Coastal Plain 2 - 30% > 60" > 72" unsuitable
FUQUAY Atlantic Coastal Plain 0 - 10% > 60" 48- 72" A or U
GRADY Atlantic Coastal Plain 0 - 2% + 24" - 12" unsuitable
HAZLEHURST Atlantic Coastal Plain 0 - 3% > 60" 6 - 24" C
HURRICANE Atlantic Coastal Plain 0 - 5% > 60" 24 - 42" C
JOHNSTON Atlantic Coastal Plain 0 - 2% 0 - 12" unsuitable
KERSHAW Atlantic Coastal Plain 2 - 15% >72"
KINGSFERRY Atlantic Coastal Plain 0 - 2% > 60" 0 - 6" unsuitable
KINGSLAND Atlantic Coastal Plain 0 - 1% > 60" + 2' - 6" unsuitable
KINSTON Atlantic Coastal Plain 0 - 2% > 60" 0 - 12" unsuitable
KUREB Atlantic Coastal Plain 0 -20% >72"
LAKELAND Atlantic Coastal Plain 0 -85% >72"
LEEFIELD Atlantic Coastal Plain 0 - 12" 18 - 30" C
LEON Atlantic Coastal Plain 0 - 5%
0 - 6" or
deeper C
LEVY Atlantic Coastal Plain 0 - 2% > 60" + 2' to 0" unsuitable
LOWNDES Atlantic Coastal Plain 0 - 17% > 48" A
LUCY Atlantic Coastal Plain 0 - 45% 40 - 60" A
LUMBEE Atlantic Coastal Plain 0 - 2% > 60" 0 - 12" unsuitable
LYNN HAVEN Atlantic Coastal Plain 0 - 5% > 60" 0 - 6" unsuitable
MANDARIN Atlantic Coastal Plain 0 - 3% > 60" 18 - 36" C
MASCOTTE Atlantic Coastal Plain 0 - 2% 6 - 18" C
MEGGETT Atlantic Coastal Plain 0 - 3% >60" 0 - 12" unsuitable
NANKIN Atlantic Coastal Plain 0 - 60% >72" 40 - 60" J
NOBOCO Atlantic Coastal Plain 0 - 6% > 60" 30 - 40" C or S
OCILLA Atlantic Coastal Plain 0 - 10% 12 - 30" C
OGEECHEE Atlantic Coastal Plain 0 - 2% + 1' to 12" unsuitable

SECTION C │ Soil Information
On-Site Sewage Management Systems Manual Page 82 of 289
Soil Series
See Suitability
Codes and Installation
Information
MLRA
Major Land Resource
Area
Slope
%
Ranges
of the
soil
type
Depth to
Bedrock
(ranges)
Bedrock
Hardne
ss
Depth to
Seasonal
High H2O
Table
(inches)
Suitability
Code and
Installation
Information
OLUSTEE Atlantic Coastal Plain 0 - 2% > 80" 6 - 18" C
OSIER Atlantic Coastal Plain 0 - 2% > 60" < 12" unsuitable
OUSLEY Atlantic Coastal Plain 0 - 5% > 60" 18 - 36" unsuitable
PELHAM Atlantic Coastal Plain 0 - 5% + 1' to 18" unsuitable
PICKNEY Atlantic Coastal Plain 0 - 2% < 10" to 20" unsuitable
PLUMMER Atlantic Coastal Plain 0 - 5% 0 - 12" unsuitable
PONZER Atlantic Coastal Plain 0 - 2% > 60" 0 - 12" unsuitable
POOLER Atlantic Coastal Plain 0 - 2% > 60" 0 - 12" C, or J
POTTSBURG Atlantic Coastal Plain 0 - 2% > 60" 0 - 24" C
RAINS Atlantic Coastal Plain 0 - 2% 0 - 12" unsuitable
RICEBORO Atlantic Coastal Plain 0 - 2% > 60" 0 - 12" C, or J
RIDGELAND Atlantic Coastal Plain 0 - 2% > 60" 18 - 30" C
RIGDON Atlantic Coastal Plain 0 - 2% > 60" 18 - 30" C
RIMINI Atlantic Coastal Plain 0 - 10% > 60" > 72"
RUTLEGE Atlantic Coastal Plain 0 - 2% 0 - 6" unsuitable
SAPELO Atlantic Coastal Plain 0 - 2% 0 - 18" C
SATILLA Atlantic Coastal Plain 0 - 1% 0 - 18" unsuitable
SCRANTON Atlantic Coastal Plain 0 - 2% 6 - 18" C
STILSON Atlantic Coastal Plain 0 - 5% >72" 30 - 40" C or S
SUNSWEET Atlantic Coastal Plain 2 - 25% > 72" 40 - 60" J
SURRENCY Atlantic Coastal Plain 0 - 1% >72" 0 to 0.5" unsuitable
TAWCAW Atlantic Coastal Plain 0 - 2% >72" 18 - 30" unsuitable
TELFAIR Atlantic Coastal Plain 2 - 15% 20 - 40" 12 - 36" unsuitable
TIFTON Atlantic Coastal Plain 0 - 8% >72" 40 - 60" U
TROUP Atlantic Coastal Plain 0 - 40% >72" A
VALDOSTA Atlantic Coastal Plain 0 - 5% >72" >60" A
WAHEE Atlantic Coastal Plain 0 - 4% 72" 12 - 18" C, or J
WICKSBURG Atlantic Coastal Plain 0 - 12% 72" 40 - 60" A

SECTION C │ Soil Information
On-Site Sewage Management Systems Manual Page 83 of 289
Table 3.C Soil Texture
Soil
Class Dry Soil Moist Soil
Sand
Loose single grains, which feel gritty
and can be seen with the naked eye.
Squeezed in the hand the soil mass
falls apart when pressure is released.
Squeezed in the hand it forms a cast,
which crumbles when touched. Does not
form a ribbon. Very gritty.
Sandy
Loam
Aggregates are easily crushed; very
faint velvety feeling initially but as
rubbing is continued the gritty
feeling of sand soon dominates.
Feels gritty, forms a cast, which bears
careful handling without breaking.
Doesn’t form a ribbon, will compact when
squeezed between thumb and forefinger.
Loam
Aggregates are crushed under
moderate pressure; clods can be
quite firm. When pulverized loam
has a velvety feel that becomes gritty
with continued rubbing. Casts bear
careful handling.
Cast can be freely handled without
breaking. Slight tendency to ribbon.
Rubbed surface is rough, slightly gritty.
Silt
Loam
Aggregates are firm but may be
crushed under moderate pressure.
Clods are firm to hard. Smooth, flour
like feel dominates when soil is
pulverized.
Cast can be freely handled without
breaking. Slight tendency to ribbon with
rubbed surface having a broken or rippled
appearance.
Clay
Loam
Very firm aggregates and hard clods
that strongly resist crushing by hand.
When pulverized the soil takes a
somewhat gritty feeling due to the
harshness of the very small
aggregates which persist.
Cast can bear much handling without
breaking. Pinched between thumb and
forefinger it forms a ribbon whose surface
tends to feel gritty when dampened and
rubbed. Ribbon will break easily; barely
sustaining its own weight. Will slick
(shine) when rubbed. Soil is plastic, sticky
and puddles easily.
Clay
Aggregates are hard and clods are
extremely hard which strongly
resists crushing by hand. When
pulverized it has a gritty texture due
to harshness of numerous very small
aggregates, which persist.
Casts can bear considerable handling
without breaking. Forms a long flexible
ribbon and retains its plasticity when
elongated. Rubbed surface has a very
smooth, satin feeling, sticky when wet and
easily puddle.

SECTION C │ Soil Information
On-Site Sewage Management Systems Manual Page 84 of 289
Figure 2.C Georgia Major Land Resource Areas (MLRA’s)

SECTION C │ Soil Information
On-Site Sewage Management Systems Manual Page 85 of 289
Figure 3.C Example Soil Report: Page 1 of 2

SECTION C │ Soil Information
On-Site Sewage Management Systems Manual Page 86 of 289
Figure 4.C Example Soil Report: Page 2 of 2

SECTION C │ Soil Information
On-Site Sewage Management Systems Manual Page 87 of 289
Form 1.C Soil Data Record - Percolation, Water Table, and Soil Data
GEORGIA DEPARTMENT OF PUBLIC HEALTH
Soil Data Record - Percolation, Water Table, and Soil Data
Name of Proposed Development:
Location of Proposed Development:
County: Land Lot: Land District:
Owner or Sponsor: Phone Number:
Owner or Sponsor Address:
Percolation Data
Test Hole
Number
Hole Depth and
Percolation Rate
(minutes/inch)
Types of
Subsoil
Encountered
Test
Hole
Number
Hole Depth and
Percolation Rate
(minutes/inch)
Types of
Subsoil
Encountered
1 11
2 12
3 13
4 14
5 15
6 16
7 17
8 18
9 19
10 20
➢ If it appears that the ground water table may adversely affect the operation of on-site sewage
management systems at any time of the year, specify by lot numbers and indicate on a
topographic map the areas so affected:
➢ If rock, shale, hardpan or similar formations occur as outcroppings or within a six-foot depth
on any of the lots in this physical development, specify by lot numbers and indicate on a
topographic map the areas so affected:
Boring
Number Soil Descriptions*
1
2
3
4
5
6
7
8
9
10
*Note: Soil descriptions must include color, texture, structure, consistence, and redoximorphic
features. All borings must be located on a topographic map.
Attach additional sheets as necessary.

SECTION C │ Soil Information
On-Site Sewage Management Systems Manual Page 88 of 289
Form 2.C Soil Survey Report Check List
GEORGIA DEPARTMENT OF PUBLIC HEALTH
Level 3 Soil Survey Report Check List
✓ = Complete x = Incomplete
Soil Survey Report:
Soil survey boundaries mapped at a scale within a range of one-inch equals ten feet to
one-inch equals one hundred feet; a bar scale must be included.
Clear identification of mapping: intensity, scale, and symbols (plus a North arrow).
Caption identifying the project or client name, location of the project and county, contact
number, and date of survey.
Name, address, phone number, and stamp or seal of the Certified Soil Classifier.
Level 3 subdivision reports on a site-specific two-foot contour interval topo map.
Soil Properties Table, Interpretations, and Suitability Code (s):
Name of map unit (soil series,
no symbols)
Verified seasonal high water table within 72
inches of the surface
Suitability code (custom or
Table 1.C)
Absorption rate and depth of occurrence (upper
and lower limits of horizon).
Percent slope Depth to refusal/restrictive layer
Field Evaluations:
A minimum of at least one hole bored and classified per 0.25 acres. For any site less than
one acre in size, four borings are the minimum requirement.
All borings numbered, flagged, and illustrated with their corresponding number on the
finished soil map within 15 feet of the true boring location.
All borings to a minimum of 72 inches, unless a refusal layer is identified or to not less
than 24 inches beneath the planned absorption trench bottom.
All reference points numbered and identified on-site.
*Reports not including the required information should be returned to the Classifier.
Notification of deficient reports shall be provided in writing by mail within 3 business days
Comments:
DPH Representative: Date:

SECTION C │ Soil Information
On-Site Sewage Management Systems Manual Page 89 of 289
Form 3.C OSSMS Construction Permit (page 1)

SECTION C │ Soil Information
On-Site Sewage Management Systems Manual Page 90 of 289
Form 4.C OSSMS Construction Permit (page 2)

SECTION C │ Soil Information
On-Site Sewage Management Systems Manual Page 91 of 289
Form 5.C OSSMS Site Evaluation Request Form

SECTION C │ Soil Information
On-Site Sewage Management Systems Manual Page 92 of 289
Form 6.C Lot Evaluation Record

SECTION C │ Soil Information
On-Site Sewage Management Systems Manual Page 93 of 289
This page intentionally left blank.