section a: chapter 3
TRANSCRIPT

Section A: Chapter 3 – Summary of Water Quality Information for the Yadkin-Pee Dee River Basin 53
Section A: Chapter 3Summary of Water Quality Information for theYadkin-Pee Dee River Basin
3.1 General Sources of Pollution
Human activities can negatively impactsurface water quality, even when theactivity is far removed from thewaterbody. With proper management ofwastes and land use activities, theseimpacts can be minimized. Pollutants thatenter waters can be grouped into twogeneral categories: point sources andnonpoint sources.
Point sources are typically piped discharges and are controlled through regulatory programsadministered by the state. All regulated point source discharges in North Carolina must apply forand obtain a National Pollutant Discharge Elimination System (NPDES) permit from the state.
Nonpoint sources are from a broad range of landuse activities. Nonpoint source pollutants aretypically carried to waters by rainfall, runoff orsnowmelt. Sediment and nutrients are most oftenassociated with nonpoint source pollution. Otherpollutants associated with nonpoint sourcepollution include fecal coliform bacteria, heavymetals, oil and grease, and any other substancethat may be washed off the ground or depositedfrom the atmosphere into surface waters.
Unlike point source pollution, nonpoint pollution sources are diffuse in nature and occurintermittently, depending on rainfall events and land disturbance. Given the diffuse nature ofnonpoint source pollution, it is difficult and resource intensive to quantify nonpoint contributionsto water quality degradation in a given watershed. While nonpoint source pollution control oftenrelies on voluntary actions, the state has many programs designed to reduce nonpoint sourcepollution.
Every person living in or visiting a watershedcontributes to impacts on water quality.Therefore, each individual should be aware ofthese contributions and take actions to reducethem.
Point Sources
Piped discharges from:• Municipal wastewater treatment plants• Industrial facilities• Small package treatment plants• Large urban and industrial stormwater systems
Nonpoint Sources
• Construction activities• Roads, parking lots and roof tops• Agriculture• Failing septic systems and straight pipes• Timber harvesting• Hydrologic modifications
Cumulative Effects
While any one activity may not have a dramaticeffect on water quality, the cumulative effect ofland use activities in a watershed can have asevere and long-lasting impact.

Section A: Chapter 3 – Summary of Water Quality Information for the Yadkin-Pee Dee River Basin 54
3.2 Description of Surface Water Classifications and Standards
North Carolina’s Water Quality Standards program adopted classifications and water qualitystandards for all the state’s river basins by 1963. The program remains consistent with theFederal Clean Water Act and its amendments. Water quality classifications and standards havealso been modified to promote protection of surface water supply watersheds, high qualitywaters, and the protection of unique and special pristine waters with outstanding resource values.
Statewide Classifications
All surface waters in the state are assigned a primary classification that is appropriate to the bestuses of that water. In addition to primary classifications, surface waters may be assigned asupplemental classification. Most supplemental classifications have been developed to providespecial protection to sensitive or highly valued resource waters. Table A-21 briefly describes thebest uses of each classification. A full description is available in the document titled:Classifications and Water Quality Standards Applicable to Surface Waters of North Carolina(NCDENR-DWQ, 2000b). Information, including a database of North Carolina’s streamclassifications, is also available on DWQ’s website at http://h2o.enr.state.nc.us/csu/.
Table A-21 Primary and Supplemental Surface Water Classifications
PRIMARY FRESHWATER AND SALTWATER CLASSIFICATIONS*
Class Best Uses
C and SC Aquatic life propagation/protection and secondary recreation.B and SB Primary recreation and Class C uses.SA Waters classified for commercial shellfish harvesting.WS Water Supply watershed. There are five WS classes ranging from WS-I through WS-V. WS
classifications are assigned to watersheds based on land use characteristics of the area. Each watersupply classification has a set of management strategies to protect the surface water supply. WS-Iprovides the highest level of protection and WS-IV provides the least protection. A Critical Area(CA) designation is also listed for watershed areas within a half-mile and draining to the watersupply intake or reservoir where an intake is located.
SUPPLEMENTAL CLASSIFICATIONS
Class Best Uses
Sw Swamp Waters: Recognizes waters that will naturally be more acidic (have lower pH values) andhave lower levels of dissolved oxygen.
Tr Trout Waters: Provides protection to freshwaters for natural trout propagation and survival ofstocked trout.
HQW High Quality Waters: Waters possessing special qualities including excellent water quality, Nativeor Special Native Trout Waters, Critical Habitat areas, or WS-I and WS-II water supplies.
ORW Outstanding Resource Waters: Unique and special surface waters which are unimpacted bypollution and have some outstanding resource values.
NSW Nutrient Sensitive Waters: Areas with water quality problems associated with excessive plantgrowth resulting from nutrient enrichment.
* Primary classifications beginning with a "S" are assigned to saltwaters.

Section A: Chapter 3 – Summary of Water Quality Information for the Yadkin-Pee Dee River Basin 55
Statewide Water Quality Standards
Each primary and supplemental classification is assigned a set of water quality standards thatestablish the level of water quality that must be maintained in the waterbody to support the usesassociated with each classification. Some of the standards, particularly for HQW and ORWwaters, outline protective management strategies aimed at controlling point and nonpoint sourcepollution. These strategies are discussed briefly below. The standards for C and SC watersestablish the basic protection level for all state surface waters. With the exception of Sw, all ofthe other primary and supplemental classifications have more stringent standards than for C andSC, and therefore, require higher levels of protection.
Some of North Carolina’s surface waters are relatively unaffected by pollution sources and havewater quality higher than the standards that are applied to the majority of the waters of the state.In addition, some waters provide habitat for sensitive biota such as trout, juvenile fish, or rareand endangered aquatic species.
Trout Waters
Different water quality standards for some parameters, such as dissolved oxygen, temperatureand turbidity, have been developed to protect freshwaters for natural trout propagation andsurvival of stocked trout. These water quality standards result in more restrictive limits forwastewater discharges to trout waters (Tr). There are no watershed development restrictionsassociated with the Tr classification. However, the NC Division of Land Resources does requirea 25-foot vegetated buffer between Tr waters and graded construction sites.
A state fishery management classification, Designated Public Mountain Trout Waters, isadministered by the NC Wildlife Resources Commission. It provides for public access tostreams for fishing and regulates fishing activities (seasons, size limits, creel limits, and bait andlure restrictions). Although many of these waters are also classified Tr by DWQ, this is not thesame classification.
High Quality Waters
Special HQW protection management strategiesare intended to prevent degradation of waterquality below present levels from both point andnonpoint sources. HQW requirements for newwastewater discharge facilities and facilitieswhich expand beyond their currently permittedloadings address oxygen-consuming wastes,total suspended solids, disinfection, emergencyrequirements, volume, nutrients (in nutrientsensitive waters) and toxic substances.
For nonpoint source pollution, developmentactivities which require a Sedimentation and Erosion Control Plan in accordance with rulesestablished by the NC Sedimentation Control Commission or an approved local erosion and
Criteria for HQW Classification
• Waters rated as Excellent based on DWQ’schemical and biological sampling.
• Streams designated as native or specialnative trout waters by the WildlifeResources Commission.
• Waters designated as primary nurseryareas or other functional nursery areas bythe Division of Marine Fisheries.
• Waters classified by DWQ as WS-I, WS-IIor SA.

Section A: Chapter 3 – Summary of Water Quality Information for the Yadkin-Pee Dee River Basin 56
sedimentation control program, and which drain to and are within one mile of HQWs, arerequired to control runoff from the development using either a low density or high densityoption. The low density option requires a 30-foot vegetated buffer between developmentactivities and the stream; whereas, the high density option requires structural stormwatercontrols. In addition, the Division of Land Resources requires more stringent erosion controlsfor land-disturbing projects within one mile and draining to HQWs.
Outstanding Resource Waters
A small percentage of North Carolina’s surface waters have excellent water quality (rated basedon biological and chemical sampling as with HQWs) and an associated outstanding resource.
The requirements for ORW waters are morestringent than those for HQWs. Specialprotection measures that apply to NorthCarolina ORWs are set forth in 15A NCAC2B .0225. At a minimum, no newdischarges or expansions are permitted, anda 30-foot vegetated buffer or stormwatercontrols for new developments are required.In some circumstances, the uniquecharacteristics of the waters and resources
that are to be protected require that a specialized (or customized) ORW management strategy bedeveloped.
Water Supply Watersheds
The purpose of the Water Supply Watershed Protection Program is to provide an opportunity forcommunities to work with the state to strengthen protection of their water supplies. There arefive water supply classifications (WS-I to WS-V) that are defined according to the amount andtypes of permitted point source discharges, as well as requirements to control nonpoint sources ofpollution (Table A-20). Watersheds draining to waters classified WS carry some restrictions onpoint source discharges and on many land use activities including urban development,agriculture, forestry and highway sediment control. Minimum requirements for WS-I to WS-IVinclude a 30-foot undisturbed vegetated setback. The WS-I and WS-II classifications are HQWby definition because requirements for these levels of water supply protection are at least asstringent as for HQWs.
Classifications and Standards in the Yadkin-Pee Dee River Basin
There are four watersheds in the Yadkin-Pee Dee River basin that contain Outstanding ResourceWaters. In subbasin 03-07-01, the Elk Creek watershed and several streams in the Roaring Riverwatershed are classified ORW. The Mitchell River watershed, in subbasin 03-07-02, is alsoORW and is used for primary recreation (Class B). Waters classified ORW in subbasin 03-07-09are Barnes Creek and its tributaries in the Uwharrie National Forest.
The ORW rule defines outstanding resource valuesas including one or more of the following:
• an outstanding fisheries resource;• a high level of water-based recreation;• a special designation such as National Wild and
Scenic River or a National Wildlife Refuge;• within a state or national park or forest; or• a special ecological or scientific significance.

Section A: Chapter 3 – Summary of Water Quality Information for the Yadkin-Pee Dee River Basin 57
A portion of the Little River, along with the entire Densons Creek watershed in subbasin 03-07-15, is classified High Quality Waters. Bridgers Creek and a portion of Rocky Creek are alsoHQW. There are many other watersheds in the Yadkin-Pee Dee River basin that contain HQWprotection because they are drinking water supplies classified either WS-I or WS-II. In the upperportion of the basin, these include most of the Reddies River watershed and Little Cub Creek insubbasin 03-07-01; the Fisher River watershed and the Elkin Creek watershed in subbasin 03-07-02; the Toms Creek watershed in subbasin 03-07-03; and the headwaters of the South YadkinRiver in subbasin 03-07-06.
In the lower portion of the basin, water supply watersheds with HQW protection include BackCreek draining to and including Back Creek Lake, as well as an unnamed tributary to Cedar ForkCreek draining to and including Lake Bunch in subbasin 03-07-09; the Coddle Creek watershedfrom its source to the City of Concord water supply intake in subbasin 03-07-11; the headwatersof Dutch Buffalo Creek in subbasin 03-07-12; the headwaters of Marks Creek including WaterLake in subbasin 03-07-16; and the headwaters of North Fork Jones Creek draining toWadesboro City Pond in subbasin 03-07-17.
Portions of the Yadkin-Pee Dee River basin that contain these special classifications are shownon Figures A-12 and A-13.
Pending and Recent Reclassifications in the Yadkin-Pee Dee River Basin
In February 2002, the Citizens Against River Pollution requested that a portion of the UwharrieRiver be reclassified to B and/or ORW. DWQ is currently completing studies needed todetermine whether the proposed waters meet requirements for either or both of these moreprotective classifications.
All or part of Hunting Creek, Rocky Creek, Little Hunting Creek, North Little Hunting Creek,and a larger segment of the upper South Yadkin River would likely qualify for either HQW orORW, but a proposal for reclassification has not yet been received. Biological surveys indicatethat the West Fork Little River might also be eligible for reclassification to HQW. Data alsoindicate that South Fork Jones Creek qualifies for this more protective classification. Citizens,organizations or local governments can recommend waters for reclassification at any time, andDWQ will consider them for these protective classifications.

ASHE
ALLEGHANY SURRY
WILKES
WATAUGA
CALDWELL
ALEXANDERIREDELL
DAVIE
YADKINFORSYTH
STOKESROCKINGHAM
GUILFORD
RANDOLPHDAVIDSON
ROWAN
CABARRUS
STANLY
Winston-Salem
High Point
Trinity
Lexington
Salisbury
Statesville
Elkin King
Mooresville
Tobaccoville
MountAiry
Mocksville
Wilkesboro
Dobson
Troutman
PilotMountain
Archdale
ArlingtonBlowing
Rock
ChinaGrove
Clemmons
Cleveland
Cooleemee
GraniteQuarry
Harmony
Jonesville
Kernersville
Landis
Lewisville
NorthWilkesboro
Rockwell
Rural Hall
Spencer
Thomasville
Walkertown
Yadkinville
Taylorsville
03-07-06
03-07-01 03-07-02
03-07-04
03-07-07
03-07-03
03-07-05Yadkin
River
Yadkin
River
Ararat
River
Fisher
River
Kerr ScottReservoir
Virginia
High RockLake
South
Yadkin
River
Figure A-12 Water Supply Watersheds, Outstanding Resource Watersand High Quality Waters in the Upper Yadkin-Pee Dee River Basin
Planning BranchBasinwide Planning Program UnitMarch 21, 2003
N
EW
S
10 0 10 20 Miles
Subbasin Boundary
County Boundary
WS-I Waters
WS-II Waters
WS-III Waters
WS-IV Waters
HQW Waters
ORW Waters
Municipality
Legend
Hydrography

IREDELL
RANDOLPH
DAVIDSON
ROWAN
CABARRUS
MECKLENBURG
STANLY
MONTGOMERY
MOORE
HOKE
SCOTLAND
RICHMONDANSON
UNION
Charlotte
Concord
High Point
Monroe
Trinity
Kannapolis
Unionville
Albemarle
Asheboro
Mooresville
Locust
Hamlet
Troy
Rockingham
Star
Randleman
Norwood
Denton
Richfield
Ansonville
Seagrove
Archdale
Badin
Biscoe
China Grove
CorneliusDavidson
Gold Hill
Harrisburg
Huntersville
Indian Trail
Marshville
Matthews
Mint HillMountGilead
MountPleasant
New London
Oakboro
Peachland
Stallings
Stanfield
Thomasville
WadesboroWingate
03-07-14
03-07-12
03-07-10
03-07-09
03-07-15
03-07-16
03-07-08
03-07-11 03-07-13
03-07-17
Uwharrie River
Pee Dee
River
South Carolina
BadinLake
LakeTillery
Little
River
Richard
son
Creek
Lane
s
Creek
Planning BranchBasinwide Planning Program UnitMarch 21, 2003
N
EW
S
10 0 10 20 Miles
Subbasin Boundary
County Boundary
WS-II Waters
WS-III Waters
WS-IV Waters
HQW Waters
ORW Waters
Municipality
Legend
Hydrography
Figure A-13 Water Supply Watersheds, Outstanding Resource Watersand High Quality Waters in the Lower Yadkin-Pee Dee River Basin

Section A: Chapter 3 – Summary of Water Quality Information for the Yadkin-Pee Dee River Basin 60
3.3 DWQ Water Quality Monitoring Programs in the Yadkin-Pee DeeRiver Basin
Staff in the Environmental Sciences Branch andRegional Offices of DWQ collect a variety ofbiological, chemical and physical data. Thefollowing discussion contains a brief introductionto each program, followed by a summary of waterquality data in the Yadkin-Pee Dee River basin forthat program. For more detailed information onsampling and assessment of streams in this basin,refer to the Basinwide Assessment Report for theYadkin-Pee Dee River basin, available from theEnvironmental Sciences Branch website athttp://www.esb.enr.state.nc.us/bar.html or by calling(919) 733-9960.
3.3.1 Benthic Macroinvertebrate Monitoring
Benthic macroinvertebrates, or benthos, are organisms that live in and on the bottom substratesof rivers and streams. These organisms are primarily aquatic insect larvae. The use of benthosdata has proven to be a reliable monitoring tool, as benthic macroinvertebrates are sensitive tosubtle changes in water quality. Since macroinvertebrates have life cycles of six months to overone year, the effects of short-term pollution (such as a spill) will generally not be overcome untilthe following generation appears. The benthic community also integrates the effects of a widearray of potential pollutant mixtures.
Criteria have been developed to assign a bioclassification to each benthic sample based on thenumber of different species present in the pollution intolerant groups of Ephemeroptera(Mayflies), Plecoptera (Stoneflies) and Trichoptera (Caddisflies), commonly referred to as EPTs;and a Biotic Index value, which gives an indication of overall community pollution tolerance.Different benthic macroinvertebrate criteria have been developed for different ecoregions(mountains, piedmont and coastal plain) within North Carolina. Bioclassifications fall into fivecategories ranging from Poor to Excellent.
Extensive evaluation of swamp streams across eastern North Carolina suggests that currentcoastal plain criteria are not appropriate for assessing the condition of water quality in thesespecial systems. Swamp streams are characterized by slower flow, lower dissolved oxygen,lower pH, and sometimes very complex braided channels and dark-colored water. DWQ isworking to refine biological criteria that may be used in the future to assign bioclassifications tothese streams. Refer to page 113 of Section A, Chapter 4 for more detailed information.
Overview of Benthic Macroinvertebrate Data
Appendix II lists all the benthic macroinvertebrate collections in the Yadkin-Pee Dee River basinbetween 1983 and 2001, giving site location, collection date, taxa richness, biotic index values
Monitoring programs for theYadkin-Pee Dee River Basin include:
• benthic macroinvertebrates(Part 3.3.1)
• fish assessments(Part 3.3.2)
• aquatic toxicity monitoring(Part 3.3.3)
• lakes assessment(Part 3.3.4)
• ambient monitoring(Part 3.3.5)
• basin association monitoring(Part 3.3.6)

Section A: Chapter 3 – Summary of Water Quality Information for the Yadkin-Pee Dee River Basin 61
and bioclassifications. Benthic macroinvertebrates have been collected at more than 300 sites inthe Yadkin-Pee Dee River basin since 1983. Table A-22 lists the most recent bioclassifications(by subbasin) for all benthos sites in the Yadkin-Pee Dee River basin. Benthos sampling mayslightly overestimate the proportion of Fair and Poor sites, as DWQ special studies often havethe greatest sampling intensity (number of sites/stream) in areas where it is believed that waterquality problems exist.
Table A-22 Summary of Bioclassifications for All Benthic Macroinvertebrate Sites (using themost recent score for each site) in the Yadkin-Pee Dee River Basin
Subbasin Excellent Good Good-Fair Fair Poor Total
03-07-01 12 21 7 0 0 40
03-07-02 7 18 21 2 0 48
03-07-03 0 3 10 4 0 17
03-07-04 0 2 16 9 5 32
03-07-05 0 1 3 3 0 7
03-07-06 11 7 8 4 0 30
03-07-07 0 1 8 12 3 24
03-07-08 0 0 3 2 0 5
03-07-09 6 2 8 0 0 16
03-07-10 0 2 2 1 0 5
03-07-11 0 0 6 5 1 12
03-07-12 0 2 8 10 3 23
03-07-13 0 3 3 6 2 14
03-07-14 0 3 3 6 2 14
03-07-15 9 5 5 1 0 20
03-07-16 2 2 5 2 0 11
03-07-17 0 0 5 1 0 6
Total (#) 47 72 121 68 16 324
Total (%) 15% 22% 37% 21% 5% 100%
Samples over the past five-year planning cycle were almost all collected under severe to extremedrought conditions. Below average precipitation and streamflow tends to concentrate the effectsof point sources of pollution while, in many cases, minimizing the effects of nonpoint sourcepollution. These conditions must be considered when evaluating water quality data. A summaryof how drought affects aquatic life and water quality is found on page 102 of this section.
During basinwide surveys in 2001 (not including special study sites), benthic macroinvertebratecommunities were sampled at 112 sites. Bioclassifications were not assigned at five sites due tolow flow conditions or lack of criteria to properly assess the community. Figure A-14 presentsthe following bioclassifications: Excellent – 16 (15%), Good – 26 (24%), Good-Fair – 36 (34%),

Section A: Chapter 3 – Summary of Water Quality Information for the Yadkin-Pee Dee River Basin 62
Fair – 26 (24%), Poor – 3 (3%). Excellent benthic macroinvertebrate communities were onlyfound in six of 17 subbasins. The largest number of sites receiving Excellent or Goodbioclassifications were located in the upper Yadkin River (subbasins 03-07-01 and 03-07-02) andupper South Yadkin River (subbasin 03-07-06) watersheds. With a few exceptions, Poor andFair bioclassifications were concentrated in subbasins with large amounts of developed area.
2001 Benthic Sampling Results
Figure A-14 Bioclassifications for 107 Yadkin-Pee Dee River Basin BenthicMacroinvertebrate Sites Sampled by DWQ in 2001
Figure A-15 presents long-term trends (>5 years of data) in water quality that were evaluated at108 sites in the Yadkin-Pee Dee River basin. The largest number of sites (87) showed no changein water quality, other than flow-related shifts in community structure. Improving water qualitywas observed at 11 sites. A decline in water quality was documented at 10 sites which arepresented in Table A-23; aquatic life in Grants, Second and Swearing Creeks are now Impaired.The subbasin chapters in Section B discuss all streams in Table A-23 in more detail.
Trends in Benthic Macroinvertebrate Data
Figure A-15 Summary of Trends over Time in Benthic Macroinvertebrate Data
Poor3%
Excellent15%
Good24%
Fair24%
Good-Fair34%
Decline9%
Improvement10%
NoChange
81%

Section A: Chapter 3 – Summary of Water Quality Information for the Yadkin-Pee Dee River Basin 63
Table A-23 Benthic Macroinvertebrate Sites Exhibiting a Decline in Bioclassification
Subbasin Stream Location County
03-07-01 Upper Yadkin River NC 268 Caldwell
03-07-01 Roaring River SR 1990 Wilkes
03-07-02 Little Fisher River Surry
03-07-03 Stewarts Creek NC 89 Surry
03-07-04 Upper Reynolds Creek Above WWTP Forsyth
03-07-04 Grants Creek Rowan
03-07-05 Dutchman Creek Davie
03-07-06 South Yadkin River SR 1561 Iredell
03-07-06 Second Creek Rowan
03-07-07 Swearing Creek NC 47 Davidson
3.3.2 Fish Assessments
The condition of the fish community is one of the most meaningful indicators of ecologicalintegrity to the public. Fish occupy the upper levels of the aquatic food web and are both directlyand indirectly affected by chemical and physical changes in the environment. Water qualityconditions that significantly affect lower levels of the food web (such as benthicmacroinvertebrates) will affect the abundance, species composition and condition of the fishpopulation. Three types of fish assessments are conducted by DWQ: fish community, fish tissueand information about fish kills.
Scores are assigned to fish community samples using the North Carolina Index of BioticIntegrity (NCIBI). The NCIBI uses a cumulative assessment of 12 parameters or metrics. Eachmetric is designed to contribute unique information to the overall assessment. The scores for allmetrics are then summed to obtain the overall NCIBI score. Appendix II contains moreinformation regarding the NCIBI.
During the late 1990s, application of the NCIBI has been restricted to wadeable streams that canbe sampled by a crew of 2-4 persons using backpack electrofishers and following the DWQStandard Operating Procedures (NCDEHNR, 1997). DWQ has no Index of Biotic Integritycalculated for fish populations in lakes, and the NCIBI is not used for high elevation troutstreams due to their naturally limited fish diversity.
Overview of Fish Community Data
Appendix II lists all of the fish community collections in the Yadkin-Pee Dee River basinbetween 1990 and 1999, giving site location, collection date and NCIBI rating. Fish communitysamples have been collected at 86 sites in the Yadkin-Pee Dee River basin since 1990. Table A-24 lists the most recent ratings since 1990, by subbasin, for all fish community sites.
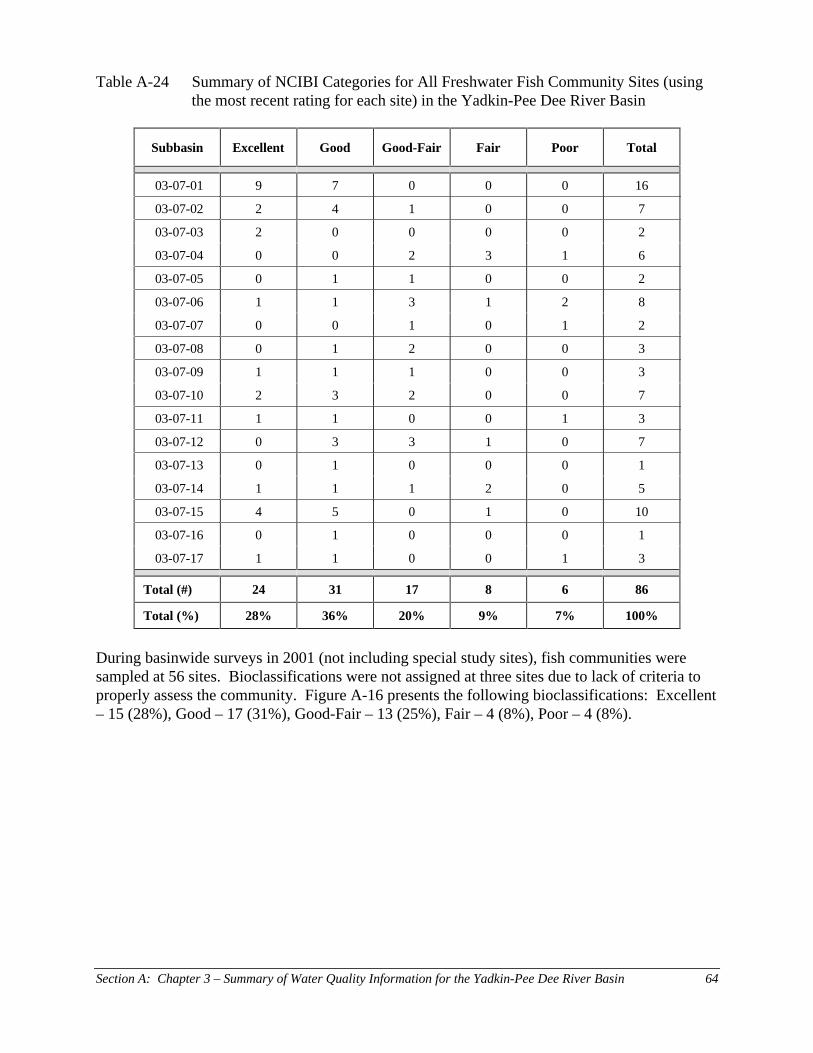
Section A: Chapter 3 – Summary of Water Quality Information for the Yadkin-Pee Dee River Basin 64
Table A-24 Summary of NCIBI Categories for All Freshwater Fish Community Sites (usingthe most recent rating for each site) in the Yadkin-Pee Dee River Basin
Subbasin Excellent Good Good-Fair Fair Poor Total
03-07-01 9 7 0 0 0 16
03-07-02 2 4 1 0 0 7
03-07-03 2 0 0 0 0 2
03-07-04 0 0 2 3 1 6
03-07-05 0 1 1 0 0 2
03-07-06 1 1 3 1 2 8
03-07-07 0 0 1 0 1 2
03-07-08 0 1 2 0 0 3
03-07-09 1 1 1 0 0 3
03-07-10 2 3 2 0 0 7
03-07-11 1 1 0 0 1 3
03-07-12 0 3 3 1 0 7
03-07-13 0 1 0 0 0 1
03-07-14 1 1 1 2 0 5
03-07-15 4 5 0 1 0 10
03-07-16 0 1 0 0 0 1
03-07-17 1 1 0 0 1 3
Total (#) 24 31 17 8 6 86
Total (%) 28% 36% 20% 9% 7% 100%
During basinwide surveys in 2001 (not including special study sites), fish communities weresampled at 56 sites. Bioclassifications were not assigned at three sites due to lack of criteria toproperly assess the community. Figure A-16 presents the following bioclassifications: Excellent– 15 (28%), Good – 17 (31%), Good-Fair – 13 (25%), Fair – 4 (8%), Poor – 4 (8%).

Section A: Chapter 3 – Summary of Water Quality Information for the Yadkin-Pee Dee River Basin 65
2001 Fish Community Sampling Results
Figure A-16 Bioclassifications for 53 Yadkin-Pee Dee River Basin Fish Community SitesSampled by DWQ in 2001
Figure A-17 presents long-term trends (5 years of data) in water quality that were evaluated at 35sites in the Yadkin-Pee Dee River basin. The largest number of sites (17) showed no significantchange in water quality. Improving water quality was observed at 13 sites. A decline in waterquality was documented at five sites which are presented in Table A-25; aquatic life in ThirdCreek is now Impaired. The subbasin chapters in Section B discuss all streams in Table A-25 inmore detail.
Trends in Fish Community Data
Figure A-17 Summary of Trends over Time in Fish Community Data at 35 Sites
Excellent28%
Good31%Good-Fair
25%
Poor8%
Fair8%
NoChange
49%
Improvement37%
Decline14%

Section A: Chapter 3 – Summary of Water Quality Information for the Yadkin-Pee Dee River Basin 66
Table A-25 Fish Community Sites Exhibiting a Decline in Bioclassification
Subbasin Stream Location County
03-07-06 Third Creek SR 1970 Rowan
03-07-08 Mountain Creek SR 1720 Stanly
03-07-09 Betty McGees Creek SR 1107 Randolph
03-07-12 Cold Water Creek NC 73 Cabarrus
03-07-15 West Fork Little River SR 1311 Montgomery
Overview of Fish Tissue Sampling
Since 1997, fish tissue surveys have been conducted by DWQ at two stations within the basin.Fish samples were collected from the Pee Dee River at US 74 during 1999 and from the Pee DeeRiver immediately below Blewett Falls Dam during 2000. All metal contaminants, includingmercury, were undetectable or at levels below current US Environmental Protection Agency, USFood and Drug Administration, and North Carolina fish consumption criteria.
Significant mercury levels were discovered in fish from Ledbetter Lake in 1993. A fishconsumption advisory for largemouth bass due to mercury contamination remains in effect forthis lake. Refer to Chapter 16 of Section B (beginning on page 256) for more information.
Yadkin-Pee Dee River Basin Fish Kills
DWQ field investigators reported 19 fish kill events between 1997 and 2001; five of the killswere in small, private lakes or ponds. Kill activity and fish mortality were the highest in 1997(11 kills affecting 5,250 fish) in the Yadkin-Pee Dee River basin, but levels even in that year arerelatively low when compared with other large river basins in North Carolina. Six events (32percent) were caused by spills. Two spills were related to failing wastewater infrastructure andthree were related to failure of agricultural equipment or lagoons. Algae blooms and lowdissolved oxygen related to excess nutrients and high temperatures were cited as the cause of fivefish kills (26 percent). The cause of 42 percent of kills in the basin over the five-year period isunknown. Fish most often affected were sunfishes, suckers, catfishes and largemouth bass.
3.3.3 Aquatic Toxicity Monitoring
Acute and/or chronic toxicity tests are used to determine toxicity of discharges to sensitiveaquatic species (usually fathead minnows or the water flea, Ceriodaphnia dubia). Results ofthese tests have been shown by several researchers to be predictive of discharge effects onreceiving stream populations. Many facilities are required to monitor whole effluent toxicity bytheir NPDES permit or by administrative letter. Other facilities may be tested by DWQ’sAquatic Toxicology laboratory.
The Aquatic Toxicology Unit maintains a compliance summary for all facilities required toperform tests and provides a monthly update of this information to regional offices and DWQ

Section A: Chapter 3 – Summary of Water Quality Information for the Yadkin-Pee Dee River Basin 67
administration. Figure A-18 presents this summary for the Yadkin-Pee Dee River basin.Ambient toxicity tests can be used to evaluate stream water quality relative to other stream sitesand/or a point source discharge.
0
10
20
30
40
50
60
70
1986
1987
1988
1989
1990
1991
1992
1993
1994
1995
1996
1997
1998
1999
2000
2001
Year
Fac
iliti
es M
onit
orin
g
0
10
20
30
40
50
60
70
80
90
100
Com
plia
nce
(%)
No. Facilities % Meeting Permit Limit
Figure A-18 Summary of Compliance with Aquatic Toxicity Tests in the Yadkin-Pee DeeRiver Basin
Currently, 80 facilities in the Yadkin-Pee Dee River basin have NPDES permits which requirewhole effluent toxicity (WET) monitoring. Of these, 77 permits have a WET limit; the otherthree facility permits have episodic discharges and their permits specify monitoring but with nolimit. In addition, six of the facilities with a WET limit were either temporarily inactive or sonew that they had not yet provided data as of 2001; therefore, only 71 facilities are represented inFigure A-18.
The number of facilities required to monitor whole effluent toxicity has increased steadily since1987, the first year that whole effluent toxicity limits were written into permits in NorthCarolina. The compliance rate has risen as well. Since 1990, the compliance rate has stabilizedat approximately 95 percent. Facilities with toxicity problems during the most recent two-yearreview period are discussed in the subbasin chapters in Section B. A complete listing of facilitiesthat are required to monitor WET is presented in the Basinwide Assessment Report – Yadkin-PeeDee River Basin (NCDENR-DWQ, June 2002).
3.3.4 Lakes Assessment Program
Twenty-six lakes in the basin were monitored as part of the Lakes Assessment Program between1999 and 2001. Each lake was sampled one to three times during the summer months. Therewere a variety of water quality concerns documented during this time period. Appendix IIcontains surface physical data and photic zone chemistry data (1994-2001) for each lake.

Section A: Chapter 3 – Summary of Water Quality Information for the Yadkin-Pee Dee River Basin 68
Sixteen lakes in the basin exhibited symptoms of excessive nutrient loading, including elevateddissolved oxygen and pH values, documented algae blooms, and green or brownish-greencolored water. Most nutrient inputs appeared to be from nonpoint sources (i.e., storm runofffrom agricultural lands and urban areas). Elevated nutrient inputs increase the likelihood ofblooms of nuisance blue-green algae that, in turn, reduce the aesthetic appearance of the lake,cause taste and odor problems in drinking water, and diminish the appeal of recreationalactivities such as swimming.
Sediment loading is also a problem in this river basin. Excess sediment reduces the storagecapacities of lakes over time, introduces nutrients, and reduces aesthetic appeal by giving thewater a muddy appearance. Soils of the Yadkin-Pee Dee River basin are highly erodible. Themost notable example of this problem can be seen in the upper end of High Rock Lake. WinstonLake and Lake Concord also show signs of accelerated sedimentation.
Elevated levels of manganese, iron and zinc were occasionally observed in a few lakesthroughout the basin. All of these metals are naturally occurring in piedmont soils and do notrepresent significant threats to the use of these lakes. Eight lakes had copper concentrationsabove the state water quality standard (7 µg/l). Five of these lakes (Wright, Corriher, Twitty,Water and Wadesboro City Pond) had been treated for algal blooms using copper sulfate prior to,or during, the summer sampling events. Only one sample at the other three lakes (High Rock,Thom-A-Lex and Kannapolis) exceeded the standard. These results are not considered torepresent significant threats to the uses of these lakes.
High Rock Lake, Lake Thom-A-Lex and Back Creek Lake are all impaired due to supersaturateddissolved oxygen (DO) conditions. Excessive DO saturation is defined in North Carolina’s waterquality standards as greater than 110 percent. There are two concerns related to percent DOsaturation: 1) the potential for "gas bubble disease" in aquatic life; and 2) excessive algalphotosynthesis. Fish exposed to water with an excessive concentration of dissolved oxygen arekilled when the dissolved gases in their circulatory system come out of solution to form bubblesthat block the flow of blood through the capillary vessels. In shallow water systems, excessivesaturation is even more deadly due to the restricted movement of the fish. Even when gas bubbledisease does not occur, intermittent exposure of fish to highly saturated waters can be stressful,possibly depressing the fish's immune system and contributing to increased susceptibility ofother diseases. Other aquatic life may also be impacted. Daphnia die within a few days atexposures of 115 percent saturation. Stoneflies have increased mortality at 130 percentsaturation (EPA, 1986).
In terms of algal blooms, percent saturation in combination with other eutrophication-relatedparameters (chloropyll a, pH, DO) can be an early warning sign of blooms. For instance, mostblue-green algae are low in chlorophyll a and may reach bloom proportions long beforeexceeding the chloropyll a standard. However, as they reach bloom levels, they photosynthesize- increasing the dissolved oxygen in the water and raising the percent saturation. Percent DOsaturation for High Rock Lake ranged from 148 to 157 percent between 1999 and 2001.Subbasin chapters in Section B contain further discussion of the water quality condition of eachof these impaired lakes.

Section A: Chapter 3 – Summary of Water Quality Information for the Yadkin-Pee Dee River Basin 69
Concerns that warrant additional follow-up were documented for three lakes:
� Nuisance levels of aquatic macrophytes continue to be observed in Rockingham City Lake.� Hamlet City Lake was drained during the monitoring period for the last basinwide planning
cycle. It has since been refilled, and sampling in 2000 indicates that the lake is stillexperiencing problems due to aquatic macrophytes and possibly increased sedimentation.
� Badin Lake experienced fish kills and poor water quality conditions in 2000 and 2001. Fishkills primarily involved striped bass, bream and catfish. Some of these fish had small soresand appeared to be emaciated. [DWQ conducted a special study of Badin Lake in 2002.Chapter 8 of Section B (page 191) contains details.]
Due to quality assurance issues with laboratory analyses for chlorophyll a from 1996 throughFebruary 2001, only a few of the lakes have 2001 NCTSI scores. No NCTSI scores werecalculated for 1996-2000. Lakes for which one or more uses are Impaired are listed in Table A-36 on page 87 and are discussed in the appropriate subbasin chapter in Section B.
3.3.5 Ambient Monitoring System
The Ambient Monitoring System (AMS) is a network of stream, lake and estuarine samplestations strategically located for the collection of physical and chemical water quality data.North Carolina has 46 stations in the Yadkin-Pee Dee River basin. These locations are listed inAppendix II and shown on the individual subbasin maps in Section B. Each is sampled monthlyfor 27 parameters.
Dissolved Oxygen
During this assessment period (9/1996-8/2001), dissolved oxygen fell below 5.0 mg/l in morethan 10 percent of samples at eight stations. Two stations are on streams that exhibitcharacteristics of swamp streams (Marks Creek and Brown Creek), which include naturally lowerdissolved oxygen, and are located in the small Coastal Plain portion of the basin. Rich Fork andAbbotts Creek are Impaired, primarily due to problems with point source discharges, and arediscussed in more detail in Section B, Chapter 7. The four remaining stations are on the Yadkin-Pee Dee River mainstem; three are directly below hydroelectric facilities. Figure A-19 presentsdissolved oxygen concentrations for all stations along the Yadkin-Pee Dee River mainstem overthe assessment period. Table A-26 summarizes dissolved oxygen data for the four mainstemstations at which more than 10 percent of samples contained concentrations less than 5.0 mg/l.During the last part of the monitoring period (1999-2001), the Yadkin-Pee Dee River basin wasexperiencing a severe drought. Refer to page 102 for details about the relationship betweendrought and water quality.

Section A: Chapter 3 – Summary of Water Quality Information for the Yadkin-Pee Dee River Basin 70
Stations
Patterson
Wilkesboro
Roaring River
Ronda
Elkin
Enon
Yadkin College
Spencer
High Rock
Shankle
Mangum
Rockingham
Cheraw
Dissolved Oxygen
(mg/L)
0
2
4
6
8
10
12
14
16
18
Q0060000
Q0390000
Q0690000
Q0720000
Q0810000
Q2040000
Q2810000
Q4660000
Q6120000
Q7150000
Q9160000
Q9400000
Q9980000
Dashed line represents DO standard of 5.0 mg/L
Figure A-19 Summary of Dissolved Oxygen Concentrations for the Mainstem Yadkin-Pee DeeRiver (9/1996-8/2001)
Table A-26 Summary of Dissolved Oxygen Data for Four Yadkin-Pee Dee River MainstemAmbient Monitoring Stations (9/1996-8/2001)
Station LocationNo. of samples
used in %% of samples
<4.0 mg/l% of samples
<5.0 mg/l
Q6120000 Yakin River below High Rock dam 48 10.4 25.0
Q7150000 Pee Dee River below Lake Tillery dam 57 3.5 10.5
Q9160000 Pee Dee River at NC 109 53 1.9 11.3
Q9400000 Pee Dee River below Blewett Falls 55 9.1 18.2
No trend in dissolved oxygen concentrations (increasing or decreasing) at these stations can bediscerned over the last 20 years. However, the Pee Dee River below Blewett Falls (Q9400000)has recently begun to show an increasing frequency of measurements less than 5.0 mg/l. Thesedata warrant further observation as additional data are collected.
Although data from the Uwharrie River at NC 109 (Station Q6810000) showed no long-termtrends in dissolved oxygen, it is within this assessment period that the only measurements lessthan 5.0 mg/l were observed. Four of the 55 samples (7.3 percent) collected during thisassessment period contained dissolved oxygen in concentrations less than 5.0 mg/l. During theprevious assessment period (1992-1996), the minimum concentration observed at this station was6.9 mg/l. The Uwharrie River is discussed in more detail in Section B, Chapter 10.

Section A: Chapter 3 – Summary of Water Quality Information for the Yadkin-Pee Dee River Basin 71
Seventeen stations showed abnormally elevated (greater than 15.0 mg/l) concentrations ofdissolved oxygen over the assessment period.
Turbidity
More than 10 percent of samples exceeded turbidity water quality standards at 11 stations in theYadkin-Pee Dee River basin within this assessment period (9/1996-8/2001). Table A-27summarizes turbidity data for these stations over the assessment period. Stations situated in thearms of reservoirs had the greatest proportion of samples exceeding the turbidity standard. Theonly station in classified Trout waters is the Yadkin River at NC 268; turbidity there exceededthe standard of 10 NTU in 23 percent of the samples. The frequency of which the standard wasexceeded also increased at this station during the assessment period.
Table A-27 Summary of Turbidity Data for Ambient Monitoring Stations at which 10 Percentof Samples Exceeded the Water Quality Standard (9/1996-8/2001)
Station Subbasin Location ClassificationNo. of Samples
Used in %% > than the
Turbidity Standard
Q0060000 03-07-01 Yadkin River at NC 268 Tr 44 22.7
Q1950000 03-07-03 Ararat River at SR 2080 WS-IV 56 12.5
Q2040000 03-07-02 Yadkin River at SR 1605 WS-IV 58 10.3
Q3460000 03-07-06 South Yadkin River WS-IV 55 10.9
Q4600000 03-07-04 Grants Creek near mouth C 56 10.7
Q4660000 03-07-04 Yadkin River at NC 150 WS-V 55 10.9
Q5360000 03-07-04 Town Creek Arm ofHigh Rock Lake
WS-V 55 27.3
Q5970000 03-07-04 Abbotts Creek Arm ofHigh Rock Lake at NC 47
WS-V & B 56 26.8
Q5999000 03-07-04 Abbotts Creek Arm ofHigh Rock Lake at SR 2295
WS-V & B 45 26.7
Q7330000 03-07-11 Rocky River at SR 2420 C 56 10.7
Q8090000 03-07-12 Irish Buffalo Creek C 57 10.5
* Turbidity standard = 10 NTU for trout waters; 25 NTU for reservoirs; and 50 NTU for all other stations.
Turbidity data collected since 1980 were examined for long-term patterns. Decreases in thelong-term data were noted for a few stations, and an increase was noted for the Yadkin River atNC 268 (Station Q0060000).
Fecal Coliform Bacteria
Fecal coliform bacteria are widely used as an indicator of the potential presence of pathogenstypically associated with the intestinal tract of warm-blooded animals and are therefore found intheir wastes. Coliform bacteria are relatively easy to identify and are usually present in largernumbers than more dangerous pathogens, even though they respond to the environment and totreatment in much the same way. Sources of fecal coliform bacteria, as well as other more

Section A: Chapter 3 – Summary of Water Quality Information for the Yadkin-Pee Dee River Basin 72
dangerous pathogens, include runoff from pastures, feedlots, poultry operations and lagoons thatdo not employ appropriate best management practices. Other sources include straight pipes,leaking and failing septic systems, and noncompliant WWTPs. Wildlife and pet waste alsocontribute to elevated concentrations of pathogens.
Five streams that are classified by DWQ for primary recreation (Class B) contain ambientmonitoring stations. Elk Creek is the only one that had a geometric mean greater than 200colonies per 100 ml over the assessment period. Table A-28 presents all stations with geometricmeans greater than 200 colonies/100ml. Stations where 20 percent or more of samples containedconcentrations greater than 400 colonies/100ml are also presented. These waters are discussed inmore detail in the subbasin chapters in Section B.
Table A-28 Ambient Monitoring Stations with Fecal Coliform Geometric Means Greater than200 Colonies/100ml or with 20 Percent of Samples Greater than 400Colonies/100ml in the Yadkin-Pee Dee River Basin
Station Location ClassificationNo. of SamplesUsed in Mean
GeometricMean
% >400col/100ml
Q0690000 Yadkin River at SR 2327 WS-V 42 117 23.8
Q0220000 Elk Creek at NC 268 B ORW 11 220 --
Q2510000 Salem Creek at Elledge WWTP C 56 773 71.4
Q2600000 Muddy Creek at SR 2995 C 55 488 49.1
Q4660000 Yadkin River at NC 150 WS-V 58 104 20.7
Q3460000 South Yadkin River at SR 1159 WS-IV 54 398 44.4
Q3484000 Hunting Creek at SR 2115 WS-III 56 234 33.9
Q3435000 Fourth Creek at SR 2308 C 56 504 51.8
Q3934500 Third Creek at SR 1970 WS-IV 57 375 56.1
Q4120000 Second Creek at US 70 WS-IV 57 309 33.3
Q4600000 Grants Creek near mouth C 57 291 36.8
Q5930000 Abbotts Creek at SR 1243 C 50 149 22.0
Q5780000 Rich Fork at SR 1800 C 52 254 32.7
Q7330000 Rocky River at SR 2420 C 57 249 33.3
Q8090000 Irish Buffalo Creek at SR 1132 C 56 234 26.8
Q8210000 Rocky River at US 601 C 55 234 21.8
Q8360000 Goose Creek at SR 1524 C 57 241 26.3
Nutrients
The term nutrients in this document refers to the two major plant nutrients: nitrogen andphosphorus. Three different forms of nitrogen are monitored by DWQ under the ambientmonitoring program. They are NH3 or ammonia, NO2+NO3 or nitrite/nitrate nitrogen, and TKNor total nitrogen. Eleven stations exhibited elevated concentrations of both phosphorus and

Section A: Chapter 3 – Summary of Water Quality Information for the Yadkin-Pee Dee River Basin 73
nitrogen over the most recent assessment period (9/1996-8/2001). Generally, concentrationswere higher in the Yadkin River above High Rock Lake than in the mainstem river at all stationsdownstream. Stations with elevated nutrients were clustered in the upper Rocky River and theAbbotts Creek watersheds. However, Richardson Creek contained the highest concentrations ofphosphorus and nitrite/nitrate nitrogen of any station in the basin.
Few statistically significant long-term patterns were evident when all available nutrient data wereexamined. The Roaring River (Q0600000) and the Yadkin River near Elkin (Q0810000) showedincreasing concentrations for nitrite/nitrate nitrogen, but most values were still less than 0.75mg/l. Many stations depicted a dramatic decrease in concentration for nutrients during the 1970sand 1980s. Jones Creek (Q9777000) showed a significant decrease in nitrite/nitrate nitrogenbeginning in late 1992.
Metals
Arsenic, cadmium, chromium, nickel, lead and mercury were detectable (i.e., greater than thereporting level) in less than one percent of sample results over the most recent assessment period.Nickel and lead were detectable at several stations, but no station showed more than 10 percentof samples greater than the appropriate action level. Nickel concentrations, from watersclassified as drinking water supplies, exceeded the action level of 25 µg/l only once at one station(Station Q2810000; 34 µg/l).
Metals that typically had a sufficient number of detectable values were aluminum, copper, iron,manganese and zinc. Aluminum and iron are elements commonly observed to exceed theiraction levels; but these elements are found naturally in the clay-based soils of the piedmont, andaquatic life seem to be generally adapted to the observed levels (verified by biological samplingor toxicity testing). For copper, 35 stations had more than 10 percent of samples greater than theaction level (7.0 µg/l). However, there were only three streams where the median concentrationsexceeded 7.0 µg/l: Ararat River, Long Creek and Hamby Creek. Zinc was observed to exceedits action level (50 µg/l) at many stations. However, laboratory or sampling-relatedcontamination may have produced higher than expected values of zinc between April 1995 andMarch 1999. Median values for all stations were less than 50 µg/l except for the station onMuddy Creek (Q2600000) where a median of 61 µg/l was reported.
Manganese samples are now required to be collected from all waters with water supplyclassifications (WS-I through WS-V). However, not all stations with this classification have asufficient number of samples to provide any confidence in a statistical summary. Only AbbottsCreek at NC 47 exceeded the action level of 200 µg/l.
3.3.6 Yadkin-Pee Dee River Basin Association Monitoring Program
The Yadkin-Pee Dee River Basin Association (YPDRBA) formed in 1998 is comprised of 36members representing local governments, industries and others that own and operate facilitiesrequiring NPDES permits for discharging wastewater. A Memorandum of Agreement withDWQ allows the basin association to conduct all instream sampling (using an independentcontractor) and perform all required analyses (using a state-certified lab) such that each facilitythat participates does not have to conduct individual sampling in order to meet the NPDES

Section A: Chapter 3 – Summary of Water Quality Information for the Yadkin-Pee Dee River Basin 74
permit monitoring requirements. Under this agreement, monitoring sites and parameters sampledare strategically located and established such that instream monitoring basinwide is moreefficient and effective.
Approximately 70 sites (listed in Appendix II) have been sampled on a monthly basis since June1998. Since June 1998, monthly measurements (at minimum, some stations are sampled morefrequently) of temperature, pH, dissolved oxygen, conductivity, turbidity and fecal coliformbacteria have been collected at each site. A few stations were also sampled for selected nutrientsand metals.
Because the YPDRBA only began water quality monitoring in June 1998, the data represent onlya portion of the DWQ assessment period (9/1996-8/2001). Overall streamflow has decreasedsince 1998 due to drought conditions, and these low flows often present a very different waterquality scenario. In addition, some YPDRBA stations are located downstream of wastewatertreatment plants in dissolved oxygen sag zones. Therefore, some caution should be used inmaking comparisons between data collected by the DWQ ambient monitoring program and theYPDRBA monitoring program during this basinwide planning cycle.
Dissolved Oxygen
Dissolved oxygen fell below 5.0 mg/l in more than 10 percent of samples at 10 YPDRBAstations between June 1998 and August 2001. Three stations duplicate DWQ ambientmonitoring stations. During this monitoring period (1999-2001), the Yadkin-Pee Dee Riverbasin was experiencing a severe drought. Refer to page 102 for details about the relationshipbetween drought and water quality. Table A-29 summarizes dissolved oxygen data for stationswhere dissolved oxygen levels are of concern to DWQ. These streams are discussed in moredetail in the appropriate subbasin chapter in Section B.

Section A: Chapter 3 – Summary of Water Quality Information for the Yadkin-Pee Dee River Basin 75
Table A-29 Summary of Dissolved Oxygen Data for Stations of Concern Collected by theYadkin-Pee Dee River Basin Association (6/1998-8/2001)
Station Subbasin LocationNo. of Samples
used in %% of Samples
<4.0 mg/l% of Samples
<5.0 mg/l
Q3105000* 03-07-05 Dutchman Creek at US 64 53 3.8 9.4
Q3555000* 03-07-06 Bear Creek at SR 1116 53 1.9 5.7
Q5785000* 03-07-07 Rich Fork Creek at SR 1787 93 2.2 20.4
Q5790000* 03-07-07 Rich Fork Creek at SR 2123 94 2.1 14.9
Q5940000 03-07-07 Abbotts Creek at I-85 93 5.4 9.7
Q5980000* 03-07-04 Abbotts Creek at NC 47(duplicates DWQ ambient site)
92 1.1 6.5
Q6180000* 03-07-08 UT to Lick Creek near Denton 50 30.0 42.0
Q6705000 03-07-10 Uwharrie River at NC 49 52 1.9 15.4
Q8340000* 03-07-12 UT to Clear Creek at SR 3104 85 7.1 17.6
Q8342000* 03-07-12 Clear Creek at US 601 93 1.9 7.5
Q8360000* 03-07-12 Goose Creek at SR 1524(duplicates DWQ ambient site)
93 3.2 8.6
Q8386000* 03-07-12 N Fork Crooked Creek at SR 1520 85 5.9 17.6
Q8386200* 03-07-12 N Fork Crooked Creek at SR 1514 93 1.1 10.8
Q8800000 03-07-14 Richardson Creek at SR 1751 93 1.1 15.1
Q8820000* 03-07-14 Richardson Creek at SR 1006 93 1.1 8.6
Q9021300 03-07-14 Lanes Creek at SR 1005 53 43.4 54.7
Q9400000 03-07-16 Pee Dee River below Blewett Falls(duplicates DWQ ambient site)
61 4.9 16.4
* These monitoring stations are directly downstream of wastewater treatment plant discharges. Several of them are within thedissolved oxygen sag zone.
Turbidity
More than 10 percent of samples exceeded turbidity water quality standards at 13 YPDRBAmonitoring stations within this assessment period (6/1998-8/2001). Table A-30 summarizesturbidity data for these stations. Turbidity at four mainstem Yadkin River monitoring locationsexceeded the water quality standard in 13-21 percent of samples collected. Water from both theSouth Yadkin River (mostly to agricultural land use) and the upper end of North Fork CrookedCreek (mostly developed/urban land use) exceeded turbidity standards in approximately 24percent of samples. Six sites are located in the upper Rocky River watershed.

Section A: Chapter 3 – Summary of Water Quality Information for the Yadkin-Pee Dee River Basin 76
Table A-30 Summary of Turbidity Data for YPDRBA Monitoring Stations of Concern
Station Subbasin Location ClassificationNo. of Samples
Used in %% > than the
Turbidity Standard
Q1350000 03-07-02 Yadkin River at SR 1003 WS-IV 38 15.8
Q2180000 03-07-02 Yadkin River at US 158 WS-IV 38 13.2
Q2810000 03-07-04 Yadkin River at US 64(duplicates DWQ ambient site)
WS-IV CA 38 21.1
Q4660000 03-07-04 Yadkin River at US 150(duplicates DWQ ambient site)
WS-V 38 18.4
Q3105000 03-07-05 Dutchman Creek at US 64 C 38 13.2
Q3735000 03-07-06 Fourth Creek at SR 2308(duplicates DWQ ambient site)
C 38 13.2
Q3970000 03-07-06 S Yadkin River at US 601 C 38 23.7
Q7600000 30-07-11 Rocky River at SR 1304 C 38 13.2
Q8385000 03-07-12 Rocky River at SR 1606 C 38 13.2
Q8386000 03-07-12 N Fork Crooked Cr at SR 1520 C 33 24.2
Q8386200 03-07-12 N Fork Crooked Cr at SR 1514 C 38 13.2
Q8388000 03-07-12 Crooked Creek at NC 218 C 38 15.8
Q8388900 03-07-12 Crooked Creek at ST 1601 C 38 21.1
* Turbidity standard = 10 NTU for trout waters; 25 NTU for reservoirs; and 50 NTU for all other stations.
Fecal Coliform
Table A-31 presents all YPDRBA stations with geometric means greater than 200colonies/100ml between 1998 and 2001. Stations where 20 percent or more of samplescontained concentrations greater than 400 colonies/100ml are also presented. No monitoring ofwaters classified by DWQ for primary recreation (Class B) is currently conducted by theassociation.
Table A-31 YPDRBA Monitoring Stations with Fecal Coliform Geometric Means Greaterthan 200 Colonies/100ml or with 20 Percent of Samples Greater than 400Colonies/100ml in the Yadkin-Pee Dee River Basin
Station LocationNo. of SamplesUsed in Mean
GeometricMean
% >400col/100ml
Q0450000 Yadkin River at US Bus 421 38 323 44.7
Q1710000 Ararat River 38 180 34.2
Q1725000 Ararat River 38 185 23.7
Q1935000 Ararat River 38 166 31.6
Q2090000 N Deep Creek at SR 1605 38 423 47.4
Q2120000 N Deep Creek 36 297 30.6

Section A: Chapter 3 – Summary of Water Quality Information for the Yadkin-Pee Dee River Basin 77
Q2135000 S Deep Creek 38 268 21.1
Q2291000 Muddy Creek at I-40 38 265 21.1
Q2479455 Salem Creek 38 307 42.1
Q2540000 Salem Creek 38 327 39.5
Q2570000 Salem Creek at 2991 38 368 39.5
Q2720000 Muddy Creek 38 255 23.7
Q2810000 Yadkin River at US 64 38 118 23.7
Q3105000 Dutchman Creek at US 64 38 572 55.3
Q3555000 Bear Creek 38 382 39.5
Q3720000 Fourth Creek at SR 2316 38 543 63.2
Q3735000 Fourth Creek 38 306 44.7
Q3900000 Third Creek 38 314 50.0
Q3932000 Third Creek at 2359 38 294 28.9
Q3970000 South Yadkin River 38 225 21.1
Q4030000 Second Creek 38 359 47.4
Q41650000 Second Creek 38 194 21.1
Q4540000 Grants Creek at 3rd St. Ext. 38 282 34.2
Q4600000 Grants Creek 37 231 21.6
Q5135000 Swearing Creek 38 295 31.6
Q5750000 Rich Fork 38 330 44.7
Q5785000 Rich Fork 38 236 21.1
Q5790000 Rich Fork 38 169 21.1
Q6180000 UT Lick Creek 37 291 29.7
Q7210000 Clarks Creek 37 136 21.6
Q7330000 Rocky River at SR 2420 38 433 44.7
Q7450000 Rocky River at NC 29 38 243 23.7
Q7600000 Rocky River at 1304 38 300 21.1
Q8200000 Coldwater Creek at SR 1132 38 290 28.9
Q8340000 UT Clear Creek at SR 3104 36 325 52.8
Q8342000 Clear Creek at US 601 38 464 50.0
Q8355000 Rocky River at SR 1606 38 124 21.1
Q8359000 Goose Creek at SR 4228 38 988 84.2
Q8360000 Goose Creek 38 412 42.1
Q8386000 N Fork Crooked Cr at SR 1520 33 349 42.4
Q8386200 N Fork Crooked Cr at SR 1514 38 318 28.9
Q8388000 Crooked Creek 38 210 28.9
Q8388900 Crooked Creek at SR 1601 38 290 34.2
Q8800000 Richardson Creek 38 105 21.1
Q9400000 Toms Branch 36 285 30.6

Section A: Chapter 3 – Summary of Water Quality Information for the Yadkin-Pee Dee River Basin 78
3.4 Other Water Quality Research
North Carolina actively solicits "existing andreadily available" data and information for eachbasin as part of the basinwide planning process.Data meeting DWQ quality assurance objectivesare used in making use support determinations.Data and information indicating possible waterquality problems are investigated further. Bothquantitative and qualitative information areaccepted during the solicitation period. High levelsof confidence must be present in order for outsidequantitative information to carry the same weight asinformation collected from within DWQ. This isparticularly the case when considering waters forthe 303(d) list. Methodology for soliciting andevaluating outside data is presented in NorthCarolina’s Draft Water Quality Assessment andImpaired Waters List (NCDENR-DWQ, June2002).
In addition to the Yadkin-Pee Dee River Basin Association monitoring program data that arediscussed in the previous section, five sets of data and information were submitted during themost recent data solicitation period. John Cardarelli submitted an electronic database ofvolunteer monitoring data for Salem and Dunegan Creeks. Electronic data from instreammonitoring of Rich Fork were submitted by the City of High Point. The Forsyth CountyDepartment of Environmental Affairs submitted electronic data from University of NorthCarolina at Asheville studies as well as a summary report on many streams in the Muddy Creekwatershed. Information about current and future land-disturbing activities in the South YadkinRiver watershed was submitted by Keep Iredell Clean, and the Mecklenburg County Departmentof Environmental Protection also submitted electronic data.
The next data solicitation period for the Yadkin-Pee Dee River is planned for fall 2005.
3.5 Use Support Summary
3.5.1 Introduction to Use Support
Surface waters are classified according to their best intended uses. Determining how well awaterbody supports its uses (use support status) is an important method of interpreting waterquality data and assessing water quality.
Surface waters are currently rated as Supporting or Impaired. These ratings refer to whether theclassified uses of the water (such as water supply, aquatic life protection and recreation) arebeing met. For example, waters classified for aquatic life protection and secondary recreation(Class C for freshwater) are rated Supporting if data used to determine use support meet certain
DWQ data solicitation includesthe following:
• Information, letters and photographsregarding the uses of surface waters forboating, drinking water, swimming,aesthetics and fishing.
• Raw data submitted electronically andaccompanied by documentation ofquality assurance methods used to collectand analyze the samples. Maps showingsampling locations must also be included.
• Summary reports and memos, includingdistribution statistics and accompaniedby documentation of quality assurancemethods used to collect and analyze thedata.
Contact information must accompany alldata and information submitted.

Section A: Chapter 3 – Summary of Water Quality Information for the Yadkin-Pee Dee River Basin 79
criteria. However, if these criteria were not met, then the waters would be rated as Impaired.Waters with inconclusive data are listed as Not Rated. Waters lacking data are listed as No Data.
In previous use support assessments, surface waters were rated fully supporting (FS), partiallysupporting (PS) and not supporting (NS). FS was used to identify waters that were meeting theirdesignated uses. Impaired waters were rated PS and NS, depending on their degree ofdegradation. NR was used to identify waters lacking data, or having inconclusive data. Inresponse to a request presented in the EPA’s 2002 Integrated Water Quality Monitoring andAssessment Report Guidance, North Carolina no longer subdivides the Impaired category.
Historically, the Supporting use support rating was also subdivided into fully supporting (FS)and fully supporting but threatened (ST). ST was used to identify waters that were fullysupporting but had some notable water quality concerns and could represent constant, degradingor improving water quality conditions. North Carolina’s past use of ST was very different fromthat of the US Environmental Protection Agency (EPA), which uses it to identify waters thatdemonstrate declining water quality (EPA Guidelines for Preparation of the ComprehensiveState Water Quality Assessments [305(b) Reports] and Electronic Updates, 1997). Given thedifference between the EPA and North Carolina definitions of ST and the resulting confusionthat arose from this difference, North Carolina no longer subdivides the Supporting category.However, these waters and the specific water quality concerns are identified in the Section Bsubbasin chapters so that data, management and the need to address the identified concerns arepresented.
Beginning in 2000 with the Roanoke River Basinwide Water Quality Plan, DWQ assessesecosystem health and human health risk through the development of use support ratings for sixcategories: aquatic life and secondary recreation, fish consumption, shellfish harvesting, primaryrecreation, water supply and "other" uses. These categories are tied to the uses associated withthe primary classifications applied to NC rivers and streams. A single water could have morethan one use support rating corresponding to one or more of the six use support categories. Formany waters, a use support category will not be applicable (N/A) to the use classification of thatwater (e.g., water supply is only applied to Class WS waters). This method of determining usesupport differs from that done prior to 2000; there is no longer an overall use support rating for awater. For more detailed information regarding use support methodology, refer to Appendix III.
3.5.2 Comparison of Use Support Ratings to Streams on the Section 303(d) List
Section 303(d) of the Clean Water Act requires states to identify waters not meeting standards.EPA must then provide review and approval of the listed waters. A list of waters not meetingstandards is submitted to EPA biennially. Waters placed on this list, termed the 303(d) list,require the establishment of total maximum daily loads (TMDLs) intended to guide therestoration of water quality. See Appendix IV for a description of 303(d) listing methodology.
Waters are placed on North Carolina’s 303(d) list primarily due to an Impaired use supportrating. These use support ratings are based on biological and chemical data and, for somecategories, human health advisories. When the state water quality standard is exceeded, then thisconstituent is listed as the problem parameter. TMDLs must be developed for problemparameters on the 303(d) list. Other strategies may be implemented to restore water quality;

Section A: Chapter 3 – Summary of Water Quality Information for the Yadkin-Pee Dee River Basin 80
however, the waterbody must remain on the 303(d) list until improvement has been realizedbased on either biological bioclassifications or water quality standards.
The 303(d) list and accompanying data are updated as the basinwide plans are revised and asTMDL investigations are performed. In some cases, the new data will demonstrate water qualityimprovement and waters may receive a better use support rating. These waters may be removedfrom the 303(d) list since water quality improvement has been attained. In other cases, the newdata will show a stable or decreasing trend in overall water quality resulting in the same, orlower, use support rating. Attention remains focused on these waters until water qualitystandards are being met.
3.5.3 Use Support Ratings for the Yadkin-Pee Dee River Basin
The aquatic life/secondary recreation use support category is applied to all waters in NorthCarolina. Therefore, this category is applied to the total number of stream miles (5,862.2) andlake acres (22,987.6) in the North Carolina portion of the Yadkin-Pee Dee River basin. Table A-32 presents use support ratings by subbasin for both monitored and evaluated waters in theaquatic life/secondary recreation category.
Approximately 37 percent of stream miles (2,181.8) and 91 percent of lake acres (21,020.1) weremonitored for the protection of aquatic life and secondary recreation by DWQ during thisbasinwide planning cycle (Table A-33). Impaired waters account for 17 percent of monitoredstream miles and 56 percent of monitored lake acres. Refer to page 87 for details regardingImpaired waters in all use support categories.

Section A: Chapter 3 – Summary of Water Quality Information for the Yadkin-Pee Dee River Basin 81
Table A-32 Aquatic Life/Secondary Recreation Use Support Ratings for Monitored andEvaluated Waters Listed by Subbasin (1997-2001)
Subbasin Units Supporting Impaired Not Rated No Data Total
03-07-01 MilesAcres
653.11,043.4
0.00.0
0.00.0
213.20.0
866.31,043.4
03-07-02 MilesAcres
380.38.4
0.00.0
0.00.0
335.6126.5
715.9134.9
03-07-03 MilesAcres
124.80.0
11.70.0
0.00.0
36.314.1
172.814.1
03-07-04 MilesAcres
69.3275.3
48.210,449.7
3.371.0
317.2341.3
438.011,137.3
03-07-05 MilesAcres
48.241.6
0.00.0
6.30.0
78.60.0
133.141.6
03-07-06 MilesAcres
320.47.7
67.10.0
34.70.0
262.10.0
684.37.7
03-07-07 MilesAcres
52.852.5
65.9889.9
7.10.0
77.50.0
203.3942.4
03-07-08 MilesAcres
59.22,498.8
13.50.0
0.02,550.0
82.30.0
155.05,048.8
03-07-09 MilesAcres
108.169.6
27.3354.8
0.645.0
138.80.0
274.8469.4
03-07-10 MilesAcres
99.40.0
15.30.0
28.52,570.0
184.013.6
327.22,583.6
03-07-11 MilesAcres
41.55.1
53.00.0
0.00.0
124.416.6
218.921.7
03-07-12 MilesAcres
94.80.0
33.60.0
1.3697.0
187.425.1
317.1722.1
03-07-13 MilesAcres
76.00.0
0.00.0
11.90.0
50.50.0
138.40.0
03-07-14 MilesAcres
162.70.0
37.30.0
2.5347.0
289.00.0
491.5347.0
03-07-15 MilesAcres
237.118.5
0.00.0
19.80.0
131.20.0
388.118.5
03-07-16 MilesAcres
69.498.9
6.30.0
30.7273.0
110.70.0
217.1371.9
03-07-17 MilesAcres
62.30.0
0.00.0
0.676.2
57.57.0
120.483.2
TOTAL MilesAcres
2,659.44,119.8
379.211,694.4
147.36,629.2
2,676.3544.2
5,862.222,987.6
Percent Miles 45.4% 6.5% 2.5% 45.6% 100%
Percent Acres 17.9% 50.9% 28.8% 2.4% 100%

Section A: Chapter 3 – Summary of Water Quality Information for the Yadkin-Pee Dee River Basin 82
Table A-33 Aquatic Life/Secondary Recreation Use Support Summary Information for Watersin the Yadkin-Pee Dee River Basin (2001)
Monitored andEvaluated Waters*
MonitoredWaters Only**Aquatic Life/Secondary Recreation
Use Support RatingsMiles or
Acres% Miles or
Acres%
Supporting 2,659.4 mi4,119.8 ac
45.4%17.9 %
1,655.3 mi2,696.5 ac
75.9%12.8%
Impaired 379.2 mi11,694.4 ac
6.5%50.9 %
379.2 mi11,694.4 ac
17.4%55.6%
Not Rated 147.3 mi6,629.2 ac
2.5%28.8 %
147.3 mi6,629.2 ac
6.7%31.5%
No Data 2,676.3 mi544.2 ac
45.6%2.4 %
TOTAL 5,862.2 mi22,987.6 ac
2,181.8 mi21,020.1 ac
* = Percent based on total of all streams, both monitored and evaluated. ** = Percent based on total of all monitored streams.
Fish Consumption
Like the aquatic life/secondary recreation use support category, fish consumption is also appliedto all waters in the state. Fish consumption use support ratings are based on fish consumptionguidelines issued by the NC Department of Health and Human Services. Therefore, if a fishconsumption advisory is posted at the time of the use support assessment, the water is ratedImpaired. For details about how use support determinations are made, refer to Appendix III.
Due to high levels of mercury in three freshwater and four saltwater fish species, the NCDivision of Public Health has issued broad health advice for consumption of these fish caughtsouth and east of Interstate 85. In addition, a specific fish consumption advisory is posted forlargemouth bass from Ledbetter Lake due to elevated mercury concentrations. For details aboutthese advisories, refer to the discussion beginning on page 104. Table A-34 presents use supportratings by subbasin for all waters in the fish consumption use support category.
Fish tissue was monitored in only 0.1 percent of stream miles (6.3) and 0.3 percent of lake acres(67.0) during this basinwide planning cycle. A basinwide summary of current fish consumptionratings is presented in Table A-35. Fish tissue samples were collected from the Pee Dee River atUS 74 during 1999 and from the Pee Dee River immediately below Blewett Falls Dam during2000. All metal contaminants, including mercury, were undetectable or at levels below currentUS Environmental Protection Agency, US Food and Drug Administration, and North Carolinafish consumption criteria. However, significant mercury levels were discovered in fish fromLedbetter Lake in 1993.

Section A: Chapter 3 – Summary of Water Quality Information for the Yadkin-Pee Dee River Basin 83
Table A-34 Fish Consumption Use Support Ratings for Monitored and Evaluated WatersListed by Subbasin (1997-2001)
Subbasin Units Supporting Impaired Total
03-07-01 MilesAcres
866.31,043.4
0.00.0
866.31,043.4
03-07-02 MilesAcres
715.9134.9
0.00.0
715.9134.9
03-07-03 MilesAcres
172.814.1
0.00.0
172.814.1
03-07-04 MilesAcres
352.7301.8
85.310,835.5
438.011,137.3
03-07-05 MilesAcres
133.141.6
0.00.0
133.141.6
03-07-06 MilesAcres
684.37.7
0.00.0
684.37.7
03-07-07 MilesAcres
146.686.7
56.7855.7
203.3942.4
03-07-08 MilesAcres
0.00.0
155.05,048.8
155.05,048.8
03-07-09 MilesAcres
0.00.0
274.8469.4
274.8469.4
03-07-10 MilesAcres
0.00.0
327.22,583.6
327.22,583.6
03-07-11 MilesAcres
152.521.7
66.40.0
218.921.7
03-07-12 MilesAcres
0.00.0
317.1722.1
317.1722.1
03-07-13 MilesAcres
0.00.0
138.40.0
138.40.0
03-07-14 MilesAcres
0.00.0
491.5347.0
491.5347.0
03-07-15 MilesAcres
0.00.0
388.118.5
388.118.5
03-07-16 MilesAcres
0.00.0
217.1371.9
217.1371.9
03-07-17 MilesAcres
0.00.0
120.483.2
120.483.2
TOTAL MilesAcres
3,224.21,651.9
2,638.021,335.7
5,862.222,987.6
Percent Miles 55.0% 45.0% 100%
Percent Acres 7.2% 92.8% 100%

Section A: Chapter 3 – Summary of Water Quality Information for the Yadkin-Pee Dee River Basin 84
Table A-35 Fish Consumption Use Support Summary Information for Waters in the Yadkin-Pee Dee River Basin (2001)
Monitored andEvaluated Waters*
MonitoredWaters Only**Aquatic Life/Secondary Recreation
Use Support RatingsMiles or
Acres% Miles or
Acres%
Supporting 3,224.2 mi1,651.9 ac
55.0%7.2%
0.0 mi0.0 ac
0.0%0.0%
Impaired 2,638.0 mi21,335.7 ac
45.0%95.8%
6.3 mi67.0 ac
100.0%100.0%
TOTAL 5,862.2 mi22,987.6 ac
6.3 mi67.0 ac
* = Percent based on total of all streams, both monitored and evaluated. ** = Percent based on total of all monitored streams.
Primary Recreation
There are 218 stream miles and 15,314 lake acres currently classified for primary recreation inthe Yadkin-Pee Dee River basin. Primary recreation use support ratings are based on swimmingadvisories issued by the NC Department of Health and Human Services. Currently, there is oneswimming advisory posted for a portion of Elk Creek in subbasin 03-07-01. This stream isdiscussed in detail in Chapter 1 of Section B. Table A-36 presents use support ratings bysubbasin for all waters in the primary recreation category.
Approximately 28 percent of stream miles (61.5) and 97 percent of lake acres (14,886.4) weremonitored for the protection of primary recreation by DWQ over the past five years (Table A-37). Impaired waters account for 14.5 percent of monitored stream miles.

Section A: Chapter 3 – Summary of Water Quality Information for the Yadkin-Pee Dee River Basin 85
Table A-36 Primary Recreation Use Support Ratings for Monitored and Evaluated WatersListed by Subbasin in Miles (1997-2001)
Subbasin Units Supporting Impaired No Data Total
03-07-01 MilesAcres
19.9948.7
9.10.0
49.90.0
78.9948.7
03-07-02 MilesAcres
30.00.0
0.00.0
22.817.6
52.817.6
03-07-03 MilesAcres
0.00.0
0.00.0
0.00.0
0.00.0
03-07-04 MilesAcres
0.04,880.9
0.00.0
3.0359.5
3.05,240.4
03-07-05 MilesAcres
0.00.0
0.00.0
18.941.6
18.941.6
03-07-06 MilesAcres
0.00.0
0.00.0
0.00.0
0.00.0
03-07-07 MilesAcres
11.0855.7
0.00.0
0.00.0
11.0855.7
03-07-08 MilesAcres
5.05,048.8
0.00.0
9.00.0
14.05,048.8
03-07-09 MilesAcres
0.00.0
0.00.0
0.00.0
0.00.0
03-07-10 MilesAcres
20.03,152.3
0.00.0
8.48.6
28.43,160.9
03-07-11 MilesAcres
0.00.0
0.00.0
0.00.0
0.00.0
03-07-12 MilesAcres
0.00.0
0.00.0
0.00.0
0.00.0
03-07-13 MilesAcres
0.00.0
0.00.0
0.00.0
0.00.0
03-07-14 MilesAcres
0.00.0
0.00.0
6.40.0
6.40.0
03-07-15 MilesAcres
0.00.0
0.00.0
0.00.0
0.00.0
03-07-16 MilesAcres
0.00.0
0.00.0
4.50.0
4.50.0
03-07-17 MilesAcres
0.00.0
0.00.0
0.00.0
0.00.0
TOTAL MilesAcres
85.914,886.4
9.10.0
122.9427.3
217.915,313.7
Percent Miles 39.4% 4.2% 56.4% 100%
Percent Acres 97.2% 0.0% 2.8% 100%

Section A: Chapter 3 – Summary of Water Quality Information for the Yadkin-Pee Dee River Basin 86
Table A-37 Primary Recreation Use Support Summary Information for Waters in the Yadkin-Pee Dee River Basin (2001)
Monitored andEvaluated Waters*
MonitoredWaters Only**Aquatic Life/Secondary Recreation
Use Support RatingsMiles or
Acres% Miles or
Acres%
Supporting 85.9 mi14,886.4 ac
39.4%97.2%
52.4 mi14,886.4 ac
85.2%100.0%
Impaired 9.1 mi0.0 ac
4.2%0.0%
9.1 mi0.0 ac
14.5%0.0%
No Data 122.9 mi427.3 ac
56.4%2.8%
TOTAL 217.9 mi15,313.7 ac
61.5 mi14,886.4 ac
* = Percent based on total of all streams, both monitored and evaluated. ** = Percent based on total of all monitored streams.
Water Supply
There are 1,655.6 stream miles and 21,549.0 lake acres currently classified for water supply inthe Yadkin-Pee Dee River basin. All were evaluated within the past five years; all are fullysupporting. A basinwide summary of current water supply use support ratings is presented inTable A-38.
Table A-38 Water Supply Use Support Summary Information for Waters in the Yadkin-PeeDee River Basin (2001)
Evaluated WatersWater SupplyUse Support Ratings
Miles %
Supporting 1,655.6 mi21,549.0 ac
100%100%
Impaired 0.0 mi0.0 ac
0%0%
Not Rated 0.0 mi0.0 ac
0%0%
TOTAL 1,655.6 mi21,549.0 ac
Impaired Waters
Table A-39 presents Impaired waters (in all categories), listed by subbasin, in the Yadkin-PeeDee River basin. Ratings for each applicable use support category are shown, even though onlyone use may be Impaired. Descriptions of Impaired segments, as well as potential causes andsources, are outlined in Appendix III. Maps showing current use support ratings are presented inthe appropriate subbasin chapter in Section B, along with a discussion of management strategies.

Section A: Chapter 3 – Summary of Water Quality Information for the Yadkin-Pee Dee River Basin 87
Table A-39 Monitored Impaired Waters within the Yadkin-Pee Dee River Basin (as of 2000)1
Use Support Categories/Rating– Impaired Miles (or Acres)
ImpairedWater1 Subbasin
Chapter inSection B
Classification2 Aquatic Life/Secondary Recreation
FishConsumption
PrimaryRecreation
WaterSupply
PotentialSources
Elk Creek 03-07-01 1 B ORW S S I – 9.1 mi N/A NP
Lovills Creek 03-07-03 3 WS-IV, C I – 4.2 mi S N/A S NP, P
Faulkner Creek 03-07-03 3 C I – 6.1 mi S N/A N/A NP
Heatherly Creek 03-07-03 3 C I – 4.2 mi S N/A N/A P, NP
Muddy Creek 03-07-04 4 C I – 15.2 mi S N/A N/A NP
Salem Creek 03-07-04 4 C I – 12.0 mi S N/A N/A NP, P
Grants Creek 03-07-04 4 C I – 1.2 mi S N/A N/A P, NP
Town Creek 03-07-04 4 C I – 15.4 mi S N/A N/A NP, P
High Rock Lake 03-07-04 4 WS-V, WS-IV B I – 15,750.0 ac I* S S NP, P
South Yadkin River 03-07-06 6 C I – 5.3 mi S N/A N/A NP, P
Fourth Creek 03-07-06 6 C I – 29.3 mi S N/A N/A NP, P
Third Creek 03-07-06 6 C I – 22.1 mi S N/A N/A NP, P
Second Creek 03-07-06 6 C I – 10.4 mi S N/A N/A NP, P
Lake Thom-A-Lex 03-07-07 7 WS-III I – 650.0 ac S N/A S NP
Abbotts Creek 03-07-07 7 C I – 8.0 mi I* N/A N/A NP, P
Rich Fork 03-07-07 7 C I – 20.1 mi I* N/A N/A P
Hamby Creek 03-07-07 7 C I – 11.1 mi I* N/A N/A P
North Hamby Creek 03-07-07 7 C I – 5.8 mi I* N/A N/A NP
Swearing Creek 03-07-07 7 C I – 14.3 mi S N/A N/A NP
Yadkin River 03-07-08 8 WS-IV B I – 0.8 mi I* S S Dam
Lick Creek 03-07-08 8 C, WS-IV I – 7.7 mi I* N/A S NP
Little Mountain Creek 03-07-08 8 C, WS-IV I – 5.7 mi I* N/A S P

Section A: Chapter 3 – Summary of Water Quality Information for the Yadkin-Pee Dee River Basin 88
Use Support Categories/Rating– Impaired Miles (or Acres)
ImpairedWater1 Subbasin
Chapter inSection B
Classification2 Aquatic Life/Secondary Recreation
FishConsumption
PrimaryRecreation
WaterSupply
PotentialSources
Uwharrie River 03-07-09 9 C I – 26.7 mi I* N/A N/A Dam
Back Creek Lake 03-07-09 9 WS-II I – 250.0 ac I* N/A S NP
Pee Dee River 03-07-10 10 WS-V B I – 15.3 mi I* S S Dam, P
Rocky River 03-07-1103-07-12
11, 12 C I – 42.6 mi I* N/A N/A P, NP
Dye Branch 03-07-11 11 C I – 4.4 mi I* N/A N/A NP, P
Coddle Creek 03-07-11 11 C I – 14.5 mi I* N/A N/A NP
Goose Creek 03-07-12 12 C I – 13.1 mi I* N/A N/A P, NP
Duck Creek 03-07-12 12 C I – 9.7 mi I* N/A N/A NP
North Fork Crooked Cr 03-07-12 12 C I – 12.0 mi I* N/A N/A NP, P
Richardson Creek 03-07-14 14 C I – 9.9 mi I* N/A N/A NP, P
Lanes Creek 03-07-14 14 C I – 36.8 mi I* N/A N/A NP
Ledbetter Lake 03-07-16 16 WS-III ND I N/A S NP
Pee Dee River 03-07-16 16 C I – 6.3 mi I3 N/A N/A Dam
* These waters are Impaired because of broad, mercury-related fish consumption health advice for three freshwater fish species. However, the waters are not monitored for the fishconsumption category during this basinwide cycle. Refer to page 104 for further information.
Notes1 These waters are currently, or will be placed, on the 303(d) list, and a TMDL and/or management strategy will be developed to address causes and sources of impairment.
Refer to Appendix IV for further information regarding 303(d) listing methodology.2 An index for DWQ freshwater classifications can be found on page 54 of this section (Table A-20).3
Analysis of fish tissue samples, collected by DWQ in 1999 and 2000 from the Pee Dee River at two locations, revealed one largemouth bass with elevated levels of mercury.No other species or sample contained elevated levels of any metals tested. Refer to Appendix II for details of fish tissue assessment in the Yadkin-Pee Dee River basin.
S Supporting ND No Data P Point SourcesI Impaired N/A Not Applicable NP Nonpoint Sources