section 5.0 trout movement - pacificorp · pdf file5.0 adult rainbow trout movement ... a...
TRANSCRIPT

© February 2004 PacifiCorp Fish Resources FTR Page 5-1Fish Resources FTR.doc
5.0 ADULT RAINBOW TROUT MOVEMENT STUDY, KLAMATH RIVER, 2003
5.1 DESCRIPTION AND PURPOSE
PacifiCorp initiated a radiotelemetry study to provide information on the movements of rainbowtrout (Oncorhynchus mykiss) in Klamath River during 2003. More specifically, this investigationdocuments the movements of rainbow trout in J.C. Boyle Development from February toSeptember 2003. In recent years, a decline in rainbow trout use of the J.C. Boyle dam fish ladderhas raised concerns that the existing ladder is ineffective, and that trout are either delayed ordeterred from moving upstream of the dam.
Ineffective fish passage may reduce stream connectivity and potential genetic exchange betweentrout that reside upstream and downstream of the J.C. Boyle dam. Also, if fish are attempting to“home” to waters upstream of the dam, discharge from the powerhouse might be providing astronger attraction than the J.C. Boyle bypass because of higher flows or a more concentratedhoming scent, which could result in migration delay or cessation. Similar concerns also havebeen expressed regarding potential migration delays and passage issues for anadromoussalmonids if they were re-introduced to the area.
Previous tagging studies indicate that few trout move upstream through the J.C. Boyle fish ladderduring the spring spawning season. This suggests that trout may be spawning downstream of theJ.C. Boyle dam either in the J.C. Boyle bypass reach and/or the peaking reach (Olson, 2002).Before this study, specific spawning activity had not been observed downstream of the dam andno apparently suitable spawning substrate had been located. However, recent fishery assessmentsampling found fry in both the bypass and peaking reaches. The question remains as to whereand when trout are spawning downstream of the dam. This study, along with the other aquaticstudies being conducted for relicensing, will provide important information on the movementand migration of rainbow trout in the J.C. Boyle Development area.
5.2 OBJECTIVES
The objectives addressed by this study are as follows:
1. Assess adult trout passage through the J.C. Boyle fish ladder and powerhouse tailrace.
2. Evaluate potential delays in adult trout movement related to flows, Project facilities, andoperations.
3. Gather information on the passage effectiveness for radio-tagged rainbow trout that use theJ.C. Boyle fish ladder.
4. Document adult fish residence in the J.C. Boyle bypass reach and peaking reaches throughthe spawning period. Telemetry monitoring alone will not determine if trout are spawning inthe reaches; however, follow-up snorkeling to observe fish may provide better information.
5. Observe longitudinal movement patterns of rainbow trout within the J.C. Boyle bypass reach,peaking reach, and associated tributaries in spring during the primary spawning migrationfrom February through June.

PacifiCorpKlamath Hydroelectric ProjectFERC Project No. 2082
Fish Resources FTR Page 5-2 © February 2004 PacifiCorpFish Resources FTR.doc
6. Observe longitudinal movement patterns of rainbow trout within the J.C. Boyle bypass reachand peaking reaches and tributaries during the post-spawning period from June throughAugust, to describe possible water quality effects on fish movement.
7. Observe rainbow trout movement during peaking operations in the J.C. Boyle peaking reach.
5.3 RELICENSING RELEVANCE AND USE IN DECISIONMAKING
The final results of this study will provide important information for use in interpreting howProject facilities and flow conditions in the J.C. Boyle bypass and peaking reaches may influencethe movement patterns and habitat use of the existing adult rainbow trout populations. Resultsmay also provide insight on how proposed protection, mitigation, and enhancement (PM&E)measures might alter these movements and habitat use in the future. In some cases, the resultswill be used by PacifiCorp and the Aquatic Work Group (AWG) to decide whether additionaltypes of studies are needed to better formulate and support the proposed measures.
5.4 METHODS AND GEOGRAPHIC SCOPE
5.4.1 Geographic Scope
The Klamath River basin flows through south-central Oregon and northern California, and drainsan area of approximately 12,100 square miles (Figure 5.4-1). The Klamath River flows south-west from its headwaters downstream into Upper Klamath Lake near the town of Klamath Falls,Oregon. From Link River dam, which is the outlet of the Upper Klamath Lake, the river flowsabout 254 miles downstream to its mouth near Klamath, California.
The focus of this study is on a portion of the Upper Klamath River that extends from the head ofJ.C. Boyle reservoir (RM 228.2) downstream to Copco No. 1 dam (RM 198.6) (Figure 5.4-2).Streamflows are strongly influenced by project operations from the tailrace of J.C. Boylepowerhouse (RM 220.4) downstream to Copco reservoir (RM 203.7). This section of theKlamath River is referred to as the peaking reach, and it can have typical seasonal flow andtemperature patterns, as well as fluctuate on a daily basis.
The geographic scope of the Project focused on the J.C. Boyle fish ladder, powerhouse, and thebypass and peaking reaches. Tributaries were included if fish moved into such habitat. Fish inShovel Creek will be tracked 1.5 miles up the tributary. If fish migrated through the ladder, theywere tracked above the J.C. Boyle dam including such areas as the J.C. Boyle reservoir, SpencerCreek, and the Klamath River 0.5 mile upstream into the Keno reach.

PacifiCorpKlamath Hydroelectric Project
FERC Project No. 2082
© February 2004 PacifiCorp Fish Resources FTR Page 5-3Fish Resources FTR.doc
Figure 5.4-1. Geographical location of the Klamath River basin in south-central Oregon and northern California.

PacifiCorpKlamath Hydroelectric ProjectFERC Project No. 2082
Fish Resources FTR Page 5-4 © February 2004 PacifiCorpFish Resources FTR.doc
Figure 5.4-2. Study area for assessing the effects of Project operation and facilities on the movement of radio-taggedrainbow trout in the Klamath River.

PacifiCorpKlamath Hydroelectric Project
FERC Project No. 2082
© February 2004 PacifiCorp Fish Resources FTR Page 5-5Fish Resources FTR.doc
5.4.1.1 Environmental Setting
During the study period, PacifiCorp operated the J.C. Boyle powerhouse under typical flowscenarios. That is, if dry conditions prevailed, the powerhouse operated under a daily peakingregime using one turbine unit. When flows increased, two units were peaked until there wassufficient flow to operate continuously (unless the river flow is near 3,000 cfs, at least one unitmay peak on a daily basis). Spill at J.C. Boyle dam did not occur unless river flow was greaterthan 3,000 cfs, the powerhouse tripped off-line and the canal spilled into the lower bypass reach,or there was a maintenance event.
Mean daily streamflows during the study period varied from 380 to 3,850 cfs, with the highestflows occurring in the spring from mid-March to mid-June (Figure 5.4-3). Like most powerpeaking or load-following projects, streamflow conditions also fluctuated on a daily cycle as well(Appendix 5A).
0
1,000
2,000
3,000
4,000
Feb-
01
Mar
-03
Apr
-02
May
-02
Jun-
01
Jul-0
1
Jul-3
1
Aug
-30
Date
Flow
(cfs
)
Figure 5.4-3. Provisional U.S. Geological Survey (USGS) daily mean flow (cfs) recorded for the Klamath Riverdownstream of J.C. Boyle powerhouse (Station 11510700). Red lines from April 28 to May 2 and June 22 to 26,2003, indicate that mean daily values were calculated from available hourly records on those dates.
Stream temperatures were monitored at seven different locations during the study period. Therewere two stations in the J.C. Boyle bypass reach, one each in Shovel and Spencer creeks, andthree in the peaking reach. Mean daily stream temperatures measured in the upper and lower J.C.Boyle bypass reach ranged from 3.4 to 25.4°C (Figure 5.4-4). The lower station in the J.C. Boylebypass indicates that spring water inflow to the bypass tends to moderate temperatures fromwinter to summer; temperatures ranged from 8 to 17°C in this section. Spencer and Shovelcreeks are major spawning tributaries in the study area. Spencer Creek was colder during thewinter and warmer during the summer than Shovel Creek, but the creeks had similar

PacifiCorpKlamath Hydroelectric ProjectFERC Project No. 2082
Fish Resources FTR Page 5-6 © February 2004 PacifiCorpFish Resources FTR.doc
Boyle Bypass
0
5
10
15
20
25
Feb-01 Mar-03 Apr-02 May-02 Jun-01 Jul-01 Jul-31 Aug-30
Date
Mea
n D
aily
Tem
p (C
RM 220.5 (Upper Boyle Bypass)
RM 224.5 (Lower Boyle Bypass)
Shovel and Spencer Creeks
0
5
10
15
20
25
Feb-01 Mar-03 Apr-02 May-02 Jun-01 Jul-01 Jul-31 Aug-30
Date
Mea
n D
aily
Tem
p (C
Spencer Creek
Shovel Creek
Klamath River
0
5
10
15
20
25
Feb-01 Mar-03 Apr-02 May-02 Jun-01 Jul-01 Jul-31 Aug-30
Date
Mea
n D
aily
Tem
p (C
RM 220.4 (J.C. Boyle PH)
RM 219.7 (USGS-11510700)
RM 206.5 (Upstream Shovel Ck.)
Figure 5.4-4. Stream temperature was monitored at seven different locations in the study area. There were twostations in the J.C. Boyle bypass reach, one each in Shovel and Spencer creeks, and three in the peaking reach.

PacifiCorpKlamath Hydroelectric Project
FERC Project No. 2082
© February 2004 PacifiCorp Fish Resources FTR Page 5-7Fish Resources FTR.doc
temperatures during the spring spawning period. Mean daily stream temperature in the peakingreach of the Klamath River ranged from 3.4 to 23.7°C. Stream temperatures measured at theUSGS station indicate that bypass reach inflow tends to moderate the temperature of water thatexits the powerhouse (Appendix 5B). As expected, downstream of the USGS station, streamtemperatures tend to increase in the peaking reach (Figure 5.4-4).
5.4.1.2 J.C. Boyle Development
PacifiCorp’s Klamath River Hydroelectric projects were built between 1908 and 1962 andconsist of seven hydroelectric facilities and one non-generating project. Since the J.C. BoyleDevelopment is the focus of this study, only this facility is described in this section. A morecomplete discussion of the other projects can found in Exhibit A of the licensing application.
J.C. Boyle dam was completed in 1958 and is located at RM 224.7 on the Klamath River. Thedam is about 15 miles southwest of the City of Klamath Falls in Klamath County, Oregon. Thefacility is an earthen dam with three 36-foot by 12-foot tainter spill gates and a diversion intaketower. The reservoir formed by the dam has a capacity of 3,495 acre-feet (ac-ft) with about1,507 ac-ft of usable storage. The reservoir extends upstream for a distance of 3.6 miles and hasa normal water surface elevation of about 3,793 feet mean sea level (msl).
Water for power generation is drawn from the reservoir at the intake tower of the dam throughfour 11.5-foot-wide openings. Each opening is equipped with a vertical traveling screen tominimize fish entrainment. The four intakes combine into a single 14-foot-diameter steel pipethat extends 638 feet across the Klamath River and empties into a diversion canal. The diversioncanal directs water about 2 miles downstream to the forebay of the penstock openings and canaloverspill. Water flows from the forebay through a 15.5-foot-diameter, concrete-lined tunnel thatsplits into two 10.5-foot-diameter steel penstocks. The penstocks enter the powerhouse and wateris supplied to two vertical turbine units that have a combined total hydraulic capacity of about2,850 cfs.
The J.C. Boyle bypass reach is approximately 4.2 miles long and extends from the earthen damdownstream to the powerhouse channel. Flow in the bypass channel of the Klamath River is thecombination of 100 cfs discharged from the fish ladder (80 cfs) and juvenile bypass (20 cfs).Groundwater within the bypass reach contributes an additional 220 to 250 cfs, so by the time thebypass channel reaches the confluence of the peaking reach near the powerhouse, flow isapproximately 350 cfs.
Fish passage at J.C. Boyle dam is provided by a concrete pool and weir fish ladder that rises 67feet in elevation from the base of the dam to the reservoir. The fish ladder entrance is located onthe left bank, approximately 200 feet downstream of the dam and is at the farthest upstream pointof the J.C. Boyle bypass reach. The fish ladder is 569 feet long and has 57 pools. The poolsmeasure about 6 feet wide and 8 feet long, and have 3.5-foot-high weirs separating each pool.Passage upstream is accomplished when the fish jump over the weir or swim through a 4-inch by4-inch orifice located at the bottom-center of each weir. Constant flow is maintained by anautomated gate system located at the upstream end of the fish ladder. An auxiliary water supplysystem ensures that a total of 80 cfs are provided as attraction flow at the entrance.
Downstream passage facilities also are provided at J.C. Boyle dam. Each of the four entrances atthe intake structure is equipped with Rex vertical traveling screens to prevent entrainment of fish

PacifiCorpKlamath Hydroelectric ProjectFERC Project No. 2082
Fish Resources FTR Page 5-8 © February 2004 PacifiCorpFish Resources FTR.doc
into the power canal. High pressure spray systems keep the screens clean and free of debrisbuildup. In 1988, the fish screen housings were modified to allow full-year continuous operation(FishPro, 2000). In 1992, new fiberglass screens with 1/8-inch mesh replaced the previous metalscreens. The bypass route is a pipe with an entrance at the south end of the intake structure withan exit at the discharge channel downstream from the spillway apron. A constant bypass flow of20 cfs is used to convey fish through the bypass entrance.
5.4.2 Methods
To meet the objectives of this study, radio tags were inserted in 42 rainbow trout and theirmovements were observed using mobile and fixed-location receivers. Methods used aredescribed below.
5.4.2.1 Site Reconnaissance and Noise Evaluation
Power production from hydroelectric facilities typically produces ambient electrical noise, whichincludes noise events that coincide with specific frequencies as well as codes that are similar toradio tag signals. Therefore, before conducting this radio-telemetry study, the extent andfrequency of the noise within the study area were monitored. This evaluation was used to selectfrequencies and codes that did not coincide with ambient background noise.
Noise evaluations were conducted at J.C. Boyle, Copco No. 1, Keno, and Iron Gate dams.Ambient background noise was monitored over an approximate 24-hour period on December 2,2002. Frequencies that are readily available for use are in the 148- to –152-MHz range in 20-kHzincrements (i.e., 148.320 to 148.800 MHz). There are a total of 25 frequencies (also referred toas channels) per MHz and 212 codes available for each channel. The 148-MHz range wasselected because this frequency had performed well at other hydroelectric facilities.
Background noise was evaluated at each site with an aerial telemetry system consisting of two,three-element Yagi antennas installed near the middle of the dam. Each system was monitoredby a single Lotek SRX 400 receiver, programmed with all 25 possible frequencies available inthe 148-MHz range. The receivers were programmed with a 5-second scan cycle, with eachfrequency being monitored every 125 seconds. Files from each of the projects were analyzed toidentify noise events on specific channels and codes. Collectively, the results of the noiseevaluation indicate that the projects produced low levels of ambient noise across the 148-MHzrange. Therefore, channel 14 (148.580 MHz) and codes 01-45 were selected.
5.4.2.2 Telemetry System Design
Three fixed-station telemetry systems were installed to monitor the movements of rainbow troutduring the spring spawning and migration period (February to mid-May 2003). The stations weredeployed to monitor the movements of tagged fish as they encountered sensitive passage areaslocated at the J.C. Boyle powerhouse and fish ladder. The first and farthest downstream fixed-station site was located at the BLM boat launch (RM 220.1)1. The second station was located atthe J.C. Boyle powerhouse (RM 220.4) to monitor the movement of fish at the confluence of the
1 The original study plan had three fixed telemetry sites, but the equipment was stolen from the BLM site in Marchand was not put back in service.

PacifiCorpKlamath Hydroelectric Project
FERC Project No. 2082
© February 2004 PacifiCorp Fish Resources FTR Page 5-9Fish Resources FTR.doc
powerhouse tailrace and J.C. Boyle bypass reach. Finally, the last station was placed in the fishladder system at J.C. Boyle dam (RM 224.7) to monitor the upstream passage.
The BLM boat launch is located in the upper peaking reach of the Klamath River. A single three-element Yagi antenna fixed to a 10-foot extension mast was placed on top of the BLM building.The antenna was monitored by a single SRX 400 Lotek receiver that was supplied with powerfrom a 12-volt recreational vehicle (RV) battery. The antenna was aimed to provide coverage ofthe large pool next to the building and adjusted to ensure that all radio-tagged fish that passedthrough this location were detected. The purpose of this system was to establish the time rainbowtrout entered or exited the first large pool downstream of the powerhouse.
The fixed-station receiver located at J.C. Boyle powerhouse consisted of one aerial and twounderwater antennas to monitor movement near the Project (Figure 5.4-5). The first antenna wasa series of six bare coax underwater antennas combined to monitor the J.C. Boyle powerhousetailrace. Each antenna was attached to a 5- to 8-pound (lb) weight suspended from the handrail atthe powerhouse. Detection by this array established that tagged fish were near the powerhousechannel. The second antenna array was a series of two bare coax underwater antennas combined,which then were weighted and sunk to the bottom of the J.C. Boyle bypass reach. These antennasmonitored tagged fish as they entered and exited the J.C. Boyle bypass reach. The last antennawas a single, three-element Yagi antenna positioned at the confluence of the powerhouse tailraceand J.C. Boyle bypass reach (Figure 5.4-6). This antenna was directed downstream to encompassthe area immediately downstream of the powerhouse outfall and slightly upstream into the J.C.Boyle bypass reach. All three arrays were monitored by a single Lotek SRX unit supplied with110-volt power supply and a 12-volt RV battery backup.
To assess passage through the J.C. Boyle fish ladder, three antenna arrays were deployed. Theseantennas were installed to monitor the approach, entrance, and exit of tagged fish from the fishladder (Figure 5.4-6). The system was designed to assess passage time through the fish ladderand document if fish made several attempts to approach or enter that ladder system.
The first antenna was used to monitor the approach of tagged fish. This antenna consisted of asingle bare coax antenna suspended from a rope approximately 30 feet downstream of theentrance to the ladder. The antenna was configured to detect radio-tagged fish as theyapproached the fishway entrance. The antenna documented the number of fish near the ladderand the number of visits.
The second antenna monitored the entrance of the fish ladder with series of three underwaterantennas placed inside the ladder. These antennas were suspended in adjacent weirs andcombined as one antenna to increase the detection area. This antenna recorded the entrance timeinto the ladder system and could be used to establish the number of attempts each fish made toascend the ladder.
The last antenna monitored the fish ladder exit and consisted of a series of three underwaterantennas suspended in alternate weirs. These antennas also were combined to increase thedetection area at the fish ladder exit. This antenna established the exit time for each fish thatascended the ladder and was used to calculate total passage time. Each array was monitored as aseparate antenna by a single Lotek SRX receiver. This system was supplied with a 110-voltpower supply and 12-volt RV battery backup.

PacifiCorpKlamath Hydroelectric ProjectFERC Project No. 2082
Fish Resources FTR Page 5-10 © February 2004 PacifiCorpFish Resources FTR.doc
Figure 5.4-5. Locations of fixed-station telemetry receivers at the BLM boat launch (RM 220.1), and J.C. Boylepowerhouse (RM 220.4), and fish ladder (RM 224.7).

PacifiCorpKlamath Hydroelectric Project
FERC Project No. 2082
© February 2004 PacifiCorp Fish Resources FTR Page 5-11Fish Resources FTR.doc
Figure 5.4-6. Telemetry systems deployed at the J.C. Boyle powerhouse and fish ladder to monitor movement ofradio-tagged rainbow trout, 2003.

PacifiCorpKlamath Hydroelectric ProjectFERC Project No. 2082
Fish Resources FTR Page 5-12 © February 2004 PacifiCorpFish Resources FTR.doc
5.4.2.3 Collection, Radio-Tag Selection, and Surgical Procedures
A total of 42 rainbow trout was tagged in three sections of the Klamath River from February 3 toFebruary 21, 2003. Fourteen rainbow trout were tagged in three principle areas: the J.C. Boylebypass reach (RM 220.4-224.7), Klamath River upper peaking reach (RM 212.0-220.4), andKlamath River lower peaking reach (RM 205.2-212.0) (Figure 5.4-7).
Collection
To collect and tag rainbow trout in the Klamath River, collection permit guidelines werefollowed, as set by the ODFW and CDFG. Those guidelines stipulated hook and line methods,no-bait, and barbless hook. Fish were captured with rod and reel techniques using either fly orspinning reel gear. In accordance with the collection permit, artificial flies and lures with asingle-barbless hook were used to reduce injury and stress to captured trout. In areas withadequate river access, a submerged polyvinyl chloride (PVC) holding pen was placed in the riverat a central location during the collection process. After capture, fish were placed in 5-gallonbuckets and transported to the holding pen. In the least accessible areas, individual fish were heldin 5-gallon buckets for transport, anesthesia, and recuperation. In such instances, fish weretagged immediately after they were captured to minimize handling time.
Radio-Tags
Selection of the transmitter type was based on size, weight, and tag longevity. Winter (1983)identified a criterion of 2 percent ratio of transmitter to body weight (in air) as being acceptable.For transmitters used in this study, that criterion would allow the tagging of trout equal to orgreater than 225 grams. However, more recent information suggests that a radio transmitter thatis as much as 5 to 10 percent of the fish’s body weight will not adversely affect fish behavior(Adams et al. 1998). A previous study indicated that an upstream migrant in Shovel Creek at 2percent body weight would have to weigh 225 grams and would be about 277 millimeter (mm)FL (approximately 11 inches) (Beyer, 1984).

PacifiCorpKlamath Hydroelectric Project
FERC Project No. 2082
© February 2004 PacifiCorp Fish Resources FTR Page 5-13Fish Resources FTR.doc
Figure 5.4-7. Tag site locations for rainbow trout radio-tagged in the Klamath River. Numbers beside each boxindicate the number of trout radio-tagged.

PacifiCorpKlamath Hydroelectric ProjectFERC Project No. 2082
Fish Resources FTR Page 5-14 © February 2004 PacifiCorpFish Resources FTR.doc
Taking a conservative approach (based on Adams et al., 1998), it was decided to tag only thosefish for which the transmitter did not exceed 5 percent of the body weight. When this criterionwas applied to Beyer’s (1984) length-weight data, this equated to fish that were about 205 mmFL (about 8 inches) or weighed about 87 grams. Based on this information, adult rainbow troutwere implanted with digitally encoded transmitters developed by Lotek Engineering. Thetransmitter, model NCT-6-2, was 9.1 mm in diameter, 30.9 mm long, and weighed 4.5 grams.With a 5.0-second burst rate, the estimated life of the transmitter was 199 days2. Based on thenoise evaluation conducted in the Project area, a frequency of 148.580 MHz (channel 14) andcodes 01-45 were selected to identify individual fish.
Surgical Procedures
Transmitters were surgically implanted in 42 rainbow trout following procedures outlined inSummerfelt and Smith (1990). Fish were anesthetized in a solution of 80 milligrams per liter(mg/L) tricaine methanesulfonate (MS-222) until they lost equilibrium. Fish were weighed(grams) and measured (mm), and those fish that had external injuries, excessive scale loss, orwere less than 205 mm FL were released after they recovered from anesthesia.
During surgery, the fish was placed on a V-shaped cradle and supplied with anesthetic waterwith a large bulb-type syringe (turkey baster). The incision site was swabbed with iodine and thebody of the fish was sprayed with a diluted solution of Pro-polyaqua (synthetic fish mucous).The radio-tag was implanted through a 2.0-centimeter (cm) incision between the pectoral andpelvic fins slightly off the mid-ventral line. A 16-gauge hypodermic needle sheathed within aTeflon tube (to protect internal organs) was then inserted into the body cavity of the fish. Theneedle was positioned at a 45-degree angle to the medial line of the fish and pierced through thebody wall of the fish. After the needle was inserted into the fish, the Teflon sheath was removedand the transmitter antenna was inserted into the needle. The hypodermic needle then wasremoved and the transmitter was inserted into the body cavity of the fish. The incision wasclosed with three to four internally knotted absorbable sutures and swabbed with iodine. Scalpel,hypodermic needle, and tweezers were immersed in isopropyl alcohol following each fish’ssurgery. Radio-tagged fish were held in 5-gallon buckets or in the live cage until each fishrecovered from the anesthetic. The fish were released back into the river after recovery from theanesthetic. A global positioning system (GPS) waypoint was assigned to each fish upon release.
5.4.2.4 Mobile Tracking
From mid-February to September 2003, mobile surveys in the study area were used to documentthe location of radio-tagged fish. The study area was separated into three survey reaches: J.C.Boyle bypass reach, the upper peaking reach (Oregon), and the lower peaking reach (California).The survey reaches outline the general locations of where fish were tagged to assess movementin the Project area. Typically, the J.C. Boyle bypass and upper peaking reaches were surveyed onthe same day, and the lower peaking reach was surveyed on alternate days.
To assess movement during the spring spawning period, mobile telemetry surveys wereconducted 4 days per week from February 3 to May 15. Mobile surveys in Oregon and Californiaalternated every other day to provide complete coverage of the study area. On Mondays and 2 Minimum tag life was originally estimated at 226 days at a 5-second burst rate but the manufacturer found that thebatteries installed in these tags were only projected to last 199 days.

PacifiCorpKlamath Hydroelectric Project
FERC Project No. 2082
© February 2004 PacifiCorp Fish Resources FTR Page 5-15Fish Resources FTR.doc
Wednesdays, surveys were conducted in Oregon from J.C. Boyle dam downstream to RM 211.0on the Klamath River. On alternate days, the California section was surveyed from near theOregon border downstream to the Copco bypass area. From May 15 to September 15, surveyswere conducted approximately twice per week, covering each portion of the study area once.Surveys ended the second week of September 2003 when radio tags could no longer be detected.The Klamath River was inaccessible by vehicle from about RM 210.5 to 211.5.
Radio-tagged fish were detected using a single whip antenna mounted to the roof of the vehicleand a hand-held, three-element Yagi antenna. The initial detection of tagged fish was from themounted whip antenna as the vehicle traveled slowly along the roadway. As the signal becamestronger, a hand-held Yagi antenna was used to obtain a more precise location by walking alongthe road or stream. A GPS unit documented the location of each fish, and the waypoint, date,time, tag code, receiver power rating, and river habitat (i.e., pool, riffle, glide, etc.) wererecorded. After the survey was complete, the numbers of tagged fish detected versus totalnumber tagged were tabulated. If there were several fish that were not detected during a mobilesurvey, it became necessary to expand the area surveyed. Field data were entered into computerspreadsheets and GPS data were downloaded at least once per week. A geographic informationsystem (GIS) was used to plot all fish positions in the study area (Appendix 5C).
5.4.2.5 Stream Temperature and Flow
Stream temperatures were monitored continuously throughout the study period at seven locationsand flow was monitored at the USGS station downstream of J.C. Boyle powerhouse. There werethree stations in the Klamath River, two in the J.C. Boyle bypass reach, and one each in Shoveland Spencer creeks (Figure 5.4-8). In the Klamath River, the stations were located just upstreamof Shovel Creek (RM 206.5), at the USGS station (RM 219.7), and at the J.C. Boyle powerhouse(RM 220.4). Stream temperatures in the J.C. Boyle bypass reach were recorded at two sites:downstream of the dam (RM 224.6) and at the lower end of the bypass just upstream of thepowerhouse (RM 220.5). In Shovel and Spencer creeks, stream temperature was recorded in thelower 1 mile of stream.
Stream temperatures for each station were recorded from February to September, except for theKlamath River station just upstream of Shovel Creek, where the station began monitoring streamtemperature in April 2003. The USGS station recorded both flow (cfs) and stream temperature(°C) every 0.5 hour. All other stations recorded stream temperature every hour and weredownloaded at least twice during the study period. Flow and stream temperature in contrast withfish movements are displayed in Appendices 5A, 5B, and 5D.

PacifiCorpKlamath Hydroelectric ProjectFERC Project No. 2082
Fish Resources FTR Page 5-16 © February 2004 PacifiCorpFish Resources FTR.doc
Figure 5.4-8. Location of stream temperature stations in the study area. Station 5 is USGS station 11510700, whichmonitors both flow and temperature.

PacifiCorpKlamath Hydroelectric Project
FERC Project No. 2082
© February 2004 PacifiCorp Fish Resources FTR Page 5-17Fish Resources FTR.doc
5.4.2.6 Evaluation of Sensitive Passage Areas
To assess delay during the spring migration period, the movements of radio-tagged fish werecontinuously monitored at two locations from February to mid-May. A third location at the BLMsite was discontinued after the equipment was stolen in March. The first location was at the J.C.Boyle powerhouse where movement was monitored near the Project tailrace at the confluence ofthe powerhouse and J.C. Boyle bypass reach. The second location was at the J.C. Boyle fishladder. These sites were identified during the study development process as areas of potentialdelay. To assess delay in these areas, passage conditions and fish movement were evaluated toestablish if there was evidence that fish were delayed or deterred in these locations. Thefollowing evaluation process was used to provide some evidence of delay or deterrence in anarea:
• Encounters. The first step considered the number of fish that encountered each passage area.
• Direction of Movement and Passage Attempts. Fish that approached the powerhouse weredivided into two groups: those moving upstream and those moving downstream when theyentered the tailrace confluence area. At the fish ladder, the number of attempts each fishmade to pass J.C. Boyle dam also was recorded.
• Passage Conditions. As the fish encountered each area, passage conditions (i.e., powerhouseoperation and spill) were described.
• Passage Success. The final step was to assess the fate of the fish and determine if passagewas successful. Passage time and success are important components that may provideevidence of either delay or deterrence. Clearly, several unsuccessful passage attempts meantthat fish were deterred from moving through or past a particular area. Failure after severalattempts excluded fish that may have been simply investigating or probing a passage area ona single occurrence. Unfortunately, there are no clear criteria for defining delay (i.e., hours,days, or weeks) that can be easily applied to resident fish behavior. However, assuming thatthe spring spawning and migration period is about 12 weeks (84 days), some means ofcomparison for the passage time through each area can be provided.
5.4.2.7 Data Retrieval and Management
Three separate types of data files were compiled in a single database to assess movement ofrainbow trout. The first file contained information on the location (GPS), tag code, time ofrelease, and length and weight for each fish tagged. The second file contained all mobiletelemetry information. Waypoints used to located individual fish during mobile surveys weredownloaded from the GPS into map moving software. This program allowed plotting ofwaypoints on electronic versions of USGS 7.5-minute (1:24,000) maps every week. This filecontained GPS location, tag code and date/time. The third file contained information from fixed-station receivers that were checked approximately every other day to ensure proper operation(i.e., battery voltage, receiver time, memory status, etc.) and were downloaded at least once aweek. All downloaded files were converted to ASCII format and appended to a master receiverfile. At the end of the study, all fixed-station receiver files, mobile survey data, and tagginginformation were coded with a unique receiver number and combined into a relational databasefor final data analysis.

PacifiCorpKlamath Hydroelectric ProjectFERC Project No. 2082
Fish Resources FTR Page 5-18 © February 2004 PacifiCorpFish Resources FTR.doc
5.5 RELATIONSHIP TO REGULATORY REQUIREMENTS AND PLANS
This trout movement study is intended to provide information that, together with environmentaldata and the results of past and ongoing studies, can be used to assess effects of Projectoperations on fish resources. The data and results also will help in formulating recommendationsfor PM&E measures that are consistent with agency and tribal management goals. The followingcontain references to objectives for fisheries in the study area:
• CDFG Upper Klamath Wild Trout Management Plan
• ODFW Klamath River Basin Fish Management Plan
• U.S. Fish and Wildlife Service (USFWS) and National Marine Fisheries Service (NMFS)Endangered Species Act requirements
• Klamath River Wild and Scenic River Plan
• U.S. Forest Service Klamath River Restoration Plan
• Tribal natural resource goals and objectives and cultural values
• Long-Range Plan of the Klamath River Basin Fisheries Task Force
The results of this trout movement study will be used to help determine if current Projectoperations are affecting trout, and what changes to Project operations or facilities might beneeded to achieve these objectives.
5.6 TECHNICAL WORKGROUP COLLABORATION
PacifiCorp has worked with stakeholders to establish a more collaborative process for planningand conducting studies needed to support Project relicensing documentation. As part of thiscollaborative process, an AWG was formed and meets approximately monthly to plan anddiscuss aquatic resource (primarily fish) study plans and results. Initially PacifiCorp hadproposed conducting the trout movement study from February to May to document spawningactivity. However, AWG members also expressed interest in seeing how fish move in responseto changing water quality conditions. Based on collaborative discussions, the study was extendedto September 2003 to document fish movement during the summer months.
5.7 STUDY OBSERVATIONS AND FINDINGS
5.7.1 Detection of Rainbow Trout
The detection of radio-tagged fish during mobile surveys of the study area remained fairly high(more than 80 percent) until the second week of July (Figure 5.7-1). Most fish (70 percent) weredetected throughout the study period with only 1- or 2-week gaps in their detection history untilmid-July (week 24) (Table 5.7-1). However, a few fish remained undetected throughout most ofthe study and it was suspected that some fish died during the study period. The followingsections provide some detail on the fate of these fish, but most can be explained by: (1) predationor shed tags, (2) fish that left or were removed from the study area, or that moved to areas with

PacifiCorpKlamath Hydroelectric Project
FERC Project No. 2082
© February 2004 PacifiCorp Fish Resources FTR Page 5-19Fish Resources FTR.doc
limited detection, and (3) tag failure. The decrease in fish detected at the end of July (week 26)can be attributed to tag-use expiring (199 days) (Table 5.7-1).
0
6
12
18
24
30
36
42
1 2 3 4 5 6 7 8 9 10 11 12 13 14 15 16 17 18 19 20 21 22 23 24 25 26 27 28 29 30
Survey Week and Month
Num
ber
0
10
20
30
40
50
60
70
80
90
100
Perc
ent (
%)
Detected Not Detected Recovered Not Recovered Percent Detected
| Feb | Mar | April | May | June | July | August |
Figure 5.7-1. Number and percent displayed for fish detected during each survey week (1-30) of the study period.Plot also displays the number of fish not detected and the number of tags that were recovered or could not berecovered during the study period.
Tag Fate
Efforts were made in July and August to recover radio tags from fish that were suspected to havedied or shed their tags. Seven radio tags were recovered and five others could not be recoveredbecause of their location (Table 5.7-1). Five of the seven tags recovered were from fish that hadentered Shovel Creek (the number on the tag is the same number that is assigned to the fish)(TagNo. 02, 36, 41, 42, and 45). Three of those tags were recovered in Shovel Creek (Tag No. 02, 36,45) and two (Tag No. 41 and 42) were recovered downstream of Shovel Creek. One tag (Tag No.45) recovered in Shovel Creek was found on the bank 6 feet above the high water mark and theother two tags (Tag No. 02 and 36) were recovered with bite marks on the antennas. Of the tagsrecovered downstream of Shovel Creek, one (Tag No. 41) was found about 1.3 milesdownstream on the bank outside the wetted channel and the other tag (Tag No. 42) wasdiscovered in the water of the Copco bypass.
Two tags (Tag No. 08 and 10) were recovered from fish that had not entered Shovel Creek. Onetag (Tag No. 08) was recovered on the hillside about 1,000 feet from the stream channel in thelower peaking reach (RM 207.8). Interestingly, the last mobile survey before the tag wasrecovered suggests that the fish was about 5.5 miles upstream in the upper peaking reach (RM213.4). The last tag recovered (Tag No. 10) was found under a tree used by great blue herons(Ardea herodias) along J.C. Boyle reservoir. There was obvious debris (i.e., nesting material,droppings, and feathers) underneath the tree where the tag was found. The last mobile surveybefore the tag became suspect suggests that the fish was about 2.5 miles downstream in the J.C.

PacifiCorpKlamath Hydroelectric ProjectFERC Project No. 2082
Fish Resources FTR Page 5-20 © February 2004 PacifiCorpFish Resources FTR.doc
Boyle bypass reach (RM 224.9). Because this fish was observed upstream of J.C. Boyle dam onMay 19, after the fixed-station receiver was removed, it is not clear whether the fish wastransported as a result of predation or whether it had passed the fish ladder system before beingpreyed upon.
Tags that were not recovered (Tag No. 03, 16, 18, 24 and 27) were from five fish that may havebeen preyed upon or shed their tags. The signal for two tags (Tag No. 03 and 16) placed the fishclose to heron nest sites. Tag No. 03 was detected on numerous occasions at the same site inshallow water near the location where Tag No. 10 was found along J.C. Boyle reservoir. Similarto Tag No. 03 and 10, the signal for Tag No. 16 originated from underneath a similar roosting ornesting site, but on the hillside along Copco reservoir. This tag could not be recovered because itwas located underneath a thick patch of poison oak surrounding the roosting or nesting tree.Three other tags (Tag No. 18, 24, and 27) could not be recovered because they were either inthick brush or were located in large riprap along the bank.
Table 5.7-1. Detection of rainbow trout tagged in three sections of the Klamath River during each week (1-30) of the study period. Detection of fish during each survey week of the study period (i.e., 1, 2, 3, etc.) areshaded gray. Black indicates that the tag was recovered; yellow indicates that the tag that could not berecovered. Low detection rates in June (weeks 18 and 21) were the result of limited surveys.
February March April May June July AugustStudyArea Fish 1 2 3 4 5 6 7 8 9 10 11 12 13 14 15 16 17 18 19 20 21 22 23 24 25 26 27 28 29 30
01023031323435364041424344
Low
er P
eaki
ng R
each
4505060809101112131617182324
Upp
er P
eaki
ng R
each
29

PacifiCorpKlamath Hydroelectric Project
FERC Project No. 2082
© February 2004 PacifiCorp Fish Resources FTR Page 5-21Fish Resources FTR.doc
Table 5.7-1. Detection of rainbow trout tagged in three sections of the Klamath River during each week (1-30) of the study period. Detection of fish during each survey week of the study period (i.e., 1, 2, 3, etc.) areshaded gray. Black indicates that the tag was recovered; yellow indicates that the tag that could not berecovered. Low detection rates in June (weeks 18 and 21) were the result of limited surveys.
February March April May June July AugustStudyArea Fish 1 2 3 4 5 6 7 8 9 10 11 12 13 14 15 16 17 18 19 20 21 22 23 24 25 26 27 28 29 30
03041415192021222627283337
J.C
. Boy
le B
ypas
s Rea
ch
39Available 17 40 42 42 42 42 42 42 42 42 42 42 42 42 42 42 42 42 42 42 42 42 39 37 36 36 35 35 35Detected 17 36 42 42 41 39 40 41 41 41 40 39 39 38 37 37 23 37 37 22 36 35 31 27 27 21 15 7 6Percent 100 90 100100 98 93 95 98 98 98 95 93 93 90 88 88 55 88 88 52 86 83 79 73 75 58 43 20 17
Seven tagged fish could not be detected in the study area, suggesting that the fish either weremoved or transported out of the study area, or the tags failed. These fish disappeared during a 4-month period (two [Tag No. 30 and 31] in April, three [Tag No. 04, 09, and 32] in May, and two[Tag No. 05 and 23] in June) (Figure 5.7-1). Three of the fish (Tag No. 30, 31, and 32) movedinto Shovel Creek and one (Tag No. 05) was at the confluence when last detected. The otherthree fish (Tag No. 04, 09, and 23) were last detected in the upper peaking reach. The missingfish were not located despite several surveys of Copco reservoir (including one boat survey),Copco bypass, and J.C. Boyle reservoir, and a survey of the inaccessible area of the KlamathRiver.
Identifying the fate of individual fish provides a more complete picture of the life history ofrainbow trout in the Klamath River. Several researchers have noted that predation, angling, andshed tags are the suspected causes of tag loss (Elle, 1995; Swanberg, 1997; Chandler et al. 2001).Moreover, recent telemetry research on bull trout and rainbow trout suggests that mortality maybe fairly high on spawning fish (Schill et al. 1994; Hockersmith et al. 1995; Elle, 1998). In thisstudy, 38 percent (five of 13) of the fish that entered Shovel Creek (five tags recovered) aresuspected to have died. Clearly, tags found on the bank above the wetted channel (some with bitemarks) suggest some method of transport either from scavenging or predation. The inclusion ofother tags found and signals that originated from suspect areas (nesting areas or hillsides)suggests that mortality may have been about 21 percent (nine of 42) for all radio-tagged fish.Although signs were posted along fishing access points in the study area requesting anglers torelease tagged fish, it is possible that some fish were caught and removed. This is particularlytrue for fish that remained undetected during the study period.

PacifiCorpKlamath Hydroelectric ProjectFERC Project No. 2082
Fish Resources FTR Page 5-22 © February 2004 PacifiCorpFish Resources FTR.doc
5.7.2 Length-Weight
FL and weight (grams) of fish tagged in the Klamath River (Table 5.7-2) were measured. No fishwere tagged that exceeded the 5 percent tag weight to body weight ratio and only one fishexceeded 2 percent. Rainbow trout size tended to increase downstream based on the averagelength and weight of fish captured in the three reaches. The largest fish radio-tagged werecaptured in the lower peaking reach near Shovel Creek (Table 5.7-2). Conversely, the smallesttrout radio-tagged were captured in the J.C. Boyle bypass reach. As a group, radio-taggedrainbow trout varied in length from 250 to 429 mm FL with a mean of 315.5 mm (Figure 5.7-2).Weight varied from 175 to 880 grams with a mean of 384.5 grams (Figure 5.7-2). The length-weight relationship is described by the power function W= 0.000012*L2.99 (Figure 5.7-2). Thislength-weight relationship is similar to that reported in Beyer (1984) for upstream migrants inShovel Creek (W=0.000005*L3.13).
Table 5.7-2. Summary information collected on rainbow trout radio-tagged in different reaches of theKlamath River.
Reach Tag ID Tag Site (RM) Date Fork Length (mm1) Weight (g2)01 206.4 7-Feb-03 298 32002 206.4 7-Feb-03 348 51030 206.4 10-Feb-03 405 88031 206.9 9-Feb-03 367 54032 206.9 9-Feb-03 398 72034 205.3 9-Feb-03 376 70035 208.0 8-Feb-03 375 60036 205.3 9-Feb-03 378 63040 208.0 8-Feb-03 393 68041 208.9 8-Feb-03 347 46042 206.4 7-Feb-03 334 44543 206.4 7-Feb-03 321 38044 208.9 8-Feb-03 353 46045 206.4 7-Feb-03 429 860
Min 298 320Max 429 880
Lower Peaking
Mean 361 56305 217.3 5-Feb-03 302 29506 220.1 5-Feb-03 313 38008 217.3 4-Feb-03 293 24009 217.3 4-Feb-03 291 27010 217.3 4-Feb-03 300 30011 217.3 4-Feb-03 328 33012 217.3 4-Feb-03 287 26013 217.3 4-Feb-03 283 25516 217.3 4-Feb-03 356 45017 217.3 4-Feb-03 342 43518 217.3 4-Feb-03 320 31523 220.1 3-Feb-03 277 25024 220.1 3-Feb-03 250 17529 215.7 20-Feb-03 276 225
Min 250 175Max 356 450
Upper Peaking
Mean 303 304

PacifiCorpKlamath Hydroelectric Project
FERC Project No. 2082
© February 2004 PacifiCorp Fish Resources FTR Page 5-23Fish Resources FTR.doc
Table 5.7-2. Summary information collected on rainbow trout radio-tagged in different reaches of theKlamath River.
Reach Tag ID Tag Site (RM) Date Fork Length (mm1) Weight (g2)03 220.9 6-Feb-03 263 20004 220.9 6-Feb-03 276 24014 221.3 18-Feb-03 265 24015 221.3 18-Feb-03 302 36019 224.3 4-Feb-03 271 2263
20 221.4 19-Feb-03 265 20521 220.8 21-Feb-03 274 23022 224.3 4-Feb-03 307 3273
26 223.4 13-Feb-03 303 30027 222.2 18-Feb-03 268 22028 221.1 19-Feb-03 254 20033 223.4 13-Feb-03 312 31537 223.4 13-Feb-03 287 28039 221.7 18-Feb-03 266 230
Min 254 200Max 312 360
J.C. Boyle Bypass
Mean 281 2541 mm = Millimeter.2 g = Grams.3 Weight was estimated on the basis of the length-weight relationship.

PacifiCorpKlamath Hydroelectric ProjectFERC Project No. 2082
Fish Resources FTR Page 5-24 © February 2004 PacifiCorpFish Resources FTR.doc
0
1
2
3
4
5
6
7
8
9
10
240 260 280 300 320 340 360 380 400 420 440
Fork Length (mm)
Num
ber
Mean=315.5Min=250Max=429
0
1
2
3
4
5
6
7
8
9
10
150 250 350 450 550 650 750 850 950
Weight (g)
Num
ber
Mean=384.5Min=175Max=880
(2003) y = 0.000012x2.99
(1984) y = 0.000005x3.133
0
200
400
600
800
1000
0 100 200 300 400 500
FKL Length (mm)
Wei
ght (
g)
Figure 5.7-2. Length and weight distribution and relationship observed for rainbow trout radio-tagged in theKlamath River, 2003. The red line in the bottom plot represents the length-weight trend for upstream migrantscaptured in lower Shovel Creek, 1984 (Beyer, 1984).
5.7.3 Migration and Movement
To assess movement patterns of rainbow trout, the observed movement for each week of thestudy period for fish tagged in the J.C. Boyle bypass reach, upper peaking reach, and lowerpeaking reach of the Klamath River was estimated. The observed movement was calculated as

PacifiCorpKlamath Hydroelectric Project
FERC Project No. 2082
© February 2004 PacifiCorp Fish Resources FTR Page 5-25Fish Resources FTR.doc
the distance fish traveled during each week of the study period. The estimate provided a meansto compare both individual and group movements in the different reaches. The estimates helpdescribe periods of movement, home range, and the extent of movement (mobility) for eachgroup of fish tagged (Table 5.7-3).
Table 5.7-3. Number of fish and total movement observed during each week of study period for fish taggedin the J.C. Boyle bypass reach, and the upper and lower peaking reaches of the Klamath River, 2003.
J.C. Boyle Bypass Upper Peaking Reach Lower Peaking Reach
Month WeekTotal
(miles)Number
(fish) Mean*Total
(miles)Number
(fish) Mean*Total
(miles)Number
(fish) Mean*February 1 0.0 0 0.00 0.0 0 0.00 0.0 0 0.00
2 0.0 0 0.00 0.0 0 0.00 0.0 0 0.003 1.6 1 0.12 4.0 2 0.36 0.0 0 0.004 0.8 1 0.06 0.7 5 0.05 2.4 2 0.17
March 5 0.3 2 0.02 5.2 4 0.37 2.7 5 0.196 17.1 9 1.22 9.4 3 0.67 2.9 6 0.227 2.1 7 0.16 20.9 14 1.61 6.8 9 0.528 11.4 7 0.81 2.8 6 0.22 1.7 5 0.13
April 9 4.8 4 0.34 9.7 6 0.69 7.0 9 0.5410 3.7 5 0.26 2.2 4 0.16 5.8 5 0.4511 2.8 4 0.20 0.5 3 0.04 6.0 8 0.4612 1.2 2 0.09 0.8 2 0.06 6.7 6 0.5613 12.1 9 0.86 4.5 3 0.35 8.1 8 0.74
May 14 7.1 6 0.51 2.0 6 0.15 4.1 8 0.3415 1.2 4 0.09 20.5 5 1.58 1.4 4 0.1216 5.4 10 0.42 9.5 8 0.73 2.4 5 0.2217 3.5 5 0.27 6.0 4 0.46 0.2 2 0.02
June 18 1.5 7 0.12 0.0 0 0.00 0.0 0 0.0019 0.9 6 0.07 2.3 2 0.18 0.2 2 0.0220 4.5 4 0.35 4.5 2 0.35 0.4 3 0.0421 4.4 5 0.73 2.0 1 0.40 0.1 1 0.01
July 22 1.9 7 0.15 2.7 1 0.22 30.3 3 2.7523 0.7 3 0.05 0.1 1 0.01 0.2 1 0.0224 9.4 7 0.72 3.2 2 0.36 0.0 0 0.0025 6.3 5 0.48 1.3 2 0.14 0.1 1 0.02
August 26 7.0 9 0.54 7.0 4 0.78 8.8 4 1.7627 6.3 3 0.57 4.2 2 0.52 0.0 0 0.0028 0.2 2 0.02 4.2 2 0.70 0.0 0 0.0029 0.1 1 0.02 0.1 1 0.03 0.0 0 0.0030 0.1 1 0.02 1.4 1 0.70 0.0 0 0.00
Total 118.4 136 0.34 131.7 96 0.41 98.3 97 0.37* Mean movement is calculated as the quotient of total miles divided by the number of fish detected in each
reach.
Periods of Movement
The average distance fish traveled during each week of the study period was similar for fishtagged in the three reaches. The average distance the fish traveled varied during the study periodbut was typically less than one mile. Fish tagged in the J.C. Boyle bypass reach and upperpeaking reach displayed two peak movements during the spring (Table 5.7-3; Figure 5.7-2). Inthe lower peaking reach, movements were more evenly distributed over the spring spawning and

PacifiCorpKlamath Hydroelectric ProjectFERC Project No. 2082
Fish Resources FTR Page 5-26 © February 2004 PacifiCorpFish Resources FTR.doc
migration period. Fish tagged in the upper peaking reach had the greatest total movement duringthe entire study period followed by fish tagged in the J.C. Boyle bypass reach and lower peakingreach (Table 5.7-3).
Movement continued throughout the summer months and the pattern was similar for fish taggedin the J.C. Boyle bypass reach and upper peaking reach (Figure 5.7-3). However, in the lowerpeaking reach fish appeared to maintain their locations until the beginning of July and Augustwhen a few individuals made relatively large movements (Figure 5.7-3).
In general there were more fish actively moving in the spring than during the summer and itappears from the average distance traveled in each reach that both spring spawning and summerrearing habitat may have been available in a fairly compact area (Table 5.7-3).
Home Range and Mobility
To define the home range and mobility of fish, the position of each fish was plotted and then theamount of movement was estimated by calculating changes in location for each fish during eachweek of the study period. Typically, the home range of an organism is defined as the area that anorganism travels during a year (Smith and Smith, 2001). In this study, rainbow trout weretracked less than 1 year (7 months) during late winter, spring, and summer conditions. Theseseasonal conditions may be adequate to describe their general home range and mobility if it isassumed that adult fish do not make substantial movements during the remainder of the year.
The variation in home range in each reach of the study areas was similar, although fish in thelower peaking reach were generally the smallest (Table 5.7-4). The average home range for fishtagged in the upper peaking reach was 6.4 miles followed by 5.9 miles and 4.2 miles in the J.C.Boyle bypass reach and lower peaking reach, respectively (Table 5.7-4). In general, most fish inthe study area tended to travel less than 10 miles from late winter to summer. However, in eachof the three reaches, there were individual fish that displayed small home ranges (less than1.0 mile) while others ranged much farther (more than 10.0 miles).

PacifiCorpKlamath Hydroelectric Project
FERC Project No. 2082
© February 2004 PacifiCorp Fish Resources FTR Page 5-27Fish Resources FTR.doc
J.C. Boyle Bypass Reach
0.0
0.5
1.0
1.5
2.0
2.5
3.0
1 2 3 4 5 6 7 8 9 10 11 12 13 14 15 16 17 18 19 20 21 22 23 24 25 26 27 28 29 30
Week and Month | February | March | April | May | June | July | August |
Ave
rage
Mov
emen
t (m
iles)
Upper Peaking Reach
0.0
0.5
1.0
1.5
2.0
2.5
3.0
1 2 3 4 5 6 7 8 9 10 11 12 13 14 15 16 17 18 19 20 21 22 23 24 25 26 27 28 29 30
Week and Month | February | March | April | May | June | July | August |
Ave
rage
Mov
emen
t (m
iles)
Lower Peaking Reach
0.0
0.5
1.0
1.5
2.0
2.5
3.0
1 2 3 4 5 6 7 8 9 10 11 12 13 14 15 16 17 18 19 20 21 22 23 24 25 26 27 28 29 30
Week and Month | February | March | April | May | June | July | August |
Ave
rage
Mov
emen
t (m
iles)
Figure 5.7-3. Average trout movement observed for each week (1-30) of the study period for fish tagged in the J.C.Boyle bypass reach, and the upper and lower peaking reaches of the Klamath River, 2003.

PacifiCorpKlamath Hydroelectric ProjectFERC Project No. 2082
Fish Resources FTR Page 5-28 © February 2004 PacifiCorpFish Resources FTR.doc
The extent of movement (mobility) observed within a given home range varied. For someindividuals, the home range and amount of movement observed were identical (Table 5.7-4).This limited movement within the home range occurred in four of 11 fish in the J.C. Boylebypass reach and was less noticeable in the upper and lower peaking reaches of the KlamathRiver. In those latter reaches, fish generally displayed more total movement within their homerange (Table 5.7-4).
Most fish moved downstream after they were tagged (Figure 5.7-4). This trend is most noticeablein the J.C. Boyle bypass reach and upper peaking reach of the Klamath River (Figure 5.7-4).Nine fish in the J.C. Boyle bypass reach moved downstream to occupy stations in the upperpeaking reach while only four fish moved upstream from the upper peaking reach into the J.C.Boyle bypass reach (Figure 5.7-4). Only one fish (Tag No. 34) from the lower peaking reachmoved upstream into the upper peaking reach. No fish from the lower peaking reach entered theJ.C. Boyle bypass reach and only one fish (Tag No. 20) from the J.C. Boyle bypass moveddownstream into the lower peaking reach (Figure 5.7-4). Most of the movement in the lowerpeaking reach was at the confluence with Shovel Creek. This is not unexpected considering that11 of 14 fish tagged in this reach migrated into Shovel Creek.
Table 5.7-4. Home range and total movement observed for fish tagged in the J.C. Boyle bypass, and theupper and lower peaking reaches of the Klamath River, 2003.
J.C. Boyle Bypass Upper Peaking Reach Lower Peaking Reach
Fish ID
HomeRange(miles)
TotalMovement
(miles) Fish ID
HomeRange(miles)
TotalMovement
(miles) Fish ID
HomeRange(miles)
TotalMovement
(miles)03 4.0 4.0 05 10.5 10.7 01 0.8 2.404 7.3 7.3 06 1.1 1.6 02 0.4 0.714 2.4 3.2 08 9.6 9.8 30 0.7 0.815 4.5 4.6 09 4.3 5.7 31 2.6 3.619 10.9 18.0 10 7.6 8.2 32 7.4 10.120 18.1 18.7 11 5.9 5.9 34 15.8 35.421 4.0 10.1 12 2.8 16.0 35 1.7 2.022 2.6 3.9 13 3.5 8.3 36 2.6 2.626 1.6 2.8 16 18.9 19.5 40 4.8 11.427 2.2 6.5 17 0.3 0.7 41 4.1 8.028 1.2 1.2 18 3.6 9.7 42 9.1 9.933 11.1 11.1 23 3.7 8.8 43 0.1 0.237 12.5 24.3 24 16.1 22.0 44 6.1 7.439 0.5 2.7 29 1.7 4.8 45 1.9 3.8
Min 0.5 1.2 Min 0.3 0.7 Min 0.1 0.2Max 18.1 24.3 Max 18.9 22.0 Max 15.8 35.4
Mean 5.9 8.5 Mean 6.4 9.4 Mean 4.2 7.0

PacifiCorpKlamath Hydroelectric Project
FERC Project No. 2082
© February 2004 PacifiCorp Fish Resources FTR Page 5-29Fish Resources FTR.doc
J. C. Boyle Bypass Reach
190 200 210 220 230
Fish
ID3937332827262221201915140403
Upper Peaking Reach
190 200 210 220 230
Fish
ID
29242318171613121110090806
Lower Peaking Reach
Shovel Ck. P.H.
J.C. Boyle DamCopco Dam
Spencer Ck.
190 200 210 220 230Rivermile
Fish
ID
4544434241403635343231300201
Figure 5.7-4. Home range and direction of movement observed for fish tagged in the J.C. Boyle bypass reach, andthe upper and lower peaking reaches of the Klamath River, 2003. Large open circles represent tag site locations.Small dark circles represent the locations where fish were detected in the Klamath River.

PacifiCorpKlamath Hydroelectric ProjectFERC Project No. 2082
Fish Resources FTR Page 5-30 © February 2004 PacifiCorpFish Resources FTR.doc
5.7.3.1 Spawning
J.C. Boyle Bypass Reach
A spawning survey was conducted in a section of the J.C. Boyle bypass reach downstream fromthe canal spillway on April 30, 2003. The survey was conducted in a downstream manner usingsnorkel and bank observation. Redd locations were identified with the GPS and only onewaypoint was recorded if there were numerous redds in a common area. The number and size ofrainbow trout observed in the vicinity were noted. There were 56 redds in the area surveyed (RM221.2 to 222.5) (Table 5.7-5). This is probably a minimum estimate of the total number of reddsbecause poor visibility limited observations to the stream margin. Extensive spawning wasobserved in the area just downstream of the spillway (Figure 5.7-5). The number of reddsdiminished downstream until RM 221.9. During the survey, one tagged fish (Tag No. 6) wasobserved at the lower end of the spawning area. Mobile surveys in this area revealed that 12 of14 fish tagged in the J.C. Boyle bypass reach had visited this area and two of 14 fish tagged inthe upper peaking reach also visited this area.
Table 5.7-5. Number and size of rainbow trout observed near redds counted in the bypass section of theKlamath River.
Size Range and Count(inches) Number
River Mile < 5 5-7 8-10 > 10 Redds
222.5 2 2 3 21222.5 2 3 3 5222.4 9222.4 1 2 2 1 3222.3 1222.3 1222.2 1222.1 2 1221.9 2 8 8 3 13221.2 1 1 1
Totals 7 18 10 11 56

PacifiCorpKlamath Hydroelectric Project
FERC Project No. 2082
© February 2004 PacifiCorp Fish Resources FTR Page 5-31Fish Resources FTR.doc
Figure 5.7-5. Location and number of rainbow trout redds observed in the J.C. Boyle bypass reach of the KlamathRiver, 2003.

PacifiCorpKlamath Hydroelectric ProjectFERC Project No. 2082
Fish Resources FTR Page 5-32 © February 2004 PacifiCorpFish Resources FTR.doc
Tributaries
One-third (14 of 42) of the radio-tagged fish migrated to Spencer and Shovel creeks. One fishfrom the J.C. bypass reach migrated to Spencer Creek during the first week of April and 13 fishmigrated into Shovel Creek from March to May. Eleven of the fish that migrated into ShovelCreek were tagged in the lower peaking reach and the other two were tagged in the upperpeaking reach. Most of the fish (12 of 13) in Shovel Creek entered the tributary from thebeginning of March to mid-April. The last fish entered Shovel Creek at the end of May.Tributary residence ranged from 1 to 6 weeks in Shovel Creek, with most fish exiting betweenmid-April to first week of June. Residence in Spencer Creek was about 4 weeks with the fishexiting near the end of April. The one fish that entered Spencer Creek was detected justdownstream of Clover Creek (RM 3.5), and between RM 0.9 and RM 1.2. In Shovel Creek, mostof the fish were detected in the lower 1.5 miles of the stream. A spawning ground survey inShovel Creek conducted on April 22, 2003, revealed 43 redds in the index area (RM 0.6 to 0.9).Spawning activity appeared to be past its peak because redds were beginning to fade and fishnumbers had diminished.
Post-spawning movement revealed that most of the fish (seven of 13) that entered Shovel Creekselected new locations downstream in the Klamath River or Copco reservoir when they were lastdetected. Two fish moved upstream after leaving Shovel Creek, but then moved backdownstream past Shovel Creek. The tags for three fish were recovered in Shovel Creek and onefish was last detected in Shovel Creek before it disappeared. The fish that entered Spencer Creekmoved back downstream through J.C. Boyle reservoir, passed through the powerhouse, andestablished a new residence in the upper peaking reach of the Klamath River.
Klamath River
In addition to spawning areas observed in tributaries and the J.C. Boyle bypass reach, semi-permanent stations in the Klamath River were plotted to help define potential adult rainbow troutspawning and rearing areas (Figure 5.7-6). The plot depicts areas of the Klamath River where atleast one fish was detected on at least two consecutive surveys during the spring (March throughMay). Fish positions recorded in late February were eliminated to allow fish at least 1 week ofrecovery and redistribution from their tag site locations. The areas were further refined byeliminating fish (14 of 42) that entered Shovel or Spencer creeks, presumably to spawn.
The plot shows two major fish areas in the lower J.C. Boyle bypass reach, one as a knownspawning location. In the peaking reach of the Klamath River, there were numerous semi-permanent adult stations, but most were concentrated in the upper peaking reach. Undoubtedly,many of these areas were simply adult holding or rearing areas. However, these areas mayprovide a template for future research if conditions in the mainstem become favorable enough toconduct snorkel surveys.

PacifiCorpKlamath Hydroelectric Project
FERC Project No. 2082
© February 2004 PacifiCorp Fish Resources FTR Page 5-33Fish Resources FTR.doc
Figure 5.7-6. Semi-permanent stations occupied by radio-tagged rainbow trout from March to June in the KlamathRiver, 2003.

PacifiCorpKlamath Hydroelectric ProjectFERC Project No. 2082
Fish Resources FTR Page 5-34 © February 2004 PacifiCorpFish Resources FTR.doc
5.7.3.2 Passage Areas
J.C. Boyle Fish Ladder
Fish passage at J.C. Boyle dam was monitored from February to mid-May 2003. During thattime, only one of 42 (2.3 percent) radio-tagged fish in the Klamath River approached orascended the fish ladder. The fish (Tag No. 37) was tagged in the J.C. Boyle bypass reach (RM223.4) on February 13 and remained near the tag site for about 1 month. Later, on March 10, thefish was detected upstream (RM 224.3) during a mobile survey, about 0.3 mile downstream ofthe fish ladder. The fish returned downstream to the tag site by March 17, but subsequentlymoved back upstream again and was detected near its former upstream site on March 26. Thefish moved upstream to the fish ladder on March 29 and was detected on the approach antennafor 1.3 hours (Table 5.7-6). On March 29, the fish also was detected sporadically at the entranceof the fish ladder. Three days later, on April 1, the fish again was detected near the fish ladder forabout 0.5 hour, but did not enter. The fish passed the Project on April 2, ascending the ladder(entrance antenna to exit antenna) in about 3.5 hours. This equates to about 3.7 minutes per pooland weir to ascend the fish ladder.
Table 5.7-6. Detection history for a single fish (Tag No. 37) that approached, entered, and passed at J.C.Boyle fish ladder.
Antenna Detections Time Intervals (hours)
Approach Entrance Exit
Date First Last First Last First LastApproach
OnlyApproach
to EntranceEntrance
to Exit3/29/03 1:37 p.m. 2:55 p.m. 1:41 p.m. 2:54 p.m. --- --- 1.30 0.07 ---4/1/03 5:34 a.m. 6:02 a.m. --- --- --- --- 0.47 --- ---4/2/03 2:56 a.m. 3:04 a.m. 3:10 a.m. 3:51 a.m. 6:16 a.m. 6:35 a.m. 0.13 0.23 3.5
It is not clear if the movement and passage of this fish (Tag No. 37) was related to spill. TheProject began spilling in the J.C. Boyle bypass reach on March 27 (4 p.m.) and continued forapproximately 43 hours until it was down-ramped on March 29 (10 a.m.) (Figure 5.7-7).Approximately 3.5 hours later, on March 29, the fish was detected at the fish ladder near theentrance (Table 5.7-6; Figure 5.7-7). However, the fish did not pass until 3.5 days later onApril 2. After ascending the ladder, the fish migrated upstream through J.C. Boyle reservoir andwas detected in Spencer Creek.
PacifiCorpKlamath Hydroelectric Project
FERC Project No. 2082
© February 2004 PacifiCorp Fish Resources FTR Page 5-35Fish Resources FTR.doc
0
200
400
600
800
1000
1200
3/27
1:0
0
3/27
13:
00
3/28
1:0
0
3/28
13:
00
3/29
1:0
0
3/29
13:
00
3/30
1:0
0
3/30
13:
00
3/31
1:0
0
3/31
13:
00
4/01
1:0
0
4/01
13:
00
4/02
1:0
0
4/02
13:
00
Date
Flow
(cfs
)
Boyle Bypass Flow
Time of Approach
Time of Passage
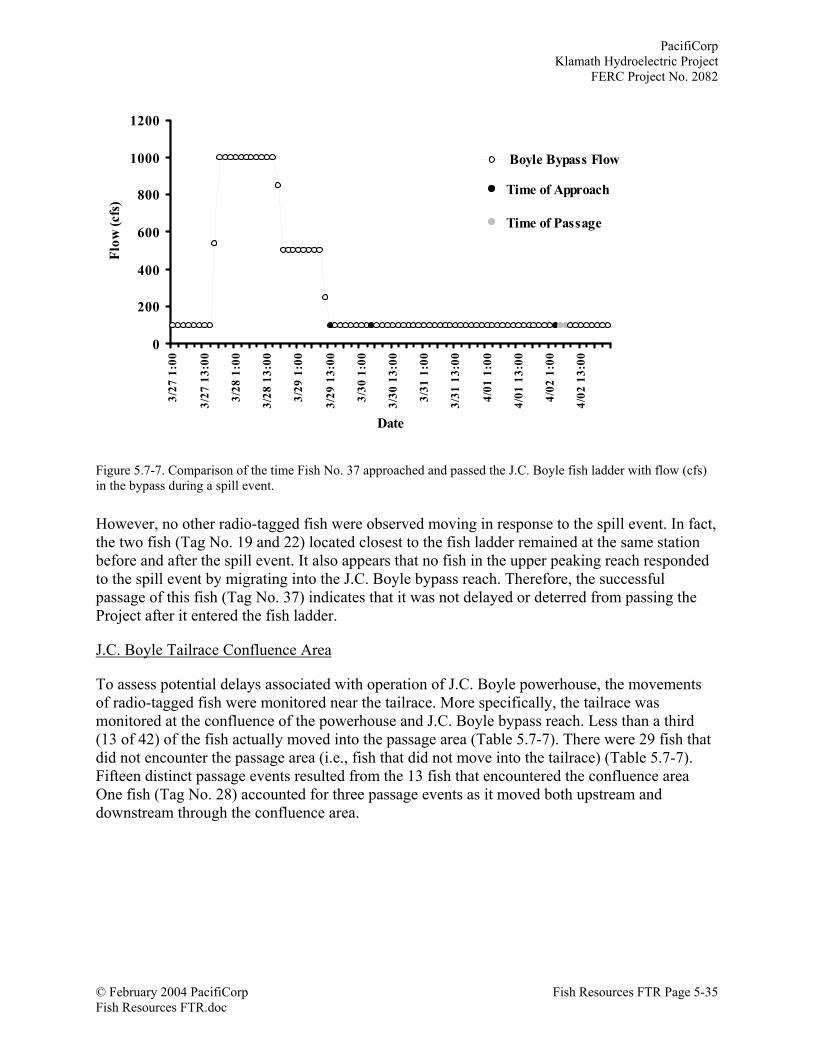
Figure 5.7-7. Comparison of the time Fish No. 37 approached and passed the J.C. Boyle fish ladder with flow (cfs)in the bypass during a spill event.
However, no other radio-tagged fish were observed moving in response to the spill event. In fact,the two fish (Tag No. 19 and 22) located closest to the fish ladder remained at the same stationbefore and after the spill event. It also appears that no fish in the upper peaking reach respondedto the spill event by migrating into the J.C. Boyle bypass reach. Therefore, the successfulpassage of this fish (Tag No. 37) indicates that it was not delayed or deterred from passing theProject after it entered the fish ladder.
J.C. Boyle Tailrace Confluence Area
To assess potential delays associated with operation of J.C. Boyle powerhouse, the movementsof radio-tagged fish were monitored near the tailrace. More specifically, the tailrace wasmonitored at the confluence of the powerhouse and J.C. Boyle bypass reach. Less than a third(13 of 42) of the fish actually moved into the passage area (Table 5.7-7). There were 29 fish thatdid not encounter the passage area (i.e., fish that did not move into the tailrace) (Table 5.7-7).Fifteen distinct passage events resulted from the 13 fish that encountered the confluence areaOne fish (Tag No. 28) accounted for three passage events as it moved both upstream anddownstream through the confluence area.

PacifiCorpKlamath Hydroelectric ProjectFERC Project No. 2082
Fish Resources FTR Page 5-36 © February 2004 PacifiCorpFish Resources FTR.doc
Table 5.7-7. Information on rainbow trout that were detected in the tailrace confluence area of thepowerhouse and J.C. Boyle bypass channels.
Passage DelayNumberTagged
EncounteredPassage Area
Direction ofMovement Fish ID
SystemOperation(Yes or No)
SuccessfulPassage
(Yes or No) Date Hours Yes No ?06 Yes Yes Mar-12 0.47 X13 Yes Yes May-03 212.86 X10 NA Yes May-19 NA X18 Yes Yes Apr-29 24.37 X
Upstream(5)
28 Yes Yes Apr-29 3.08 X04 Yes Yes Feb-09 2.88 X14 No Yes Mar-06 0.05 X15 Yes Yes Apr-28 0.07 X19 NA Yes Jul-16 NA X20 Yes Yes Mar-11 1.75 X21 Yes Yes Feb-25 0.43 X28 Yes Yes Feb-23 0.63 X28 Yes Yes May-01 0.07 X33 Yes Yes Mar-12 0.01 X
Yes 13(31%)
Downstream(9)
37 Yes Yes Apr-30 17.23 X
42
No 29(69%) No Delay
NA (Not Available)—Specific information on the passage time and conditions are not available for these fishbecause they moved through the area after the fixed-station receiver was taken down (mid-May). Passagedates reflect the first survey date that fish were detected either upstream or downstream from the confluenceof the powerhouse and J.C. Boyle bypass reach.
Most of the fish (nine of 14) moved downstream through the J.C. Boyle tailrace (Table 5.7-7).Fish moved downstream through most of the spring migration period from the J.C. Boyle bypassreach into the upper peaking reach of the Klamath River. All downstream migrants successfullypassed through the tailrace area on their first attempt. Only one fish (Tag No. 14) moveddownstream through the tailrace when the J.C. Boyle powerhouse was not generating. Movementdownstream through the confluence area varied from 0.01 hour to 17.2 hours, with most passingthrough the confluence area in less than 3 hours. Fish No. 37 spent the longest time in theconfluence area of the bypass reach and powerhouse tailrace. However, Fish No. 37 already hadmigrated to Spencer Creek and returned to the confluence area through the penstock of thepowerhouse. As a point of comparison, the median passage time through the confluence area wasbrief (0.43 hour) compared to the spring spawning and migration period (84 days).3 Given thatall the fish moved through the tailrace confluence area successfully on their first attempt, and didso in a relatively short time, it appears that fish were not delayed or deterred as they moveddownstream.
There were five fish that moved upstream through the confluence of the powerhouse and J.C.Boyle bypass reach channels. Most of these fish passed through the confluence area in late Apriland May from the upper peaking reach into the bypass reach. A passage time for Fish No. 10 or
3 A median passage time of 0.43 hour through the confluence area compared to the spring spawning and migrationperiod (84 days or 2,016 hours) is relatively small. The passage time equates to about 0.02 percent of the total springspawning and migration period ((0.43 hour / 2,016 hours)*100) = 0.02 percent).

PacifiCorpKlamath Hydroelectric Project
FERC Project No. 2082
© February 2004 PacifiCorp Fish Resources FTR Page 5-37Fish Resources FTR.doc
19 could not be provided because they passed after the fixed station was removed. Most of theupstream migrants encountered the confluence area when the powerhouse was operating, andsuccessfully passed the area on their first attempt as they moved into the bypass reach. However,upstream movement through the tailrace confluence area varied considerably (0.5 hour to212.9 hours).
Fish No. 6, 18, and 28 appear to have spent a relatively short time in the tailrace confluence arearelative to the entire spring spawning and migration period (less than 2 percent). Fish No. 6 and18 also were detected near the spawning area in the J.C. Boyle bypass reach during mobilesurveys, and Fish No. 28 returned to the J.C. Boyle bypass reach only to move back downstreamagain to the upper peaking reach. This behavior suggests these fish were neither delayed nordeterred as they encountered the confluence area.
The late arrival of Fish No. 13 in the tailrace confluence area (May 3) and the fact that it spent aconsiderable time there seems to warrant further consideration. Fish No. 13 moved into thetailrace confluence area during an extended period of powerhouse generation (Figure 5.7-8).Approximately 24 hours after it was detected in the confluence area by the aerial antenna system,the fish had moved upstream close enough to be detected by the underwater antennas locatedwithin the J.C. Boyle bypass reach (see Figure 5.4-6). This observation was confirmed by mobilesurveys on May 5 and 7 that placed the fish in the lower J.C. Boyle bypass reach. Apparently, thefish had moved through the tailrace confluence area to the J.C. Boyle bypass reach where it wasdetected for 188 hours. The fish had entered the J.C. Boyle bypass reach, but did not continuefarther upstream. Mobile surveys during late spring and summer placed this fish backdownstream near similar locations before it had moved into the confluence area. For thesereasons, it is unknown whether this fish (Tag No. 13) was delayed or deterred by projectoperations at the J.C. Boyle powerhouse. The behavior suggests that the fish negotiated thetailrace within a day, but elected to remain close to the tailrace confluence area even though ithad successfully passed to enter the J.C. Boyle bypass reach.
The passage of Fish No. 10 and 19 could not be evaluated because they moved into the J.C.Boyle bypass reach after the spring spawning and migration period. Whether these fish (Tag No.10 and 19) were delayed at the Project remains unknown.

PacifiCorpKlamath Hydroelectric ProjectFERC Project No. 2082
Fish Resources FTR Page 5-38 © February 2004 PacifiCorpFish Resources FTR.doc
Fish 13Upstream PassageMay 3-12, 2003
0
500
1,000
1,500
2,000
2,500
3,000
3,500M
ay-0
3 0:
00
May
-04
0:00
May
-05
0:00
May
-06
0:00
May
-07
0:00
May
-08
0:00
May
-09
0:00
May
-10
0:00
May
-11
0:00
May
-12
0:00
May
-13
0:00
Date
Flow
(cfs
)
Flow (cfs)
Figure 5.7-8. Passage conditions (flow) at the confluence area of the powerhouse and J.C. Boyle bypass channels forFish No. 13. The yellow line overlaid on flow conditions indicates the period of time that Fish No. 13 resided in theevaluation area.
5.7.4 Power Peaking Observations
The effects of power peaking on movement of tagged fish were investigated to see if they wouldrespond to changes in flow by changing there longitudinal position within the stream. First, aseries of blind tests was used on two observers to determine their ability to accurately locate theposition of the fish along the streambank. The tests showed that the longitudinal position of a testtag could be determined within 10 feet of the true location in the stream channel.
Twelve observations were made on four fish and movement was detected on four occasions(Table 5.7-8). Fish moved from 10 to 210 feet in response to power peaking and for allobservations the fish remained within the same habitat unit; there were two observations of thefish moving downstream and two moving upstream. However, most of the observations notedthat fish did not change position in response to power peaking.
A similar study on the response of rainbow trout to peaking events was conducted in the CaneyFork River in Tennessee (Niemela, 1989). In that study, total distance and maximumdisplacement in response to power peaking were highly variable. The total distance fish movedranged from 0 to 1,869 feet (Niemela, 1989). Fish moved quickly to hydraulic refuges with theonset of generation and most often moved upstream or from one bank to the other to find refuge,often selecting the same refuge areas during subsequent generation cycles.

PacifiCorpKlamath Hydroelectric Project
FERC Project No. 2082
© February 2004 PacifiCorp Fish Resources FTR Page 5-39Fish Resources FTR.doc
Table 5.7-8. Changes in longitudinal position for radio-tagged rainbow trout during base and peak flows inthe peaking reach of the Klamath River, 2003.
Observations
Base Peak Results
Date Code Time Habitat Time Habitat DirectionDelta(feet)
7/24 1 11:30 Riffle 13:23 Riffle Upstream 50-607/30 12 9:30 Riffle 15:18 Riffle None 07/30 17 11:20 Riffle 15:00 Riffle None 08/1 12 6:50 Riffle 11:15 Riffle None 08/1 17 8:20 Riffle 10:30 Riffle None 08/12 1 9:15 Riffle 12:38 Riffle Upstream 408/13 12 6:55 Riffle 10:01 Riffle Downstream 10-158/21 1 11:15 Riffle 13:30 Riffle None 08/22 12 6:50 Riffle 9:50 Riffle None 08/25 12 6:50 Riffle 15:41 Riffle None 08/25 1 11:45 Riffle 13:35 Riffle None 09/3 14 7:00 Run 16:18 Run Downstream 210
5.7.5 Movement and Stream Temperature
To assess movement in relation to temperature, fish movement was plotted with the mean dailystream temperature (Appendix 5B). Spring movement into tributaries (Spencer and Shovelcreeks) in the study area generally occurred when stream temperatures were between 4 to 8°C. Insummer, there did not appear to be any directional movement that could be related to coolerstream temperatures being potentially available at the confluence of Shovel Creek anddownstream of the J.C. Boyle bypass reach. Moreover, most fish appeared to move downstream(Figure 5.7-4) in the peaking reach of the Klamath River where stream temperatures increased(Figure 5.4-4). However, Behnke (1992) noted that redband rainbow trout may possess thehereditary basis to function at high stream temperatures. In part, this may explain their widedistribution in streams of arid lands.
5.8 DISCUSSION
The purpose of this study was to investigate and document the movements of rainbow trout inthe J.C. Boyle Development area. The movement patterns of radio-tagged trout in the area areimportant in understanding how Project operations may aided fish movement through sensitivepassage areas at the powerhouse and the fish ladder at J.C. Boyle dam. In part, this wasaccomplished by mobile surveys and fixed-station telemetry sites.
The detection of radio-tagged fish during the study remained fairly high (greater than 80 percent)until mid-July. A few that remained undetected throughout most of the study and it wassuspected that some fish that had died. Other researchers have noted mortality and predationduring the spawning period (Elle, 1995; Swanberg, 1997; Chandler et al. 2001). For spawningbull trout, Schill et al. (1994) noted a relatively high mortality (67 percent) and Elle (1998)reported a lower range of mortalities (26 to 36 percent) for spawning adult bull trout. Forrainbow trout radio-tagged in the Yakima River, post-spawning mortality was 6 percent andmortality from predation was 4 percent (Hockersmith et al. 1995). In this study, 38 percent (five

PacifiCorpKlamath Hydroelectric ProjectFERC Project No. 2082
Fish Resources FTR Page 5-40 © February 2004 PacifiCorpFish Resources FTR.doc
of 13) of the fish that entered Shovel Creek (five tags recovered) are suspected to have died(predation and post-spawning mortality). The inclusion of other tags found and signalsoriginating from suspect areas suggest that mortality may have been about 21 percent (nine of42) for all radio-tagged fish. None of the mortalities that occurred during this study appears to berelated to J.C. Boyle operation.
One-third (14 of 42) of the radio-tagged fish migrated to Spencer and Shovel creeks. Themajority of those fish (13 of 14) entered Shovel Creek. Fish that entered Shovel Creek migratedfrom the upper peaking reach (two fish) and lower peaking reach (11 fish) from March to May.The fish that entered Spencer Creek was tagged in the J.C. Boyle bypass reach. Post-spawningbehavior revealed that most of the fish (seven of 13) that entered Shovel Creek selected newlocations downstream in the Klamath River or Copco reservoir. Two fish moved upstream afterleaving Shovel Creek, then moved back downstream past Shovel Creek. Three fish apparentlydied in Shovel Creek and one fish was last detected in Shovel Creek before it disappeared. Thefish that entered Spencer Creek moved back downstream through J.C. Boyle reservoir andpassed through the powerhouse to establish a new residence in the upper peaking reach of theKlamath River.
There were 56 redds counted in the lower section of the J.C. Boyle bypass reach near thepenstock forebay overflow. No spawning in this area had been observed before this study. Mostof the fish tagged in the J.C. Boyle bypass reach visited this area as well as two fish tagged in theupper peaking reach. A plot of semi-permanent stations occupied by tagged fish during thespring clearly defined this area. Several more areas were prominent in the upper peaking reach.Unfortunately, poor visibility in the peaking reach did not allow further investigation of thesepotential adult rearing and spawning areas.
Fish appeared to be actively moving throughout most of the spring spawning and migrationperiod. In summer, most fish tagged in the lower peaking reach remained in general areas, whilefish in the upper peaking reach and J.C. Boyle bypass tended to move more frequently. Thisgeneral trend seems to support the mean home range size observed for fish tagged in the threereaches. Fish in the upper peaking reach had a mean home range of 6.4 miles followed by5.9 miles in the J.C. Boyle peaking reach and 4.2 miles in the lower peaking reach. The meanhome range size of fish tagged in the peaking reaches does not appear to be much different thanfish tagged in the J.C. Boyle bypass reach.
Most fish moved downstream after they were tagged. More than half of the fish tagged (nine of14) in the J.C. Boyle bypass reach moved downstream during spring and summer to occupystations in the upper peaking reach. Four fish from the upper peaking reach moved upstream intothe J.C. Boyle bypass reach and another four fish moved downstream into the lower peakingreach. Only one fish from the lower peaking reach migrated upstream to the upper peaking reach.Movement during the spring in the lower peaking reach was centered near Shovel Creek, butmost fish returned downstream after the spring spawning and migration period.
The movement of fish in summer did not suggest that fish moved to locations to take advantageof potentially more suitable stream temperatures. If stream temperature prompted fishmovement, more fish would have been expected to move downstream to the confluence ofShovel Creek and into the J.C. Boyle bypass reach. Archival radio-tags that record stream

PacifiCorpKlamath Hydroelectric Project
FERC Project No. 2082
© February 2004 PacifiCorp Fish Resources FTR Page 5-41Fish Resources FTR.doc
temperature are better suited to determine if fish are selecting stream locations based ontemperature.
Movements in response to power peaking varied, were generally not extensive (10 to 210 feet),and usually occurred either upstream or downstream within the same habitat unit. From 12observations, only four movements were noted in response to power peaking. Niemela (1989)found that fish movement in response to power peaking was highly variable (range; 0 to1,869 feet).
There was no evidence of delay or deterrence of fish at the powerhouse or fish ladder. In fact,most fish appeared to move through the powerhouse tailrace area on the first attempt withoutdelay. The movement of fish (13 of 42) that passed the tailrace area was from fish tagged in theupper peaking reach (four fish) and J.C. Boyle bypass reach (nine fish). No fish tagged in thelower peaking reach migrated upstream to enter the J.C. Boyle bypass reach. The majority of thefish that encountered the confluence of the powerhouse and J.C. Boyle bypass reach typicallyspent less than 2 percent of the spring spawning and migration period passing the tailrace area.
Only one fish (tagged in the J.C. Boyle bypass reach) of the 42 radio-tagged fish in the Projectarea attempted and passed the fish ladder at J.C. Boyle dam. The successful passage of this fishafter it entered the fish ladder indicates that it was not delayed or deterred by the fish ladder atJ.C. Boyle dam. The lack of upstream movement toward the J.C. Boyle dam observed in thisstudy seems to support Olson’s (2002) explanation for the reduction in trout use of the fishladder. He suggested that rainbow trout probably have modified their movement behavior as anadaptive response to new conditions with the dam in place.