section 5 what do different assessments assess? the case...
TRANSCRIPT
Section 5
What Do Different Assessments Assess?
The Case of Fractions
“How do I understand thee? Let me count the ways.” Well, that’s not whatElizabeth Barrett Browning said, but if she were a mathematician, teacher, ormathematics educator referring to any topic in mathematics, she might have.And if she were an assessment specialist she might have notedthat there arecountless ways to explore and document those understandings.
This section provides two detailed explorations of one mathematics topic,fractions. Broadly speaking, it addresses two main issues:what does it mean tounderstand fractions (at, say, the sixth-grade level), andwhat is the potential ofvarious kinds of assessments to reveal those understandings?
Let us start with procedural fluency. Certainly, one expectssixth gradersto be fluent in adding, subtracting, multiplying, and dividing fractions. Theyshould be able to convert fractions to decimals, and place both fractions anddecimals on the number line; consequently, they should be able to compare themagnitudes of various fractions. They should have a sense ofmagnitude, andbe able to answer questions like: “Which of the numbers 0, 1, or 2 is the sum7
8C
12
13closest to?”
A next level of performance consists of being able use one’s knowledge offractions and be able to explain why what one has done makes sense. Hereare some items from theMathematics Framework for California Public Schools[California 2006, pp. 77–78]:
Your after-school program is on a hiking trip. You hike3
4of a mile and
stop to rest. Your friend hikes45
of a mile, then turns around and hikesback 1
8of a mile. Who is farther ahead on the trail? How much farther?
Explain how you solved the problem.
Jim was on a hiking trail and after walking34
of a mile, he found thathe was only5
8of the way to the end of the trail. How long is the trail?
Explain.
These are applications. One level deeper involves understanding what fractionsare and various representations of them. The following itemfrom theCaliforniaFramework [California 2006, p. 78] begins to explore this territory:

194
Draw a picture that illustrates each of the following problems and its solu-tion. Explain how your drawings illustrate the problems andthe solutions.
1:3
4�
1
22:
3
4C
1
23: 2 �
3
4
But this just scratches the surface. Does the student understand that all of then-ths in the fractionm=n must be the same size? (Recall the sample assessmentitem from Chapter 1.) That if the numerator of a fraction is kept constant andas the denominator increases, the magnitude of the fractiondecreases? Can thestudent work with representations of fractions on the number line? As parts of a“pie chart”? When the “whole” is, say, a pie and a half? Can thestudent explainwhy 2
3is equivalent to4
6, using any of these representations? Even this is just
a first step into the domain of fraction understanding: the literature on whatit means to understand fractions is immense. (A Google search on the phrase“understanding fractions” gives 22,000 hits.)
Once one has a sense of the terrain, there is the question of how one finds outwhat any particular student knows. This is enormously complex — and fascinat-ing, as the three contributions in this section demonstrate. In Chapter 14, LindaFisher shows the kinds of insights that well-crafted assessment tasks can provideinto student thinking. She presents a collection of tasks that have been used bythe Silicon Valley Mathematics Assessment Collaborative,and discusses theways in which student responses reveal what they understandand do not. Suchinformation is of use for helping teachers develop deeper understandings ofstudent learning, and (when one sees what students are or arenot making senseof) for refining curricula. In Chapter 15, Deborah Ball cranks up the microscopeone step further. No matter how good a paper-and-pencil assessment may be,it is static: the questions are pre-determined, and what yousee in the responsesis what you get. At the MSRI conference, Ball conducted an interview with astudent, asking him about his understandings of fractions.Like a written assess-ment, the interview started off with a script — but, when the student’s responseindicated something interesting about his understanding,Ball was in a positionto pursue it. As a result, she could delve more deeply into hisunderstanding thanone could with a test whose items were fixed in advance, and also get a broadand focused picture of how his knowledge fit together. In Chapter 16, AlanSchoenfeld reflects on what such interviews can reveal regarding the nature ofstudent understanding, and about the ways in which skilled interviewers canbring such information to light.
[California 2006] Mathematics framework for California public schools, kindergartenthrough grade twelve, Sacramento: California Department of Education, 2006.
Assessing Mathematical ProficiencyMSRI PublicationsVolume53, 2007
Chapter 14Learning About Fractions from Assessment
LINDA FISHER
Assessment can be a powerful tool for examining what students understandabout mathematics and how they think mathematically. It canreveal students’misconceptions and gaping holes in their learning. It can also reveal the strate-gies used by successful students. Student responses can raise questions forteachers: Of all the strategies that students are exposed to, which ones do theychoose to help make sense of a new situation? Which can they apply accu-rately? Which aspects of these strategies might be helpful for other students?Assessments can also, with guidance and reflection, provideteachers with adeeper understanding of the mathematical ideas and concepts that underlie therules and procedures frequently given in textbooks. A good assessment raisesquestions about changing or improving instruction. The diagnostic and curricu-lar information afforded by assessments can provide powerful tools for guidingand informing instruction.
Over the past seven years, the Mathematics Assessment Collaborative hasgiven formative and summative assessments to students and used their responsesin professional development for teachers and to inform instruction. This chapterwill share some examples of how assessment can reveal student thinking andraise issues for instructional planning and improvement.
Learning from Formative Assessment
A group of teachers engaged in lesson study1 was interested in the idea offocusing on students’ use of mathematical representations. The teachers hadlooked at lessons and representations from a variety of sources, including anintriguing lesson fromSingapore Primary Mathematics 3B which uses bar mod-els (diagrams which use rectangular “bars” to represent quantities in a problem),
1Lesson study is a process in which teachers jointly plan, observe, analyze, and refine classroom lessonswhich are known as “research lessons.” See http://www.lessonresearch.net/
195
196 LINDA FISHER
triangles, pentagons, hexagons, squares, and circles to represent part-whole rela-tionships. The middle part of that lesson tries to get students to see the followinggeneralization: when the numerators of a collection of fractions are the same,the size of the portion represented by each fraction is inversely related to thenumerical value of the denominator. The lesson study group at first considereddesigning its research lesson as an introduction to bar models. After lively de-bate, it opted to investigate what representations students would use to solvea problem for themselves without further instruction. The lesson study groupthen went into several classrooms to collect data about the representations thatstudents already used.
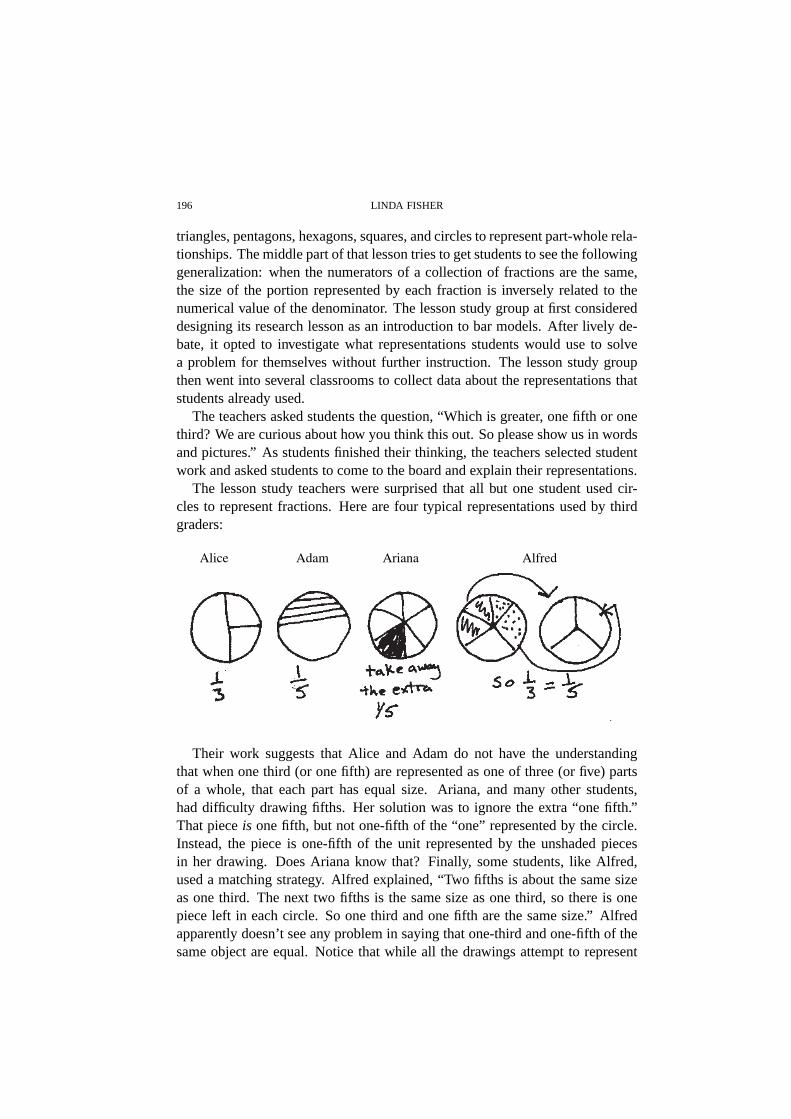
The teachers asked students the question, “Which is greater, one fifth or onethird? We are curious about how you think this out. So please show us in wordsand pictures.” As students finished their thinking, the teachers selected studentwork and asked students to come to the board and explain theirrepresentations.
The lesson study teachers were surprised that all but one student used cir-cles to represent fractions. Here are four typical representations used by thirdgraders:
Alice Adam Ariana Alfred
Their work suggests that Alice and Adam do not have the understandingthat when one third (or one fifth) are represented as one of three (or five) partsof a whole, that each part has equal size. Ariana, and many other students,had difficulty drawing fifths. Her solution was to ignore the extra “one fifth.”That pieceis one fifth, but not one-fifth of the “one” represented by the circle.Instead, the piece is one-fifth of the unit represented by theunshaded piecesin her drawing. Does Ariana know that? Finally, some students, like Alfred,used a matching strategy. Alfred explained, “Two fifths is about the same sizeas one third. The next two fifths is the same size as one third, so there is onepiece left in each circle. So one third and one fifth are the same size.” Alfredapparently doesn’t see any problem in saying that one-thirdand one-fifth of thesame object are equal. Notice that while all the drawings attempt to represent

14. LEARNING ABOUT FRACTIONS FROM ASSESSMENT 197
denominators, none of these third-grade students attempted to shade the part ofthe representation that corresponded to the “one” in one fifth and one third.
This type of assessment provides many insights for the classroom teacherabout the complexity of understanding fractions and what types of experiencesstudents need to make sense of the concepts that make up this understanding.It raises issues about the difference between identifying fractional parts in adiagram in a textbook and being able to make a representationof fractional partsaccurate enough to help in solving a particular problem. Thestudent work raisesmany pedagogical issues. How can teachers help students to develop the idea ofequal parts? How can teachers get students to understand theidea of a unit —that you can’t remove a piece of the object that represents the unit and have theremaining object represent the same unit? Is it appropriateto use odd denomina-tors at this grade level and have students struggle to draw equal pieces or shouldstudents only be given amounts that are convenient to draw? Do students learnenough from examples and explanations or is there a quantifiable benefit fromconfronting and discussing misconceptions? What is gainedand what is lost bythese approaches? These are the types of questions raised bygood assessments.Such assessments provide evidence of gaps in student understanding that are notrevealed through computational exercises. They provide windows into what ismissing when instruction focuses solely on procedures.
Looking at Summative Assessment: Sharing Pizza
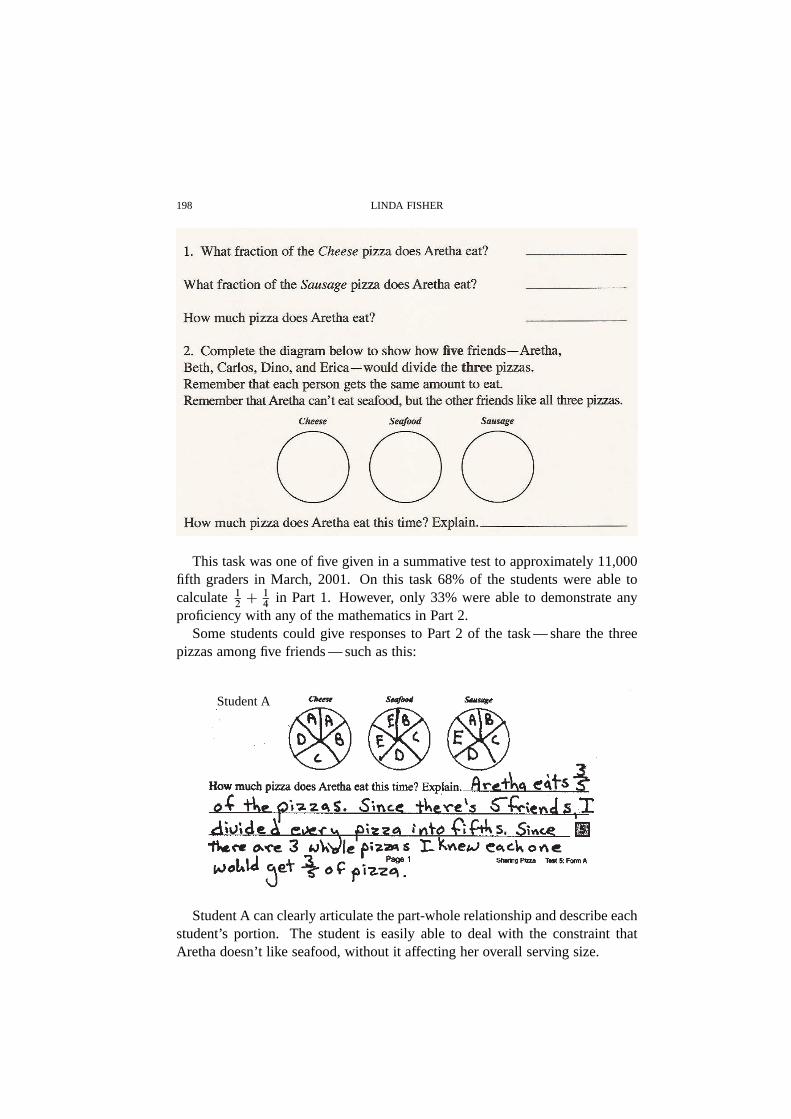
A common way to introduce fractions to students is in the context of sharing.Consider the grade 5 task Sharing Pizza. This task gives students the opportunityto identify fractional parts, combine common unlike fractions, draw representa-tions of fractions, and use fractions in a sharing context.
Sharing Pizza
198 LINDA FISHER
This task was one of five given in a summative test to approximately 11,000fifth graders in March, 2001. On this task 68% of the students were able tocalculate1
2C
1
4in Part 1. However, only 33% were able to demonstrate any
proficiency with any of the mathematics in Part 2.Some students could give responses to Part 2 of the task — share the three
pizzas among five friends — such as this:
Student A
Student A can clearly articulate the part-whole relationship and describe eachstudent’s portion. The student is easily able to deal with the constraint thatAretha doesn’t like seafood, without it affecting her overall serving size.
14. LEARNING ABOUT FRACTIONS FROM ASSESSMENT 199
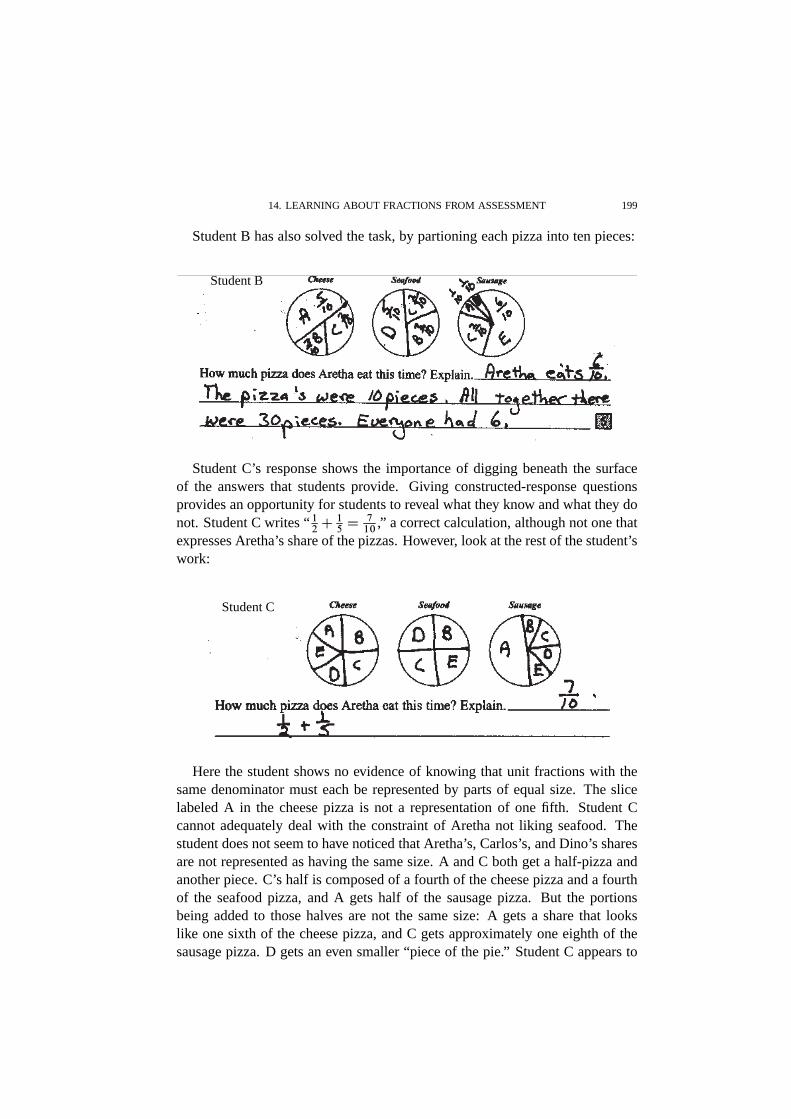
Student B has also solved the task, by partioning each pizza into ten pieces:
Student B
Student C’s response shows the importance of digging beneath the surfaceof the answers that students provide. Giving constructed-response questionsprovides an opportunity for students to reveal what they know and what they donot. Student C writes “1
2C
1
5D
7
10,” a correct calculation, although not one that
expresses Aretha’s share of the pizzas. However, look at therest of the student’swork:
Student C
Here the student shows no evidence of knowing that unit fractions with thesame denominator must each be represented by parts of equal size. The slicelabeled A in the cheese pizza is not a representation of one fifth. Student Ccannot adequately deal with the constraint of Aretha not liking seafood. Thestudent does not seem to have noticed that Aretha’s, Carlos’s, and Dino’s sharesare not represented as having the same size. A and C both get a half-pizza andanother piece. C’s half is composed of a fourth of the cheese pizza and a fourthof the seafood pizza, and A gets half of the sausage pizza. Butthe portionsbeing added to those halves are not the same size: A gets a share that lookslike one sixth of the cheese pizza, and C gets approximately one eighth of thesausage pizza. D gets an even smaller “piece of the pie.” Student C appears to
200 LINDA FISHER
be using ideas similar to those of the third graders, Alice and Adam: fractionsof the form 1/n are represented by any one ofn pieces of an object, but eachpiece is not necessarily of the same size. In this case, a correct computation maynot include an increased understanding of fractional partsand their underlyingrelationships.
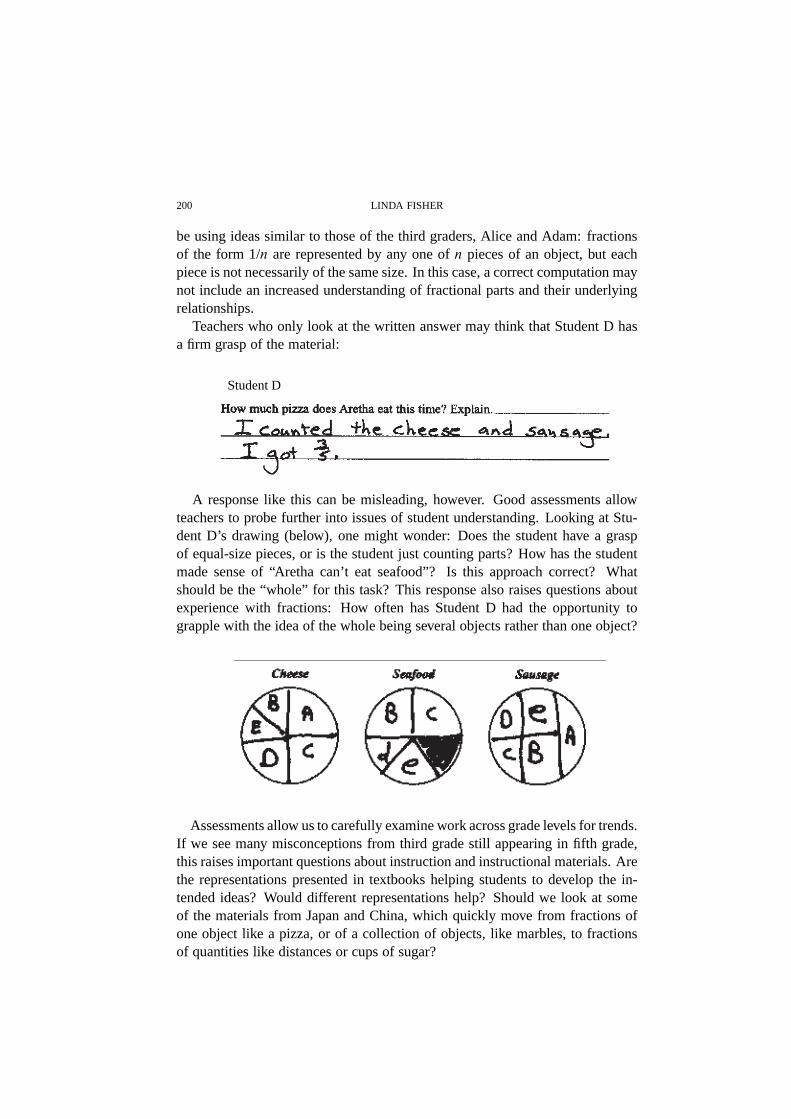
Teachers who only look at the written answer may think that Student D hasa firm grasp of the material:
Student D
A response like this can be misleading, however. Good assessments allowteachers to probe further into issues of student understanding. Looking at Stu-dent D’s drawing (below), one might wonder: Does the studenthave a graspof equal-size pieces, or is the student just counting parts?How has the studentmade sense of “Aretha can’t eat seafood”? Is this approach correct? Whatshould be the “whole” for this task? This response also raises questions aboutexperience with fractions: How often has Student D had the opportunity tograpple with the idea of the whole being several objects rather than one object?
Assessments allow us to carefully examine work across gradelevels for trends.If we see many misconceptions from third grade still appearing in fifth grade,this raises important questions about instruction and instructional materials. Arethe representations presented in textbooks helping students to develop the in-tended ideas? Would different representations help? Should we look at someof the materials from Japan and China, which quickly move from fractions ofone object like a pizza, or of a collection of objects, like marbles, to fractionsof quantities like distances or cups of sugar?
14. LEARNING ABOUT FRACTIONS FROM ASSESSMENT 201
Middle School Work with Fractions
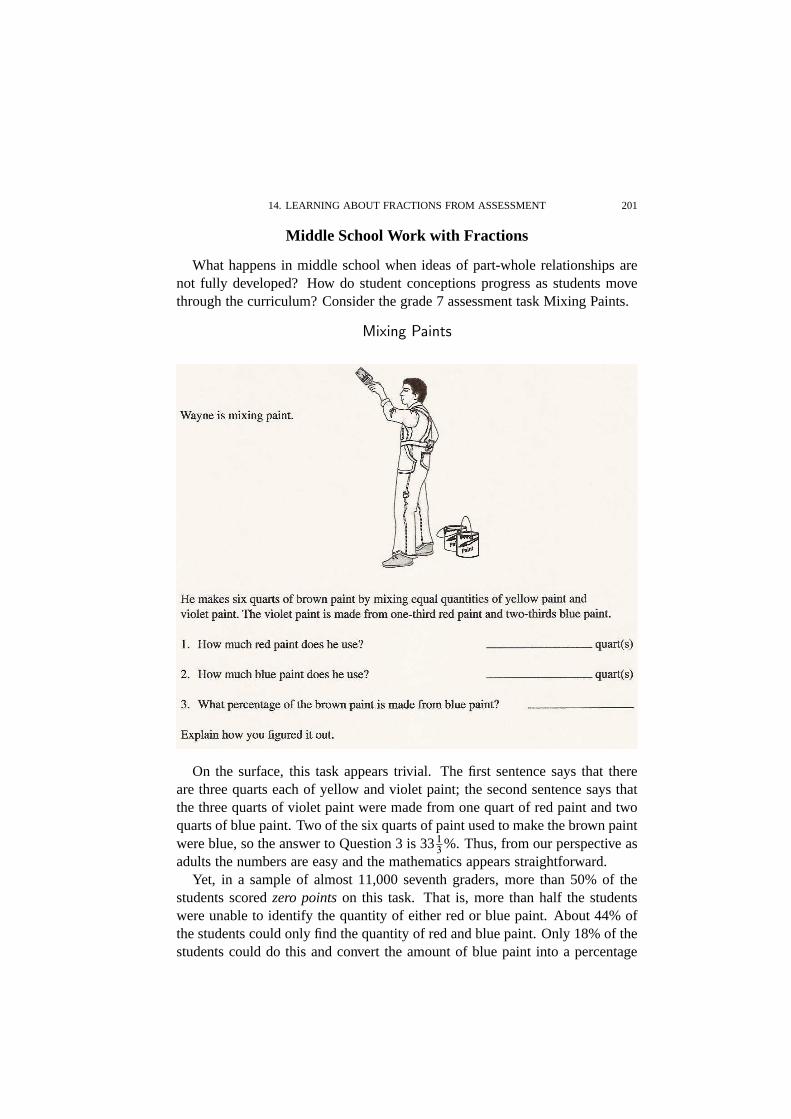
What happens in middle school when ideas of part-whole relationships arenot fully developed? How do student conceptions progress asstudents movethrough the curriculum? Consider the grade 7 assessment task Mixing Paints.
Mixing Paints
On the surface, this task appears trivial. The first sentencesays that thereare three quarts each of yellow and violet paint; the second sentence says thatthe three quarts of violet paint were made from one quart of red paint and twoquarts of blue paint. Two of the six quarts of paint used to make the brown paintwere blue, so the answer to Question 3 is 331
3%. Thus, from our perspective as
adults the numbers are easy and the mathematics appears straightforward.Yet, in a sample of almost 11,000 seventh graders, more than 50% of the
students scoredzero points on this task. That is, more than half the studentswere unable to identify the quantity of either red or blue paint. About 44% ofthe students could only find the quantity of red and blue paint. Only 18% of thestudents could do this and convert the amount of blue paint into a percentage
202 LINDA FISHER
of the total amount of brown paint — they had difficulty identifying the whole,which was the six quarts of brown paint. (Generally, students wrote that theanswer to Question 3 was 66%. This may have been a conversion of the “twothirds” in the statement that the violet paint is two-thirdsblue paint.)
Assessment items such as Mixing Paints provide a way for teachers to gain asense of how students are thinking, and to see how students are (or are not) mak-ing sense of part-whole relationships, and what kinds of representations mighthelp students better grasp those relationships. How do various representationsfacilitate student learning and deepen student thinking over time? MathematicsAssessment Collaborative teachers have come to appreciatethe bar models usedin Singapore and Russia, which help students visualize fractional relationshipsand make sense of rates. A benefit of bar models is that they canbe modified torepresent percents and other mathematical topics.
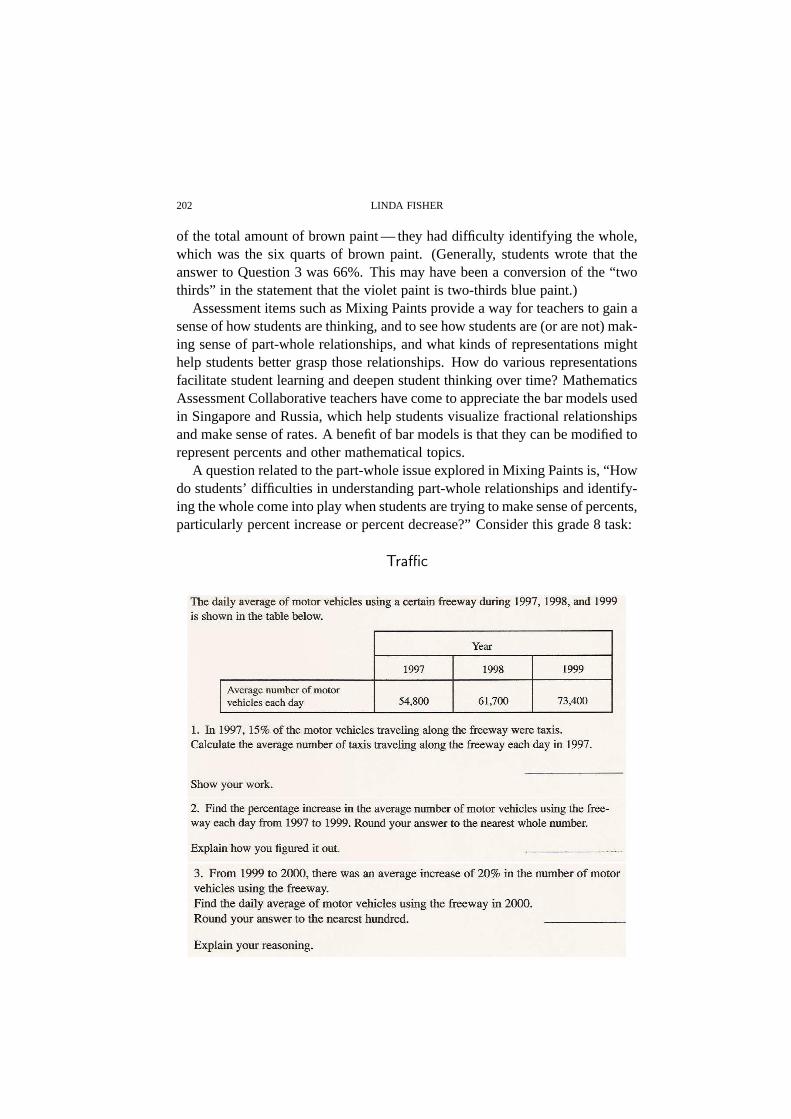
A question related to the part-whole issue explored in Mixing Paints is, “Howdo students’ difficulties in understanding part-whole relationships and identify-ing the whole come into play when students are trying to make sense of percents,particularly percent increase or percent decrease?” Consider this grade 8 task:
Traffic
14. LEARNING ABOUT FRACTIONS FROM ASSESSMENT 203
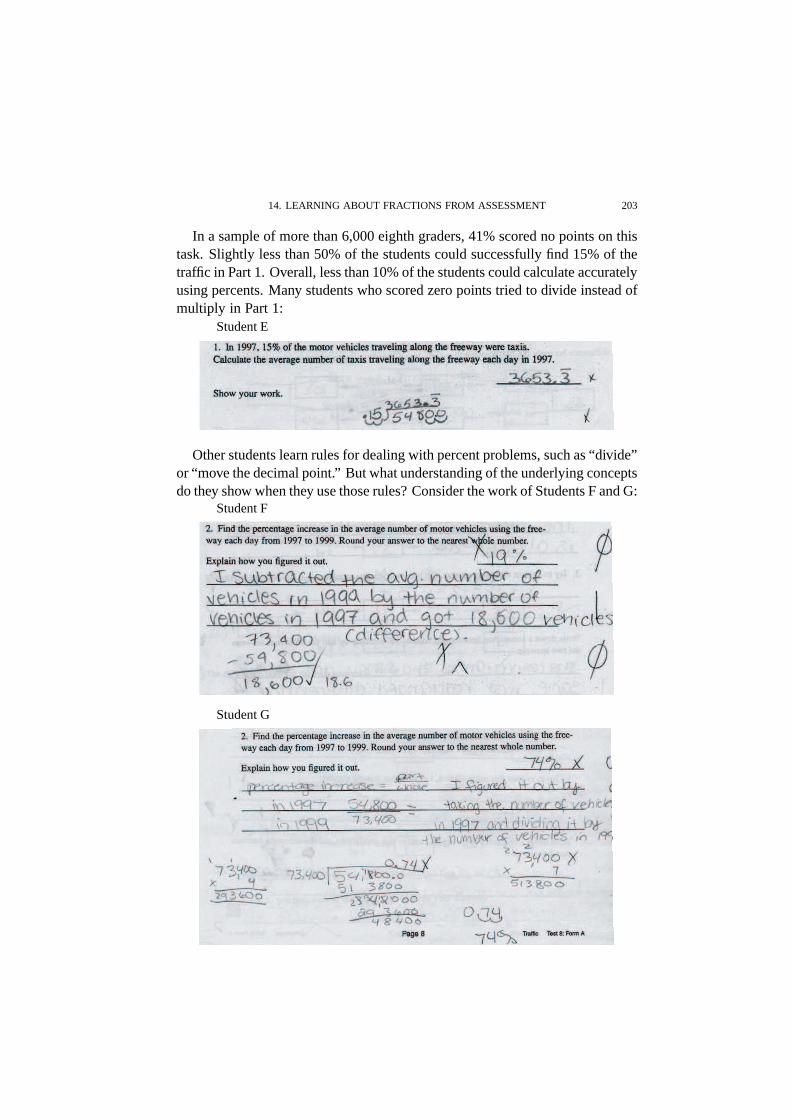
In a sample of more than 6,000 eighth graders, 41% scored no points on thistask. Slightly less than 50% of the students could successfully find 15% of thetraffic in Part 1. Overall, less than 10% of the students couldcalculate accuratelyusing percents. Many students who scored zero points tried to divide instead ofmultiply in Part 1:
Student E
Other students learn rules for dealing with percent problems, such as “divide”or “move the decimal point.” But what understanding of the underlying conceptsdo they show when they use those rules? Consider the work of Students F and G:
Student F
Student G
204 LINDA FISHER
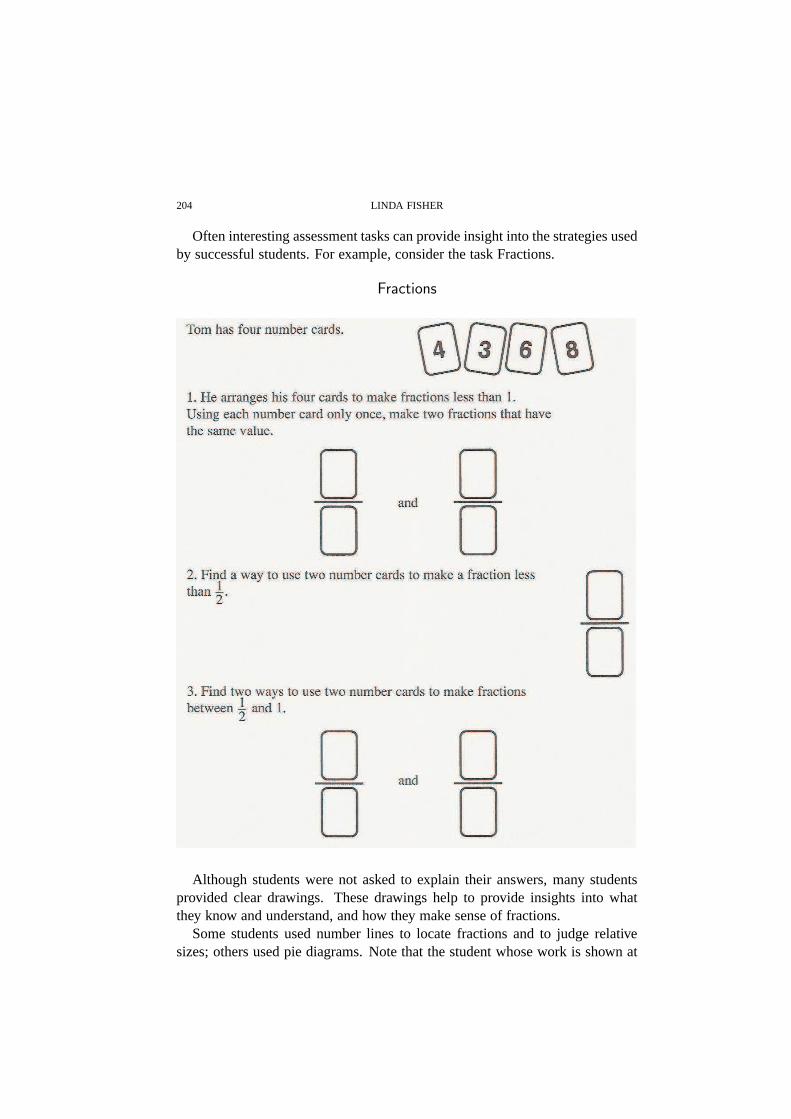
Often interesting assessment tasks can provide insight into the strategies usedby successful students. For example, consider the task Fractions.
Fractions
Although students were not asked to explain their answers, many studentsprovided clear drawings. These drawings help to provide insights into whatthey know and understand, and how they make sense of fractions.
Some students used number lines to locate fractions and to judge relativesizes; others used pie diagrams. Note that the student whosework is shown at

14. LEARNING ABOUT FRACTIONS FROM ASSESSMENT 205
the bottom of this page also uses words to indicate that all the constraints in theproblem are being met by the solution.
Fraction comparison via number lines, reduction to common denominator
Fraction comparison via pie diagrams
206 LINDA FISHER
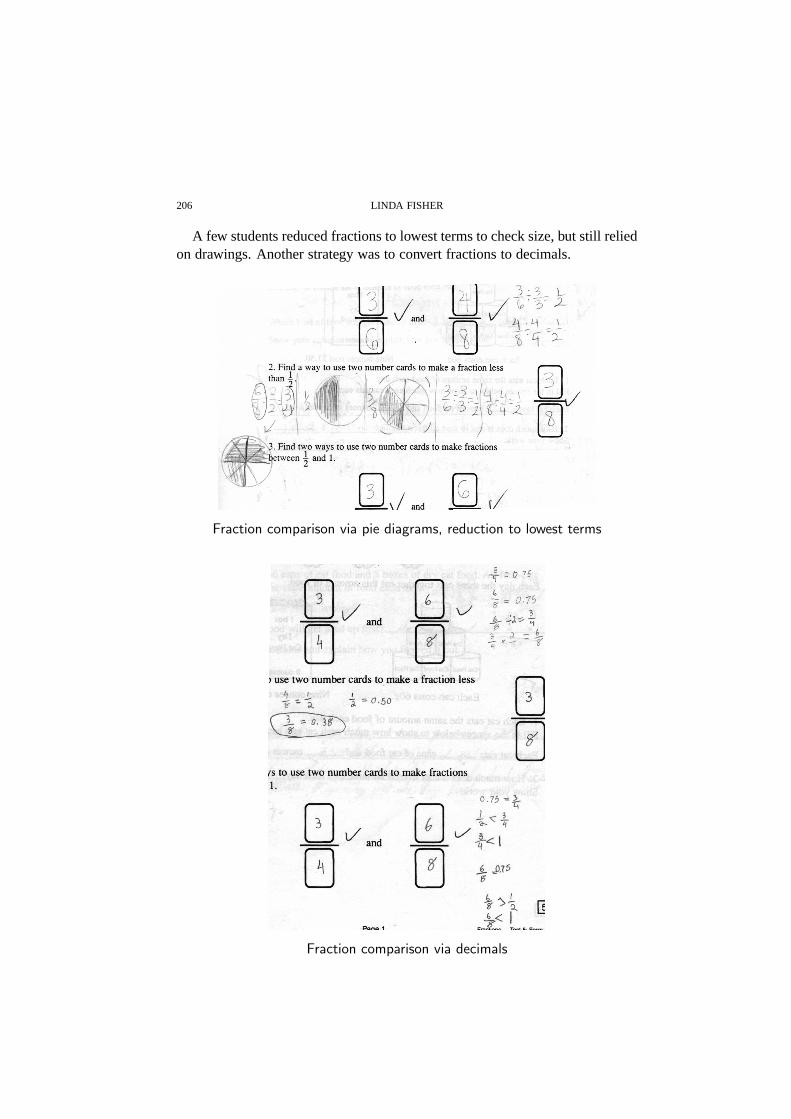
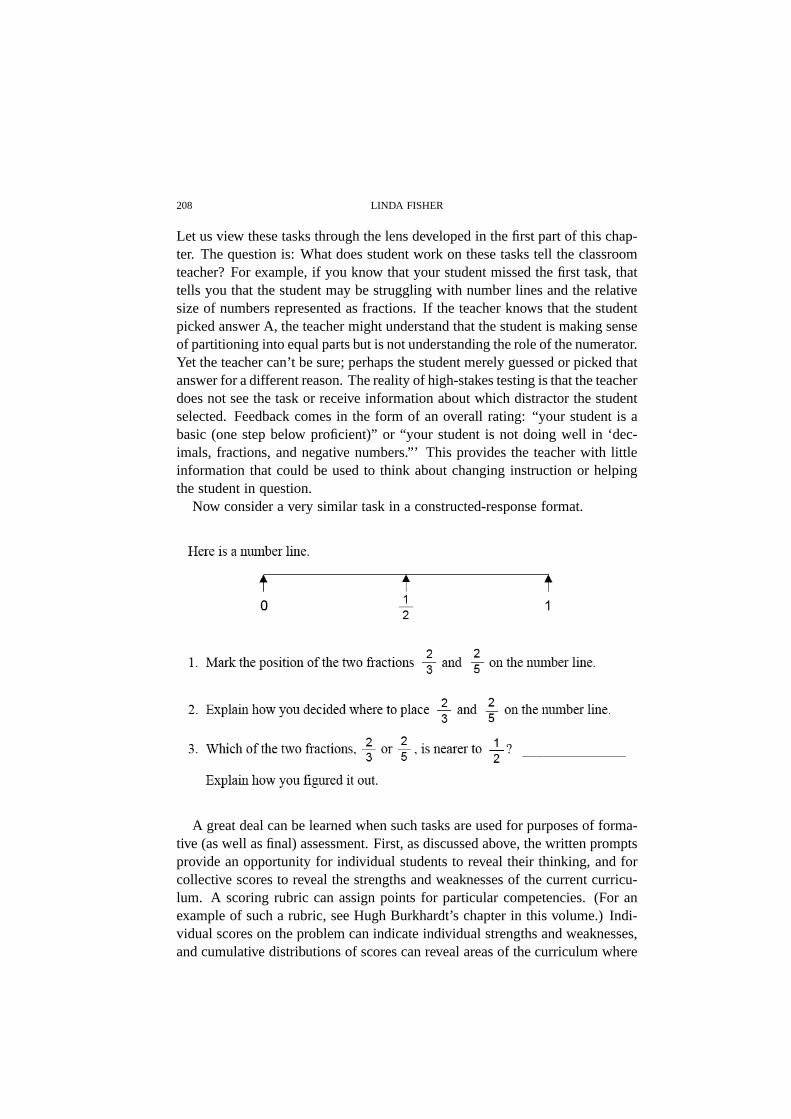
A few students reduced fractions to lowest terms to check size, but still reliedon drawings. Another strategy was to convert fractions to decimals.
Fraction comparison via pie diagrams, reduction to lowest terms
Fraction comparison via decimals

14. LEARNING ABOUT FRACTIONS FROM ASSESSMENT 207
Some students have a clear understanding that “half of” a quantity meansdividing that quantity by 2, and they use that understandingto compare fractions,writing, for example: “Half of eight is four and three is lessthan four, so3
8is
less than1
2. D
4
8/.”
As noted above, students’ responses to assessment tasks yields insights intotheir thinking and into the advantages and disadvantages ofparticular curricula.As some of the previous examples indicate, giving students experience with awide variety of strategies and representations provides them with a range oftools they can use to make sense of problem situations.
In summary, high quality assessments can provide teachers with useful in-formation about student misconceptions related to: the role of equal parts inthe definition of fractions; using and interpreting representations of fractionsthat display the whole; and understanding equality. These assessments can pro-vide a window into student thinking, and help teachers thinkabout their owninstructional practices and concrete ways in which they might be improved.Good assessments help teachers reflect upon issues like: “What does it mean tounderstand an mathematical idea and how is assessing it different from lookingat computational fluency? What is the value of having students draw represen-tations themselves versus interpret representations provided in textbooks? Howis the learning different?” They also give teachers the chance to look acrossgrade levels and see how student thinking is or is not gettingdeeper and richerover time. Mathematically rich performance assessments provide insight intothe strategies used by successful students. Of all the toolsavailable to a student,which one does the student use to solve a complicated problem? When a teachersees this, how can he or she turn these strategies into tools for all students?
Multiple-Choice and Constructed-Response Tasks:What Does a Teacher Learn from Each?
Two of the released items from the California Standards Testare given below.
1. What fraction is best represented by the pointP on this number line?
A:1
8B:
1
5C:
3
4D:
7
8
2. Which fraction represents the largest part of a whole?
A:1
6B:
1
4C:
1
3D:
1
2:
208 LINDA FISHER
Let us view these tasks through the lens developed in the firstpart of this chap-ter. The question is: What does student work on these tasks tell the classroomteacher? For example, if you know that your student missed the first task, thattells you that the student may be struggling with number lines and the relativesize of numbers represented as fractions. If the teacher knows that the studentpicked answer A, the teacher might understand that the student is making senseof partitioning into equal parts but is not understanding the role of the numerator.Yet the teacher can’t be sure; perhaps the student merely guessed or picked thatanswer for a different reason. The reality of high-stakes testing is that the teacherdoes not see the task or receive information about which distractor the studentselected. Feedback comes in the form of an overall rating: “your student is abasic (one step below proficient)” or “your student is not doing well in ‘dec-imals, fractions, and negative numbers.”’ This provides the teacher with littleinformation that could be used to think about changing instruction or helpingthe student in question.
Now consider a very similar task in a constructed-response format.
A great deal can be learned when such tasks are used for purposes of forma-tive (as well as final) assessment. First, as discussed above, the written promptsprovide an opportunity for individual students to reveal their thinking, and forcollective scores to reveal the strengths and weaknesses ofthe current curricu-lum. A scoring rubric can assign points for particular competencies. (For anexample of such a rubric, see Hugh Burkhardt’s chapter in this volume.) Indi-vidual scores on the problem can indicate individual strengths and weaknesses,and cumulative distributions of scores can reveal areas of the curriculum where
14. LEARNING ABOUT FRACTIONS FROM ASSESSMENT 209
students need help. School districts working with the Mathematics AssessmentCollaborative generate graphs showing student score distributions. This allowsthe district to pinpoint places where curricular attentionis needed, and to exam-ine progress over the years. (See Elizabeth Stage’s chapterin this volume for asimilar discussion of what tests can reveal.)
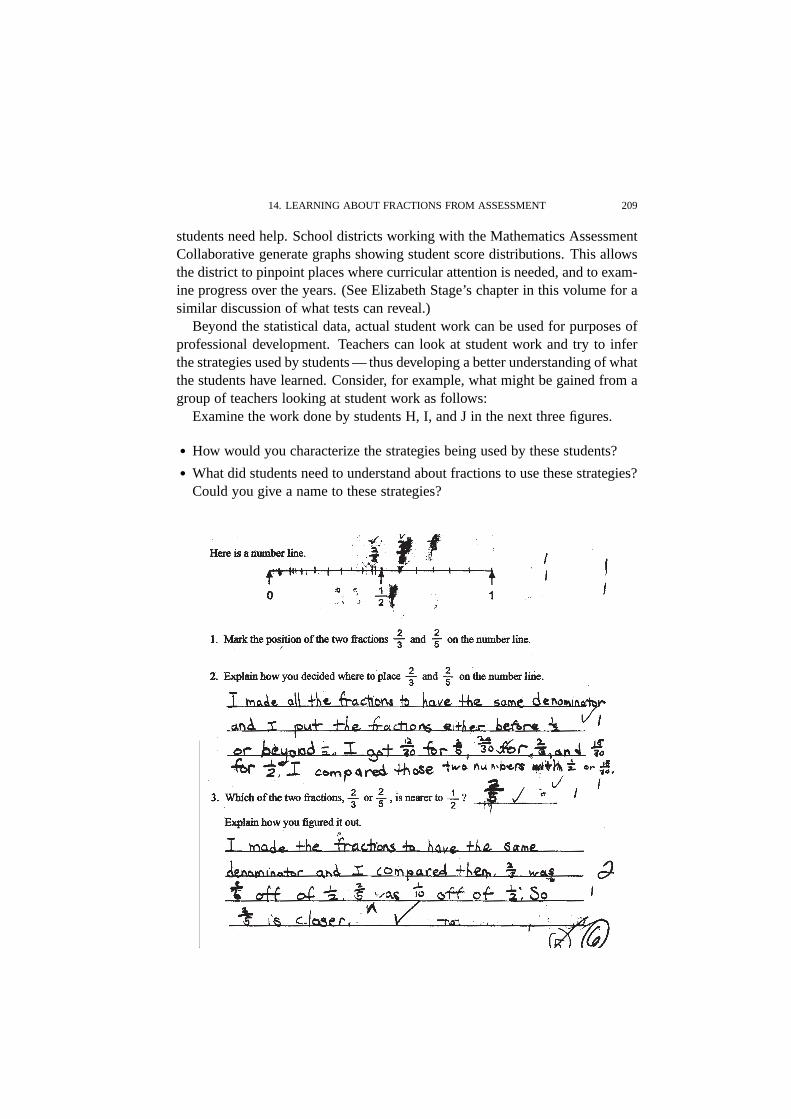
Beyond the statistical data, actual student work can be usedfor purposes ofprofessional development. Teachers can look at student work and try to inferthe strategies used by students — thus developing a better understanding of whatthe students have learned. Consider, for example, what might be gained from agroup of teachers looking at student work as follows:
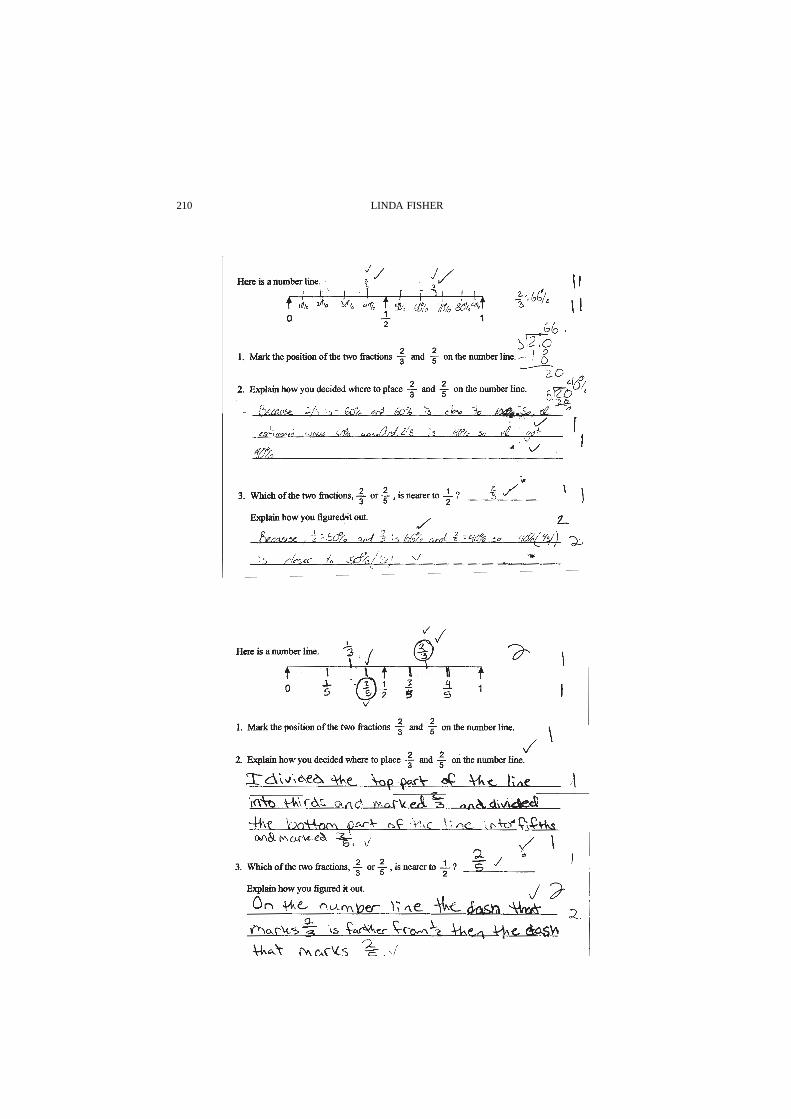
Examine the work done by students H, I, and J in the next three figures.
� How would you characterize the strategies being used by these students?
� What did students need to understand about fractions to use these strategies?Could you give a name to these strategies?
210 LINDA FISHER

14. LEARNING ABOUT FRACTIONS FROM ASSESSMENT 211
In discussions of such student work, teachers become increasingly attunedto diagnosing student thinking — to seeing not only what students got right orwrong, but how and why they got those things right or wrong. These under-standings can lead to more effective teaching and improved student learning.