section 3: biological monitoring - virginia deq · fecal waste from humans or other warm-blooded...
TRANSCRIPT
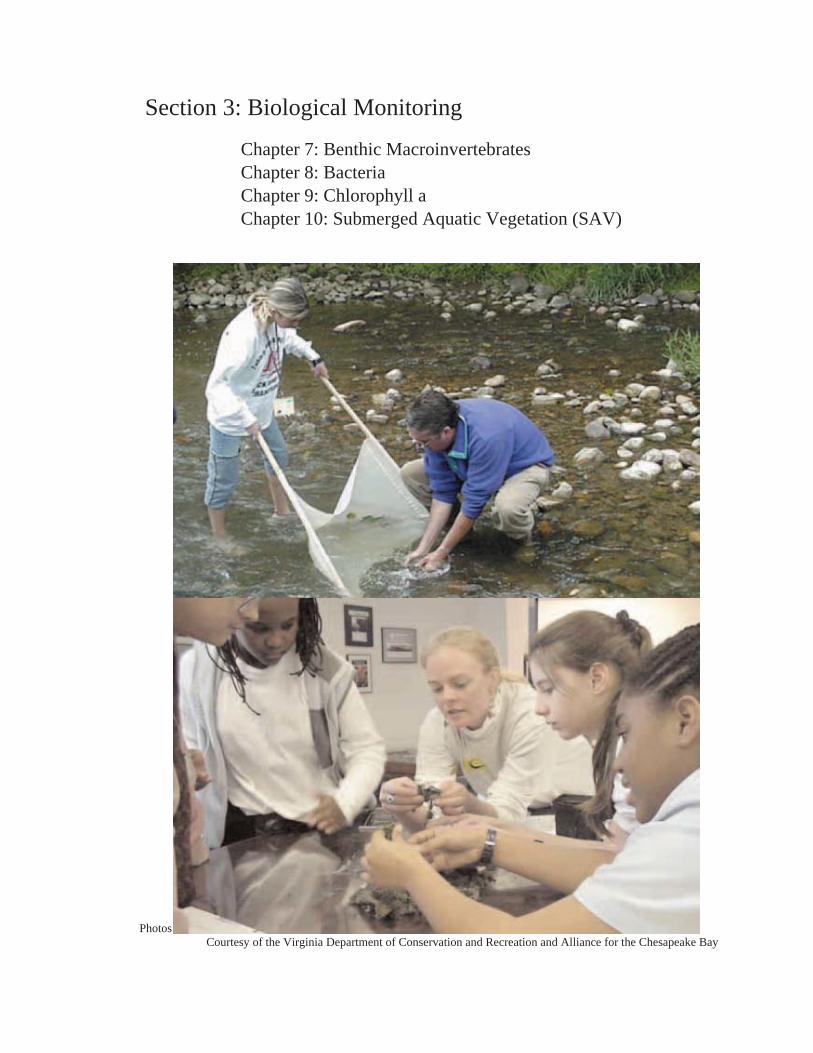
Photos Courtesy of the Virginia Department of Conservation and Recreation and Alliance for the Chesapeake Bay
Section 3: Biological Monitoring
Chapter 7: Benthic Macroinvertebrates Chapter 8: Bacteria Chapter 9: Chlorophyll a Chapter 10: Submerged Aquatic Vegetation (SAV)

Chapter 7
Benthic Macroinvertebrates
Chapter 7: Benthic Macroinvertebrates____________________________________________________
_____________________________________________________________________________________ Virginia Citizen Water Quality Monitoring Program Methods Manual 7-1
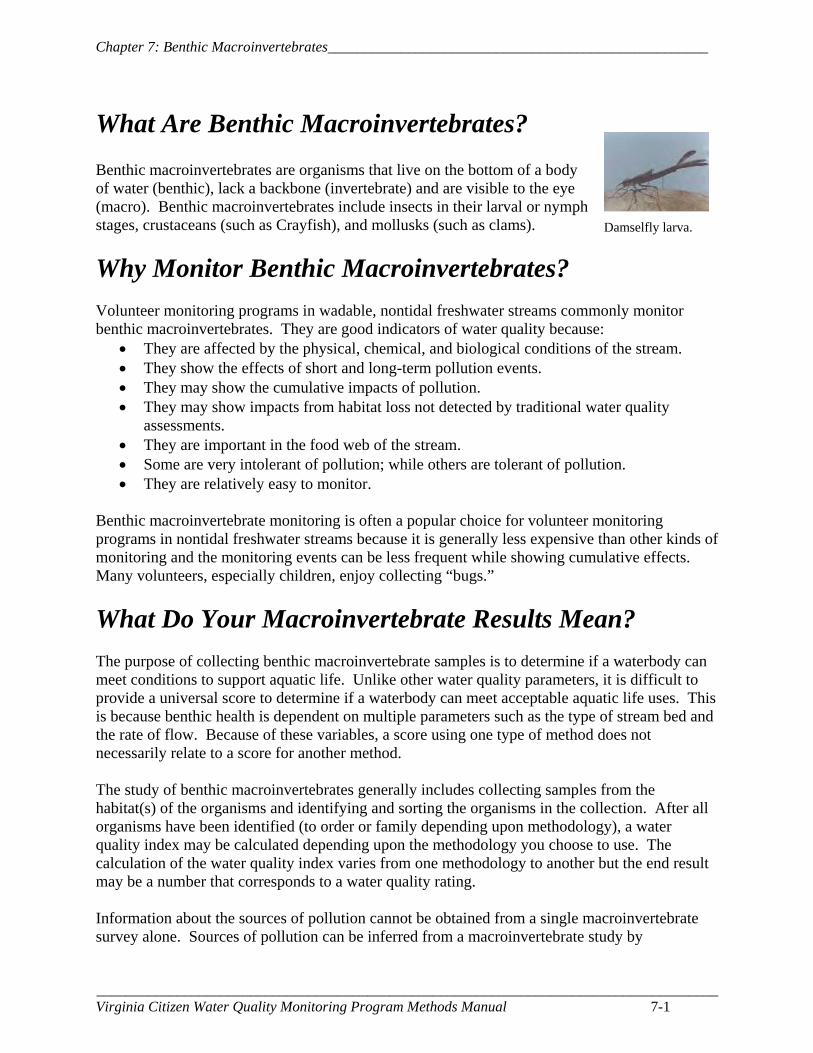
What Are Benthic Macroinvertebrates? Benthic macroinvertebrates are organisms that live on the bottom of a body of water (benthic), lack a backbone (invertebrate) and are visible to the eye (macro). Benthic macroinvertebrates include insects in their larval or nymph stages, crustaceans (such as Crayfish), and mollusks (such as clams).
Why Monitor Benthic Macroinvertebrates? Volunteer monitoring programs in wadable, nontidal freshwater streams commonly monitor benthic macroinvertebrates. They are good indicators of water quality because:
• They are affected by the physical, chemical, and biological conditions of the stream. • They show the effects of short and long-term pollution events. • They may show the cumulative impacts of pollution. • They may show impacts from habitat loss not detected by traditional water quality
assessments. • They are important in the food web of the stream. • Some are very intolerant of pollution; while others are tolerant of pollution. • They are relatively easy to monitor.
Benthic macroinvertebrate monitoring is often a popular choice for volunteer monitoring programs in nontidal freshwater streams because it is generally less expensive than other kinds of monitoring and the monitoring events can be less frequent while showing cumulative effects. Many volunteers, especially children, enjoy collecting “bugs.”
What Do Your Macroinvertebrate Results Mean? The purpose of collecting benthic macroinvertebrate samples is to determine if a waterbody can meet conditions to support aquatic life. Unlike other water quality parameters, it is difficult to provide a universal score to determine if a waterbody can meet acceptable aquatic life uses. This is because benthic health is dependent on multiple parameters such as the type of stream bed and the rate of flow. Because of these variables, a score using one type of method does not necessarily relate to a score for another method. The study of benthic macroinvertebrates generally includes collecting samples from the habitat(s) of the organisms and identifying and sorting the organisms in the collection. After all organisms have been identified (to order or family depending upon methodology), a water quality index may be calculated depending upon the methodology you choose to use. The calculation of the water quality index varies from one methodology to another but the end result may be a number that corresponds to a water quality rating. Information about the sources of pollution cannot be obtained from a single macroinvertebrate survey alone. Sources of pollution can be inferred from a macroinvertebrate study by
Damselfly larva.
Chapter 7: Benthic Macroinvertebrates____________________________________________________
_____________________________________________________________________________________ Virginia Citizen Water Quality Monitoring Program Methods Manual 7-2
incorporating a habitat and watershed assessment and looking at conditions upstream and downstream of potential sources of pollution. While chemical monitoring can only describe water quality at the moment the water is monitored, the macroinvertebrate community shows cumulative impacts.
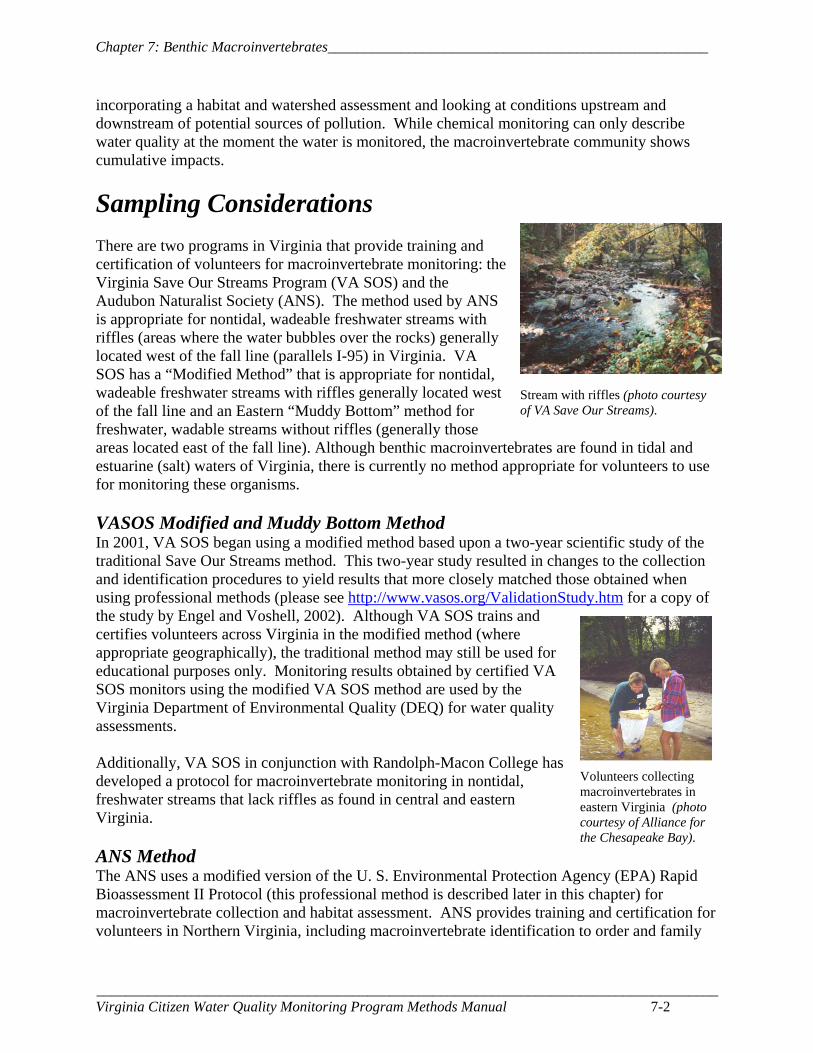
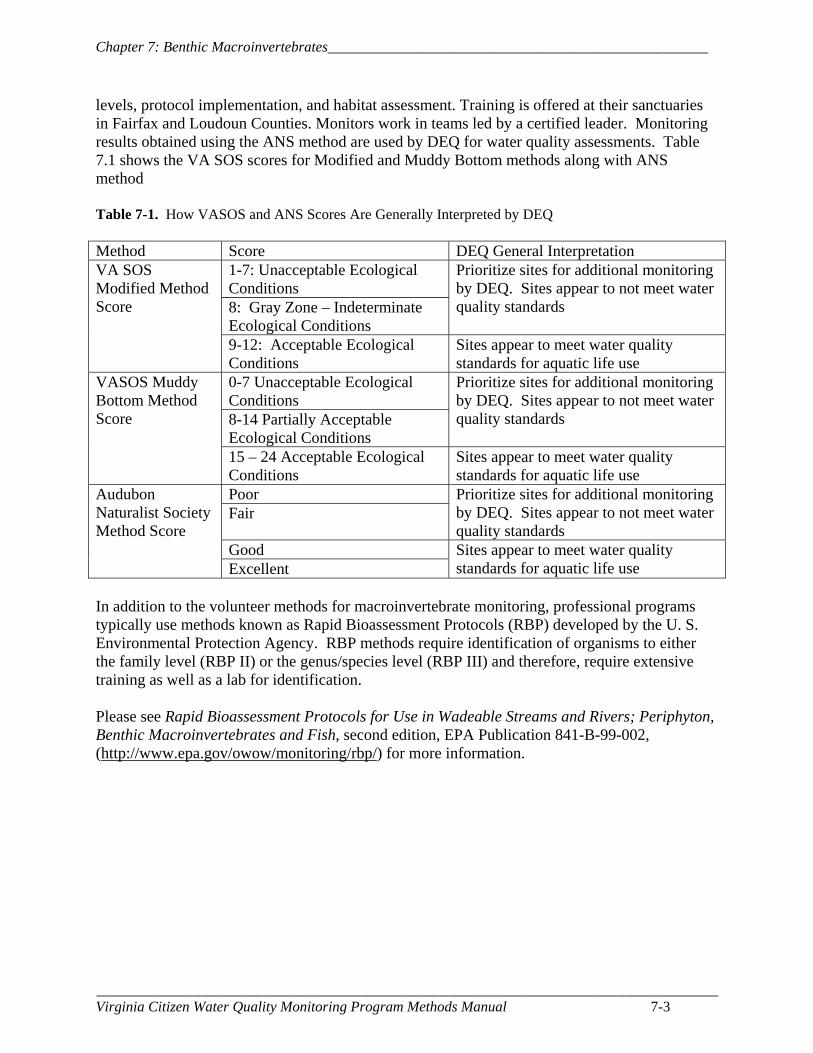
Sampling Considerations There are two programs in Virginia that provide training and certification of volunteers for macroinvertebrate monitoring: the Virginia Save Our Streams Program (VA SOS) and the Audubon Naturalist Society (ANS). The method used by ANS is appropriate for nontidal, wadeable freshwater streams with riffles (areas where the water bubbles over the rocks) generally located west of the fall line (parallels I-95) in Virginia. VA SOS has a “Modified Method” that is appropriate for nontidal, wadeable freshwater streams with riffles generally located west of the fall line and an Eastern “Muddy Bottom” method for freshwater, wadable streams without riffles (generally those areas located east of the fall line). Although benthic macroinvertebrates are found in tidal and estuarine (salt) waters of Virginia, there is currently no method appropriate for volunteers to use for monitoring these organisms. VASOS Modified and Muddy Bottom Method In 2001, VA SOS began using a modified method based upon a two-year scientific study of the traditional Save Our Streams method. This two-year study resulted in changes to the collection and identification procedures to yield results that more closely matched those obtained when using professional methods (please see http://www.vasos.org/ValidationStudy.htm for a copy of the study by Engel and Voshell, 2002). Although VA SOS trains and certifies volunteers across Virginia in the modified method (where appropriate geographically), the traditional method may still be used for educational purposes only. Monitoring results obtained by certified VA SOS monitors using the modified VA SOS method are used by the Virginia Department of Environmental Quality (DEQ) for water quality assessments. Additionally, VA SOS in conjunction with Randolph-Macon College has developed a protocol for macroinvertebrate monitoring in nontidal, freshwater streams that lack riffles as found in central and eastern Virginia. ANS Method The ANS uses a modified version of the U. S. Environmental Protection Agency (EPA) Rapid Bioassessment II Protocol (this professional method is described later in this chapter) for macroinvertebrate collection and habitat assessment. ANS provides training and certification for volunteers in Northern Virginia, including macroinvertebrate identification to order and family
Volunteers collecting macroinvertebrates in eastern Virginia (photo courtesy of Alliance for the Chesapeake Bay).
Stream with riffles (photo courtesy of VA Save Our Streams).
Chapter 7: Benthic Macroinvertebrates____________________________________________________
_____________________________________________________________________________________ Virginia Citizen Water Quality Monitoring Program Methods Manual 7-3
levels, protocol implementation, and habitat assessment. Training is offered at their sanctuaries in Fairfax and Loudoun Counties. Monitors work in teams led by a certified leader. Monitoring results obtained using the ANS method are used by DEQ for water quality assessments. Table 7.1 shows the VA SOS scores for Modified and Muddy Bottom methods along with ANS method Table 7-1. How VASOS and ANS Scores Are Generally Interpreted by DEQ Method Score DEQ General Interpretation
1-7: Unacceptable Ecological Conditions 8: Gray Zone – Indeterminate Ecological Conditions
Prioritize sites for additional monitoring by DEQ. Sites appear to not meet water quality standards
VA SOS Modified Method Score
9-12: Acceptable Ecological Conditions
Sites appear to meet water quality standards for aquatic life use
0-7 Unacceptable Ecological Conditions 8-14 Partially Acceptable Ecological Conditions
Prioritize sites for additional monitoring by DEQ. Sites appear to not meet water quality standards
VASOS Muddy Bottom Method Score
15 – 24 Acceptable Ecological Conditions
Sites appear to meet water quality standards for aquatic life use
Poor Fair
Prioritize sites for additional monitoring by DEQ. Sites appear to not meet water quality standards
Good
Audubon Naturalist Society Method Score
Excellent Sites appear to meet water quality standards for aquatic life use
In addition to the volunteer methods for macroinvertebrate monitoring, professional programs typically use methods known as Rapid Bioassessment Protocols (RBP) developed by the U. S. Environmental Protection Agency. RBP methods require identification of organisms to either the family level (RBP II) or the genus/species level (RBP III) and therefore, require extensive training as well as a lab for identification. Please see Rapid Bioassessment Protocols for Use in Wadeable Streams and Rivers; Periphyton, Benthic Macroinvertebrates and Fish, second edition, EPA Publication 841-B-99-002, (http://www.epa.gov/owow/monitoring/rbp/) for more information.
Chapter 7: Benthic Macroinvertebrates____________________________________________________
_____________________________________________________________________________________ Virginia Citizen Water Quality Monitoring Program Methods Manual 7-4
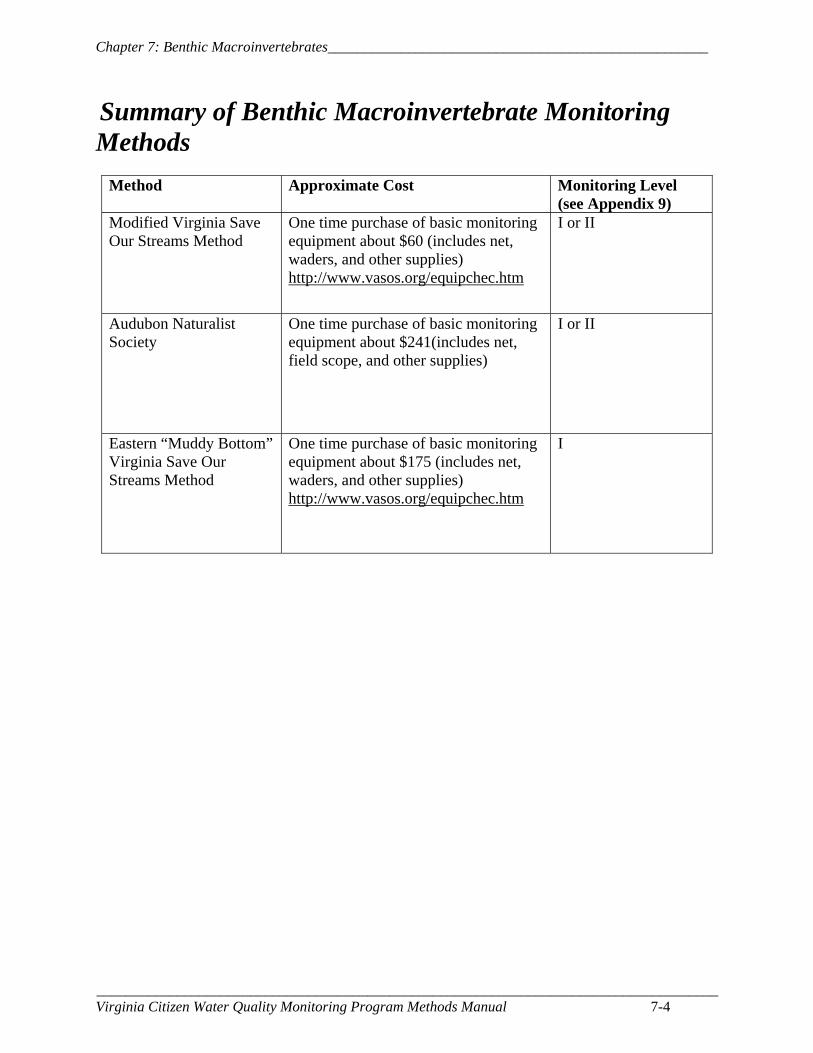
Summary of Benthic Macroinvertebrate Monitoring Methods
Method Approximate Cost Monitoring Level (see Appendix 9)
Modified Virginia Save Our Streams Method
One time purchase of basic monitoring equipment about $60 (includes net, waders, and other supplies) http://www.vasos.org/equipchec.htm
I or II
Audubon Naturalist Society
One time purchase of basic monitoring equipment about $241(includes net, field scope, and other supplies)
I or II
Eastern “Muddy Bottom” Virginia Save Our Streams Method
One time purchase of basic monitoring equipment about $175 (includes net, waders, and other supplies) http://www.vasos.org/equipchec.htm
I

Chapter 8: Bacteria____________________________________________________________________
Chapter 8
Bacteria
Chapter 8: Bacteria____________________________________________________________________
_____________________________________________________________________________________ Virginia Citizen Water Quality Monitoring Program Methods Manual 8-2
What Are Bacteria? Bacteria are single-celled organisms that occur in a variety of forms and have a wide range of properties. Some cause disease while others decompose decaying organic material and serve as food for other organisms in the food chain.
Why Monitor Bacteria? Pathogenic (disease-causing) bacteria, viruses, and protozoans are often found in fecal waste. These pathogens can cause a variety of illnesses and diseases when ingested during recreational contact or consumed in contaminated water and shellfish. Fecal waste from humans or other warm-blooded animals may enter a waterbody from various sources including faulty wastewater treatment plants, livestock, malfunctioning septic systems, untreated sewage discharge, pets, stormwater runoff, wildlife, or boat waste. Since it is not practical to monitor for every pathogen, “indicator” species are monitored. The presence of indicator species suggests the presence of fecal waste that may include pathogenic microorganisms that pose a health risk. In addition to the possible health risk associated with elevated levels of fecal material, it can also cause cloudy water, nutrient enrichment, unpleasant odors, and an increased oxygen demand (please see Chapters 4 and 6).
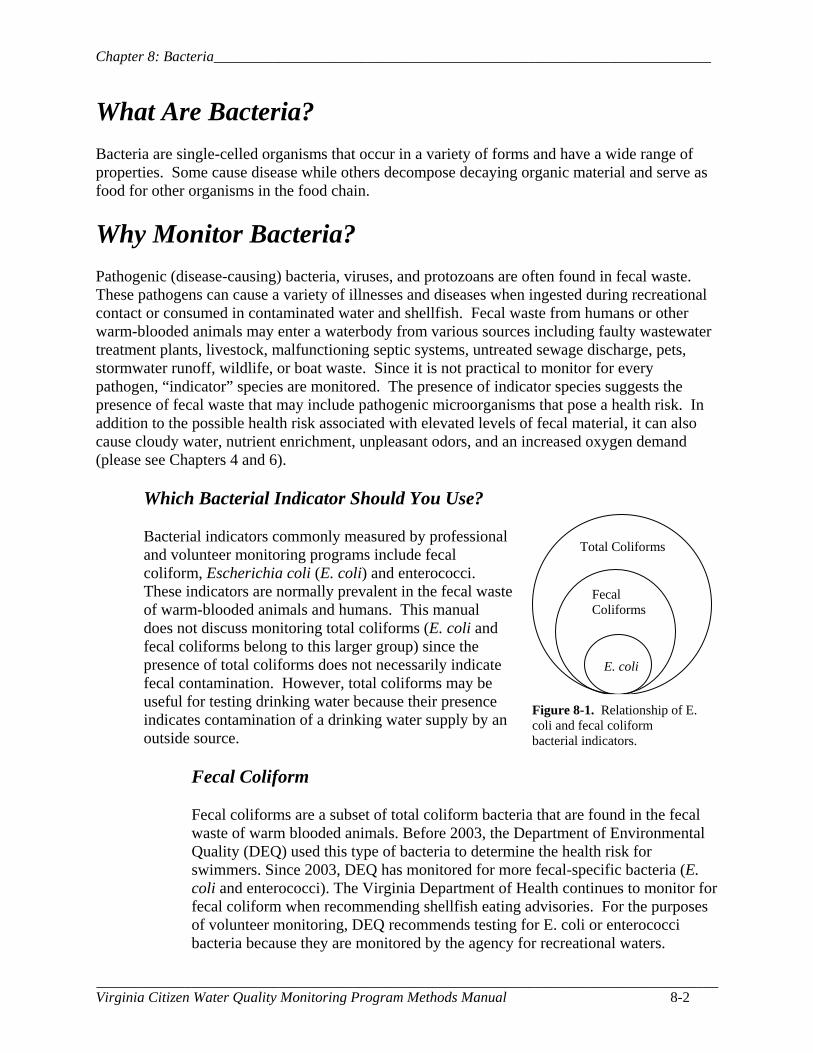
Which Bacterial Indicator Should You Use? Bacterial indicators commonly measured by professional and volunteer monitoring programs include fecal coliform, Escherichia coli (E. coli) and enterococci. These indicators are normally prevalent in the fecal waste of warm-blooded animals and humans. This manual does not discuss monitoring total coliforms (E. coli and fecal coliforms belong to this larger group) since the presence of total coliforms does not necessarily indicate fecal contamination. However, total coliforms may be useful for testing drinking water because their presence indicates contamination of a drinking water supply by an outside source.
Fecal Coliform Fecal coliforms are a subset of total coliform bacteria that are found in the fecal waste of warm blooded animals. Before 2003, the Department of Environmental Quality (DEQ) used this type of bacteria to determine the health risk for swimmers. Since 2003, DEQ has monitored for more fecal-specific bacteria (E. coli and enterococci). The Virginia Department of Health continues to monitor for fecal coliform when recommending shellfish eating advisories. For the purposes of volunteer monitoring, DEQ recommends testing for E. coli or enterococci bacteria because they are monitored by the agency for recreational waters.
Total Coliforms
Fecal Coliforms
E. coli
Figure 8-1. Relationship of E. coli and fecal coliform bacterial indicators.
Chapter 8: Bacteria____________________________________________________________________
_____________________________________________________________________________________ Virginia Citizen Water Quality Monitoring Program Methods Manual 8-3
Escherichia coli (E. coli) E. coli is a species within the fecal coliform group that is specifically associated with the fecal waste of warm-blooded animals. In freshwater, E. coli corresponds more closely with swimming-related illnesses than fecal coliform. Enterococci Enterococci are another group of bacteria found mainly in the intestinal tract of warm-blooded animals. It is not a type of coliform bacteria but a subgroup of the fecal streptococci group. Since EPA recommends enterococci for testing marine recreational waters because of correlation with swimming-related illnesses, DEQ has begun monitoring for enterococci at salt or brackish water sites.
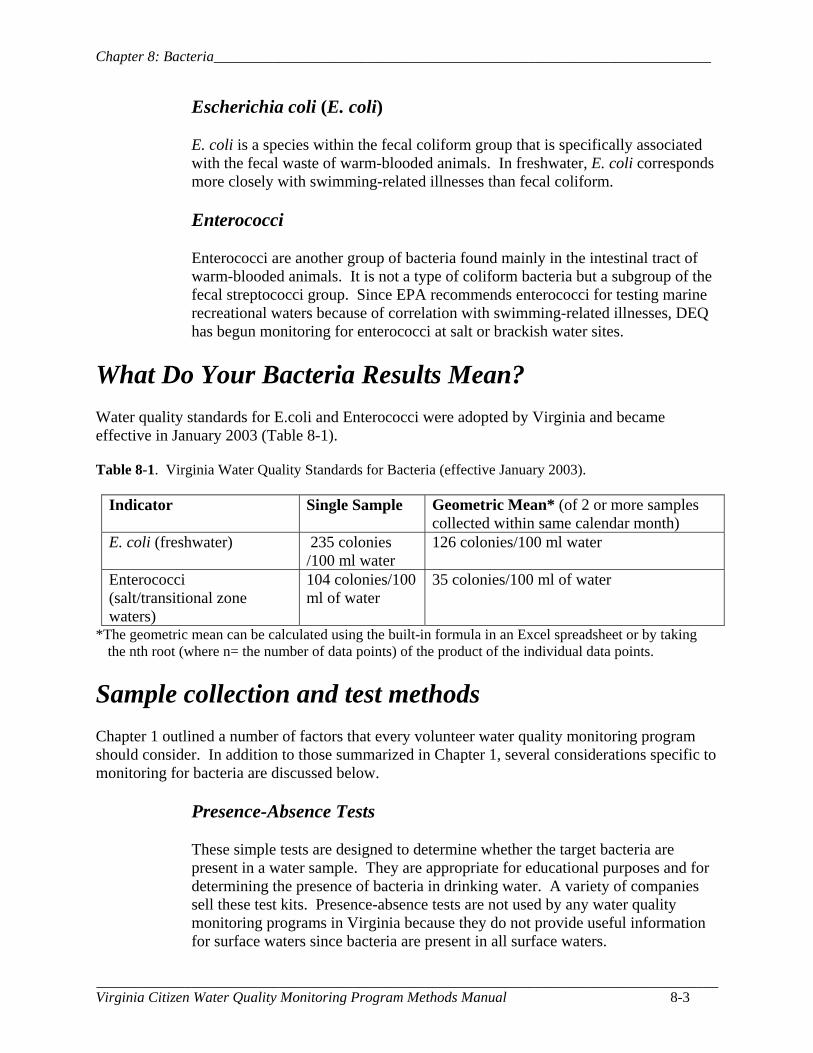
What Do Your Bacteria Results Mean? Water quality standards for E.coli and Enterococci were adopted by Virginia and became effective in January 2003 (Table 8-1). Table 8-1. Virginia Water Quality Standards for Bacteria (effective January 2003).
Indicator Single Sample Geometric Mean* (of 2 or more samples collected within same calendar month)
E. coli (freshwater) 235 colonies /100 ml water
126 colonies/100 ml water
Enterococci (salt/transitional zone waters)
104 colonies/100 ml of water
35 colonies/100 ml of water
*The geometric mean can be calculated using the built-in formula in an Excel spreadsheet or by taking the nth root (where n= the number of data points) of the product of the individual data points.
Sample collection and test methods Chapter 1 outlined a number of factors that every volunteer water quality monitoring program should consider. In addition to those summarized in Chapter 1, several considerations specific to monitoring for bacteria are discussed below.
Presence-Absence Tests
These simple tests are designed to determine whether the target bacteria are present in a water sample. They are appropriate for educational purposes and for determining the presence of bacteria in drinking water. A variety of companies sell these test kits. Presence-absence tests are not used by any water quality monitoring programs in Virginia because they do not provide useful information for surface waters since bacteria are present in all surface waters.
Chapter 8: Bacteria____________________________________________________________________
_____________________________________________________________________________________ Virginia Citizen Water Quality Monitoring Program Methods Manual 8-4
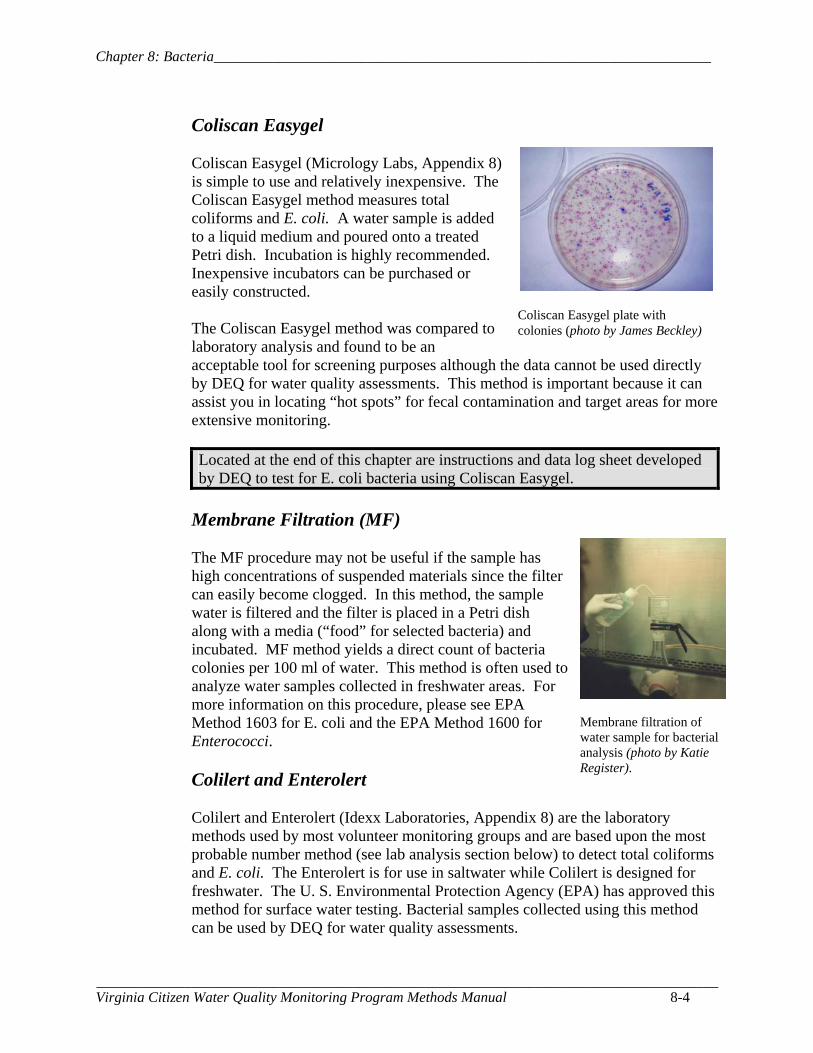
Coliscan Easygel
Coliscan Easygel (Micrology Labs, Appendix 8) is simple to use and relatively inexpensive. The Coliscan Easygel method measures total coliforms and E. coli. A water sample is added to a liquid medium and poured onto a treated Petri dish. Incubation is highly recommended. Inexpensive incubators can be purchased or easily constructed.
The Coliscan Easygel method was compared to laboratory analysis and found to be an acceptable tool for screening purposes although the data cannot be used directly by DEQ for water quality assessments. This method is important because it can assist you in locating “hot spots” for fecal contamination and target areas for more extensive monitoring. Located at the end of this chapter are instructions and data log sheet developed by DEQ to test for E. coli bacteria using Coliscan Easygel.
Membrane Filtration (MF)
The MF procedure may not be useful if the sample has high concentrations of suspended materials since the filter can easily become clogged. In this method, the sample water is filtered and the filter is placed in a Petri dish along with a media (“food” for selected bacteria) and incubated. MF method yields a direct count of bacteria colonies per 100 ml of water. This method is often used to analyze water samples collected in freshwater areas. For more information on this procedure, please see EPA Method 1603 for E. coli and the EPA Method 1600 for Enterococci.
Colilert and Enterolert Colilert and Enterolert (Idexx Laboratories, Appendix 8) are the laboratory methods used by most volunteer monitoring groups and are based upon the most probable number method (see lab analysis section below) to detect total coliforms and E. coli. The Enterolert is for use in saltwater while Colilert is designed for freshwater. The U. S. Environmental Protection Agency (EPA) has approved this method for surface water testing. Bacterial samples collected using this method can be used by DEQ for water quality assessments.
Membrane filtration of water sample for bacterial analysis (photo by Katie Register).
Coliscan Easygel plate with colonies (photo by James Beckley)
Chapter 8: Bacteria____________________________________________________________________
_____________________________________________________________________________________ Virginia Citizen Water Quality Monitoring Program Methods Manual 8-5
Quality Assurance/Quality Control Issues
Sample Collection It is preferred that you collect water samples for bacterial analysis directly from the stream, either by wading or using a pole with a holder for the sample bottle. If this is not possible for safety reasons, the water sample may be collected in a bucket or other sterile container and transferred to the sterile sample container. If using a sampling device such as a bucket, rinse the container with sample water prior to collecting and pouring sample water into a sterile sample bottle. Do not rinse sterile sample bottles with sample water. Some sample containers obtained from a lab contain a sodium thiosulfate tablet. This tablet is not necessary for surface water samples unless chlorine may be present. The purpose of the tablet is to neutralize chlorine in water samples. Field Equipment Blanks
Field equipment blanks are only necessary if water samples are collected in a bucket or other sampling device and transferred into the sample container. A field equipment blank uses pure water (distilled or deionized water) rinsed through the sampling devices to detect cross-contamination between sites. A field equipment blank is collected and transferred in the same manner as the stream water sample. It is recommended that field equipment blanks are collected randomly for 10% of your samples (for a large sample size, 5% is acceptable). For example, if you collect 50 samples, you should collect field equipment blanks at 5 of those sites and label the blank samples. Holding Time
DEQ conducted bacteria holding time studies for E. Coli and Enterococci in ambient water samples. The study results indicated E. Coli can be held up to 48 hrs and Enterococci 30 hrs without changing bacterial counts when the samples are stored in temperatures less than 4ºC.
Chapter 8: Bacteria____________________________________________________________________
_____________________________________________________________________________________ Virginia Citizen Water Quality Monitoring Program Methods Manual 8-6
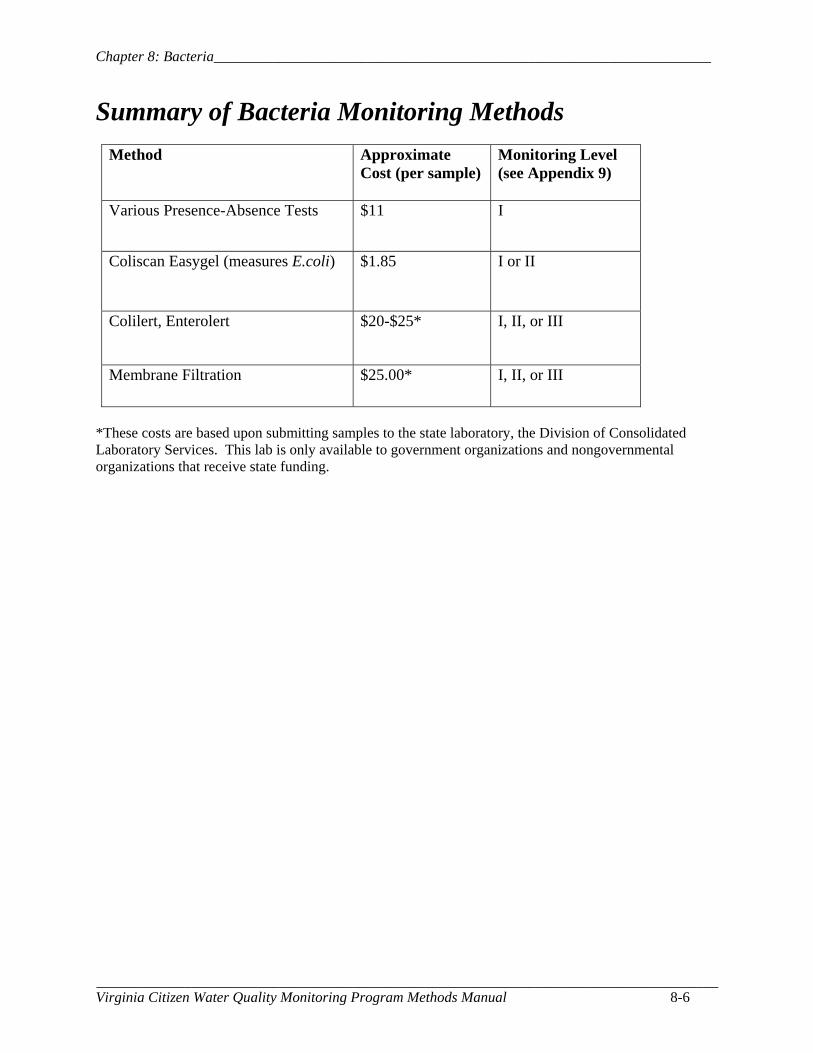
Summary of Bacteria Monitoring Methods
Method
Approximate Cost (per sample)
Monitoring Level (see Appendix 9)
Various Presence-Absence Tests $11 I
Coliscan Easygel (measures E.coli) $1.85 I or II
Colilert, Enterolert $20-$25* I, II, or III
Membrane Filtration $25.00* I, II, or III
*These costs are based upon submitting samples to the state laboratory, the Division of Consolidated Laboratory Services. This lab is only available to government organizations and nongovernmental organizations that receive state funding.
Chapter 8: Bacteria: Coliscan Easygel_____________________________________________________
_____________________________________________________________________________________ Virginia Citizen Water Quality Monitoring Program Methods Manual 8-7
Coliscan Easygel Procedure- Provided by the Department of Environmental Quality Step 1. Sampling General Comments: When sampling streams and rivers, it is critical to obtain a “representative sample”. This means that the water sample should be obtained from the main flow of the water body. In small streams (assuming it is safe), it is best to wade into the main flow of the stream. Collecting the sample from bridges using a sampling bucket is best for larger or deeper streams provided the bridge is safe to sample from. Prior to sampling, remember to remove the bottle of Coliscan media from the freezer and allow it to thaw completely before plating the samples (Step 2). Method 1 sampling using a bucket: Lower a clean (not sterile) bucket from a bridge using rope and partially fill the bucket. Retrieve the bucket and swirl the sample water and dump the contents away from the sample site. Lower the bucket once more and fill part way with a water sample. Try not to collect excessive sediment, mud, or other debris in the bucket. Retrieve the bucket. Using good sterile technique, partially fill the sterile bottle with sample water. Leave a small air gap in the bottle for mixing later in the lab. Immediately place the sample bottle on ice prior to plating. Method 2 sampling directly in the stream: Walk upstream a few steps with minimal disturbance of the sediment. Carefully fill a sterile bottle by submerging it below the surface as you move the bottle away from your body in an upstream direction. This method ensures that bacteria from your boots or hands do not get into your sample. Avoid mud and other debris from entering the sample bottle. Leave a small air gap in the bottle for mixing during plating of samples (Step 2). Immediately place the water sample on ice for later plating. Samples can be kept on ice for up to 48 hours. Sampling Safety: DEQ strongly recommends sampling in teams of at least two people in case a sampler is injured or needs assistance. Sampling along bridges is convenient but can be the most dangerous spot you can sample from. We recommend to sample at bridge sites if it is the only option and the bridge is wide enough to accommodate pedestrians and traffic. Park your vehicle a safe distance from the bridge and have the car hazard signal on. Use a volunteer to spot incoming traffic while another volunteer samples. It is against the law in Virginia to loiter (sampling can be considered loitering) on bridges if the bridge has signs posted that loitering is not allowed. When sampling, it is recommended to use gloves or have alcohol sanitizer available to keep hands clean. You do not know if the water you are sampling contains harmful microorganisms. If sampling along a streamside or in the stream, do not sample when water levels are high, such as after storm events. Do not wade into water that is swift flowing or unusually high as you can be swept away. In Virginia, you can sample at locations along public property (boat docks, parks, etc). If you would like to sample along private property, obtain landowner permission prior to sampling. Remember, it is not worth sacrificing your safety for a sample. If you feel uncomfortable with a sampling site, look for another location that you are more comfortable with.
Chapter 8: Bacteria: Coliscan Easygel_____________________________________________________
_____________________________________________________________________________________ Virginia Citizen Water Quality Monitoring Program Methods Manual 8-8
1 Step 2. Plating Procedure:
1. Label the bottom (smaller, taller piece) of the Petri dish using a permanent marker. It is best to label the dishes using small lettering on the outer rim of the dish. The minimum information needed should be the site ID number, sample volume, and replicate number.
2. Mix the water sample in the sterile bottle and then transfer the desired volume (0.5 – 5.0
milliliters) to a bottle of Coliscan medium using a sterile pipette.
3. Gently swirl the bottle of Coliscan media so that it mixes with the sample water. Do not shake the bottle as this will cause the medium to foam and make reading the colonies difficult.
4. Pour the entire contents of the bottle into a Petri dish. It is important to perform this step on a level
surface so the solution forms an even layer across the plate.
5. Gently swirl the Petri dish so the solution of Coliscan media and sample water covers the entire plate. Allow the solution to solidify (approximately 60 - 90 minutes) prior to incubation. For safety purposes, it is a good idea to loosely tape each Petri dish shut after the media solidifies.
2 Step 3. Incubation Incubate the Petri dishes upside down for 24 – 36 hours at 35° - 40° Celsius. This is approximately 95° - 105° F. If no incubator is available, place the Petri dishes in the safest, warmest spot you can find. Depending on the exact temperature, the plates may take 48 – 72 hours for colonies to form analysis.
3 Step 4. Data Analysis (Scoring)
It is recommended to use white or graph paper as a background to make identifications easier. If there are large number of colonies, drawing quadrants on this paper can help in counting the number of colonies.
1. Count the number of dark blue – royal purple, colonies on each plate and record this number in the column labeled “# E. coli Colonies per Plate” on the data form. Do not count teal colored or pink – dark red colonies. Count colonies directly or calculate a representative sample to determine the average number of E. coli per plate and record on the data form.
2. Calculate the number of E. coli cells per 100 milliliters and record on the data form. Use the
following formula: (# E. coli colonies/ml sample size) x 100
4 Step 5. Safe Disposal of Waste
1. Dispose used pipettes and sample bottles in the household trash. They are also recyclable. 2. Rinse empty bottles of Coliscan medium two – three times with tap water and dispose in your
household trash. (This is to wash out all of the media to prevent pathogens from growing.)
3. Wipe down the area where you poured the media into the Petri dishes with rubbing alcohol to kill any bacteria from the sample bottles. It is recommended to not perform this test where food is present or prepared.
4. After the results have been recorded, add enough bleach or rubbing alcohol to each Petri dish
to completely cover the solid media. Allow to stand for at least 10 minutes to ensure all bacteria have been killed. Place the plates in a zip-lock bag and dispose in the trash.
Chapter 8: Bacteria: Coliscan Easygel_____________________________________________________
_____________________________________________________________________________________ Virginia Citizen Water Quality Monitoring Program Methods Manual 8-9
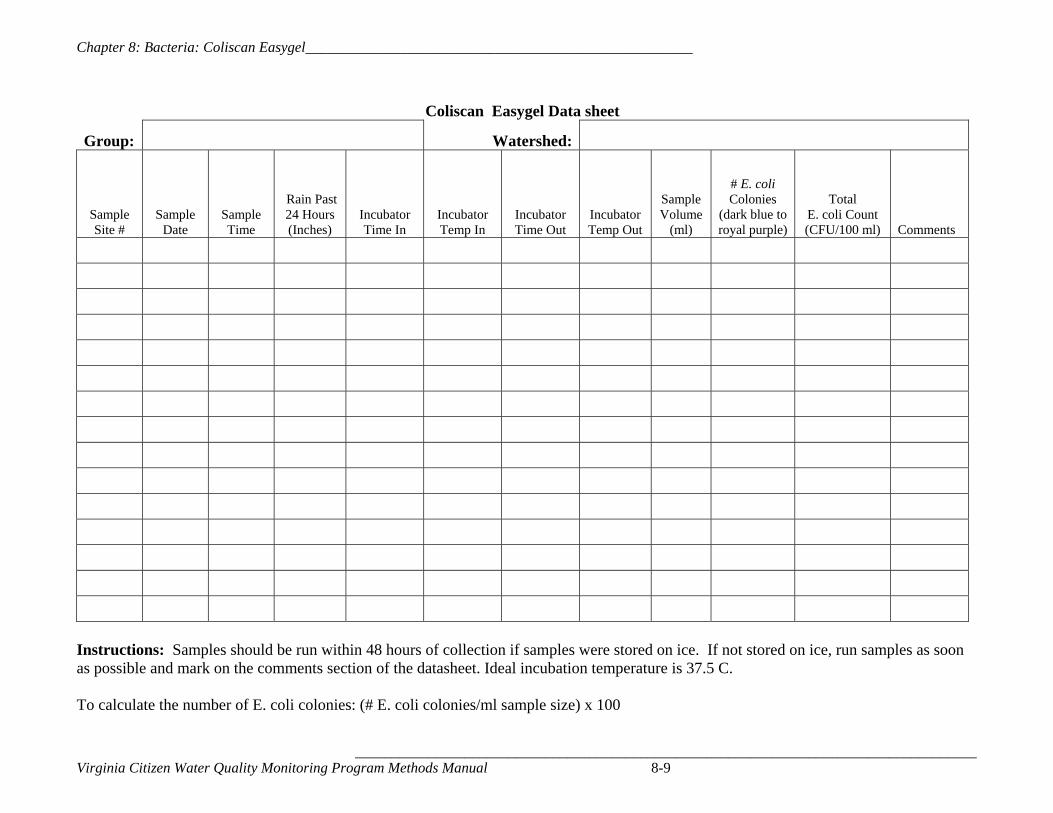
Coliscan Easygel Data sheet
Group: Watershed:
Sample Site #
Sample Date
Sample Time
Rain Past 24 Hours (Inches)
Incubator Time In
Incubator Temp In
Incubator Time Out
Incubator Temp Out
Sample Volume
(ml)
# E. coli Colonies
(dark blue to royal purple)
Total E. coli Count (CFU/100 ml) Comments
Instructions: Samples should be run within 48 hours of collection if samples were stored on ice. If not stored on ice, run samples as soon as possible and mark on the comments section of the datasheet. Ideal incubation temperature is 37.5 C.
To calculate the number of E. coli colonies: (# E. coli colonies/ml sample size) x 100

Chapter 9
Chlorophyll a
Chapter 9: Chlorophyll a________________________________________________________________
_____________________________________________________________________________________ Virginia Citizen Water Quality Monitoring Program Methods Manual 9-1
What is Chlorophyll a? Chlorophyll is the pigment that allows plants (including algae) to undergo photosynthesis. Chlorophyll a is the predominant type of chlorophyll found in algae and phytoplankton (microscopic plants).
Why Monitor Chlorophyll a? Chlorophyll a is measured to estimate the abundance of algae and phytoplankton in the water. Since chlorophyll a concentrations can vary among algal species and with differing light conditions, chlorophyll a is not considered a precise measurement of the abundance of algae. Large amounts of chlorophyll a indicate algal blooms that are caused by excessive nutrients as discussed in Chapter 6. In lakes, chlorophyll a can be used to evaluate the trophic (aging) status of the lake. As lakes “age”, the amount of plant and algal life that the lake can support increases as nutrients are added. Nutrients introduced from human activities can lead to an excessive amount of plant and algal life, which decreases water clarity and leads to interference with recreational activities and decreased dissolved oxygen levels as the plants decay.
What Do Your Chlorophyll a Results Mean? The Department of Environmental Quality (DEQ) has begun to monitor for chlorophyll a suspended in the water column at some of its chemical (ambient) water quality monitoring stations, particularly in estuarine areas. DEQ currently designates “nutrient enriched waters” where there is degradation due to excessive nutrients. For tidal fresh waters, estuaries and lakes, the screening value for chlorophyll a is 50 ug/l (micrograms/liter), or 0.50 mg/l. The higher the concentration of chlorophyll a present, the more algae and phytoplankton present. Although large amounts of chlorophyll a indicate algal blooms, too little chlorophyll a may mean that not enough food is available for fish and aquatic animals.
Sample collection and test methods There are no test kits to detect chlorophyll a in the field since the pigment needs to be extracted. There are two methods available to determine the concentration of chlorophyll a in the laboratory: Spectrophotometric and Fluorometric methods. Sample Collection
Water samples for chlorophyll a analysis can be collected as grab samples (where a sample bottle is used to collect water at a particular depth) or as integrated samples (where a series of grab samples are taken at different depths and mixed together). An integrated sample may be collected by various methods: lowering a weighted sampler
Chapter 9: Chlorophyll a________________________________________________________________
_____________________________________________________________________________________ Virginia Citizen Water Quality Monitoring Program Methods Manual 9-2
that collects water as it is lowered through the water column, using a pump to collect a water sample, or using a weighted hose that is crimped to capture the water. Collecting a grab sample may be easier and less expensive; but in some situations, a single grab sample near the surface may not be representative of the algal biomass present. In shallower waters that are well-mixed, algae may be distributed evenly and a grab sample may be representative. However, in some waters algae may be distributed unevenly in the water column and an integrated sample would be preferable. Filtering the sample Concentrate the sample by filtering as soon as possible after collection. If processing must be delayed, hold samples on ice or at 4OC and protect them from exposure to light. Use opaque bottles because even brief exposures to light during the storage will alter the sample results. Samples obtained from acidic water must be processed promptly after filtration to prevent possible chlorophyll degradation due to residual acidic water on the filter. Filters from samples taken from water having a pH 7 or higher may be placed in airtight plastic bags and stored frozen for three weeks. Depth
If you decide to collect an integrated sample, you will need to decide how deep to collect the water sample. Some programs, such as the Smith Mountain Lake Water Quality Monitoring Program coordinated by Ferrum College, collect the integrated sample through the photic zone. This is the depth in the water column where enough light penetrates to allow photosynthesis to occur and is usually estimated based on Secchi disk depth (usually one to 3.5 times the Secchi depth). Please see Chapter 12 for a description of how to measure water clarity using a Secchi disk. Sampling the upper warm water (epilimnion) and transitional water layers (thermocline) may also be appropriate. The thermocline is just below the epilimnion which prevents mixing of the warm epilimnion and the cooler bottom water of a lake.
Quality Assurance/Quality Control Issues
Chlorophyll a must be analyzed in a laboratory. The laboratory needs to use EPA-approved or recognized methods and the lab SOP need to be approved by DEQ for DEQ to use the data for water quality assessment. Recommended QA/QC protocols for sample collection include:
• Proper Preservation: Samples should be filtered as soon as possible after collection. Filters can be frozen and kept in the dark for up to 21 days.
• Field duplicates: A field duplicate is simply a second water sample taken at
the same time as the first sample to measure the reproducibility of the collector, method and/or analyst. It is recommended that you collect field duplicates randomly for 10% of your samples (for a large sample size, 5% is
Chapter 9: Chlorophyll a________________________________________________________________
_____________________________________________________________________________________ Virginia Citizen Water Quality Monitoring Program Methods Manual 9-3
acceptable). For example, if you collect 50 samples, you should collect field duplicates at 5 of those sites and label the duplicate samples.
• Equipment blanks are only necessary if water samples are collected in a
bucket or other sampling device and transferred into the sample container. An equipment blank uses a chlorophyll free sample (distilled or deionized water) to check the effectiveness of cleaning procedures and for cross-contamination between sites. An equipment blank is collected and transferred in the same manner as the stream water sample. It is recommended that equipment blanks are collected randomly for 10% of your samples (for a large sample size, 5% is acceptable).
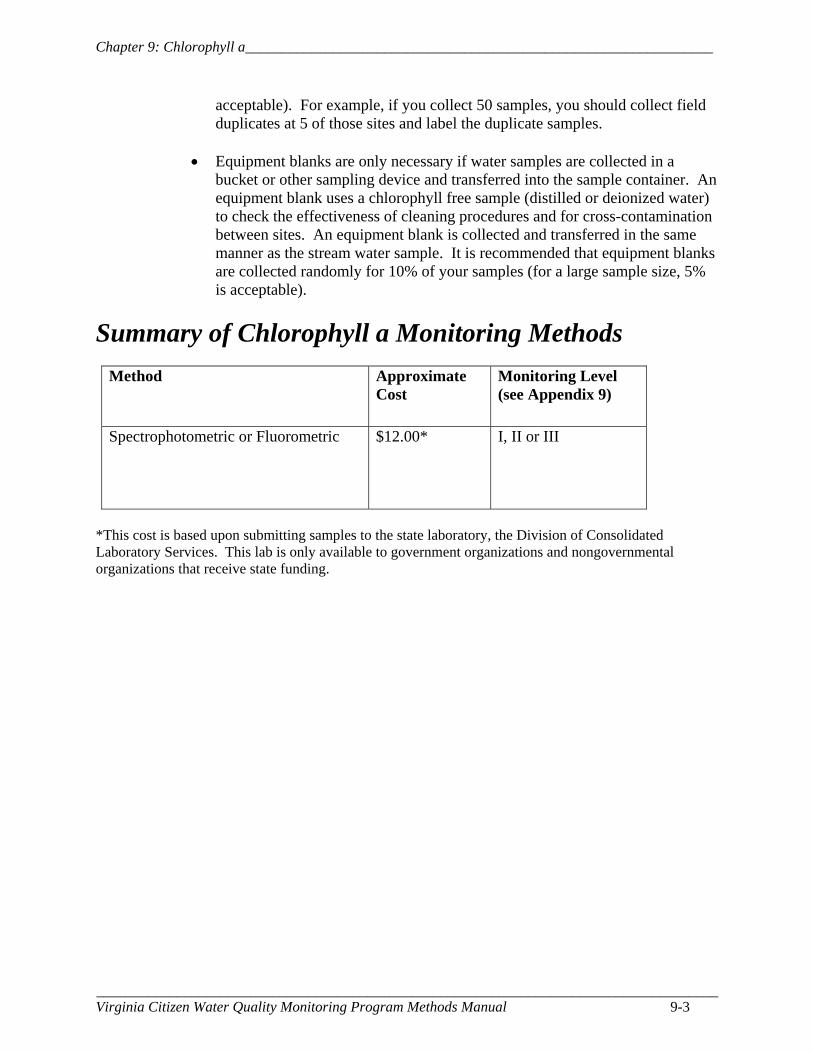
Summary of Chlorophyll a Monitoring Methods
Method Approximate Cost
Monitoring Level (see Appendix 9)
Spectrophotometric or Fluorometric $12.00* I, II or III
*This cost is based upon submitting samples to the state laboratory, the Division of Consolidated Laboratory Services. This lab is only available to government organizations and nongovernmental organizations that receive state funding.
Chapter 10 Submerged Aquatic Vegetation (SAV)
_____________________________________________________________________________________ Virginia Citizen Water Quality Monitoring Program Methods Manual 10-1
What Are Submerged Aquatic Vegetation (SAV)? Submerged aquatic vegetation are rooted vascular plants found in the waters of estuaries where the water is shallow and clear enough for sunlight to penetrate the water column so that photosynthesis can occur. SAV is completely submerged and does not include algae or floating plants. Salinity, temperature and substrate determine where each species of SAV can grow. Over the years, SAV beds have declined in the estuarine waters of the Chesapeake Bay and its tributaries. Nutrients, sediments from runoff, and herbicides cause a decline in SAV population.
Why Are SAV Important? SAV beds provide food and habitat for waterfowl, fish, shellfish, and invertebrates. Juvenile blue crabs and fish use the SAV beds for cover, while the leaves of the plants serve as attachment sites for eggs and small organisms. SAV use up excess nutrients that might contribute to eutrophication of an estuary by storing a summer pulse of nutrients for later release in the fall as the plant material decomposes. SAV beds trap sediment and reduce shoreline erosion by reducing the energy of incoming waves. Photosynthesis of SAV adds oxygen to the water.
Monitoring the Habitat Requirements for SAV
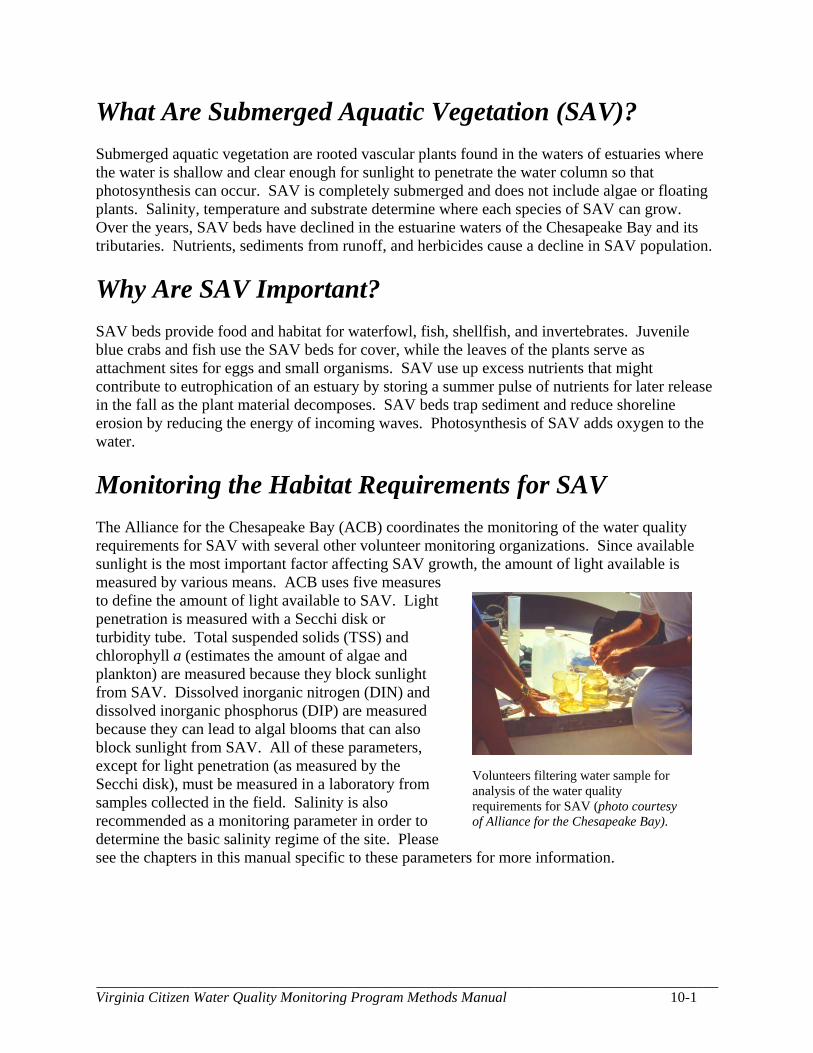
The Alliance for the Chesapeake Bay (ACB) coordinates the monitoring of the water quality requirements for SAV with several other volunteer monitoring organizations. Since available sunlight is the most important factor affecting SAV growth, the amount of light available is measured by various means. ACB uses five measures to define the amount of light available to SAV. Light penetration is measured with a Secchi disk or turbidity tube. Total suspended solids (TSS) and chlorophyll a (estimates the amount of algae and plankton) are measured because they block sunlight from SAV. Dissolved inorganic nitrogen (DIN) and dissolved inorganic phosphorus (DIP) are measured because they can lead to algal blooms that can also block sunlight from SAV. All of these parameters, except for light penetration (as measured by the Secchi disk), must be measured in a laboratory from samples collected in the field. Salinity is also recommended as a monitoring parameter in order to determine the basic salinity regime of the site. Please see the chapters in this manual specific to these parameters for more information.
Volunteers filtering water sample for analysis of the water quality requirements for SAV (photo courtesy of Alliance for the Chesapeake Bay).
_____________________________________________________________________________________ Virginia Citizen Water Quality Monitoring Program Methods Manual 10-2
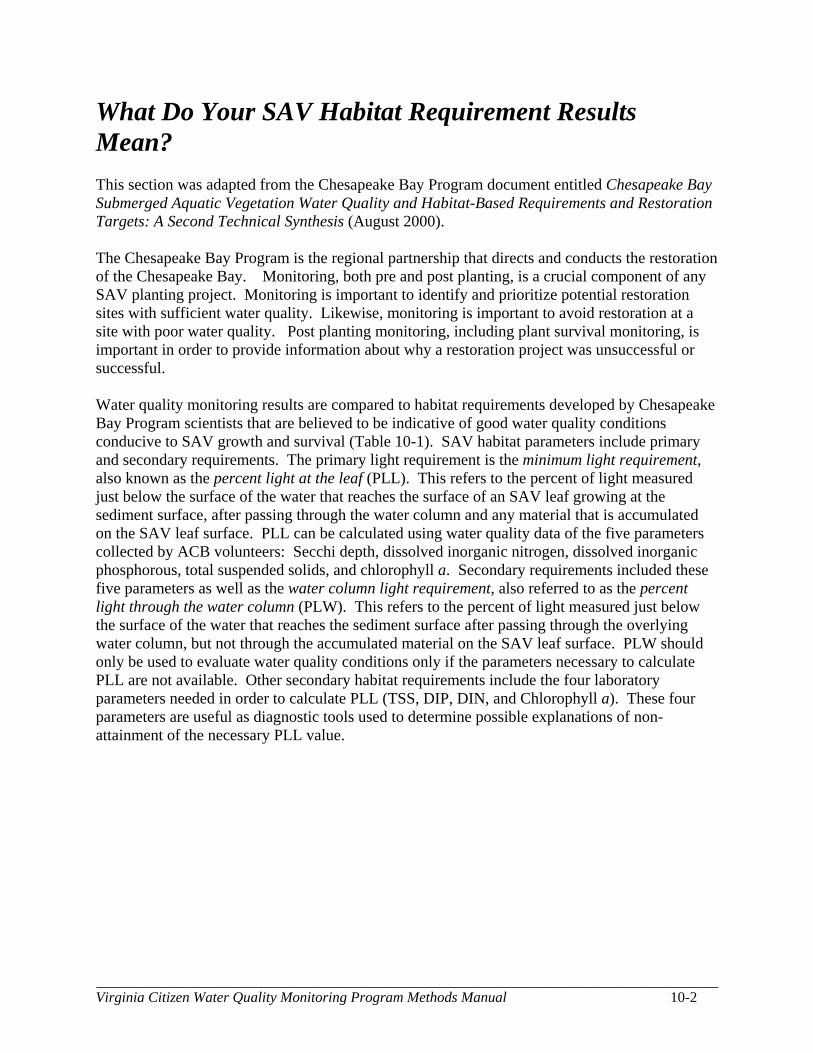
What Do Your SAV Habitat Requirement Results Mean? This section was adapted from the Chesapeake Bay Program document entitled Chesapeake Bay Submerged Aquatic Vegetation Water Quality and Habitat-Based Requirements and Restoration Targets: A Second Technical Synthesis (August 2000). The Chesapeake Bay Program is the regional partnership that directs and conducts the restoration of the Chesapeake Bay. Monitoring, both pre and post planting, is a crucial component of any SAV planting project. Monitoring is important to identify and prioritize potential restoration sites with sufficient water quality. Likewise, monitoring is important to avoid restoration at a site with poor water quality. Post planting monitoring, including plant survival monitoring, is important in order to provide information about why a restoration project was unsuccessful or successful. Water quality monitoring results are compared to habitat requirements developed by Chesapeake Bay Program scientists that are believed to be indicative of good water quality conditions conducive to SAV growth and survival (Table 10-1). SAV habitat parameters include primary and secondary requirements. The primary light requirement is the minimum light requirement, also known as the percent light at the leaf (PLL). This refers to the percent of light measured just below the surface of the water that reaches the surface of an SAV leaf growing at the sediment surface, after passing through the water column and any material that is accumulated on the SAV leaf surface. PLL can be calculated using water quality data of the five parameters collected by ACB volunteers: Secchi depth, dissolved inorganic nitrogen, dissolved inorganic phosphorous, total suspended solids, and chlorophyll a. Secondary requirements included these five parameters as well as the water column light requirement, also referred to as the percent light through the water column (PLW). This refers to the percent of light measured just below the surface of the water that reaches the sediment surface after passing through the overlying water column, but not through the accumulated material on the SAV leaf surface. PLW should only be used to evaluate water quality conditions only if the parameters necessary to calculate PLL are not available. Other secondary habitat requirements include the four laboratory parameters needed in order to calculate PLL (TSS, DIP, DIN, and Chlorophyll a). These four parameters are useful as diagnostic tools used to determine possible explanations of non-attainment of the necessary PLL value.
_____________________________________________________________________________________ Virginia Citizen Water Quality Monitoring Program Methods Manual 10-3
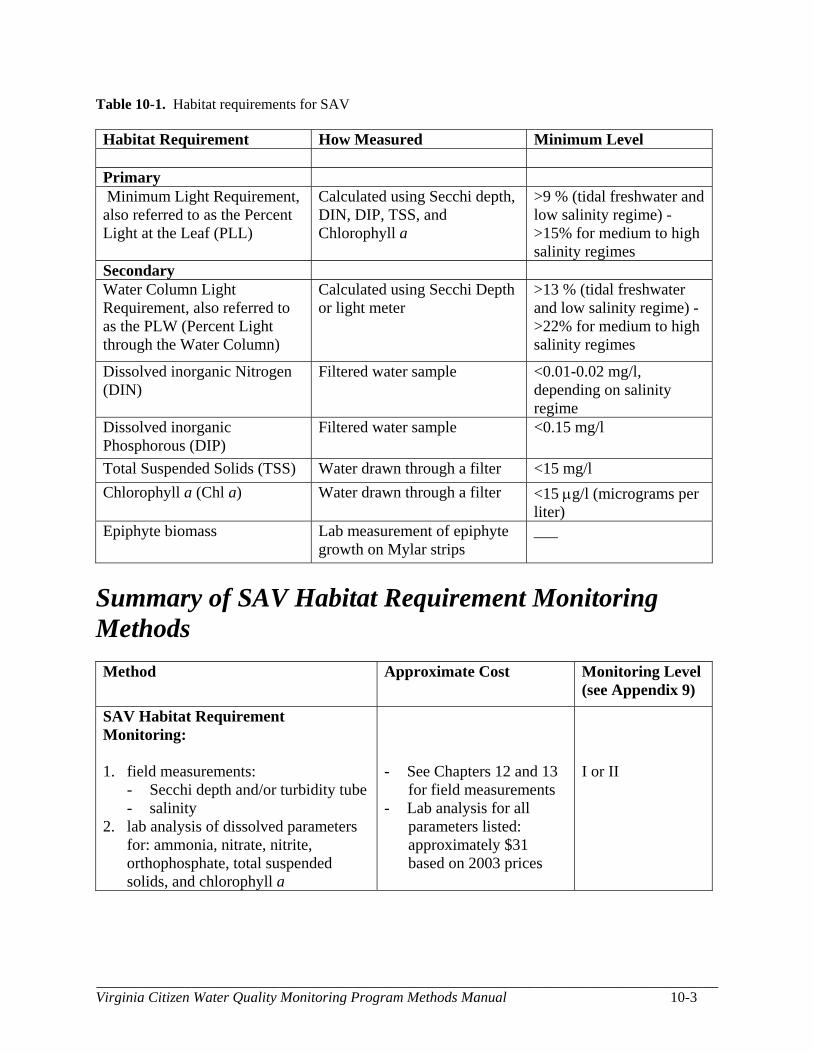
Table 10-1. Habitat requirements for SAV Habitat Requirement How Measured Minimum Level Primary Minimum Light Requirement, also referred to as the Percent Light at the Leaf (PLL)
Calculated using Secchi depth, DIN, DIP, TSS, and Chlorophyll a
>9 % (tidal freshwater and low salinity regime) ->15% for medium to high salinity regimes
Secondary Water Column Light Requirement, also referred to as the PLW (Percent Light through the Water Column)
Calculated using Secchi Depth or light meter
>13 % (tidal freshwater and low salinity regime) ->22% for medium to high salinity regimes
Dissolved inorganic Nitrogen (DIN)
Filtered water sample <0.01-0.02 mg/l, depending on salinity regime
Dissolved inorganic Phosphorous (DIP)
Filtered water sample <0.15 mg/l
Total Suspended Solids (TSS) Water drawn through a filter <15 mg/l Chlorophyll a (Chl a) Water drawn through a filter <15 μg/l (micrograms per
liter) Epiphyte biomass Lab measurement of epiphyte
growth on Mylar strips ___
Summary of SAV Habitat Requirement Monitoring Methods Method
Approximate Cost Monitoring Level (see Appendix 9)
SAV Habitat Requirement Monitoring: 1. field measurements:
- Secchi depth and/or turbidity tube - salinity
2. lab analysis of dissolved parameters for: ammonia, nitrate, nitrite, orthophosphate, total suspended solids, and chlorophyll a
- See Chapters 12 and 13
for field measurements - Lab analysis for all
parameters listed: approximately $31 based on 2003 prices
I or II
_____________________________________________________________________________________ Virginia Citizen Water Quality Monitoring Program Methods Manual 10-4
Other SAV Activities in Virginia
Since SAV are sensitive to disturbance, volunteer programs working with SAV should receive proper training and guidance from scientists or government agency representatives.
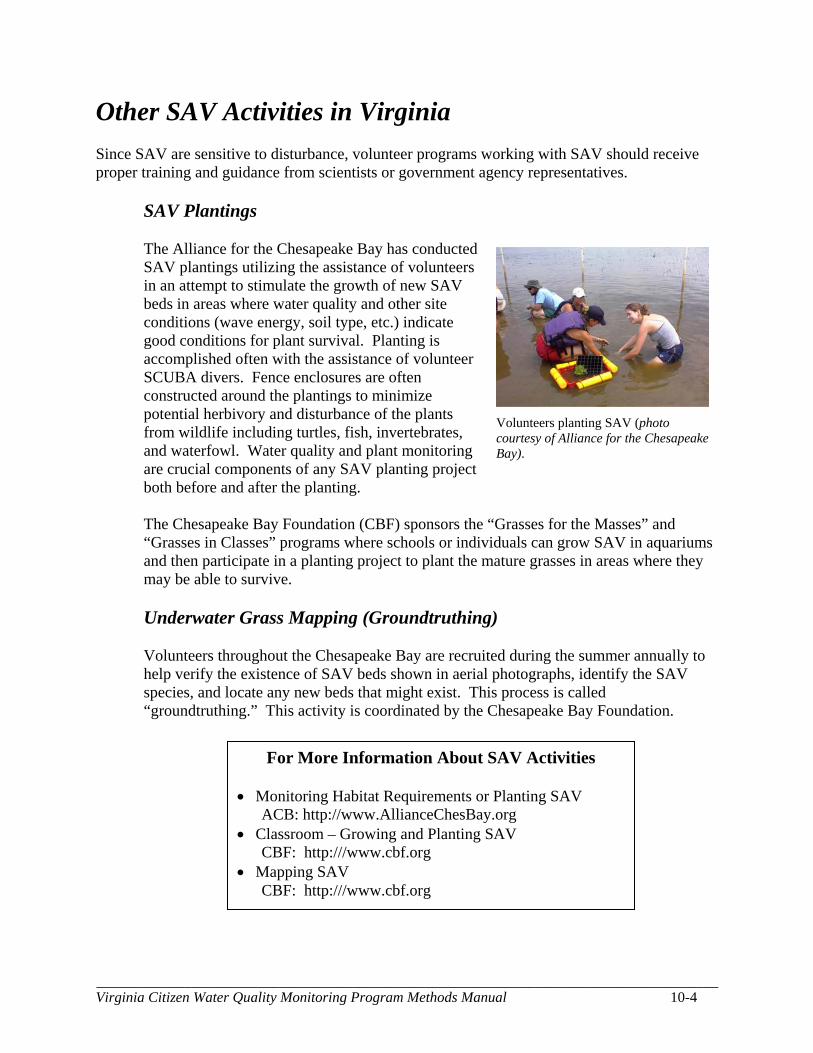
SAV Plantings The Alliance for the Chesapeake Bay has conducted SAV plantings utilizing the assistance of volunteers in an attempt to stimulate the growth of new SAV beds in areas where water quality and other site conditions (wave energy, soil type, etc.) indicate good conditions for plant survival. Planting is accomplished often with the assistance of volunteer SCUBA divers. Fence enclosures are often constructed around the plantings to minimize potential herbivory and disturbance of the plants from wildlife including turtles, fish, invertebrates, and waterfowl. Water quality and plant monitoring are crucial components of any SAV planting project both before and after the planting. The Chesapeake Bay Foundation (CBF) sponsors the “Grasses for the Masses” and “Grasses in Classes” programs where schools or individuals can grow SAV in aquariums and then participate in a planting project to plant the mature grasses in areas where they may be able to survive. Underwater Grass Mapping (Groundtruthing) Volunteers throughout the Chesapeake Bay are recruited during the summer annually to help verify the existence of SAV beds shown in aerial photographs, identify the SAV species, and locate any new beds that might exist. This process is called “groundtruthing.” This activity is coordinated by the Chesapeake Bay Foundation.
Volunteers planting SAV (photo courtesy of Alliance for the Chesapeake Bay).
For More Information About SAV Activities • Monitoring Habitat Requirements or Planting SAV
ACB: http://www.AllianceChesBay.org • Classroom – Growing and Planting SAV
CBF: http:///www.cbf.org • Mapping SAV
CBF: http:///www.cbf.org