section 2.3 quadratic functions. d efinition a quadratic function is a function of the form f(x) =...
TRANSCRIPT
SECTION 2.3Quadratic Functions

Definition
A quadratic function is a function of the form
f(x) = ax2 + bx + c
Where a, b, and c are real numbers with a ≠ 0
The domain of a quadratic function is (-∞, ∞)

Example
Graph each of the following quadratic functions. Find the zeros of each function and the x- and y-intercepts of each graph, if any exist.
From the graph, determine the domain and range of each function, list the intervals on which the function is increasing, decreasing, or constant and find the relative and absolute extrema, if they exist
1. f(x) = x2 - 4x + 32. g(x) = -2(x – 3)2 + 1

Solution
1. 2.

Graphs of quadratic equations
1. The graph of y = ax2 + bx + c where a, b, and c are real numbers with a ≠ 0 is called a parabola
2. The coefficient of x2, a, positive, the parabola opens upwards negative, it opens downwards
3. The point at which the relative minimum (a > 0) or relative maximum (a < 0) occurs is called the vertex of the parabola
4. The parabolas are symmetric about the dashed vertical line which contains its vertex (axis of symmetry)

Vertex Formulas for Quadratic Functions
Suppose a, b, c, h, and k are real numbers with a ≠ 0
If f(x) = a(x - h)2 + k (standard form), the vertex of the graph of y = f(x) is the point (h,k)
If f(x) = ax2 + bx + c (general form), the vertex of the graph of y = f(x) is the point
Example: Find the vertex of the graphs 1. f(x) = x2 - 4x + 32. g(x) = -2(x – 3)2 + 1
a
bf
a
b
2,
2
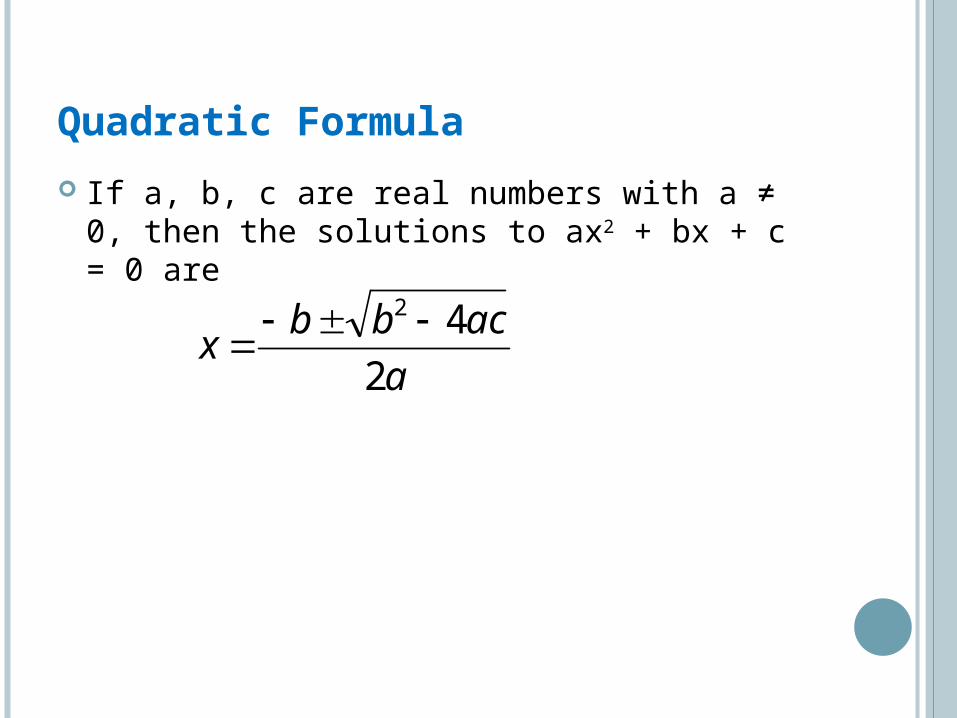
Quadratic Formula
If a, b, c are real numbers with a ≠ 0, then the solutions to ax2 + bx + c = 0 are
a
acbbx
2
42

Example The profit function for a product is defined by the equation Profit = Revenue-Cost, or P(x) = R(x) - C(x)
The weekly revenue, in dollars, made by selling x PortaBoy Game Systems is given by R(x) = -1.5x2 + 250x
The cost, in dollars, to produce x PortaBoy Game Systems is given as C(x) = 80x + 150, x ≥ 0
Determine the weekly profit function, P(x) Graph y = P(x). Include the x- and y-intercepts as well as the vertex and axis of symmetry
Interpret the zeros of P Interpret the vertex of the graph of y = P(x) Recall the weekly price-demand equation for PortaBoys is: p(x) = -1.5x+250, where p(x) is the price per PortaBoy, in dollars, and x is the weekly sales. What should the price per system be in order to maximize profit?

Example
Graph f(x) = |x2 - x - 6|