section 13 draft 2 06-26-07 - water.ca.gov062607).pdfsectionthirteen risk analysis 2005 base year...
TRANSCRIPT
SECTIONTHIRTEEN Risk Analysis 2005 Base Year Results
Y:\DRMS\PUBLIC DRAFT\RISK ANALYSIS REPORT\SECTION 13\SECTION 13 DRAFT 2 (06-26-07).DOC\26-JUN-07\\ 13-1
13. Section 13 THIRTEEN Risk Analysis 2005 Base Year Results
This section presents the risk analysis results considering levee failures in the Delta and Suisun Marsh study area initiated by the several hazards addressed by DRMS for the 2005 base year and under business-as-usual (BAU) conditions.
13.1 INTRODUCTION The previous sections described the risk modules (seismic, flood, levee vulnerability, etc.), their characterization of the physical process, the approach used to develop the numerical model, and the module products for use in the risk analysis. Section 4 describes the risk analysis approach used to integrate the various module outcomes. The results presented in this section represent the sequences of events, system response to the events, and the resulting consequences as described below:
• Hazards – Seismic, floods, wind and wave, and high tide / normal day / sunny day occurrences.
• Levee Vulnerability and Potential Failure – Liquefaction, instability, seepage, overtopping.
• Emergency Response and Repair – Particularly the order and rate of progress for repairs, including rate of erosion of flooded islands.
• Salinity Impacts – The intrusion of bay salinity in response to the event and progress in returning toward normal conditions over the repair period.
• Consequences – Public safety, environmental and economic impacts.
Each of these topics was addressed in its respective technical memorandum. Summaries of the model concepts, analytical approaches and module outputs that enter into the risk model were provided in the previous sections.
The purpose of this section is to present the results of the analyses in terms of risks inherent from the various hazards – a) the potential for island flooding, both combined and individually and b) the consequences of that flooding. To do so, the section begins with flooding potential due to risks from:
• Sunny day failures
• Seismic events
• Floods
• The combined risk of inundation from all hazards.
After the likelihood of flooding is presented, the results from analyzing the consequences of flooding from various causes are discussed. For each type of hazard event (sunny day, seismic, and flood) and for all hazards combined, the following are addressed:
• Economic Consequences
• Ecosystem Consequences
• Public Health and Safety Consequences.

SECTIONTHIRTEEN Risk Analysis 2005 Base Year Results
Y:\DRMS\PUBLIC DRAFT\RISK ANALYSIS REPORT\SECTION 13\SECTION 13 DRAFT 2 (06-26-07).DOC\26-JUN-07\\ 13-2
13.2 ISLAND FLOODING POTENTIAL The potential for island inundation is presented for each causative event – sunny day, seismic and hydrologic (floods). Within each, two perspectives are adopted, one considering possible outcomes from single events, including the prospect of multiple failures from the event, and the other looking at flooding potential on an island-by-island basis, not considering what may be occurring on other islands.
13.2.1 Sunny-Day Risk As described in Section 9, the risk of sunny day failures, usually associated with high tides, is developed principally from historic observations. By definition, sunny day failures occur only in the late spring, summer and early fall (i.e., during the low-flow season). The expected frequencies of island failures, during sunny-day conditions, are summarized in Table 13-1. The results were compiled for the islands and tracts within the MHHW boundary. There are about 911 miles of Delta Levees and approximately 75 miles of exterior levees in Suisun Marsh within the MHHW boundary. The expected annual frequency of historical breaches is about 1.18x10⁻⁴ /year/levee mile or 0.107 failures/year in the Delta and 4.76 x10⁻⁴ /year/levee mile or 0.036 failures/year for Suisun Marsh. These rates are applied uniformly to all levees within the MHHW boundary in the respective areas.
In other terms, it is expected that on average there will be about 5.4 sunny-day breaches with 50 years of exposure or 10.7 breaches with 100 years of exposure in the Delta, and 1.8 sunny-day breaches with 50 years or 3.6 breaches with100 years of exposure in Suisun Marsh.
Sunny day failures are assumed to occur one island at a time. Thus, for 2005 base case conditions, the frequency of two or more sunny day failures occurring during the same sunny-day, high-tide event is assumed to be insignificant. Further, it is judged that the likelihood of increased seepage on adjacent islands leading to a levee breach resulting in additional island flooding is small.
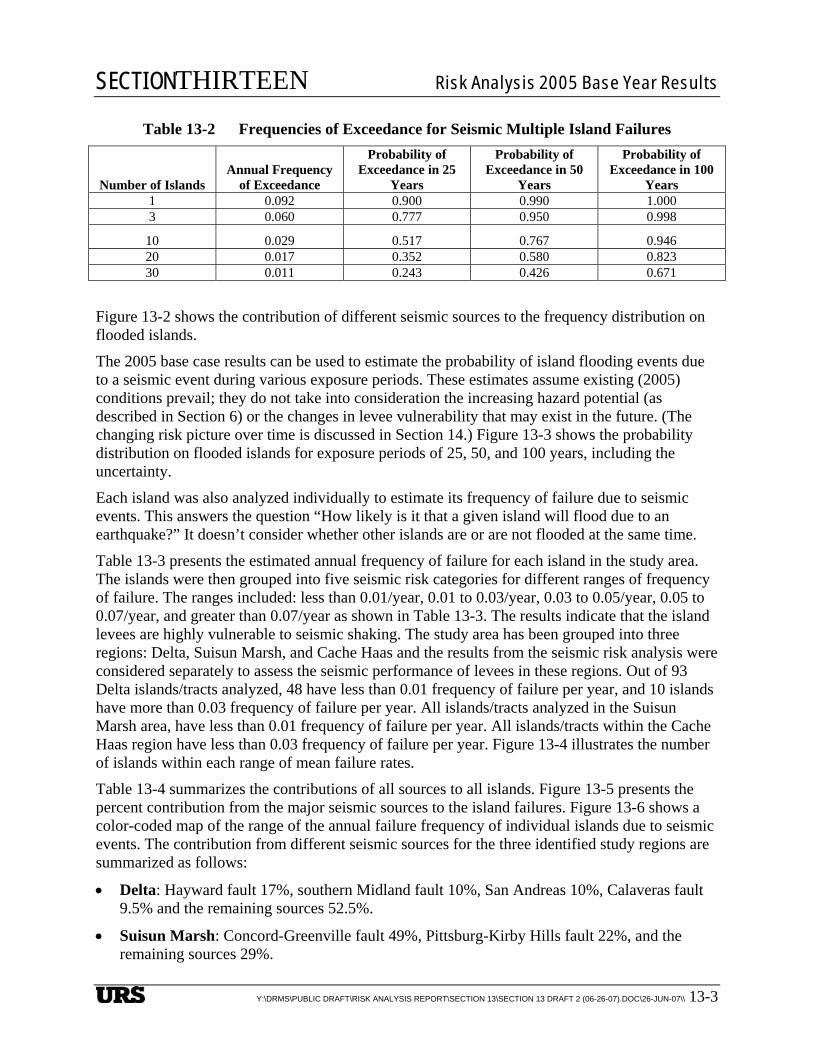
13.2.2 Seismic Risk When an earthquake occurs, all Delta/Suisun levees may be subject to dynamic loading and potential failure within several minutes – essentially simultaneously. If an earthquake is strong enough to cause the failure of one island, it is likely that other islands with the same or higher vulnerability would also fail. Thus, a strong earthquake impacting the study area could cause levee failures on several islands and there is a real prospect of multiple islands flooding at the same time. Figure 13-1 shows the frequency distribution on the number of islands that may fail simultaneously due to a seismic event in or in the vicinity of the Delta and Suisun Marsh. The figure shows the mean frequency of exceedance and the estimate of uncertainty calculated from the uncertainty in the ground motion hazard and the levee fragility uncertainties (which were discussed in more detail in Section 6). The figure shows the results summarized below in Table 13-2.
SECTIONTHIRTEEN Risk Analysis 2005 Base Year Results
Y:\DRMS\PUBLIC DRAFT\RISK ANALYSIS REPORT\SECTION 13\SECTION 13 DRAFT 2 (06-26-07).DOC\26-JUN-07\\ 13-3
Table 13-2 Frequencies of Exceedance for Seismic Multiple Island Failures
Number of Islands Annual Frequency
of Exceedance
Probability of Exceedance in 25
Years
Probability of Exceedance in 50
Years
Probability of Exceedance in 100
Years 1 0.092 0.900 0.990 1.000 3 0.060 0.777 0.950 0.998
10 0.029 0.517 0.767 0.946 20 0.017 0.352 0.580 0.823 30 0.011 0.243 0.426 0.671
Figure 13-2 shows the contribution of different seismic sources to the frequency distribution on flooded islands.
The 2005 base case results can be used to estimate the probability of island flooding events due to a seismic event during various exposure periods. These estimates assume existing (2005) conditions prevail; they do not take into consideration the increasing hazard potential (as described in Section 6) or the changes in levee vulnerability that may exist in the future. (The changing risk picture over time is discussed in Section 14.) Figure 13-3 shows the probability distribution on flooded islands for exposure periods of 25, 50, and 100 years, including the uncertainty.
Each island was also analyzed individually to estimate its frequency of failure due to seismic events. This answers the question “How likely is it that a given island will flood due to an earthquake?” It doesn’t consider whether other islands are or are not flooded at the same time.
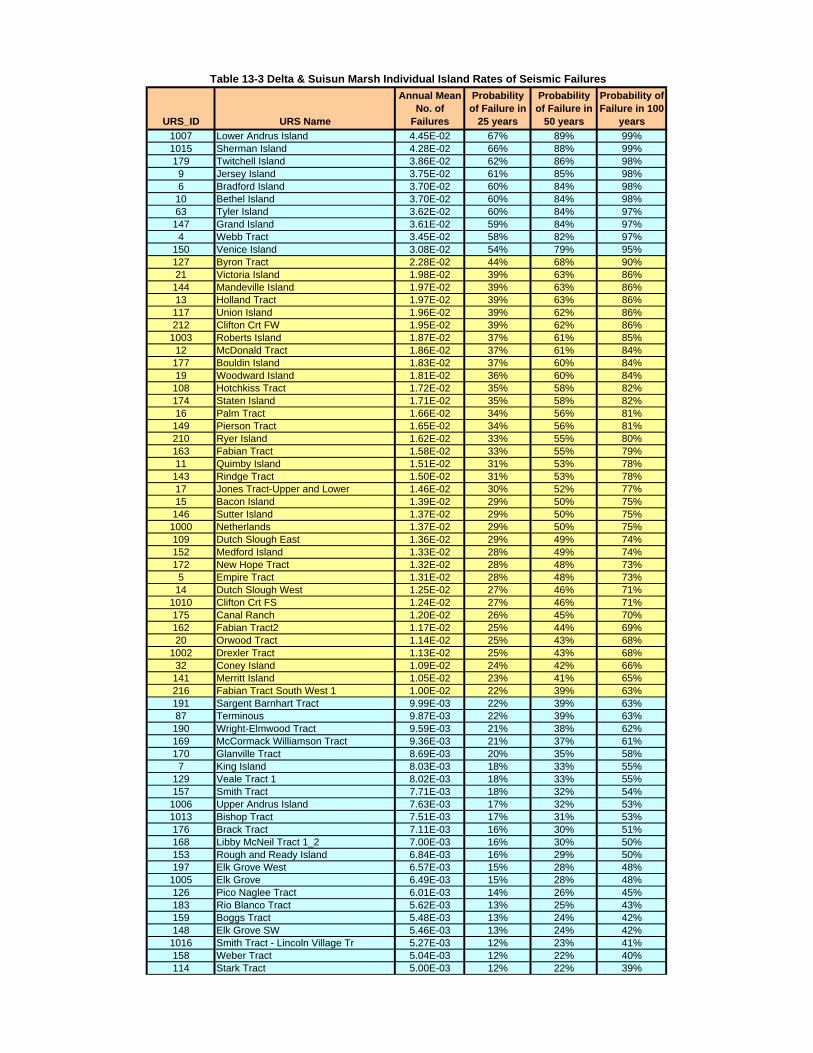
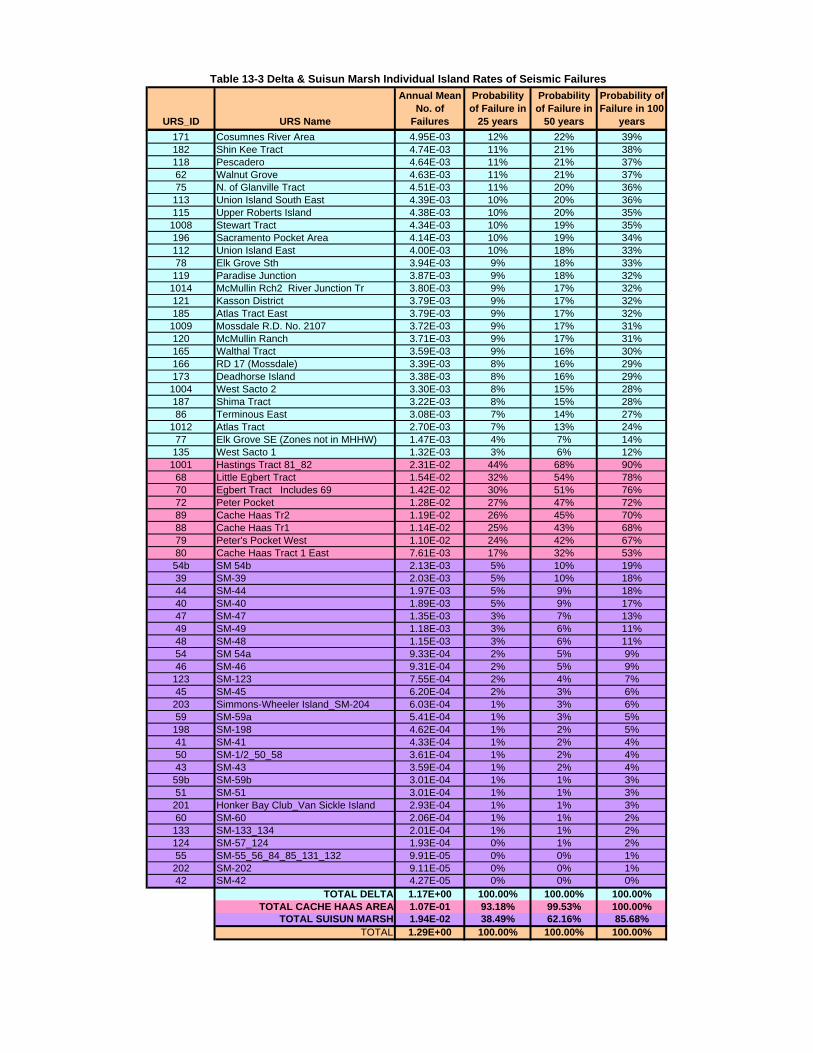
Table 13-3 presents the estimated annual frequency of failure for each island in the study area. The islands were then grouped into five seismic risk categories for different ranges of frequency of failure. The ranges included: less than 0.01/year, 0.01 to 0.03/year, 0.03 to 0.05/year, 0.05 to 0.07/year, and greater than 0.07/year as shown in Table 13-3. The results indicate that the island levees are highly vulnerable to seismic shaking. The study area has been grouped into three regions: Delta, Suisun Marsh, and Cache Haas and the results from the seismic risk analysis were considered separately to assess the seismic performance of levees in these regions. Out of 93 Delta islands/tracts analyzed, 48 have less than 0.01 frequency of failure per year, and 10 islands have more than 0.03 frequency of failure per year. All islands/tracts analyzed in the Suisun Marsh area, have less than 0.01 frequency of failure per year. All islands/tracts within the Cache Haas region have less than 0.03 frequency of failure per year. Figure 13-4 illustrates the number of islands within each range of mean failure rates.
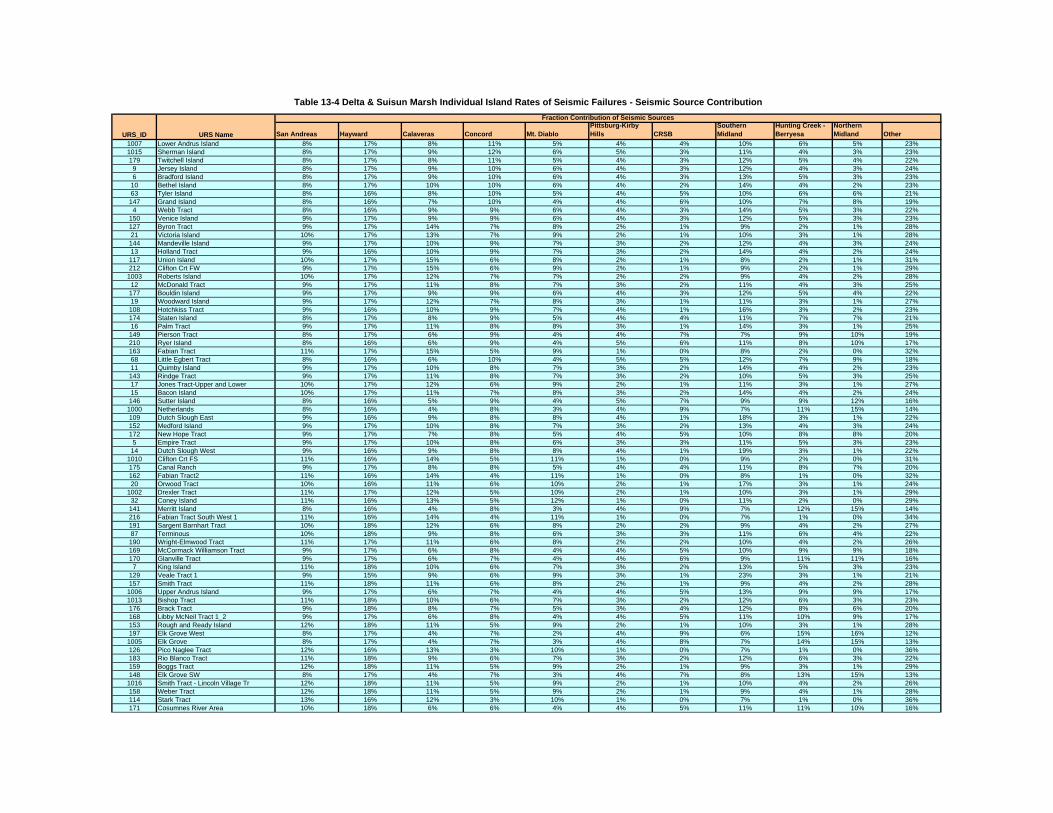
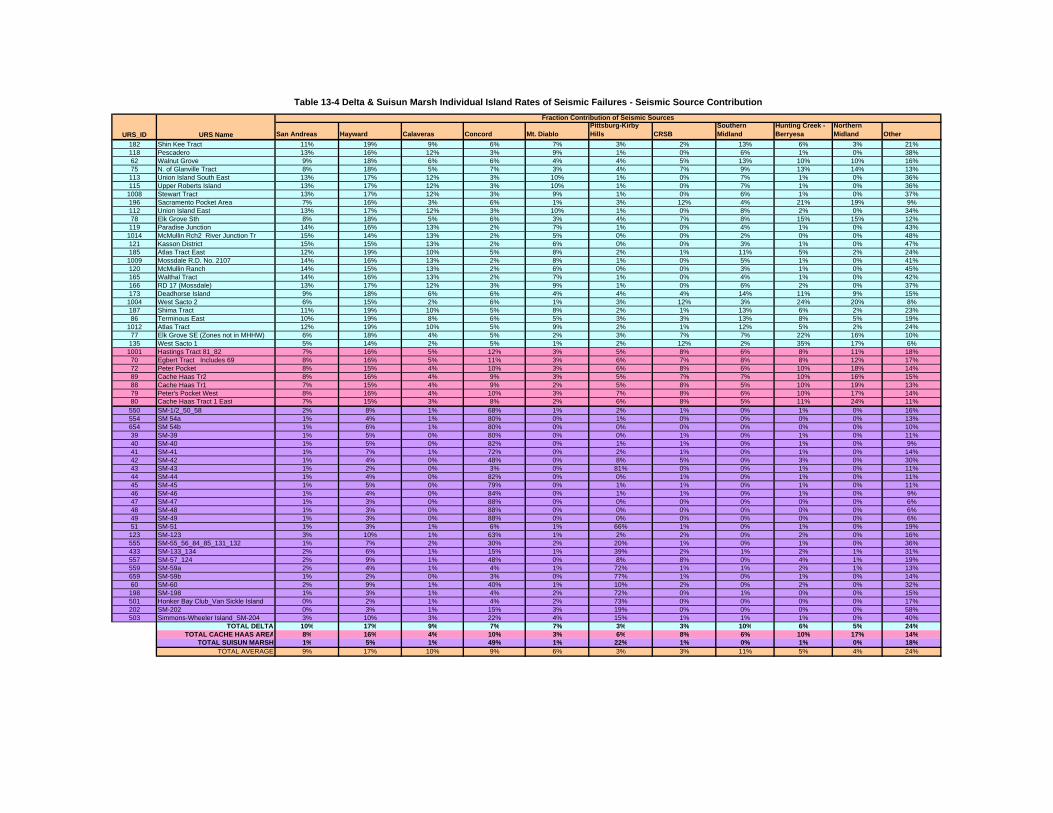
Table 13-4 summarizes the contributions of all sources to all islands. Figure 13-5 presents the percent contribution from the major seismic sources to the island failures. Figure 13-6 shows a color-coded map of the range of the annual failure frequency of individual islands due to seismic events. The contribution from different seismic sources for the three identified study regions are summarized as follows:
• Delta: Hayward fault 17%, southern Midland fault 10%, San Andreas 10%, Calaveras fault 9.5% and the remaining sources 52.5%.
• Suisun Marsh: Concord-Greenville fault 49%, Pittsburg-Kirby Hills fault 22%, and the remaining sources 29%.
SECTIONTHIRTEEN Risk Analysis 2005 Base Year Results
Y:\DRMS\PUBLIC DRAFT\RISK ANALYSIS REPORT\SECTION 13\SECTION 13 DRAFT 2 (06-26-07).DOC\26-JUN-07\\ 13-4
• Cache Haas: Northern Midland fault 17%, Hayward fault 16%, Concord-Greenville fault 10%, and the remaining sources 57%.
It is interesting note that the highest contribution for the Delta region is from the Hayward fault whereas the Concord-Greenville fault dominates the seismic contribution for the Suisun Marsh area. The reason for the strong contribution from Hayward fault for the Delta region is its maximum capable magnitudes (M>7) and the corresponding levee fragility responses. The reason for the strong contribution from the Concord-Greenville fault for the Suisun Marsh area is its close proximity to the site.
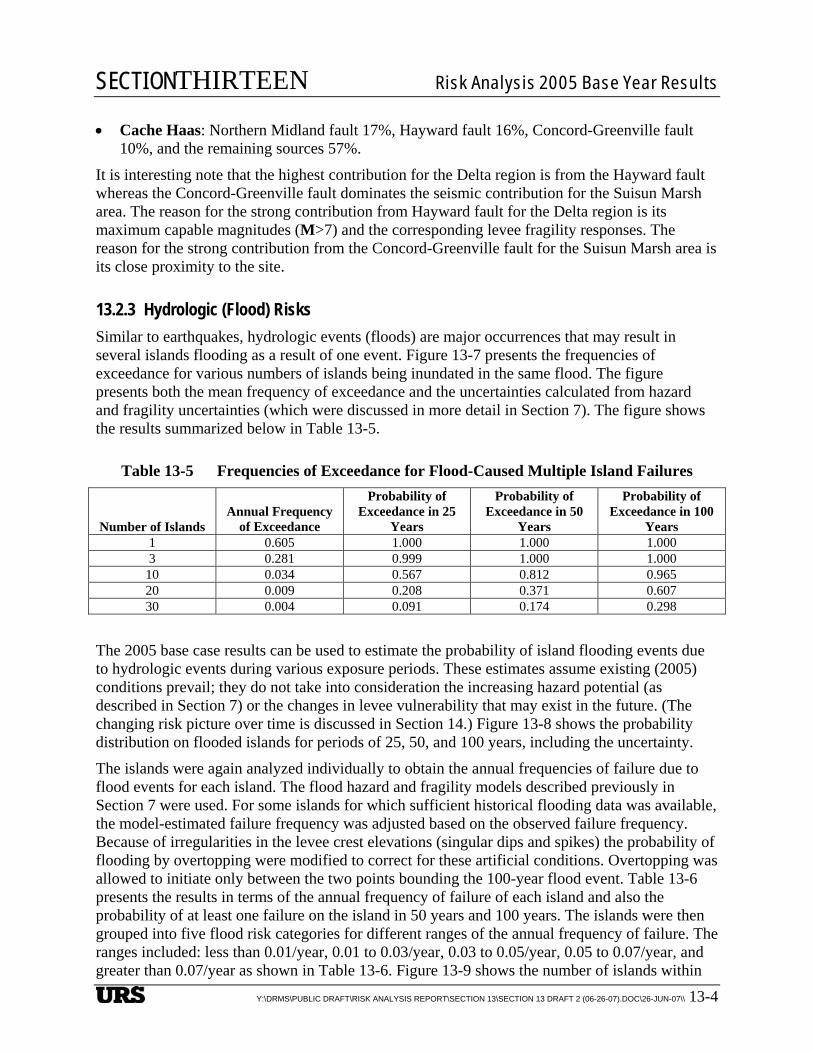
13.2.3 Hydrologic (Flood) Risks Similar to earthquakes, hydrologic events (floods) are major occurrences that may result in several islands flooding as a result of one event. Figure 13-7 presents the frequencies of exceedance for various numbers of islands being inundated in the same flood. The figure presents both the mean frequency of exceedance and the uncertainties calculated from hazard and fragility uncertainties (which were discussed in more detail in Section 7). The figure shows the results summarized below in Table 13-5.
Table 13-5 Frequencies of Exceedance for Flood-Caused Multiple Island Failures
Number of Islands Annual Frequency
of Exceedance
Probability of Exceedance in 25
Years
Probability of Exceedance in 50
Years
Probability of Exceedance in 100
Years 1 0.605 1.000 1.000 1.000 3 0.281 0.999 1.000 1.000
10 0.034 0.567 0.812 0.965 20 0.009 0.208 0.371 0.607 30 0.004 0.091 0.174 0.298
The 2005 base case results can be used to estimate the probability of island flooding events due to hydrologic events during various exposure periods. These estimates assume existing (2005) conditions prevail; they do not take into consideration the increasing hazard potential (as described in Section 7) or the changes in levee vulnerability that may exist in the future. (The changing risk picture over time is discussed in Section 14.) Figure 13-8 shows the probability distribution on flooded islands for periods of 25, 50, and 100 years, including the uncertainty.
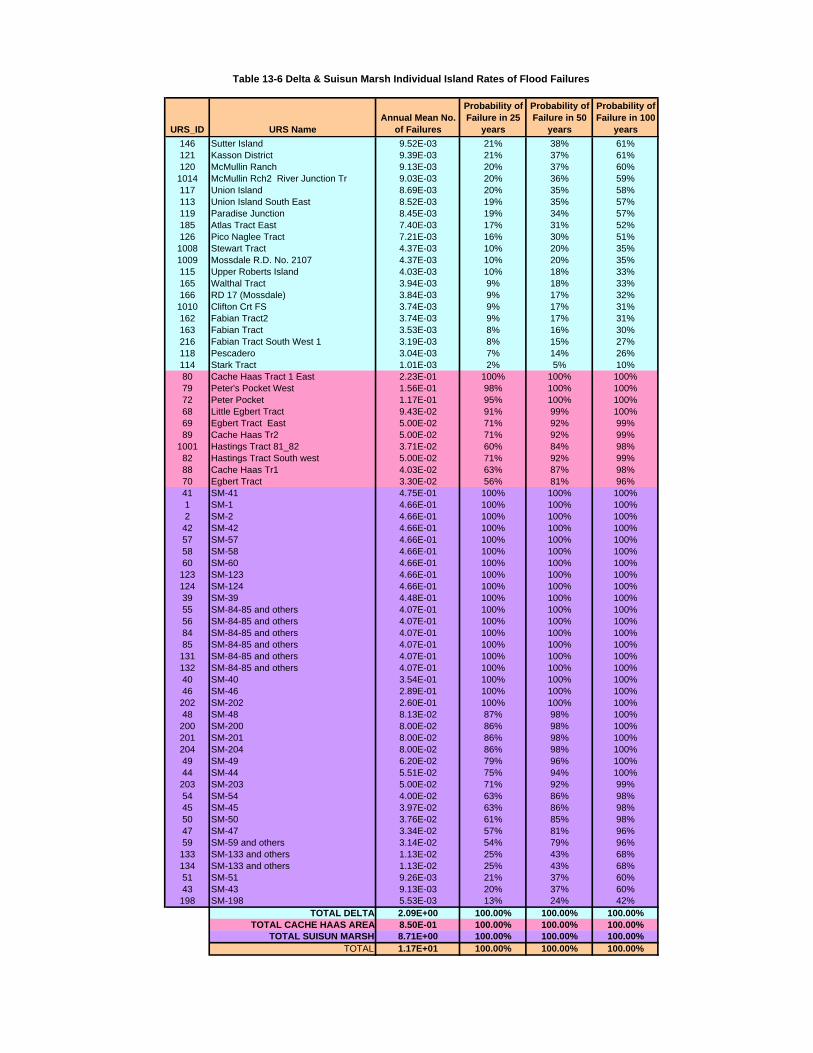
The islands were again analyzed individually to obtain the annual frequencies of failure due to flood events for each island. The flood hazard and fragility models described previously in Section 7 were used. For some islands for which sufficient historical flooding data was available, the model-estimated failure frequency was adjusted based on the observed failure frequency. Because of irregularities in the levee crest elevations (singular dips and spikes) the probability of flooding by overtopping were modified to correct for these artificial conditions. Overtopping was allowed to initiate only between the two points bounding the 100-year flood event. Table 13-6 presents the results in terms of the annual frequency of failure of each island and also the probability of at least one failure on the island in 50 years and 100 years. The islands were then grouped into five flood risk categories for different ranges of the annual frequency of failure. The ranges included: less than 0.01/year, 0.01 to 0.03/year, 0.03 to 0.05/year, 0.05 to 0.07/year, and greater than 0.07/year as shown in Table 13-6. Figure 13-9 shows the number of islands within
SECTIONTHIRTEEN Risk Analysis 2005 Base Year Results
Y:\DRMS\PUBLIC DRAFT\RISK ANALYSIS REPORT\SECTION 13\SECTION 13 DRAFT 2 (06-26-07).DOC\26-JUN-07\\ 13-5
each range of the annual failure frequency. Similar to the seismic case, the study area has been grouped into three regions: Delta, Suisun Marsh, and Cache Haas and the results from the flood risk analysis were considered separately to assess the performance of levees during and after flooding in these regions. Out of 92 Delta islands/tracts analyzed, 48 have less than 0.01 frequency of failure per year, and 14 islands have more than 0.05 frequency of failure per year. Note that only one island, Venice Island, has greater than 0.07 frequency of failure per year. In general, islands/tracts analyzed both in the Suisun Marsh and Cache Haas areas, have greater than 0.07 frequency of failure per year. The levees in these two study regions are relatively short in height and therefore overtop at low return period of flooding. All islands/tracts within the Cache Haas region have less than 0.03 frequency of failure per year. Figure 13-10a shows a color-coded map of the range of the annual failure frequency of individual islands due to hydrologic (flood) events. Figure 13-10b shows a comparable map of historical flooding failures.
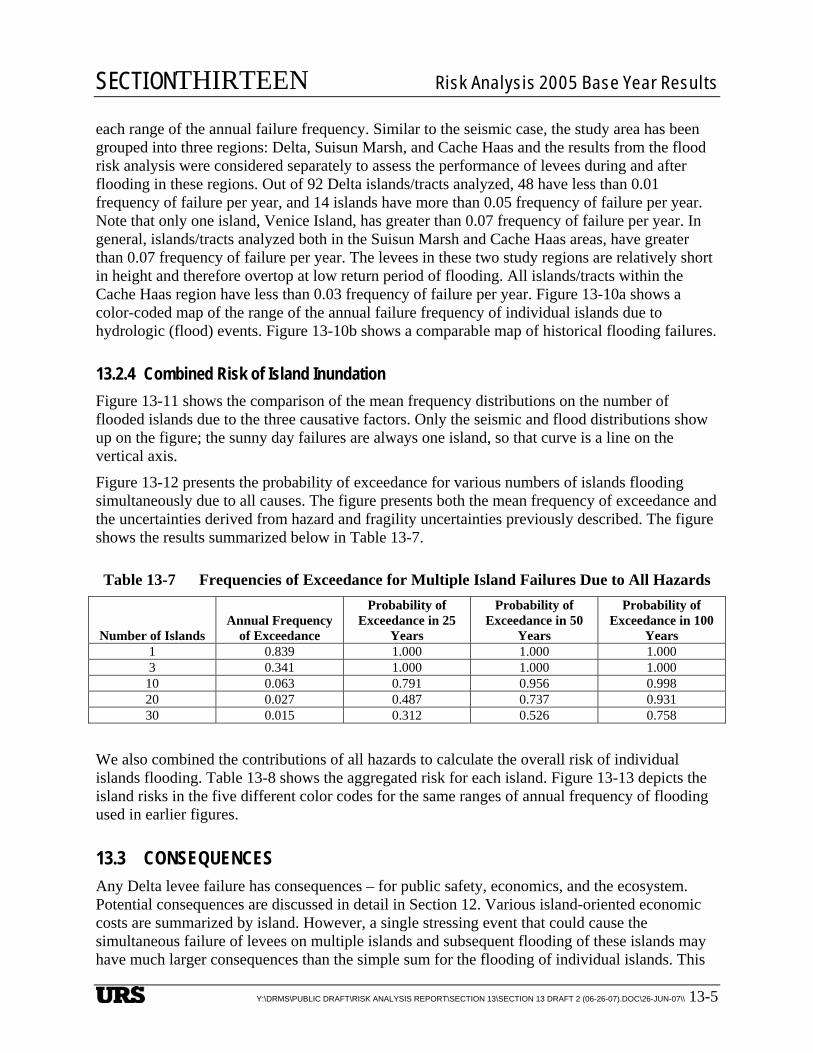
13.2.4 Combined Risk of Island Inundation Figure 13-11 shows the comparison of the mean frequency distributions on the number of flooded islands due to the three causative factors. Only the seismic and flood distributions show up on the figure; the sunny day failures are always one island, so that curve is a line on the vertical axis.
Figure 13-12 presents the probability of exceedance for various numbers of islands flooding simultaneously due to all causes. The figure presents both the mean frequency of exceedance and the uncertainties derived from hazard and fragility uncertainties previously described. The figure shows the results summarized below in Table 13-7.
Table 13-7 Frequencies of Exceedance for Multiple Island Failures Due to All Hazards
Number of Islands Annual Frequency
of Exceedance
Probability of Exceedance in 25
Years
Probability of Exceedance in 50
Years
Probability of Exceedance in 100
Years 1 0.839 1.000 1.000 1.000 3 0.341 1.000 1.000 1.000
10 0.063 0.791 0.956 0.998 20 0.027 0.487 0.737 0.931 30 0.015 0.312 0.526 0.758
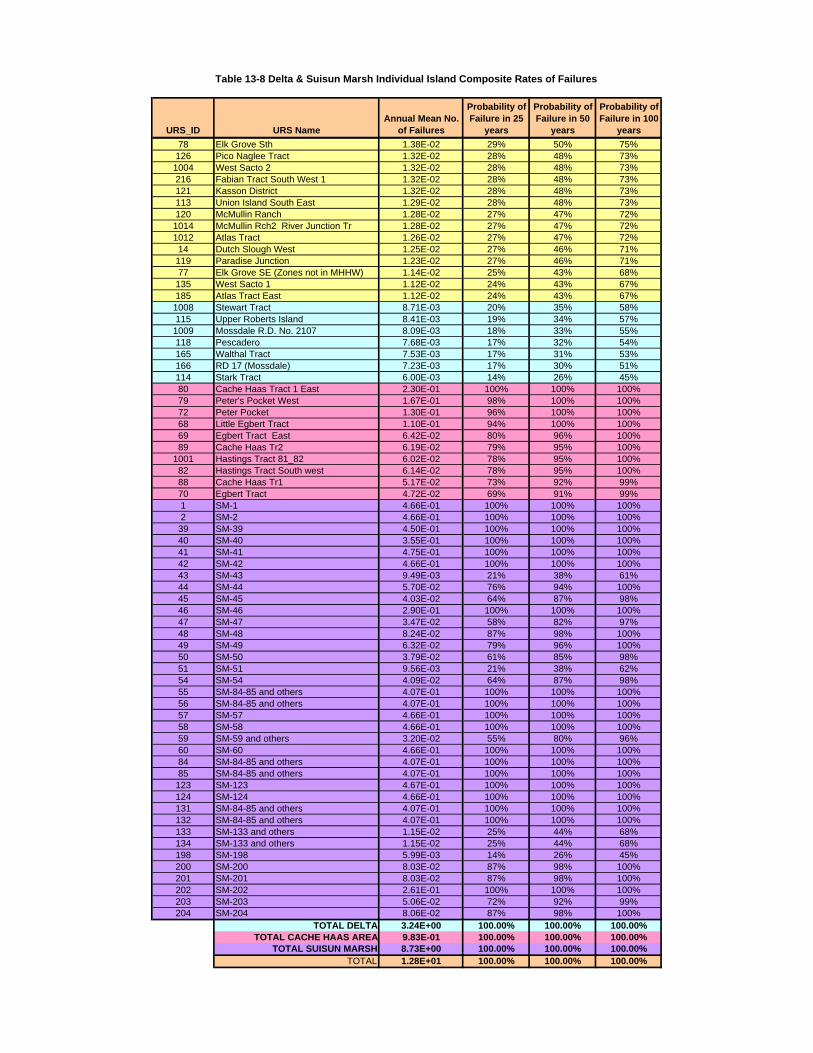
We also combined the contributions of all hazards to calculate the overall risk of individual islands flooding. Table 13-8 shows the aggregated risk for each island. Figure 13-13 depicts the island risks in the five different color codes for the same ranges of annual frequency of flooding used in earlier figures.
13.3 CONSEQUENCES Any Delta levee failure has consequences – for public safety, economics, and the ecosystem. Potential consequences are discussed in detail in Section 12. Various island-oriented economic costs are summarized by island. However, a single stressing event that could cause the simultaneous failure of levees on multiple islands and subsequent flooding of these islands may have much larger consequences than the simple sum for the flooding of individual islands. This

SECTIONTHIRTEEN Risk Analysis 2005 Base Year Results
Y:\DRMS\PUBLIC DRAFT\RISK ANALYSIS REPORT\SECTION 13\SECTION 13 DRAFT 2 (06-26-07).DOC\26-JUN-07\\ 13-6
section considers the range of potential consequences and, especially, the escalation of consequences in multi-island events.
13.3.1 Seismic Consequences Six representative failure scenarios were defined ranging from 1 to 30 islands that would be flooded simultaneously during the same seismic event. The scenarios cover a broad range of Delta-Suisun wide consequences under different seismic events. Table 13-9 summarizes the key characteristics of the six scenarios in terms of the number of islands flooded and the number of islands damaged, but not-flooded, and Figure 13-14 through 13-19 show the location of the selected islands. Each of these scenarios was analyzed under three different water year types – wet, average, and dry – to assess the variation in the resulting risk due to different hydrological conditions. The examples were chosen from the hydrological record of past 82 years. Different starting months were chosen for each water year type to provide a sense of how consequences may vary for different timings of the seismic event. Table 13-9 shows the event month and the historical hydrological year for each failure scenario.
Emergency Levee Response and Repair The duration and cost of levee repairs rise as the number of islands flooded in a seismic event increase, as indicated in Table 13-10a. Emergency repairs are estimated to take five years or more for 20 flooded islands and more than 6.5 years for 30 flooded islands. Repairs can cost billions of dollars.
Table 13-10a Duration and Cost of Repair for Seismic Cases Seismic
Case Number of
Flooded Islands Duration of
Repairs (months) Cost of
Repairs ($billion) 1 1 Up to 20 Up to 0.6 2 3 19 0.9 3 3 23 2.1 4 10 45 4.0 5 20 62 6.2 6 30 81 8.4
Export Disruption When a levee breach occurs during the late spring, summer or early fall, saline water from Suisun Bay will usually be drawn into the Delta and the flooded islands. Water might not be of adequate quality use by the State and Federal water projects, Contra Costa Water District and in-Delta users. As shown in Table 13-10b, pumping could be stopped for several months, depending on the number of flooded islands, the timing of the earthquake and the wetness or dryness of hydrologic conditions. The disruptions shown in Table 13-10b are due only to salinity.
SECTIONTHIRTEEN Risk Analysis 2005 Base Year Results
Y:\DRMS\PUBLIC DRAFT\RISK ANALYSIS REPORT\SECTION 13\SECTION 13 DRAFT 2 (06-26-07).DOC\26-JUN-07\\ 13-7
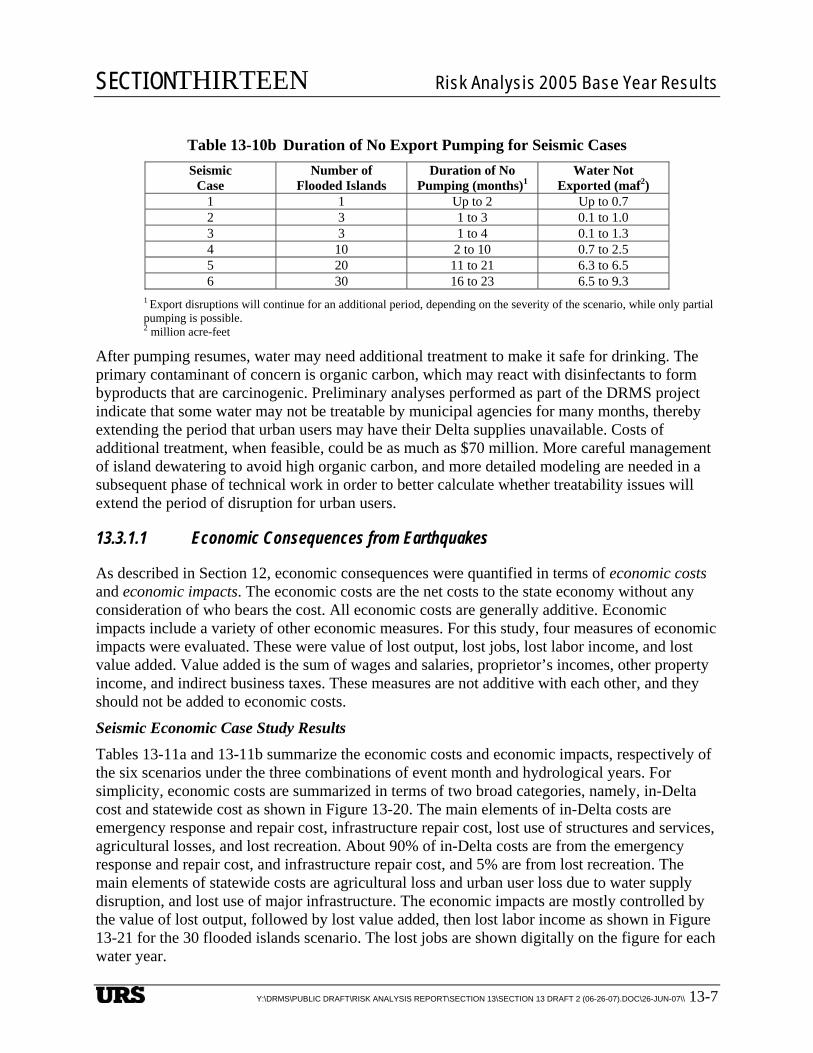
Table 13-10b Duration of No Export Pumping for Seismic Cases Seismic
Case Number of
Flooded Islands Duration of No
Pumping (months)1 Water Not
Exported (maf2) 1 1 Up to 2 Up to 0.7 2 3 1 to 3 0.1 to 1.0 3 3 1 to 4 0.1 to 1.3 4 10 2 to 10 0.7 to 2.5 5 20 11 to 21 6.3 to 6.5 6 30 16 to 23 6.5 to 9.3
1 Export disruptions will continue for an additional period, depending on the severity of the scenario, while only partial pumping is possible. 2 million acre-feet
After pumping resumes, water may need additional treatment to make it safe for drinking. The primary contaminant of concern is organic carbon, which may react with disinfectants to form byproducts that are carcinogenic. Preliminary analyses performed as part of the DRMS project indicate that some water may not be treatable by municipal agencies for many months, thereby extending the period that urban users may have their Delta supplies unavailable. Costs of additional treatment, when feasible, could be as much as $70 million. More careful management of island dewatering to avoid high organic carbon, and more detailed modeling are needed in a subsequent phase of technical work in order to better calculate whether treatability issues will extend the period of disruption for urban users.
13.3.1.1 Economic Consequences from Earthquakes
As described in Section 12, economic consequences were quantified in terms of economic costs and economic impacts. The economic costs are the net costs to the state economy without any consideration of who bears the cost. All economic costs are generally additive. Economic impacts include a variety of other economic measures. For this study, four measures of economic impacts were evaluated. These were value of lost output, lost jobs, lost labor income, and lost value added. Value added is the sum of wages and salaries, proprietor’s incomes, other property income, and indirect business taxes. These measures are not additive with each other, and they should not be added to economic costs.
Seismic Economic Case Study Results Tables 13-11a and 13-11b summarize the economic costs and economic impacts, respectively of the six scenarios under the three combinations of event month and hydrological years. For simplicity, economic costs are summarized in terms of two broad categories, namely, in-Delta cost and statewide cost as shown in Figure 13-20. The main elements of in-Delta costs are emergency response and repair cost, infrastructure repair cost, lost use of structures and services, agricultural losses, and lost recreation. About 90% of in-Delta costs are from the emergency response and repair cost, and infrastructure repair cost, and 5% are from lost recreation. The main elements of statewide costs are agricultural loss and urban user loss due to water supply disruption, and lost use of major infrastructure. The economic impacts are mostly controlled by the value of lost output, followed by lost value added, then lost labor income as shown in Figure 13-21 for the 30 flooded islands scenario. The lost jobs are shown digitally on the figure for each water year.
SECTIONTHIRTEEN Risk Analysis 2005 Base Year Results
Y:\DRMS\PUBLIC DRAFT\RISK ANALYSIS REPORT\SECTION 13\SECTION 13 DRAFT 2 (06-26-07).DOC\26-JUN-07\\ 13-8
For case studies involving significant water supply disruption, about 80% of the total statewide costs is from urban user loss due to water supply disruption and about 15% from lost use of major infrastructure.
Seismic Economic Risk Results The results of the economic case studies presented above can be combined with the risk results presented on the mean frequency of failure for various numbers of islands. The results are shown in Figures 13-22 through 13-28. Figure 13-22 shows the mean annual frequency distribution of economic costs due to seismic events for total costs and the in-Delta and statewide components of total costs. Figure 13-23 presents the frequency distribution including uncertainty on the total economic costs including uncertainty.
13.3.1.2 Ecosystem Consequences From Earthquakes
The conceptual model developed for the effects of levee failure on aquatic species, vegetation and terrestrial wildlife sensitive species provides framework for qualitative risk analysis, displaying both beneficial and adverse effects associated with levee failure. The impacts to focal aquatic species, vegetation and terrestrial wildlife are presented in Tables 13-12 through 13-26. The ecological impacts of five different seismic levee-failure scenarios were assessed. Scenarios included levee failures on as few as two islands and as many as 30 islands. Each scenario was analyzed for three different water years consisting of a spring wet year (represented by 1927 conditions), summer average water year (1930) and fall dry water year (1972).
Aquatic Species The results below should be interpreted with an understanding of the limitations of the aquatic species analyses, which include: differences in the ability of survey data to predict density and distribution of different species in separate regions of the delta; tremendous inter-annual variation in species' abundance and distribution; and high uncertainty in population dynamics subsequent to levee failure. In addition, the results only account for factors included in the model which may not include the most important population drivers after a catastrophic levee failure.
Interpreting the aquatic results requires understanding the factors and calculations involved in creating the risk index. The risk index (see Table 13-26a) incorporates both immediate mortality as well as the long-term impacts of levee failure, which can be beneficial or adverse.
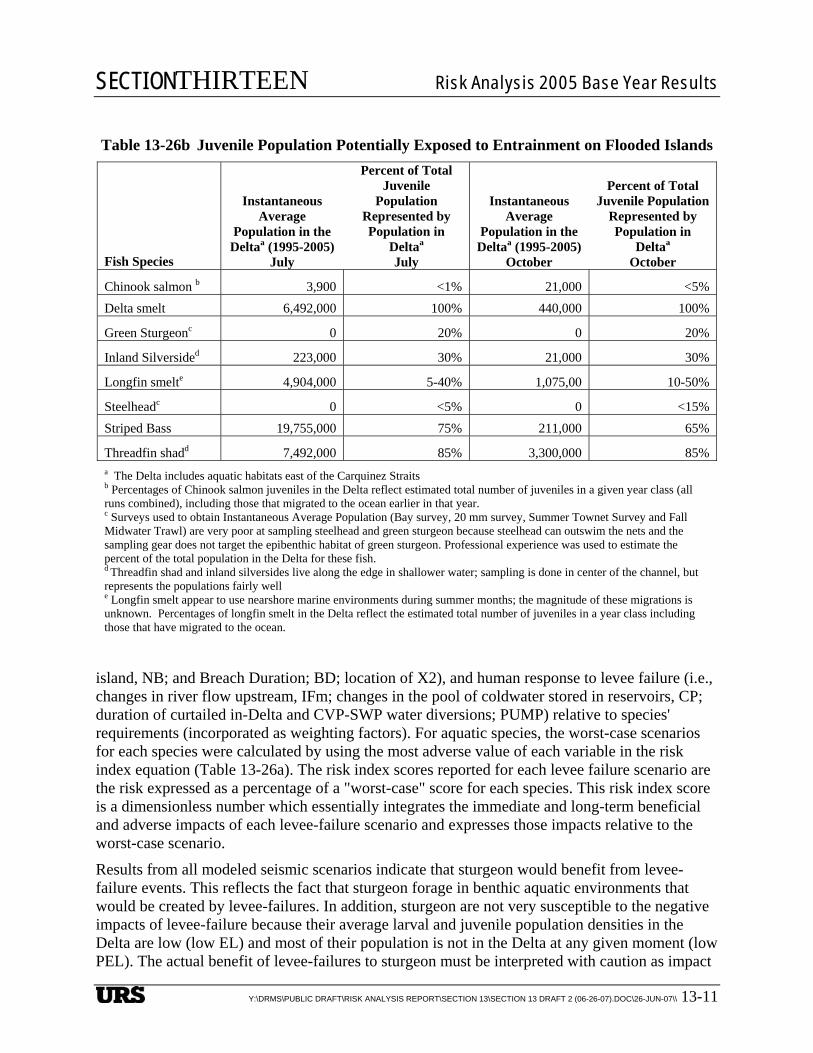
The magnitude of the immediate mortality (the percent of the population that is entrained PEL) influences the increase in risk of population extirpation following the levee breach event. Table 13-26b provides the percent of each species' total population that is found east of the Carquinez Straits (i.e., the percentage of the population that is potentially at risk from levee failure) in July and October. For example, the vast majority of the delta smelt population resides in the Delta in July and October; therefore any levee failure may impact a large percentage of the entire population. In contrast, a small percentage of the total population of silverside juveniles is found east of the Carquinez Straits in either month, reducing the potential for a levee failure to extirpate the population.
While these numbers provide a context for the potential impact of a flood, they do not reflect the whole story encapsulated in the risk index, which includes long-term impacts of levee failure which can be beneficial or adverse. Whether the benefit is beneficial or adverse depends on the state of the Delta and flooded islands after a levee breach (i.e., the number of breaches on an

SECTIONTHIRTEEN Risk Analysis 2005 Base Year Results
Y:\DRMS\PUBLIC DRAFT\RISK ANALYSIS REPORT\SECTION 13\SECTION 13 DRAFT 2 (06-26-07).DOC\26-JUN-07\\ 13-9
Table 13-26a Aquatic Species Risk Factors and Weights Used in the Risk Calculator FORMULAS AND SPECIES-SPECIFIC WEIGHTINGS
RISK FACTORS VARIABLE
Delta smelt
Longfin smelt
Striped bass
Chinook salmon Steelhead
Green sturgeon
Threadfin Shad
Inland Silverside
Breach Duration (BD) (months) until last breach is closed:
BD < 12 = 0
12 < BD < 24 = 1
24 < BD <48 = 2
48 < BD < 60 = 3
BD => 60 = 4
Breach open longer is assumed to be a benefit because there is more chance for habitat to develop.
Weighting Factor 1 1 1 0.75 0.75 1 1 1
Number of Breaches (NB)
NB < 5 = 0
5 < NB < 10 = -1
NB > 10 = -2
Number of breaches is assumed to correlate positively with predation/ambush opportunity. Thus, number of breaches correlates negatively with fish habitat value.
Weighting Factor 1 1 1 0.5 0.5 0.25 1 1
X2 Location
(Feb-May):
X2 Location = distance in km from the Golden Gate of the 2ppt halocline.
X2 < 74km (i.e.downstream of Chipps Island) = 0
74 km > X2 < 83 km (i.e. between Chipps Island & river confluence) = -1
X2 > 83 km (i.e. upstream of confluence) = -2
X2 is expected to correlate negatively with habitat value for fish species considered in this report. When modeling scenarios, the value of X2 used represented the largest (worst) X2 value in the time series (from levee-failure event to breach closure).
Weighting Factor 1 1 1 0.5 0.5 0.5 1 1
Coldwater Pool (CP)
(May-Oct)
Coldwater pool reflects the amount of water stored in three reservoirs
(Shasta, Oroville, and Folsom).
CP > 60% = 0
40 < CP < 60% = -1
CP < 40% = -2
For each reservoir (Shasta, Oroville, or Folsom), end of month storage between May-Oct > 60% of baseline = 0. Storage <60% of baseline = -1. Score calculated once per year based on worst end of month result for each reservoir.
Weighting Factor 0 0 0 1 1 0 0 0
Instream flow minimum for
salmonid incubation (IFm) on Sacramento,
American, and Feather Rivers
Flow > IFm = 0
Flow < IFm = -2
Assess a penalty when flow drops below IFm on any of the three rivers.
Weighting Factor 0 0 0 1 1 0 0 0

SECTIONTHIRTEEN Risk Analysis 2005 Base Year Results
Y:\DRMS\PUBLIC DRAFT\RISK ANALYSIS REPORT\SECTION 13\SECTION 13 DRAFT 2 (06-26-07).DOC\26-JUN-07\\ 13-10
Table 13-26a Aquatic Species Risk Factors and Weights Use in the Risk Calculator (concluded)
Entrainment on Islands (EL) that
occurs when Island floods
EL < 10K = 0
10 < EL < 100K = -1
EL > 100K = -2
EL = volume of water entrained * species-specific regional density of fish (calculated for each month). If island volume > regional volume in channels, add to the above (volume of water needed to fill island * species-specific regional density in adjacent regions).
Weighting Factor 1 0.75 0.3 0.3 0.3 0.3 0.75 0.75
Percentage Island Entrainment Loss
(PEL)
PEL < 10% = 0
10 > PEL < 20% = -1
PEL > 20% = -2
[(EL ÷ standing stock in regions A2 through A13) * 100].
Weighting Factor 1 1 0.2 0.2 0.2 0.1 1 1
Pump Entrainment Reduction Benefit
(Pump)
Based on number of months in which Delta exports are
suspended.
Pump < 3 months = 0
3 > Pump > 6 months = 1
6 > Pump > 12 months = 2
12 > Pump > 18 = 3
Pump > 18 = 4
Weighting Factor 1 1 1 1 1 1 1 1
Risk of jeopardy to the species population
Rj = SUM OF ALL RISK FACTORS FOR EACH SPECIES AFTER MULTIPLYING BY WEIGHTS
Rj > 0 = not a risk to the species population (a higher value indicates a lesser risk)
Rj < 0 = risk to the species population (a lower value indicates a greater risk)
Worst-case scenario -8.0 -7.5 -5.0 -7.0 -6.5 -2.3 -7.5 -7.5
SECTIONTHIRTEEN Risk Analysis 2005 Base Year Results
Y:\DRMS\PUBLIC DRAFT\RISK ANALYSIS REPORT\SECTION 13\SECTION 13 DRAFT 2 (06-26-07).DOC\26-JUN-07\\ 13-11
Table 13-26b Juvenile Population Potentially Exposed to Entrainment on Flooded Islands
Instantaneous Average
Population in the Deltaa (1995-2005)
Percent of Total Juvenile
Population Represented by Population in
Deltaa
Instantaneous Average
Population in the Deltaa (1995-2005)
Percent of Total Juvenile Population
Represented by Population in
Deltaa Fish Species July July October October
Chinook salmon b 3,900 <1% 21,000 <5% Delta smelt 6,492,000 100% 440,000 100%
Green Sturgeonc 0 20% 0 20%
Inland Silversided 223,000 30% 21,000 30%
Longfin smelte 4,904,000 5-40% 1,075,00 10-50%
Steelheadc 0 <5% 0 <15% Striped Bass 19,755,000 75% 211,000 65%
Threadfin shadd 7,492,000 85% 3,300,000 85% a The Delta includes aquatic habitats east of the Carquinez Straits b Percentages of Chinook salmon juveniles in the Delta reflect estimated total number of juveniles in a given year class (all runs combined), including those that migrated to the ocean earlier in that year. c Surveys used to obtain Instantaneous Average Population (Bay survey, 20 mm survey, Summer Townet Survey and Fall Midwater Trawl) are very poor at sampling steelhead and green sturgeon because steelhead can outswim the nets and the sampling gear does not target the epibenthic habitat of green sturgeon. Professional experience was used to estimate the percent of the total population in the Delta for these fish. d Threadfin shad and inland silversides live along the edge in shallower water; sampling is done in center of the channel, but represents the populations fairly well e Longfin smelt appear to use nearshore marine environments during summer months; the magnitude of these migrations is unknown. Percentages of longfin smelt in the Delta reflect the estimated total number of juveniles in a year class including those that have migrated to the ocean.
island, NB; and Breach Duration; BD; location of X2), and human response to levee failure (i.e., changes in river flow upstream, IFm; changes in the pool of coldwater stored in reservoirs, CP; duration of curtailed in-Delta and CVP-SWP water diversions; PUMP) relative to species' requirements (incorporated as weighting factors). For aquatic species, the worst-case scenarios for each species were calculated by using the most adverse value of each variable in the risk index equation (Table 13-26a). The risk index scores reported for each levee failure scenario are the risk expressed as a percentage of a "worst-case" score for each species. This risk index score is a dimensionless number which essentially integrates the immediate and long-term beneficial and adverse impacts of each levee-failure scenario and expresses those impacts relative to the worst-case scenario.
Results from all modeled seismic scenarios indicate that sturgeon would benefit from levee-failure events. This reflects the fact that sturgeon forage in benthic aquatic environments that would be created by levee-failures. In addition, sturgeon are not very susceptible to the negative impacts of levee-failure because their average larval and juvenile population densities in the Delta are low (low EL) and most of their population is not in the Delta at any given moment (low PEL). The actual benefit of levee-failures to sturgeon must be interpreted with caution as impact
SECTIONTHIRTEEN Risk Analysis 2005 Base Year Results
Y:\DRMS\PUBLIC DRAFT\RISK ANALYSIS REPORT\SECTION 13\SECTION 13 DRAFT 2 (06-26-07).DOC\26-JUN-07\\ 13-12
factors are expressed as a percentage of the absolute value of the impact of the worst-case scenario; for sturgeon, the worst-case scenario represented a relatively small impact on sturgeon populations.
Most of the seismically-induced levee-failure events (involving 3, 5, 10, 20, or 30 islands) resulted in beneficial population-level effects. All seismically-induced levee-failure events that resulted in flooding of 20 or 30 islands produced beneficial effects for all species; scenarios involving fewer flooded islands had adverse population consequences for some species. Threadfin shad and inland silverside suffered adverse impacts in more seismically-induced levee-failure scenarios than other species. Threadfin shad displayed the greatest adverse impact to any species in seismically-related levee-failure event (~47% of the worst-case scenario) when 10 islands flooded during a wet year.
This small sample of levee-failure scenarios revealed that:
• Adverse impacts to fish species were nearly universal in flood-related levee-failure scenarios (except for green sturgeon which benefited from all levee-failure scenarios), whereas seismically-induced levee-failure events produced a range of beneficial and adverse impacts that varied with the magnitude and timing of the event and the species involved; and
• None of the scenarios modeled here produced adverse impacts equal to the worst-case scenario for any of the species we studied.
The impacts to aquatic species of levee-failures on individual islands cannot be conclusively generalized from seismic failure scenarios here. Modeling results from the seismic induced levee-failure scenarios indicate that impacts to individual species do not scale with the magnitude of the levee-failure event; flooding of relatively few islands produced relatively large population-level effects in some cases. The impact of any single-island flood event on a particular species will be related to the nature of the failure (e.g., number of breaches), the location and size of the island involved, and the timing of the event (which impacts the density of fish in the vicinity of the breach).
The calculations of risk for terrestrial vegetation and wildlife depend entirely on area flooded, therefore, risk to terrestrial vegetation and wildlife as calculated here would be smaller than large breach scenarios. Due to the spatially heterogeneous distribution of vegetation types and wildlife habitat, the particular island flooded in a sunny day failure would influence the magnitude of the impact.
Table 13-26a, Calculation of impact factor for levee-failure scenarios: Risk factors are multiplied by species-specific weighting factors that reflect the relevance of each risk factor to each species. For a given levee-failure scenario, weighted risk factors are summed for each species to determine the impact (positive or negative) on the population of that species. The impact factor of the worst-case scenario (bottom row) reflects the maximum negative weighted risk score attributable to a levee-failure event.
Vegetation The impact to vegetation types and terrestrial species are shown as percentage of vegetation or habitat area impacted. As discussed here, vegetation types do not include agricultural land, but agricultural land is incorporated into impacts on terrestrial species.

SECTIONTHIRTEEN Risk Analysis 2005 Base Year Results
Y:\DRMS\PUBLIC DRAFT\RISK ANALYSIS REPORT\SECTION 13\SECTION 13 DRAFT 2 (06-26-07).DOC\26-JUN-07\\ 13-13
In all seismic levee failure scenarios, impacted habitat increased with area flooded, but the magnitude depended on the vegetation type, with loss of up to 39% of herbaceous wetland seasonal ruderal, 29% of non-native trees and 24% of shrub wetland in the Delta and Suisun Marsh. Of critical vegetation types which harbor native vegetation and rare species of vegetation, native herbaceous upland (which comprises a small total area of the Delta < 500 acres), was not impacted by flooding in any of the cases. Less than 12% of critical intertidal and aquatic habitat was impacted in any scenario; however, shrub wetland lost 24% of its total habitat in the Delta and Marsh in the worst case. Overall, these results, while not incorporating the impacts of levee breaches on sensitive species, suggest that primary impacts of flooding are on vegetation types of non-native species. However, a considerable amount of critical habitat including alkali high marsh, shrub wetland and riparian trees are reduced by 10 - 24%.
For breach scenarios involving less than 10 breaches, very small percentages (0 - 8%, average 1%) of total area of vegetation types in the Delta and Suisun are impacted, with the greatest impact on non-native upland trees (7%). In the 10-breach scenario, impacts >10% of the total area are seen in herbaceous ruderal upland (17%) and herbaceous wetland seasonal ruderal (23%), shrub wetland (10%), and non-native upland trees (14%). In the 20-breach scenario, greater losses in area are seen for each vegetation type impacted in the 10-breach scenario (herbaceous ruderal upland (23%), herbaceous wetland seasonal ruderal (33%), shrub wetland (18%), and non-native upland trees (15%), and riparian trees (12%)), with the addition of the loss of > 10% of riparian trees. In the 30-breach scenario, the vegetation type alkali marsh lost more than 10% of area (11%), in addition to loss of at least a quarter of area of vegetation types impacted in the 20-breach scenario (herbaceous ruderal upland (30%) and herbaceous wetland seasonal ruderal (39%), shrub wetland (24%), and non-native upland trees (29%)), with the exception of riparian trees (17%).
Terrestrial Wildlife Breaching of Delta levees resulted in no impacts on several terrestrial wildlife species of concern whose habitats are restricted to Suisun Marsh, including the federally endangered Saltmarsh harvest mouse, Saltmarsh common yellowthroat, California clapper rail, and Suisun ornate shrew. In contrast, large numbers of levee breaches modeled impact 32% of available habitat for sandhill cranes and 42% of available habitat for waterfowl. These estimates could over or underestimate impact on these birds, because the assumption was made that all agriculture land was habitat, and that loss of agricultural land resulted in a proportional loss of habitat, however, these birds utilize only a fraction of agricultural land (grains, pasture alfalfa, corn and rice), and a crop map was not made available for the analysis. Nevertheless, the results here suggest large scale levee breaches cause substantial loses of available habitat, and depending on whether food is limited or plentiful in available habitat, these habitat losses could cause food shortages and displace birds.
13.3.1.3 Public Health and Safety Consequences From Earthquakes
The primary public safety concern is for the population on flooded islands who are endangered by flooding that results from the earthquake. Table 13-27 presents the populations at risk from each scenario and Figure 13-29 indicates the trend of increasing population as the number of flooded islands increases.

SECTIONTHIRTEEN Risk Analysis 2005 Base Year Results
Y:\DRMS\PUBLIC DRAFT\RISK ANALYSIS REPORT\SECTION 13\SECTION 13 DRAFT 2 (06-26-07).DOC\26-JUN-07\\ 13-14
Table 13-27 Population at Risk for Seismic Scenarios Seismic Scenario Population of Flooded Islands
Case 1, 1 island flooded 1,837 Case 2, 3 islands flooded 2,241 Case 3, 3 islands flooded 2,241 Case 4, 10 islands flooded 5,359 Case 5, 20 islands flooded 5,978 Case 6, 30 islands flooded 9,554
13.3.2 Flood Consequences Two representative cases of severe flood events were developed to analyze consequences from floods (assuming 2005 conditions) so they could be compared with consequences from earthquakes. Case 7 was developed as a “20 islands flooded” case and Case 8 as a “30 islands flooded case.” For reference, the following peak Delta inflows can be considered:
• 1986, February – highest of record, 661,000 cfs
• 1997, January – second highest of record, 562,000 cfs
• 100-year flood (2005 conditions) – 900,000 cfs (per the Flood Hazard TM)
These inflows indicate a potential for substantially higher inflows than have been experienced to date and, based on preliminary flood vulnerability results, inflows larger than the 100-year flood can be expected to cause a significant number of failures.
In Cases 7 and 8, specific flood inflows were not used to specify levee failures. Instead levee failures were assumed for various islands/tracts near the inflow points of major Delta tributaries. The objective was to assume relatively large number of failures and assess the scale of impacts. The islands assumed flooded in Case 7 are indicated in Figure 13-30 and for Case 8 are indicated in Figure 13-31. No damaged but not flooded islands were assumed and only one breach was assumed per island. No non-breach damage was assumed on the flooded islands
To assess potential salinity impacts, the flooded islands for each case were input to WAM for various flood months of record. Little impact on Delta salinity or water exports was found.
A more detailed evaluation was performed for the specific WAM outputs that occurred in conjunction with the January 1997 flood, assuming January 2005 development conditions.
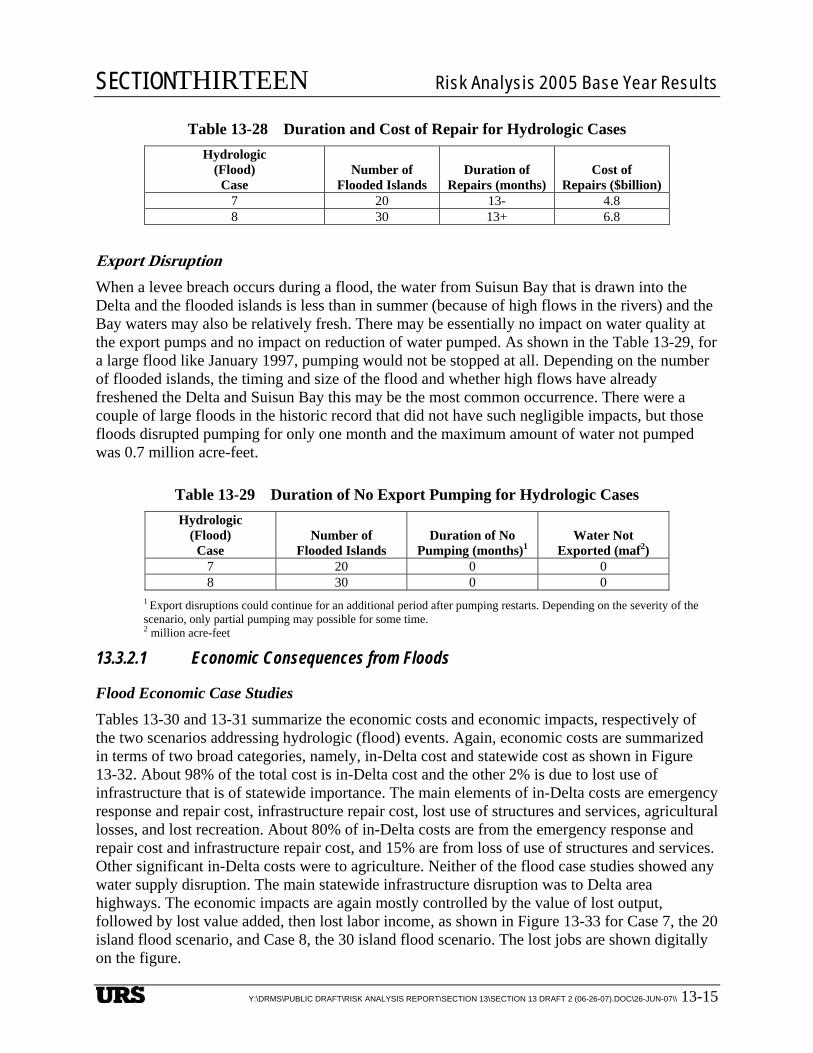
Emergency Levee Response and Repair The duration and cost of levee repairs rise as the number of islands flooded in a hydrologic event increase, as indicated in Table 13-28. Emergency repairs are estimated to take a little less than 13 months for 20 flooded islands and more than 13 months for 30 flooded islands. Repairs are estimated to increase from 4.8 to 6.8 billion dollars.
SECTIONTHIRTEEN Risk Analysis 2005 Base Year Results
Y:\DRMS\PUBLIC DRAFT\RISK ANALYSIS REPORT\SECTION 13\SECTION 13 DRAFT 2 (06-26-07).DOC\26-JUN-07\\ 13-15
Table 13-28 Duration and Cost of Repair for Hydrologic Cases Hydrologic
(Flood) Case
Number of Flooded Islands
Duration of Repairs (months)
Cost of Repairs ($billion)
7 20 13- 4.8 8 30 13+ 6.8
Export Disruption When a levee breach occurs during a flood, the water from Suisun Bay that is drawn into the Delta and the flooded islands is less than in summer (because of high flows in the rivers) and the Bay waters may also be relatively fresh. There may be essentially no impact on water quality at the export pumps and no impact on reduction of water pumped. As shown in the Table 13-29, for a large flood like January 1997, pumping would not be stopped at all. Depending on the number of flooded islands, the timing and size of the flood and whether high flows have already freshened the Delta and Suisun Bay this may be the most common occurrence. There were a couple of large floods in the historic record that did not have such negligible impacts, but those floods disrupted pumping for only one month and the maximum amount of water not pumped was 0.7 million acre-feet.
Table 13-29 Duration of No Export Pumping for Hydrologic Cases Hydrologic
(Flood) Case
Number of Flooded Islands
Duration of No Pumping (months)1
Water Not Exported (maf2)
7 20 0 0 8 30 0 0
1 Export disruptions could continue for an additional period after pumping restarts. Depending on the severity of the scenario, only partial pumping may possible for some time. 2 million acre-feet
13.3.2.1 Economic Consequences from Floods
Flood Economic Case Studies
Tables 13-30 and 13-31 summarize the economic costs and economic impacts, respectively of the two scenarios addressing hydrologic (flood) events. Again, economic costs are summarized in terms of two broad categories, namely, in-Delta cost and statewide cost as shown in Figure 13-32. About 98% of the total cost is in-Delta cost and the other 2% is due to lost use of infrastructure that is of statewide importance. The main elements of in-Delta costs are emergency response and repair cost, infrastructure repair cost, lost use of structures and services, agricultural losses, and lost recreation. About 80% of in-Delta costs are from the emergency response and repair cost and infrastructure repair cost, and 15% are from loss of use of structures and services. Other significant in-Delta costs were to agriculture. Neither of the flood case studies showed any water supply disruption. The main statewide infrastructure disruption was to Delta area highways. The economic impacts are again mostly controlled by the value of lost output, followed by lost value added, then lost labor income, as shown in Figure 13-33 for Case 7, the 20 island flood scenario, and Case 8, the 30 island flood scenario. The lost jobs are shown digitally on the figure.
SECTIONTHIRTEEN Risk Analysis 2005 Base Year Results
Y:\DRMS\PUBLIC DRAFT\RISK ANALYSIS REPORT\SECTION 13\SECTION 13 DRAFT 2 (06-26-07).DOC\26-JUN-07\\ 13-16
13.3.2.2 Ecosystem Consequences from Floods
Aquatic Species Outcomes of the two flood-related levee-failure scenarios, revealed adverse impacts to every species studied except for green sturgeon and steelhead (Tables 13-32 and 13-33). As indicated above, green sturgeon benefited from every levee-failure scenario. Steelhead displayed a relatively small net benefit (~4% of the magnitude of the worst-case scenario) from both 20-island and 30-island flood scenarios when they occurred in December and April and adverse effects when these flood-scenarios occurred in other months. Adverse impacts to other species occurred without regard to the month, water year type, or magnitude of the levee-failure scenario. Delta smelt and longfin smelt displayed the greatest adverse impacts to any species in flood-related levee-failure events (~63% of the worst-case scenario).
Vegetation In the flood scenarios, the islands breached were primarily those in the northern Delta, in contrast with seismic levee breach scenarios in which breached islands were primarily in the center of the Delta. This shift in geography results in vastly different impacts of flood induced breach scenarios from seismic induced breach scenarios. The primary difference is the much greater loss of all tree vegetation types in flood scenarios (vegetation type [20-breach, 30-breach]: native trees [34%; 45%], non-native trees [22%; 35%], tree wetlands [19%, 21%]). Flood scenarios result in a extremely large losses of total critical native tree habitat, which, in contrast, were diminished less than 10% of total area in any seismic failure. Herbaceous upland, which comprised the largest percent of impacted areas in the seismic scenarios with large numbers of breaches, lost only 9 and 13% of total area in 20 and 30 breach scenarios, respectively. Smaller losses of percent of total habitat (<10%) in the Delta and Suisun Marsh were seen for all other vegetation types which lost large areas (>10%) in seismic events.
Terrestrial Wildlife Flood: In contrast with terrestrial vegetation, there was little difference in the impact of seismic- and flood-induced levee breach scenarios. Neither flood nor seismic breach scenarios impact Suisun Marsh, resulting in no impacts on several terrestrial wildlife species of concern whose habitats are restricted to Suisun Marsh, including the federally endangered Saltmarsh harvest mouse, Saltmarsh common yellowthroat, California clapper rail, and Suisun ornate shrew. As in the seismic levee breaches, the impacts of flood levee breaches included large losses of total habitat for sandhill cranes (20-breach: 34%; 30-breach: 57%) and waterfowl (20-breach: 22%; 30-breach: 36%). However, a flood-induced 30-levee breach event almost doubles the loss of sandhill crane foraging habitat (57%) compared with a seismic-induced levee failure of the same magnitude (32%).
13.3.2.3 Public Health and Safety Consequences from Floods
The primary public safety concern is for the population on flooded islands who are endangered by flooding that results from the hydrologic event. Table 13-34 presents the populations at risk from each scenario and Figure 13-34 indicates the trend of increasing population as the number of flooded islands increases.

SECTIONTHIRTEEN Risk Analysis 2005 Base Year Results
Y:\DRMS\PUBLIC DRAFT\RISK ANALYSIS REPORT\SECTION 13\SECTION 13 DRAFT 2 (06-26-07).DOC\26-JUN-07\\ 13-17
Table 13-34 Population at Risk for Flood Scenarios Flood Scenario Population of Flooded Islands
Case 7, 20 islands flooded 20,548 Case 8, 30 islands flooded 34,887
13.3.3 Sunny Day Failure Consequences Sunny day failures are assumed to occur one flooded island at a time, for 2005 conditions. Consequences are expected to be similar to single-island consequences of floods or earthquakes. Since sunny day failures are defined to occur in the late spring, summer or early fall (i.e., during the low flow season) there seemed to be some possibility of salinity intrusion and Delta salinity / water export impacts. A single island failure for Brannon-Andrus was considered for all months in the CalSim trace (984 months as different event start times) and no significant impact on water exports was found. The maximum disruption was for less than three months with negligible economic impacts.
13.4 2005 BASE CASE RESULTS SUMMARY The 2005 base case indicates that the Delta and Suisun area faces considerable risk of multiple island failures from both seismic and flood events. The population at risk and the economic and ecological consequences from a major event are expected to be severe.

URS_ID URS NameLevee Length
(Miles)Annual Mean No.
of Failures4 Webb Tract 12.9 1.30E-035 Empire Tract 10.5 1.06E-036 Bradford Island 7.4 7.48E-047 King Island 9.1 9.15E-049 Jersey Island 15.5 1.56E-03
10 Bethel Island 11.5 1.16E-0311 Quimby Island 7.0 7.07E-0412 McDonald Tract 13.7 1.38E-0313 Holland Tract 11.0 1.10E-0314 Dutch Slough West 1.8 1.85E-0415 Bacon Island 14.3 1.44E-0316 Palm Tract 7.9 7.94E-0417 Jones Tract-Upper and Lower 18.7 1.88E-0319 Woodward Island 8.9 8.99E-0420 Orwood Tract 8.6 8.65E-0421 Victoria Island 15.0 1.52E-0332 Coney Island 5.5 5.51E-0462 Walnut Grove 2.9 2.90E-0463 Tyler Island 22.9 2.31E-0375 N. of Glanville Tract 6.2 6.22E-0477 Elk Grove SE (Zones not in MHHW) 1.4 1.45E-0478 Elk Grove Sth 6.1 6.12E-0486 Terminous East 1.3 1.36E-0487 Terminous 19.2 1.93E-03108 Hotchkiss Tract 6.7 6.71E-04109 Dutch Slough East 2.0 2.06E-04112 Union Island East 3.4 3.40E-04113 Union Island South East 4.3 4.38E-04114 Stark Tract 5.1 5.14E-04115 Upper Roberts Island 17.8 1.79E-03117 Union Island 25.3 2.55E-03118 Pescadero 9.0 9.10E-04119 Paradise Junction 7.0 7.07E-04120 McMullin Ranch 10.2 1.03E-03121 Kasson District 3.8 3.86E-04126 Pico Naglee Tract 10.1 1.01E-03127 Byron Tract 9.8 9.87E-04129 Veale Tract 1 5.4 5.42E-04135 West Sacto 1 10.8 1.09E-03141 Merritt Island 17.7 1.79E-03143 Rindge Tract 15.8 1.59E-03144 Mandeville Island 14.3 1.44E-03146 Sutter Island 12.4 1.25E-03147 Grand Island 28.3 2.85E-03148 Elk Grove SW 7.4 7.49E-04149 Pierson Tract 15.9 1.61E-03150 Venice Island 12.4 1.25E-03152 Medford Island 5.9 5.93E-04153 Rough and Ready Island 6.8 6.85E-04157 Smith Tract 5.8 5.83E-04158 Weber Tract 3.8 3.81E-04159 Boggs Tract 6.1 6.14E-04162 Fabian Tract2 3.1 3.13E-04163 Fabian Tract 18.8 1.89E-03165 Walthal Tract 6.2 6.30E-04166 RD 17 (Mossdale) 15.8 1.59E-03168 Libby McNeil Tract 1_2 3.7 3.74E-04169 McCormack Williamson Tract 8.7 8.79E-04170 Glanville Tract 11.5 1.16E-03171 Cosumnes River Area 6.8 6.81E-04172 New Hope Tract 13.6 1.37E-03173 Deadhorse Island 2.6 2.61E-04174 Staten Island 25.3 2.55E-03175 Canal Ranch 10.6 1.07E-03176 Brack Tract 10.8 1.09E-03177 Bouldin Island 17.9 1.81E-03
Table 13-1 Delta & Suisun Marsh Annual Frequency of Sunny Day Failures

URS_ID URS NameLevee Length
(Miles)Annual Mean No.
of Failures
Table 13-1 Delta & Suisun Marsh Annual Frequency of Sunny Day Failures
179 Twitchell Island 11.9 1.20E-03182 Shin Kee Tract 6.5 6.59E-04183 Rio Blanco Tract 5.8 5.86E-04185 Atlas Tract East 1.6 1.63E-04187 Shima Tract 7.0 7.09E-04190 Wright-Elmwood Tract 7.1 7.11E-04191 Sargent Barnhart Tract 7.9 7.94E-04196 Sacramento Pocket Area 15.7 1.59E-03197 Elk Grove West 7.4 7.47E-04210 Ryer Island 20.2 2.04E-03212 Clifton Crt FW 7.8 7.89E-04216 Fabian Tract South West 1 2.0 1.99E-04
1000 Netherlands 41.8 4.21E-031002 Drexler Tract 9.2 9.26E-041003 Roberts Island 29.6 2.98E-031004 West Sacto 2 12.6 1.27E-031005 Elk Grove 17.4 1.76E-031006 Upper Andrus Island 11.2 1.13E-031007 Lower Andrus Island 29.9 3.01E-031008 Stewart Tract 12.2 1.22E-031009 Mossdale R.D. No. 2107 5.7 5.70E-041010 Clifton Crt FS 5.2 5.19E-041012 Atlas Tract 3.0 3.00E-041013 Bishop Tract 8.7 8.72E-041014 McMullin Rch2 River Junction Tr 9.3 9.34E-041015 Sherman Island 19.4 1.96E-031016 Smith Tract - Lincoln Village Tr 5.6 5.60E-0468 Little Egbert Tract 10.3 1.04E-0370 Egbert Tract Includes 69 5.4 5.40E-0472 Peter Pocket 7.5 7.60E-0479 Peter's Pocket West 3.8 3.85E-0480 Cache Haas Tract 1 East 2.1 2.07E-0488 Cache Haas Tr1 8.9 9.01E-0489 Cache Haas Tr2 7.2 7.25E-04
1001 Hastings Tract 81_82 17.1 1.72E-0339 SM-39 4.3 7.21E-0440 SM-40 5.7 9.49E-0441 SM-41 2.6 4.37E-0442 SM-42 1.5 2.41E-0443 SM-43 4.7 7.78E-0444 SM-44 6.1 1.01E-0345 SM-45 3.0 4.97E-0446 SM-46 4.1 6.73E-0447 SM-47 4.5 7.53E-0448 SM-48 12.1 2.00E-0349 SM-49 8.0 1.33E-0350 SM-1/2_50_58 20.2 3.35E-0351 SM-51 5.2 8.60E-0454 SM 54a 7.6 1.26E-0355 SM-55_56_84_85_131_132 31.6 5.25E-0359 SM-59a 6.2 1.02E-0360 SM-60 14.1 2.33E-03123 SM-123 8.3 1.37E-03124 SM-57_124 9.9 1.64E-03133 SM-133_134 8.9 1.48E-03198 SM-198 9.5 1.57E-03201 Honker Bay Club_Van Sickle Island 15.0 2.49E-03202 SM-202 4.7 7.85E-04203 Simmons-Wheeler Island_SM-204 9.9 1.63E-0354b SM 54b 5.3 8.79E-0459b SM-59b 4.2 6.91E-04
URS_ID URS Name
Annual Mean No. of
Failures
Probability of Failure in
25 years
Probability of Failure in
50 years
Probability of Failure in 100
years1007 Lower Andrus Island 4.45E-02 67% 89% 99%1015 Sherman Island 4.28E-02 66% 88% 99%179 Twitchell Island 3.86E-02 62% 86% 98%9 Jersey Island 3.75E-02 61% 85% 98%6 Bradford Island 3.70E-02 60% 84% 98%
10 Bethel Island 3.70E-02 60% 84% 98%63 Tyler Island 3.62E-02 60% 84% 97%147 Grand Island 3.61E-02 59% 84% 97%4 Webb Tract 3.45E-02 58% 82% 97%
150 Venice Island 3.08E-02 54% 79% 95%127 Byron Tract 2.28E-02 44% 68% 90%21 Victoria Island 1.98E-02 39% 63% 86%144 Mandeville Island 1.97E-02 39% 63% 86%13 Holland Tract 1.97E-02 39% 63% 86%117 Union Island 1.96E-02 39% 62% 86%212 Clifton Crt FW 1.95E-02 39% 62% 86%
1003 Roberts Island 1.87E-02 37% 61% 85%12 McDonald Tract 1.86E-02 37% 61% 84%177 Bouldin Island 1.83E-02 37% 60% 84%19 Woodward Island 1.81E-02 36% 60% 84%108 Hotchkiss Tract 1.72E-02 35% 58% 82%174 Staten Island 1.71E-02 35% 58% 82%16 Palm Tract 1.66E-02 34% 56% 81%149 Pierson Tract 1.65E-02 34% 56% 81%210 Ryer Island 1.62E-02 33% 55% 80%163 Fabian Tract 1.58E-02 33% 55% 79%11 Quimby Island 1.51E-02 31% 53% 78%143 Rindge Tract 1.50E-02 31% 53% 78%17 Jones Tract-Upper and Lower 1.46E-02 30% 52% 77%15 Bacon Island 1.39E-02 29% 50% 75%146 Sutter Island 1.37E-02 29% 50% 75%
1000 Netherlands 1.37E-02 29% 50% 75%109 Dutch Slough East 1.36E-02 29% 49% 74%152 Medford Island 1.33E-02 28% 49% 74%172 New Hope Tract 1.32E-02 28% 48% 73%5 Empire Tract 1.31E-02 28% 48% 73%
14 Dutch Slough West 1.25E-02 27% 46% 71%1010 Clifton Crt FS 1.24E-02 27% 46% 71%175 Canal Ranch 1.20E-02 26% 45% 70%162 Fabian Tract2 1.17E-02 25% 44% 69%20 Orwood Tract 1.14E-02 25% 43% 68%
1002 Drexler Tract 1.13E-02 25% 43% 68%32 Coney Island 1.09E-02 24% 42% 66%141 Merritt Island 1.05E-02 23% 41% 65%216 Fabian Tract South West 1 1.00E-02 22% 39% 63%191 Sargent Barnhart Tract 9.99E-03 22% 39% 63%87 Terminous 9.87E-03 22% 39% 63%190 Wright-Elmwood Tract 9.59E-03 21% 38% 62%169 McCormack Williamson Tract 9.36E-03 21% 37% 61%170 Glanville Tract 8.69E-03 20% 35% 58%7 King Island 8.03E-03 18% 33% 55%
129 Veale Tract 1 8.02E-03 18% 33% 55%157 Smith Tract 7.71E-03 18% 32% 54%
1006 Upper Andrus Island 7.63E-03 17% 32% 53%1013 Bishop Tract 7.51E-03 17% 31% 53%176 Brack Tract 7.11E-03 16% 30% 51%168 Libby McNeil Tract 1_2 7.00E-03 16% 30% 50%153 Rough and Ready Island 6.84E-03 16% 29% 50%197 Elk Grove West 6.57E-03 15% 28% 48%
1005 Elk Grove 6.49E-03 15% 28% 48%126 Pico Naglee Tract 6.01E-03 14% 26% 45%183 Rio Blanco Tract 5.62E-03 13% 25% 43%159 Boggs Tract 5.48E-03 13% 24% 42%148 Elk Grove SW 5.46E-03 13% 24% 42%
1016 Smith Tract - Lincoln Village Tr 5.27E-03 12% 23% 41%158 Weber Tract 5.04E-03 12% 22% 40%114 Stark Tract 5.00E-03 12% 22% 39%
Table 13-3 Delta & Suisun Marsh Individual Island Rates of Seismic Failures
URS_ID URS Name
Annual Mean No. of
Failures
Probability of Failure in
25 years
Probability of Failure in
50 years
Probability of Failure in 100
years
Table 13-3 Delta & Suisun Marsh Individual Island Rates of Seismic Failures
171 Cosumnes River Area 4.95E-03 12% 22% 39%182 Shin Kee Tract 4.74E-03 11% 21% 38%118 Pescadero 4.64E-03 11% 21% 37%62 Walnut Grove 4.63E-03 11% 21% 37%75 N. of Glanville Tract 4.51E-03 11% 20% 36%113 Union Island South East 4.39E-03 10% 20% 36%115 Upper Roberts Island 4.38E-03 10% 20% 35%
1008 Stewart Tract 4.34E-03 10% 19% 35%196 Sacramento Pocket Area 4.14E-03 10% 19% 34%112 Union Island East 4.00E-03 10% 18% 33%78 Elk Grove Sth 3.94E-03 9% 18% 33%119 Paradise Junction 3.87E-03 9% 18% 32%
1014 McMullin Rch2 River Junction Tr 3.80E-03 9% 17% 32%121 Kasson District 3.79E-03 9% 17% 32%185 Atlas Tract East 3.79E-03 9% 17% 32%
1009 Mossdale R.D. No. 2107 3.72E-03 9% 17% 31%120 McMullin Ranch 3.71E-03 9% 17% 31%165 Walthal Tract 3.59E-03 9% 16% 30%166 RD 17 (Mossdale) 3.39E-03 8% 16% 29%173 Deadhorse Island 3.38E-03 8% 16% 29%
1004 West Sacto 2 3.30E-03 8% 15% 28%187 Shima Tract 3.22E-03 8% 15% 28%86 Terminous East 3.08E-03 7% 14% 27%
1012 Atlas Tract 2.70E-03 7% 13% 24%77 Elk Grove SE (Zones not in MHHW) 1.47E-03 4% 7% 14%135 West Sacto 1 1.32E-03 3% 6% 12%
1001 Hastings Tract 81_82 2.31E-02 44% 68% 90%68 Little Egbert Tract 1.54E-02 32% 54% 78%70 Egbert Tract Includes 69 1.42E-02 30% 51% 76%72 Peter Pocket 1.28E-02 27% 47% 72%89 Cache Haas Tr2 1.19E-02 26% 45% 70%88 Cache Haas Tr1 1.14E-02 25% 43% 68%79 Peter's Pocket West 1.10E-02 24% 42% 67%80 Cache Haas Tract 1 East 7.61E-03 17% 32% 53%54b SM 54b 2.13E-03 5% 10% 19%39 SM-39 2.03E-03 5% 10% 18%44 SM-44 1.97E-03 5% 9% 18%40 SM-40 1.89E-03 5% 9% 17%47 SM-47 1.35E-03 3% 7% 13%49 SM-49 1.18E-03 3% 6% 11%48 SM-48 1.15E-03 3% 6% 11%54 SM 54a 9.33E-04 2% 5% 9%46 SM-46 9.31E-04 2% 5% 9%123 SM-123 7.55E-04 2% 4% 7%45 SM-45 6.20E-04 2% 3% 6%203 Simmons-Wheeler Island_SM-204 6.03E-04 1% 3% 6%59 SM-59a 5.41E-04 1% 3% 5%198 SM-198 4.62E-04 1% 2% 5%41 SM-41 4.33E-04 1% 2% 4%50 SM-1/2_50_58 3.61E-04 1% 2% 4%43 SM-43 3.59E-04 1% 2% 4%59b SM-59b 3.01E-04 1% 1% 3%51 SM-51 3.01E-04 1% 1% 3%201 Honker Bay Club_Van Sickle Island 2.93E-04 1% 1% 3%60 SM-60 2.06E-04 1% 1% 2%133 SM-133_134 2.01E-04 1% 1% 2%124 SM-57_124 1.93E-04 0% 1% 2%55 SM-55_56_84_85_131_132 9.91E-05 0% 0% 1%202 SM-202 9.11E-05 0% 0% 1%42 SM-42 4.27E-05 0% 0% 0%
TOTAL DELTA 1.17E+00 100.00% 100.00% 100.00%TOTAL CACHE HAAS AREA 1.07E-01 93.18% 99.53% 100.00%
TOTAL SUISUN MARSH 1.94E-02 38.49% 62.16% 85.68%TOTAL 1.29E+00 100.00% 100.00% 100.00%
San Andreas Hayward Calaveras Concord Mt. DiabloPittsburg-Kirby Hills CRSB
Southern Midland
Hunting Creek - Berryesa
Northern Midland Other
1007 Lower Andrus Island 8% 17% 8% 11% 5% 4% 4% 10% 6% 5% 23%1015 Sherman Island 8% 17% 9% 12% 6% 5% 3% 11% 4% 3% 23%179 Twitchell Island 8% 17% 8% 11% 5% 4% 3% 12% 5% 4% 22%9 Jersey Island 8% 17% 9% 10% 6% 4% 3% 12% 4% 3% 24%6 Bradford Island 8% 17% 9% 10% 6% 4% 3% 13% 5% 3% 23%
10 Bethel Island 8% 17% 10% 10% 6% 4% 2% 14% 4% 2% 23%63 Tyler Island 8% 16% 8% 10% 5% 4% 5% 10% 6% 6% 21%147 Grand Island 8% 16% 7% 10% 4% 4% 6% 10% 7% 8% 19%4 Webb Tract 8% 16% 9% 9% 6% 4% 3% 14% 5% 3% 22%
150 Venice Island 9% 17% 9% 9% 6% 4% 3% 12% 5% 3% 23%127 Byron Tract 9% 17% 14% 7% 8% 2% 1% 9% 2% 1% 28%21 Victoria Island 10% 17% 13% 7% 9% 2% 1% 10% 3% 1% 28%144 Mandeville Island 9% 17% 10% 9% 7% 3% 2% 12% 4% 3% 24%13 Holland Tract 9% 16% 10% 9% 7% 3% 2% 14% 4% 2% 24%117 Union Island 10% 17% 15% 6% 8% 2% 1% 8% 2% 1% 31%212 Clifton Crt FW 9% 17% 15% 6% 9% 2% 1% 9% 2% 1% 29%
1003 Roberts Island 10% 17% 12% 7% 7% 2% 2% 9% 4% 2% 28%12 McDonald Tract 9% 17% 11% 8% 7% 3% 2% 11% 4% 3% 25%177 Bouldin Island 9% 17% 9% 9% 6% 4% 3% 12% 5% 4% 22%19 Woodward Island 9% 17% 12% 7% 8% 3% 1% 11% 3% 1% 27%108 Hotchkiss Tract 9% 16% 10% 9% 7% 4% 1% 16% 3% 2% 23%174 Staten Island 8% 17% 8% 9% 5% 4% 4% 11% 7% 7% 21%16 Palm Tract 9% 17% 11% 8% 8% 3% 1% 14% 3% 1% 25%149 Pierson Tract 8% 17% 6% 9% 4% 4% 7% 7% 9% 10% 19%210 Ryer Island 8% 16% 6% 9% 4% 5% 6% 11% 8% 10% 17%163 Fabian Tract 11% 17% 15% 5% 9% 1% 0% 8% 2% 0% 32%68 Little Egbert Tract 8% 16% 6% 10% 4% 5% 5% 12% 7% 9% 18%11 Quimby Island 9% 17% 10% 8% 7% 3% 2% 14% 4% 2% 23%143 Rindge Tract 9% 17% 11% 8% 7% 3% 2% 10% 5% 3% 25%17 Jones Tract-Upper and Lower 10% 17% 12% 6% 9% 2% 1% 11% 3% 1% 27%15 Bacon Island 10% 17% 11% 7% 8% 3% 2% 14% 4% 2% 24%146 Sutter Island 8% 16% 5% 9% 4% 5% 7% 9% 9% 12% 16%
1000 Netherlands 8% 16% 4% 8% 3% 4% 9% 7% 11% 15% 14%109 Dutch Slough East 9% 16% 9% 8% 8% 4% 1% 18% 3% 1% 22%152 Medford Island 9% 17% 10% 8% 7% 3% 2% 13% 4% 3% 24%172 New Hope Tract 9% 17% 7% 8% 5% 4% 5% 10% 8% 8% 20%5 Empire Tract 9% 17% 10% 8% 6% 3% 3% 11% 5% 3% 23%
14 Dutch Slough West 9% 16% 9% 8% 8% 4% 1% 19% 3% 1% 22%1010 Clifton Crt FS 11% 16% 14% 5% 11% 1% 0% 9% 2% 0% 31%175 Canal Ranch 9% 17% 8% 8% 5% 4% 4% 11% 8% 7% 20%162 Fabian Tract2 11% 16% 14% 4% 11% 1% 0% 8% 1% 0% 32%20 Orwood Tract 10% 16% 11% 6% 10% 2% 1% 17% 3% 1% 24%
1002 Drexler Tract 11% 17% 12% 5% 10% 2% 1% 10% 3% 1% 29%32 Coney Island 11% 16% 13% 5% 12% 1% 0% 11% 2% 0% 29%141 Merritt Island 8% 16% 4% 8% 3% 4% 9% 7% 12% 15% 14%216 Fabian Tract South West 1 11% 16% 14% 4% 11% 1% 0% 7% 1% 0% 34%191 Sargent Barnhart Tract 10% 18% 12% 6% 8% 2% 2% 9% 4% 2% 27%87 Terminous 10% 18% 9% 8% 6% 3% 3% 11% 6% 4% 22%190 Wright-Elmwood Tract 11% 17% 11% 6% 8% 2% 2% 10% 4% 2% 26%169 McCormack Williamson Tract 9% 17% 6% 8% 4% 4% 5% 10% 9% 9% 18%170 Glanville Tract 9% 17% 6% 7% 4% 4% 6% 9% 11% 11% 16%7 King Island 11% 18% 10% 6% 7% 3% 2% 13% 5% 3% 23%
129 Veale Tract 1 9% 15% 9% 6% 9% 3% 1% 23% 3% 1% 21%157 Smith Tract 11% 18% 11% 6% 8% 2% 1% 9% 4% 2% 28%
1006 Upper Andrus Island 9% 17% 6% 7% 4% 4% 5% 13% 9% 9% 17%1013 Bishop Tract 11% 18% 10% 6% 7% 3% 2% 12% 6% 3% 23%176 Brack Tract 9% 18% 8% 7% 5% 3% 4% 12% 8% 6% 20%168 Libby McNeil Tract 1_2 9% 17% 6% 8% 4% 4% 5% 11% 10% 9% 17%153 Rough and Ready Island 12% 18% 11% 5% 9% 2% 1% 10% 3% 1% 28%197 Elk Grove West 8% 17% 4% 7% 2% 4% 9% 6% 15% 16% 12%
1005 Elk Grove 8% 17% 4% 7% 3% 4% 8% 7% 14% 15% 13%126 Pico Naglee Tract 12% 16% 13% 3% 10% 1% 0% 7% 1% 0% 36%183 Rio Blanco Tract 11% 18% 9% 6% 7% 3% 2% 12% 6% 3% 22%159 Boggs Tract 12% 18% 11% 5% 9% 2% 1% 9% 3% 1% 29%148 Elk Grove SW 8% 17% 4% 7% 3% 4% 7% 8% 13% 15% 13%
1016 Smith Tract - Lincoln Village Tr 12% 18% 11% 5% 9% 2% 1% 10% 4% 2% 26%158 Weber Tract 12% 18% 11% 5% 9% 2% 1% 9% 4% 1% 28%114 Stark Tract 13% 16% 12% 3% 10% 1% 0% 7% 1% 0% 36%171 Cosumnes River Area 10% 18% 6% 6% 4% 4% 5% 11% 11% 10% 16%
Fraction Contribution of Seismic Sources
URS_ID URS Name
Table 13-4 Delta & Suisun Marsh Individual Island Rates of Seismic Failures - Seismic Source Contribution
San Andreas Hayward Calaveras Concord Mt. DiabloPittsburg-Kirby Hills CRSB
Southern Midland
Hunting Creek - Berryesa
Northern Midland Other
Fraction Contribution of Seismic Sources
URS_ID URS Name
Table 13-4 Delta & Suisun Marsh Individual Island Rates of Seismic Failures - Seismic Source Contribution
182 Shin Kee Tract 11% 19% 9% 6% 7% 3% 2% 13% 6% 3% 21%118 Pescadero 13% 16% 12% 3% 9% 1% 0% 6% 1% 0% 38%62 Walnut Grove 9% 18% 6% 6% 4% 4% 5% 13% 10% 10% 16%75 N. of Glanville Tract 8% 18% 5% 7% 3% 4% 7% 9% 13% 14% 13%113 Union Island South East 13% 17% 12% 3% 10% 1% 0% 7% 1% 0% 36%115 Upper Roberts Island 13% 17% 12% 3% 10% 1% 0% 7% 1% 0% 36%
1008 Stewart Tract 13% 17% 12% 3% 9% 1% 0% 6% 1% 0% 37%196 Sacramento Pocket Area 7% 16% 3% 6% 1% 3% 12% 4% 21% 19% 9%112 Union Island East 13% 17% 12% 3% 10% 1% 0% 8% 2% 0% 34%78 Elk Grove Sth 8% 18% 5% 6% 3% 4% 7% 8% 15% 15% 12%119 Paradise Junction 14% 16% 13% 2% 7% 1% 0% 4% 1% 0% 43%
1014 McMullin Rch2 River Junction Tr 15% 14% 13% 2% 5% 0% 0% 2% 0% 0% 48%121 Kasson District 15% 15% 13% 2% 6% 0% 0% 3% 1% 0% 47%185 Atlas Tract East 12% 19% 10% 5% 8% 2% 1% 11% 5% 2% 24%
1009 Mossdale R.D. No. 2107 14% 16% 13% 2% 8% 1% 0% 5% 1% 0% 41%120 McMullin Ranch 14% 15% 13% 2% 6% 0% 0% 3% 1% 0% 45%165 Walthal Tract 14% 16% 13% 2% 7% 1% 0% 4% 1% 0% 42%166 RD 17 (Mossdale) 13% 17% 12% 3% 9% 1% 0% 6% 2% 0% 37%173 Deadhorse Island 9% 18% 6% 6% 4% 4% 4% 14% 11% 9% 15%
1004 West Sacto 2 6% 15% 2% 6% 1% 3% 12% 3% 24% 20% 8%187 Shima Tract 11% 19% 10% 5% 8% 2% 1% 13% 6% 2% 23%86 Terminous East 10% 19% 8% 6% 5% 3% 3% 13% 8% 5% 19%
1012 Atlas Tract 12% 19% 10% 5% 9% 2% 1% 12% 5% 2% 24%77 Elk Grove SE (Zones not in MHHW) 6% 18% 4% 5% 2% 3% 7% 7% 22% 16% 10%135 West Sacto 1 5% 14% 2% 5% 1% 2% 12% 2% 35% 17% 6%
1001 Hastings Tract 81_82 7% 16% 5% 12% 3% 5% 8% 6% 8% 11% 18%70 Egbert Tract Includes 69 8% 16% 5% 11% 3% 6% 7% 8% 8% 12% 17%72 Peter Pocket 8% 15% 4% 10% 3% 6% 8% 6% 10% 18% 14%89 Cache Haas Tr2 8% 16% 4% 9% 3% 5% 7% 7% 10% 16% 15%88 Cache Haas Tr1 7% 15% 4% 9% 2% 5% 8% 5% 10% 19% 13%79 Peter's Pocket West 8% 16% 4% 10% 3% 7% 8% 6% 10% 17% 14%80 Cache Haas Tract 1 East 7% 15% 3% 8% 2% 6% 8% 5% 11% 24% 11%550 SM-1/2_50_58 2% 8% 1% 68% 1% 2% 1% 0% 1% 0% 16%554 SM 54a 1% 4% 1% 80% 0% 1% 0% 0% 0% 0% 13%654 SM 54b 1% 6% 1% 80% 0% 0% 0% 0% 0% 0% 10%39 SM-39 1% 5% 0% 80% 0% 0% 1% 0% 1% 0% 11%40 SM-40 1% 5% 0% 82% 0% 1% 1% 0% 1% 0% 9%41 SM-41 1% 7% 1% 72% 0% 2% 1% 0% 1% 0% 14%42 SM-42 1% 4% 0% 48% 0% 8% 5% 0% 3% 0% 30%43 SM-43 1% 2% 0% 3% 0% 81% 0% 0% 1% 0% 11%44 SM-44 1% 4% 0% 82% 0% 0% 1% 0% 1% 0% 11%45 SM-45 1% 5% 0% 79% 0% 1% 1% 0% 1% 0% 11%46 SM-46 1% 4% 0% 84% 0% 1% 1% 0% 1% 0% 9%47 SM-47 1% 3% 0% 88% 0% 0% 0% 0% 0% 0% 6%48 SM-48 1% 3% 0% 88% 0% 0% 0% 0% 0% 0% 6%49 SM-49 1% 3% 0% 88% 0% 0% 0% 0% 0% 0% 6%51 SM-51 1% 3% 1% 6% 1% 66% 1% 0% 1% 0% 19%123 SM-123 3% 10% 1% 63% 1% 2% 2% 0% 2% 0% 16%555 SM-55_56_84_85_131_132 1% 7% 2% 30% 2% 20% 1% 0% 1% 0% 36%433 SM-133_134 2% 6% 1% 15% 1% 39% 2% 1% 2% 1% 31%557 SM-57_124 2% 9% 1% 48% 0% 8% 8% 0% 4% 1% 19%559 SM-59a 2% 4% 1% 4% 1% 72% 1% 1% 2% 1% 13%659 SM-59b 1% 2% 0% 3% 0% 77% 1% 0% 1% 0% 14%60 SM-60 2% 9% 1% 40% 1% 10% 2% 0% 2% 0% 32%198 SM-198 1% 3% 1% 4% 2% 72% 0% 1% 0% 0% 15%501 Honker Bay Club_Van Sickle Island 0% 2% 1% 4% 2% 73% 0% 0% 0% 0% 17%202 SM-202 0% 3% 1% 15% 3% 19% 0% 0% 0% 0% 58%503 Simmons-Wheeler Island_SM-204 3% 10% 3% 22% 4% 15% 1% 1% 1% 0% 40%
TOTAL DELTA 10% 17% 9% 7% 7% 3% 3% 10% 6% 5% 24%TOTAL CACHE HAAS AREA 8% 16% 4% 10% 3% 6% 8% 6% 10% 17% 14%
TOTAL SUISUN MARSH 1% 5% 1% 49% 1% 22% 1% 0% 1% 0% 18%TOTAL AVERAGE 9% 17% 10% 9% 6% 3% 3% 11% 5% 4% 24%
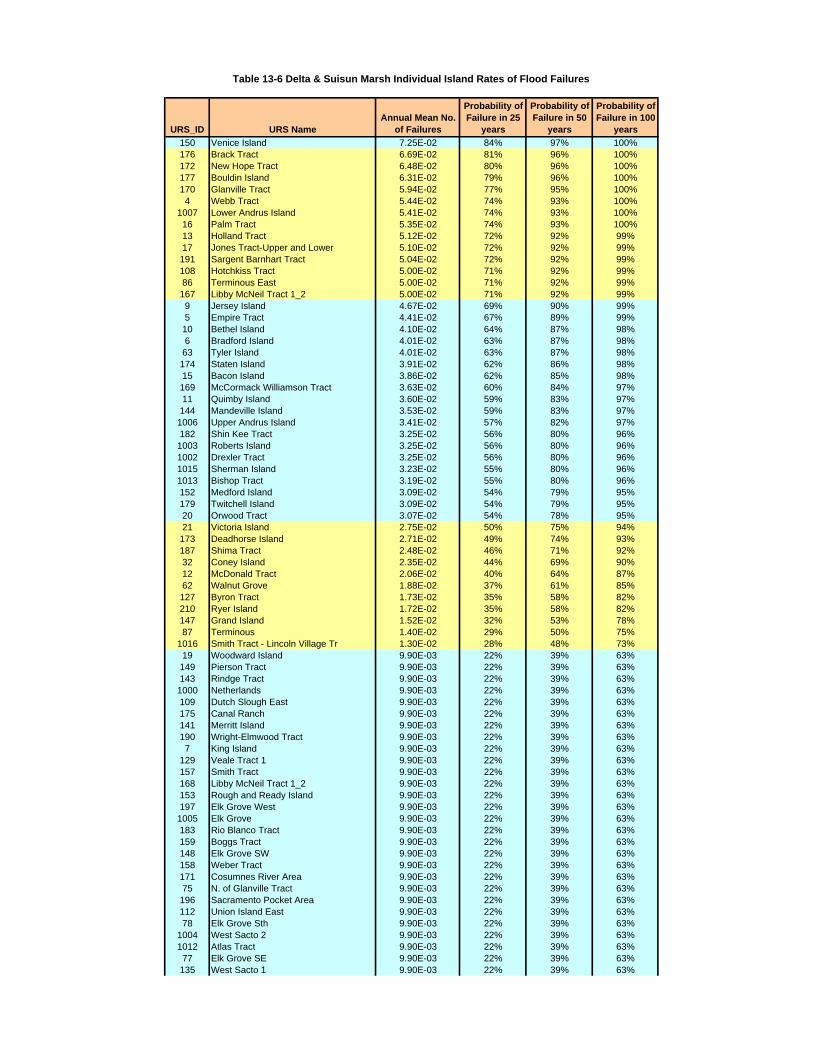
URS_ID URS NameAnnual Mean No.
of Failures
Probability of Failure in 25
years
Probability of Failure in 50
years
Probability of Failure in 100
years150 Venice Island 7.25E-02 84% 97% 100%176 Brack Tract 6.69E-02 81% 96% 100%172 New Hope Tract 6.48E-02 80% 96% 100%177 Bouldin Island 6.31E-02 79% 96% 100%170 Glanville Tract 5.94E-02 77% 95% 100%4 Webb Tract 5.44E-02 74% 93% 100%
1007 Lower Andrus Island 5.41E-02 74% 93% 100%16 Palm Tract 5.35E-02 74% 93% 100%13 Holland Tract 5.12E-02 72% 92% 99%17 Jones Tract-Upper and Lower 5.10E-02 72% 92% 99%191 Sargent Barnhart Tract 5.04E-02 72% 92% 99%108 Hotchkiss Tract 5.00E-02 71% 92% 99%86 Terminous East 5.00E-02 71% 92% 99%167 Libby McNeil Tract 1_2 5.00E-02 71% 92% 99%9 Jersey Island 4.67E-02 69% 90% 99%5 Empire Tract 4.41E-02 67% 89% 99%10 Bethel Island 4.10E-02 64% 87% 98%6 Bradford Island 4.01E-02 63% 87% 98%63 Tyler Island 4.01E-02 63% 87% 98%174 Staten Island 3.91E-02 62% 86% 98%15 Bacon Island 3.86E-02 62% 85% 98%169 McCormack Williamson Tract 3.63E-02 60% 84% 97%11 Quimby Island 3.60E-02 59% 83% 97%144 Mandeville Island 3.53E-02 59% 83% 97%1006 Upper Andrus Island 3.41E-02 57% 82% 97%182 Shin Kee Tract 3.25E-02 56% 80% 96%1003 Roberts Island 3.25E-02 56% 80% 96%1002 Drexler Tract 3.25E-02 56% 80% 96%1015 Sherman Island 3.23E-02 55% 80% 96%1013 Bishop Tract 3.19E-02 55% 80% 96%152 Medford Island 3.09E-02 54% 79% 95%179 Twitchell Island 3.09E-02 54% 79% 95%20 Orwood Tract 3.07E-02 54% 78% 95%21 Victoria Island 2.75E-02 50% 75% 94%173 Deadhorse Island 2.71E-02 49% 74% 93%187 Shima Tract 2.48E-02 46% 71% 92%32 Coney Island 2.35E-02 44% 69% 90%12 McDonald Tract 2.06E-02 40% 64% 87%62 Walnut Grove 1.88E-02 37% 61% 85%127 Byron Tract 1.73E-02 35% 58% 82%210 Ryer Island 1.72E-02 35% 58% 82%147 Grand Island 1.52E-02 32% 53% 78%87 Terminous 1.40E-02 29% 50% 75%
1016 Smith Tract - Lincoln Village Tr 1.30E-02 28% 48% 73%19 Woodward Island 9.90E-03 22% 39% 63%149 Pierson Tract 9.90E-03 22% 39% 63%143 Rindge Tract 9.90E-03 22% 39% 63%1000 Netherlands 9.90E-03 22% 39% 63%109 Dutch Slough East 9.90E-03 22% 39% 63%175 Canal Ranch 9.90E-03 22% 39% 63%141 Merritt Island 9.90E-03 22% 39% 63%190 Wright-Elmwood Tract 9.90E-03 22% 39% 63%7 King Island 9.90E-03 22% 39% 63%
129 Veale Tract 1 9.90E-03 22% 39% 63%157 Smith Tract 9.90E-03 22% 39% 63%168 Libby McNeil Tract 1_2 9.90E-03 22% 39% 63%153 Rough and Ready Island 9.90E-03 22% 39% 63%197 Elk Grove West 9.90E-03 22% 39% 63%1005 Elk Grove 9.90E-03 22% 39% 63%183 Rio Blanco Tract 9.90E-03 22% 39% 63%159 Boggs Tract 9.90E-03 22% 39% 63%148 Elk Grove SW 9.90E-03 22% 39% 63%158 Weber Tract 9.90E-03 22% 39% 63%171 Cosumnes River Area 9.90E-03 22% 39% 63%75 N. of Glanville Tract 9.90E-03 22% 39% 63%196 Sacramento Pocket Area 9.90E-03 22% 39% 63%112 Union Island East 9.90E-03 22% 39% 63%78 Elk Grove Sth 9.90E-03 22% 39% 63%
1004 West Sacto 2 9.90E-03 22% 39% 63%1012 Atlas Tract 9.90E-03 22% 39% 63%77 Elk Grove SE 9.90E-03 22% 39% 63%135 West Sacto 1 9.90E-03 22% 39% 63%
Table 13-6 Delta & Suisun Marsh Individual Island Rates of Flood Failures
URS_ID URS NameAnnual Mean No.
of Failures
Probability of Failure in 25
years
Probability of Failure in 50
years
Probability of Failure in 100
years
Table 13-6 Delta & Suisun Marsh Individual Island Rates of Flood Failures
146 Sutter Island 9.52E-03 21% 38% 61%121 Kasson District 9.39E-03 21% 37% 61%120 McMullin Ranch 9.13E-03 20% 37% 60%1014 McMullin Rch2 River Junction Tr 9.03E-03 20% 36% 59%117 Union Island 8.69E-03 20% 35% 58%113 Union Island South East 8.52E-03 19% 35% 57%119 Paradise Junction 8.45E-03 19% 34% 57%185 Atlas Tract East 7.40E-03 17% 31% 52%126 Pico Naglee Tract 7.21E-03 16% 30% 51%1008 Stewart Tract 4.37E-03 10% 20% 35%1009 Mossdale R.D. No. 2107 4.37E-03 10% 20% 35%115 Upper Roberts Island 4.03E-03 10% 18% 33%165 Walthal Tract 3.94E-03 9% 18% 33%166 RD 17 (Mossdale) 3.84E-03 9% 17% 32%1010 Clifton Crt FS 3.74E-03 9% 17% 31%162 Fabian Tract2 3.74E-03 9% 17% 31%163 Fabian Tract 3.53E-03 8% 16% 30%216 Fabian Tract South West 1 3.19E-03 8% 15% 27%118 Pescadero 3.04E-03 7% 14% 26%114 Stark Tract 1.01E-03 2% 5% 10%80 Cache Haas Tract 1 East 2.23E-01 100% 100% 100%79 Peter's Pocket West 1.56E-01 98% 100% 100%72 Peter Pocket 1.17E-01 95% 100% 100%68 Little Egbert Tract 9.43E-02 91% 99% 100%69 Egbert Tract East 5.00E-02 71% 92% 99%89 Cache Haas Tr2 5.00E-02 71% 92% 99%
1001 Hastings Tract 81_82 3.71E-02 60% 84% 98%82 Hastings Tract South west 5.00E-02 71% 92% 99%88 Cache Haas Tr1 4.03E-02 63% 87% 98%70 Egbert Tract 3.30E-02 56% 81% 96%41 SM-41 4.75E-01 100% 100% 100%1 SM-1 4.66E-01 100% 100% 100%2 SM-2 4.66E-01 100% 100% 100%42 SM-42 4.66E-01 100% 100% 100%57 SM-57 4.66E-01 100% 100% 100%58 SM-58 4.66E-01 100% 100% 100%60 SM-60 4.66E-01 100% 100% 100%123 SM-123 4.66E-01 100% 100% 100%124 SM-124 4.66E-01 100% 100% 100%39 SM-39 4.48E-01 100% 100% 100%55 SM-84-85 and others 4.07E-01 100% 100% 100%56 SM-84-85 and others 4.07E-01 100% 100% 100%84 SM-84-85 and others 4.07E-01 100% 100% 100%85 SM-84-85 and others 4.07E-01 100% 100% 100%131 SM-84-85 and others 4.07E-01 100% 100% 100%132 SM-84-85 and others 4.07E-01 100% 100% 100%40 SM-40 3.54E-01 100% 100% 100%46 SM-46 2.89E-01 100% 100% 100%202 SM-202 2.60E-01 100% 100% 100%48 SM-48 8.13E-02 87% 98% 100%200 SM-200 8.00E-02 86% 98% 100%201 SM-201 8.00E-02 86% 98% 100%204 SM-204 8.00E-02 86% 98% 100%49 SM-49 6.20E-02 79% 96% 100%44 SM-44 5.51E-02 75% 94% 100%203 SM-203 5.00E-02 71% 92% 99%54 SM-54 4.00E-02 63% 86% 98%45 SM-45 3.97E-02 63% 86% 98%50 SM-50 3.76E-02 61% 85% 98%47 SM-47 3.34E-02 57% 81% 96%59 SM-59 and others 3.14E-02 54% 79% 96%133 SM-133 and others 1.13E-02 25% 43% 68%134 SM-133 and others 1.13E-02 25% 43% 68%51 SM-51 9.26E-03 21% 37% 60%43 SM-43 9.13E-03 20% 37% 60%198 SM-198 5.53E-03 13% 24% 42%
TOTAL DELTA 2.09E+00 100.00% 100.00% 100.00%TOTAL CACHE HAAS AREA 8.50E-01 100.00% 100.00% 100.00%
TOTAL SUISUN MARSH 8.71E+00 100.00% 100.00% 100.00%TOTAL 1.17E+01 100.00% 100.00% 100.00%

URS_ID URS NameAnnual Mean No.
of Failures
Probability of Failure in 25
years
Probability of Failure in 50
years
Probability of Failure in 100
years150 Venice Island 1.03E-01 92% 99% 100%1007 Lower Andrus Island 9.86E-02 91% 99% 100%
4 Webb Tract 8.89E-02 89% 99% 100%9 Jersey Island 8.42E-02 88% 99% 100%
177 Bouldin Island 8.14E-02 87% 98% 100%172 New Hope Tract 7.80E-02 86% 98% 100%10 Bethel Island 7.79E-02 86% 98% 100%6 Bradford Island 7.71E-02 85% 98% 100%63 Tyler Island 7.63E-02 85% 98% 100%
1015 Sherman Island 7.51E-02 85% 98% 100%176 Brack Tract 7.40E-02 84% 98% 100%13 Holland Tract 7.09E-02 83% 97% 100%16 Palm Tract 7.01E-02 83% 97% 100%179 Twitchell Island 6.95E-02 82% 97% 100%170 Glanville Tract 6.80E-02 82% 97% 100%108 Hotchkiss Tract 6.72E-02 81% 97% 100%17 Jones Tract-Upper and Lower 6.55E-02 81% 96% 100%191 Sargent Barnhart Tract 6.04E-02 78% 95% 100%5 Empire Tract 5.72E-02 76% 94% 100%
174 Staten Island 5.62E-02 75% 94% 100%144 Mandeville Island 5.50E-02 75% 94% 100%86 Terminous East 5.31E-02 73% 93% 100%15 Bacon Island 5.25E-02 73% 93% 99%147 Grand Island 5.13E-02 72% 92% 99%1003 Roberts Island 5.12E-02 72% 92% 99%11 Quimby Island 5.11E-02 72% 92% 99%167 Libby McNeil Tract 1_2 5.00E-02 71% 92% 99%21 Victoria Island 4.73E-02 69% 91% 99%169 McCormack Williamson Tract 4.57E-02 68% 90% 99%152 Medford Island 4.43E-02 67% 89% 99%1002 Drexler Tract 4.38E-02 67% 89% 99%20 Orwood Tract 4.21E-02 65% 88% 99%
1006 Upper Andrus Island 4.17E-02 65% 88% 98%127 Byron Tract 4.01E-02 63% 87% 98%1013 Bishop Tract 3.94E-02 63% 86% 98%12 McDonald Tract 3.92E-02 62% 86% 98%182 Shin Kee Tract 3.73E-02 61% 84% 98%32 Coney Island 3.44E-02 58% 82% 97%210 Ryer Island 3.33E-02 57% 81% 96%173 Deadhorse Island 3.05E-02 53% 78% 95%117 Union Island 2.83E-02 51% 76% 94%19 Woodward Island 2.80E-02 50% 75% 94%187 Shima Tract 2.80E-02 50% 75% 94%149 Pierson Tract 2.64E-02 48% 73% 93%143 Rindge Tract 2.49E-02 46% 71% 92%87 Terminous 2.38E-02 45% 70% 91%
1000 Netherlands 2.36E-02 45% 69% 91%109 Dutch Slough East 2.35E-02 44% 69% 90%62 Walnut Grove 2.34E-02 44% 69% 90%146 Sutter Island 2.32E-02 44% 69% 90%175 Canal Ranch 2.19E-02 42% 67% 89%141 Merritt Island 2.04E-02 40% 64% 87%190 Wright-Elmwood Tract 1.95E-02 39% 62% 86%163 Fabian Tract 1.93E-02 38% 62% 86%1016 Smith Tract - Lincoln Village Tr 1.83E-02 37% 60% 84%
7 King Island 1.79E-02 36% 59% 83%129 Veale Tract 1 1.79E-02 36% 59% 83%157 Smith Tract 1.76E-02 36% 59% 83%168 Libby McNeil Tract 1_2 1.69E-02 34% 57% 82%153 Rough and Ready Island 1.67E-02 34% 57% 81%197 Elk Grove West 1.65E-02 34% 56% 81%1005 Elk Grove 1.64E-02 34% 56% 81%1010 Clifton Crt FS 1.62E-02 33% 55% 80%183 Rio Blanco Tract 1.55E-02 32% 54% 79%162 Fabian Tract2 1.54E-02 32% 54% 79%159 Boggs Tract 1.54E-02 32% 54% 79%148 Elk Grove SW 1.54E-02 32% 54% 78%158 Weber Tract 1.49E-02 31% 53% 78%171 Cosumnes River Area 1.49E-02 31% 52% 77%75 N. of Glanville Tract 1.44E-02 30% 51% 76%196 Sacramento Pocket Area 1.40E-02 30% 50% 75%112 Union Island East 1.39E-02 29% 50% 75%
Table 13-8 Delta & Suisun Marsh Individual Island Composite Rates of Failures
URS_ID URS NameAnnual Mean No.
of Failures
Probability of Failure in 25
years
Probability of Failure in 50
years
Probability of Failure in 100
years
Table 13-8 Delta & Suisun Marsh Individual Island Composite Rates of Failures
78 Elk Grove Sth 1.38E-02 29% 50% 75%126 Pico Naglee Tract 1.32E-02 28% 48% 73%1004 West Sacto 2 1.32E-02 28% 48% 73%216 Fabian Tract South West 1 1.32E-02 28% 48% 73%121 Kasson District 1.32E-02 28% 48% 73%113 Union Island South East 1.29E-02 28% 48% 73%120 McMullin Ranch 1.28E-02 27% 47% 72%1014 McMullin Rch2 River Junction Tr 1.28E-02 27% 47% 72%1012 Atlas Tract 1.26E-02 27% 47% 72%14 Dutch Slough West 1.25E-02 27% 46% 71%119 Paradise Junction 1.23E-02 27% 46% 71%77 Elk Grove SE (Zones not in MHHW) 1.14E-02 25% 43% 68%135 West Sacto 1 1.12E-02 24% 43% 67%185 Atlas Tract East 1.12E-02 24% 43% 67%1008 Stewart Tract 8.71E-03 20% 35% 58%115 Upper Roberts Island 8.41E-03 19% 34% 57%1009 Mossdale R.D. No. 2107 8.09E-03 18% 33% 55%118 Pescadero 7.68E-03 17% 32% 54%165 Walthal Tract 7.53E-03 17% 31% 53%166 RD 17 (Mossdale) 7.23E-03 17% 30% 51%114 Stark Tract 6.00E-03 14% 26% 45%80 Cache Haas Tract 1 East 2.30E-01 100% 100% 100%79 Peter's Pocket West 1.67E-01 98% 100% 100%72 Peter Pocket 1.30E-01 96% 100% 100%68 Little Egbert Tract 1.10E-01 94% 100% 100%69 Egbert Tract East 6.42E-02 80% 96% 100%89 Cache Haas Tr2 6.19E-02 79% 95% 100%
1001 Hastings Tract 81_82 6.02E-02 78% 95% 100%82 Hastings Tract South west 6.14E-02 78% 95% 100%88 Cache Haas Tr1 5.17E-02 73% 92% 99%70 Egbert Tract 4.72E-02 69% 91% 99%1 SM-1 4.66E-01 100% 100% 100%2 SM-2 4.66E-01 100% 100% 100%39 SM-39 4.50E-01 100% 100% 100%40 SM-40 3.55E-01 100% 100% 100%41 SM-41 4.75E-01 100% 100% 100%42 SM-42 4.66E-01 100% 100% 100%43 SM-43 9.49E-03 21% 38% 61%44 SM-44 5.70E-02 76% 94% 100%45 SM-45 4.03E-02 64% 87% 98%46 SM-46 2.90E-01 100% 100% 100%47 SM-47 3.47E-02 58% 82% 97%48 SM-48 8.24E-02 87% 98% 100%49 SM-49 6.32E-02 79% 96% 100%50 SM-50 3.79E-02 61% 85% 98%51 SM-51 9.56E-03 21% 38% 62%54 SM-54 4.09E-02 64% 87% 98%55 SM-84-85 and others 4.07E-01 100% 100% 100%56 SM-84-85 and others 4.07E-01 100% 100% 100%57 SM-57 4.66E-01 100% 100% 100%58 SM-58 4.66E-01 100% 100% 100%59 SM-59 and others 3.20E-02 55% 80% 96%60 SM-60 4.66E-01 100% 100% 100%84 SM-84-85 and others 4.07E-01 100% 100% 100%85 SM-84-85 and others 4.07E-01 100% 100% 100%123 SM-123 4.67E-01 100% 100% 100%124 SM-124 4.66E-01 100% 100% 100%131 SM-84-85 and others 4.07E-01 100% 100% 100%132 SM-84-85 and others 4.07E-01 100% 100% 100%133 SM-133 and others 1.15E-02 25% 44% 68%134 SM-133 and others 1.15E-02 25% 44% 68%198 SM-198 5.99E-03 14% 26% 45%200 SM-200 8.03E-02 87% 98% 100%201 SM-201 8.03E-02 87% 98% 100%202 SM-202 2.61E-01 100% 100% 100%203 SM-203 5.06E-02 72% 92% 99%204 SM-204 8.06E-02 87% 98% 100%
TOTAL DELTA 3.24E+00 100.00% 100.00% 100.00%TOTAL CACHE HAAS AREA 9.83E-01 100.00% 100.00% 100.00%
TOTAL SUISUN MARSH 8.73E+00 100.00% 100.00% 100.00%TOTAL 1.28E+01 100.00% 100.00% 100.00%

Seismic Scenario
No. of Flooded Islands
No. of Damaged, but Non-Flooded
Islands Event MonthHydrologic
Year Event MonthHydrologic
Year Event MonthHydrologic
Year
1 1 2 February
Consequences are independent
of water year type.
2 3 0 June 1927 August 1972 October 1930
3 3 4 June 1927 August 1972 October 1930
4 10 0 June 1927 August 1972 October 1930
5 20 6 June 1927 August 1972 October 1930
6 30 6 June 1927 August 1972 October 1930
Assumed Event Month and Hydrologic Year for Wet Year
Assumed Event Month and Hydrologic Year for
Average YearAssumed Event Month and
Hydrologic Year for Dry Year
Table 13-9. Seismic Failure Scenarios Analyzed in Risk Evaluation
Table 13-9 ECON.xls:Sheet1 6/26/2007
Page 1 of 1
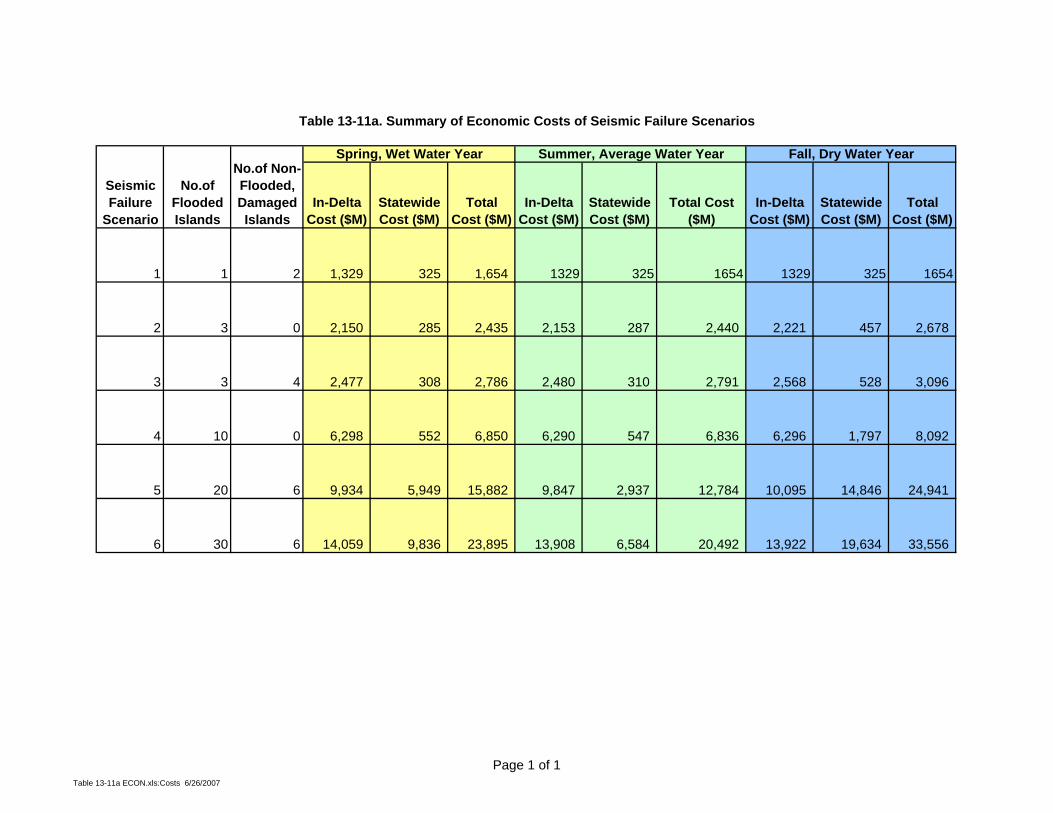
In-Delta Cost ($M)
Statewide Cost ($M)
Total Cost ($M)
In-Delta Cost ($M)
Statewide Cost ($M)
Total Cost ($M)
In-Delta Cost ($M)
Statewide Cost ($M)
Total Cost ($M)
1 1 2 1,329 325 1,654 1329 325 1654 1329 325 1654
2 3 0 2,150 285 2,435 2,153 287 2,440 2,221 457 2,678
3 3 4 2,477 308 2,786 2,480 310 2,791 2,568 528 3,096
4 10 0 6,298 552 6,850 6,290 547 6,836 6,296 1,797 8,092
5 20 6 9,934 5,949 15,882 9,847 2,937 12,784 10,095 14,846 24,941
6 30 6 14,059 9,836 23,895 13,908 6,584 20,492 13,922 19,634 33,556
Table 13-11a. Summary of Economic Costs of Seismic Failure Scenarios
Seismic Failure
Scenario
No.of Flooded Islands
No.of Non-Flooded, Damaged Islands
Spring, Wet Water Year Summer, Average Water Year Fall, Dry Water Year
Table 13-11a ECON.xls:Costs 6/26/2007
Page 1 of 1
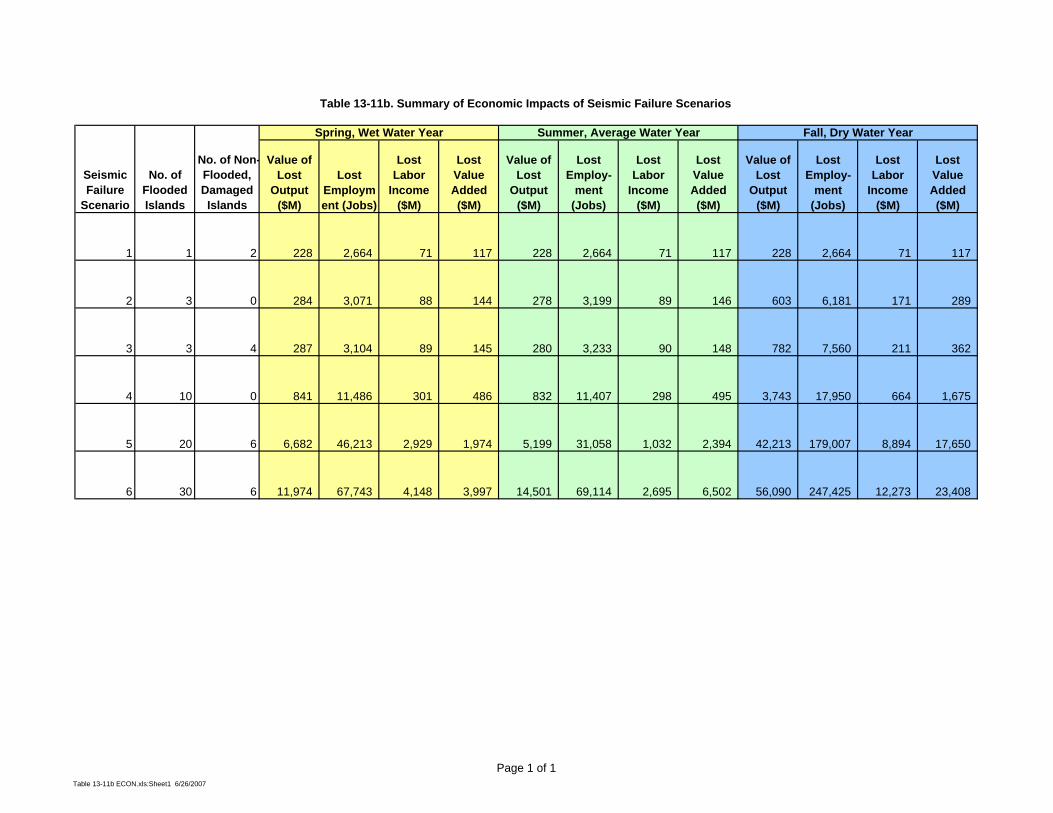
Value of Lost
Output ($M)
Lost Employment (Jobs)
Lost Labor
Income ($M)
Lost Value Added ($M)
Value of Lost
Output ($M)
Lost Employ-
ment (Jobs)
Lost Labor
Income ($M)
Lost Value Added ($M)
Value of Lost
Output ($M)
Lost Employ-
ment (Jobs)
Lost Labor
Income ($M)
Lost Value Added ($M)
1 1 2 228 2,664 71 117 228 2,664 71 117 228 2,664 71 117
2 3 0 284 3,071 88 144 278 3,199 89 146 603 6,181 171 289
3 3 4 287 3,104 89 145 280 3,233 90 148 782 7,560 211 362
4 10 0 841 11,486 301 486 832 11,407 298 495 3,743 17,950 664 1,675
5 20 6 6,682 46,213 2,929 1,974 5,199 31,058 1,032 2,394 42,213 179,007 8,894 17,650
6 30 6 11,974 67,743 4,148 3,997 14,501 69,114 2,695 6,502 56,090 247,425 12,273 23,408
Table 13-11b. Summary of Economic Impacts of Seismic Failure Scenarios
Seismic Failure
Scenario
No. of Flooded Islands
No. of Non-Flooded, Damaged Islands
Fall, Dry Water YearSpring, Wet Water Year Summer, Average Water Year
Table 13-11b ECON.xls:Sheet1 6/26/2007
Page 1 of 1
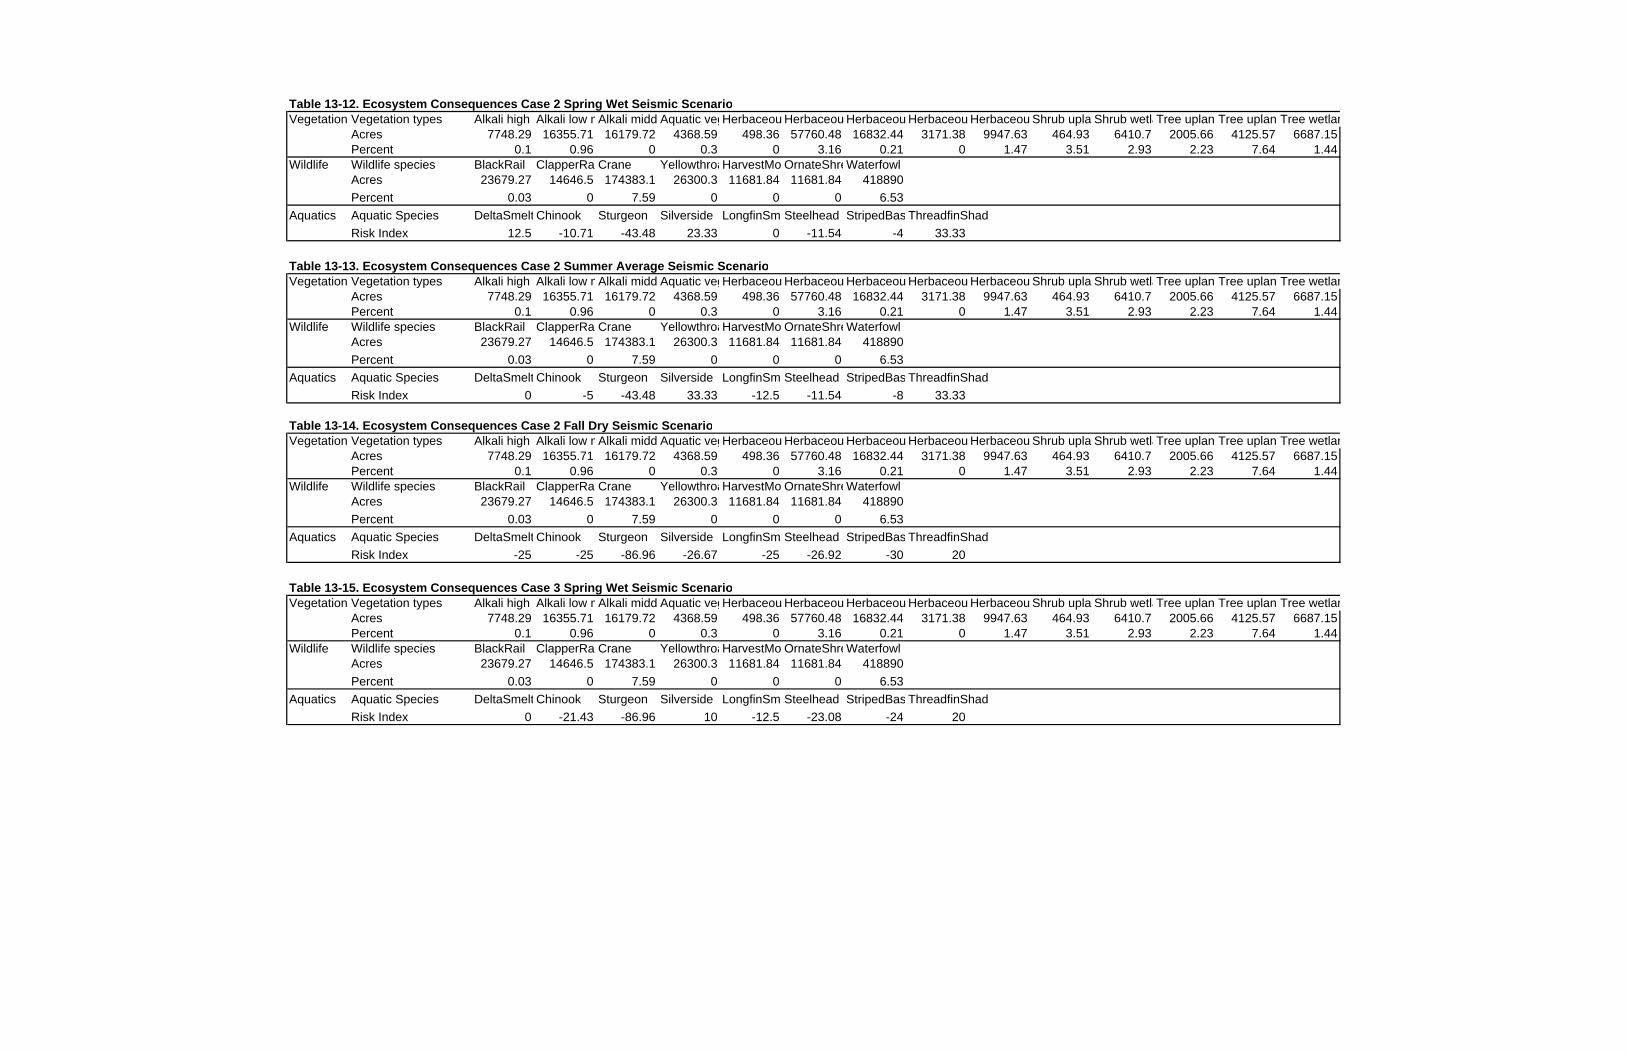
Table 13-12. Ecosystem Consequences Case 2 Spring Wet Seismic ScenarioVegetation Vegetation types Alkali high Alkali low mAlkali midd Aquatic vegHerbaceou Herbaceou Herbaceou Herbaceou Herbaceou Shrub upla Shrub wetlaTree uplandTree uplandTree wetlan
Acres 7748.29 16355.71 16179.72 4368.59 498.36 57760.48 16832.44 3171.38 9947.63 464.93 6410.7 2005.66 4125.57 6687.15Percent 0.1 0.96 0 0.3 0 3.16 0.21 0 1.47 3.51 2.93 2.23 7.64 1.44
Wildlife Wildlife species BlackRail ClapperRa Crane YellowthroaHarvestMo OrnateShreWaterfowlAcres 23679.27 14646.5 174383.1 26300.3 11681.84 11681.84 418890Percent 0.03 0 7.59 0 0 0 6.53
Aquatics Aquatic Species DeltaSmelt Chinook Sturgeon Silverside LongfinSmeSteelhead StripedBas ThreadfinShadRisk Index 12.5 -10.71 -43.48 23.33 0 -11.54 -4 33.33
Table 13-13. Ecosystem Consequences Case 2 Summer Average Seismic ScenarioVegetation Vegetation types Alkali high Alkali low mAlkali midd Aquatic vegHerbaceou Herbaceou Herbaceou Herbaceou Herbaceou Shrub upla Shrub wetlaTree uplandTree uplandTree wetlan
Acres 7748.29 16355.71 16179.72 4368.59 498.36 57760.48 16832.44 3171.38 9947.63 464.93 6410.7 2005.66 4125.57 6687.15Percent 0.1 0.96 0 0.3 0 3.16 0.21 0 1.47 3.51 2.93 2.23 7.64 1.44
Wildlife Wildlife species BlackRail ClapperRa Crane YellowthroaHarvestMo OrnateShreWaterfowlAcres 23679.27 14646.5 174383.1 26300.3 11681.84 11681.84 418890Percent 0.03 0 7.59 0 0 0 6.53
Aquatics Aquatic Species DeltaSmelt Chinook Sturgeon Silverside LongfinSmeSteelhead StripedBas ThreadfinShadRisk Index 0 -5 -43.48 33.33 -12.5 -11.54 -8 33.33
Table 13-14. Ecosystem Consequences Case 2 Fall Dry Seismic ScenarioVegetation Vegetation types Alkali high Alkali low mAlkali midd Aquatic vegHerbaceou Herbaceou Herbaceou Herbaceou Herbaceou Shrub upla Shrub wetlaTree uplandTree uplandTree wetlan
Acres 7748.29 16355.71 16179.72 4368.59 498.36 57760.48 16832.44 3171.38 9947.63 464.93 6410.7 2005.66 4125.57 6687.15Percent 0.1 0.96 0 0.3 0 3.16 0.21 0 1.47 3.51 2.93 2.23 7.64 1.44
Wildlife Wildlife species BlackRail ClapperRa Crane YellowthroaHarvestMo OrnateShreWaterfowlAcres 23679.27 14646.5 174383.1 26300.3 11681.84 11681.84 418890Percent 0.03 0 7.59 0 0 0 6.53
Aquatics Aquatic Species DeltaSmelt Chinook Sturgeon Silverside LongfinSmeSteelhead StripedBas ThreadfinShadRisk Index -25 -25 -86.96 -26.67 -25 -26.92 -30 20
Table 13-15. Ecosystem Consequences Case 3 Spring Wet Seismic ScenarioVegetation Vegetation types Alkali high Alkali low mAlkali midd Aquatic vegHerbaceou Herbaceou Herbaceou Herbaceou Herbaceou Shrub upla Shrub wetlaTree uplandTree uplandTree wetlan
Acres 7748.29 16355.71 16179.72 4368.59 498.36 57760.48 16832.44 3171.38 9947.63 464.93 6410.7 2005.66 4125.57 6687.15Percent 0.1 0.96 0 0.3 0 3.16 0.21 0 1.47 3.51 2.93 2.23 7.64 1.44
Wildlife Wildlife species BlackRail ClapperRa Crane YellowthroaHarvestMo OrnateShreWaterfowlAcres 23679.27 14646.5 174383.1 26300.3 11681.84 11681.84 418890Percent 0.03 0 7.59 0 0 0 6.53
Aquatics Aquatic Species DeltaSmelt Chinook Sturgeon Silverside LongfinSmeSteelhead StripedBas ThreadfinShadRisk Index 0 -21.43 -86.96 10 -12.5 -23.08 -24 20

Table 13-16. Ecosystem Consequences Case 3 Summer Average Seismic ScenarioVegetation Vegetation types Alkali high Alkali low mAlkali midd Aquatic vegHerbaceou Herbaceou Herbaceou Herbaceou Herbaceou Shrub upla Shrub wetlaTree uplandTree uplandTree wetlan
Acres 7748.29 16355.71 16179.72 4368.59 498.36 57760.48 16832.44 3171.38 9947.63 464.93 6410.7 2005.66 4125.57 6687.15Percent 0.1 0.96 0 0.3 0 3.16 0.21 0 1.47 3.51 2.93 2.23 7.64 1.44
Wildlife Wildlife species BlackRail ClapperRa Crane YellowthroaHarvestMo OrnateShreWaterfowlAcres 23679.27 14646.5 174383.1 26300.3 11681.84 11681.84 418890Percent 0.03 0 7.59 0 0 0 6.53
Aquatics Aquatic Species DeltaSmelt Chinook Sturgeon Silverside LongfinSmeSteelhead StripedBas ThreadfinShadRisk Index -12.5 -15.71 -86.96 20 -25 -23.08 -28 20
Table 13-17. Ecosystem Consequences Case 3 Fall Dry Seismic ScenarioVegetation Vegetation types Alkali high Alkali low mAlkali midd Aquatic vegHerbaceou Herbaceou Herbaceou Herbaceou Herbaceou Shrub upla Shrub wetlaTree uplandTree uplandTree wetlan
Acres 7748.29 16355.71 16179.72 4368.59 498.36 57760.48 16832.44 3171.38 9947.63 464.93 6410.7 2005.66 4125.57 6687.15Percent 0.1 0.96 0 0.3 0 3.16 0.21 0 1.47 3.51 2.93 2.23 7.64 1.44
Wildlife Wildlife species BlackRail ClapperRa Crane YellowthroaHarvestMo OrnateShreWaterfowlAcres 23679.27 14646.5 174383.1 26300.3 11681.84 11681.84 418890Percent 0.03 0 7.59 0 0 0 6.53
Aquatics Aquatic Species DeltaSmelt Chinook Sturgeon Silverside LongfinSmeSteelhead StripedBas ThreadfinShadRisk Index -37.5 -35.71 -130.43 -40 -37.5 -38.46 -50 6.67
Table 13-18. Ecosystem Consequences Case 4 Spring Wet Seismic ScenarioVegetation Vegetation types Alkali high Alkali low mAlkali midd Aquatic vegHerbaceou Herbaceou Herbaceou Herbaceou Herbaceou Shrub upla Shrub wetlaTree uplandTree uplandTree wetlan
Acres 7748.29 16355.71 16179.72 4368.59 498.36 57760.48 16832.44 3171.38 9947.63 464.93 6410.7 2005.66 4125.57 6687.15Percent 1.21 1.07 0 0.98 0 16.57 1.4 0.35 23.39 3.87 10.42 2.34 13.72 7.04
Wildlife Wildlife species BlackRail ClapperRa Crane YellowthroaHarvestMo OrnateShreWaterfowlAcres 23679.27 14646.5 174383.1 26300.3 11681.84 11681.84 418890Percent 0.4 0 9.38 0 0 0 9.37
Aquatics Aquatic Species DeltaSmelt Chinook Sturgeon Silverside LongfinSmeSteelhead StripedBas ThreadfinShadRisk Index 50 -7.14 -65.22 36.67 37.5 -15.38 20 46.67
Table 13-19. Ecosystem Consequences Case 4 Summer Average Seismic ScenarioVegetation Vegetation types Alkali high Alkali low mAlkali midd Aquatic vegHerbaceou Herbaceou Herbaceou Herbaceou Herbaceou Shrub upla Shrub wetlaTree uplandTree uplandTree wetlan
Acres 7748.29 16355.71 16179.72 4368.59 498.36 57760.48 16832.44 3171.38 9947.63 464.93 6410.7 2005.66 4125.57 6687.15Percent 1.21 1.07 0 0.98 0 16.57 1.4 0.35 23.39 3.87 10.42 2.34 13.72 7.04
Wildlife Wildlife species BlackRail ClapperRa Crane YellowthroaHarvestMo OrnateShreWaterfowlAcres 23679.27 14646.5 174383.1 26300.3 11681.84 11681.84 418890Percent 0.4 0 9.38 0 0 0 9.37
Aquatics Aquatic Species DeltaSmelt Chinook Sturgeon Silverside LongfinSmeSteelhead StripedBas ThreadfinShadRisk Index 37.5 -15.71 -108.7 33.33 -12.5 -30.77 -4 33.33

Table 13-20. Ecosystem Consequences Case 4 Fall Dry Seismic ScenarioVegetation Vegetation types Alkali high Alkali low mAlkali midd Aquatic vegHerbaceou Herbaceou Herbaceou Herbaceou Herbaceou Shrub upla Shrub wetlaTree uplandTree uplandTree wetlan
Acres 7748.29 16355.71 16179.72 4368.59 498.36 57760.48 16832.44 3171.38 9947.63 464.93 6410.7 2005.66 4125.57 6687.15Percent 1.21 1.07 0 0.98 0 16.57 1.4 0.35 23.39 3.87 10.42 2.34 13.72 7.04
Wildlife Wildlife species BlackRail ClapperRa Crane YellowthroaHarvestMo OrnateShreWaterfowlAcres 23679.27 14646.5 174383.1 26300.3 11681.84 11681.84 418890Percent 0.4 0 9.38 0 0 0 9.37
Aquatics Aquatic Species DeltaSmelt Chinook Sturgeon Silverside LongfinSmeSteelhead StripedBas ThreadfinShadRisk Index -12.5 -32.86 -152.17 -26.67 12.5 -46.15 -26 20
Table 13-21. Ecosystem Consequences Case 5 Spring Wet Seismic ScenarioVegetation Vegetation types Alkali high Alkali low mAlkali midd Aquatic vegHerbaceou Herbaceou Herbaceou Herbaceou Herbaceou Shrub upla Shrub wetlaTree uplandTree uplandTree wetlan
Acres 7748.29 16355.71 16179.72 4368.59 498.36 57760.48 16832.44 3171.38 9947.63 464.93 6410.7 2005.66 4125.57 6687.15Percent 7.91 1.75 0.43 5.11 0 23.46 3.79 0.35 33.02 8.27 18.06 2.59 15.25 12.23
Wildlife Wildlife species BlackRail ClapperRa Crane YellowthroaHarvestMo OrnateShreWaterfowlAcres 23679.27 14646.5 174383.1 26300.3 11681.84 11681.84 418890Percent 2.88 0 16.56 0 0 0 20.3
Aquatics Aquatic Species DeltaSmelt Chinook Sturgeon Silverside LongfinSmeSteelhead StripedBas ThreadfinShadRisk Index 0 -51.43 -239.13 -6.67 0 -69.23 -60 -6.67
Table 13-22. Ecosystem Consequences Case 5 Summer Average Seismic ScenarioVegetation Vegetation types Alkali high Alkali low mAlkali midd Aquatic vegHerbaceou Herbaceou Herbaceou Herbaceou Herbaceou Shrub upla Shrub wetlaTree uplandTree uplandTree wetlan
Acres 7748.29 16355.71 16179.72 4368.59 498.36 57760.48 16832.44 3171.38 9947.63 464.93 6410.7 2005.66 4125.57 6687.15Percent 7.91 1.75 0.43 5.11 0 23.46 3.79 0.35 33.02 8.27 18.06 2.59 15.25 12.23
Wildlife Wildlife species BlackRail ClapperRa Crane YellowthroaHarvestMo OrnateShreWaterfowlAcres 23679.27 14646.5 174383.1 26300.3 11681.84 11681.84 418890Percent 2.88 0 16.56 0 0 0 20.3
Aquatics Aquatic Species DeltaSmelt Chinook Sturgeon Silverside LongfinSmeSteelhead StripedBas ThreadfinShadRisk Index -12.5 -61.43 -282.61 -20 -37.5 -84.62 -80 -20
Table 13-23. Ecosystem Consequences Case 5 Fall Dry Seismic ScenarioVegetation Vegetation types Alkali high Alkali low mAlkali midd Aquatic vegHerbaceou Herbaceou Herbaceou Herbaceou Herbaceou Shrub upla Shrub wetlaTree uplandTree uplandTree wetlan
Acres 7748.29 16355.71 16179.72 4368.59 498.36 57760.48 16832.44 3171.38 9947.63 464.93 6410.7 2005.66 4125.57 6687.15Percent 7.91 1.75 0.43 5.11 0 23.46 3.79 0.35 33.02 8.27 18.06 2.59 15.25 12.23
Wildlife Wildlife species BlackRail ClapperRa Crane YellowthroaHarvestMo OrnateShreWaterfowlAcres 23679.27 14646.5 174383.1 26300.3 11681.84 11681.84 418890Percent 2.88 0 16.56 0 0 0 20.3
Aquatics Aquatic Species DeltaSmelt Chinook Sturgeon Silverside LongfinSmeSteelhead StripedBas ThreadfinShadRisk Index -62.5 -97.14 -391.3 -73.33 -75 -123.08 -160 -73.33
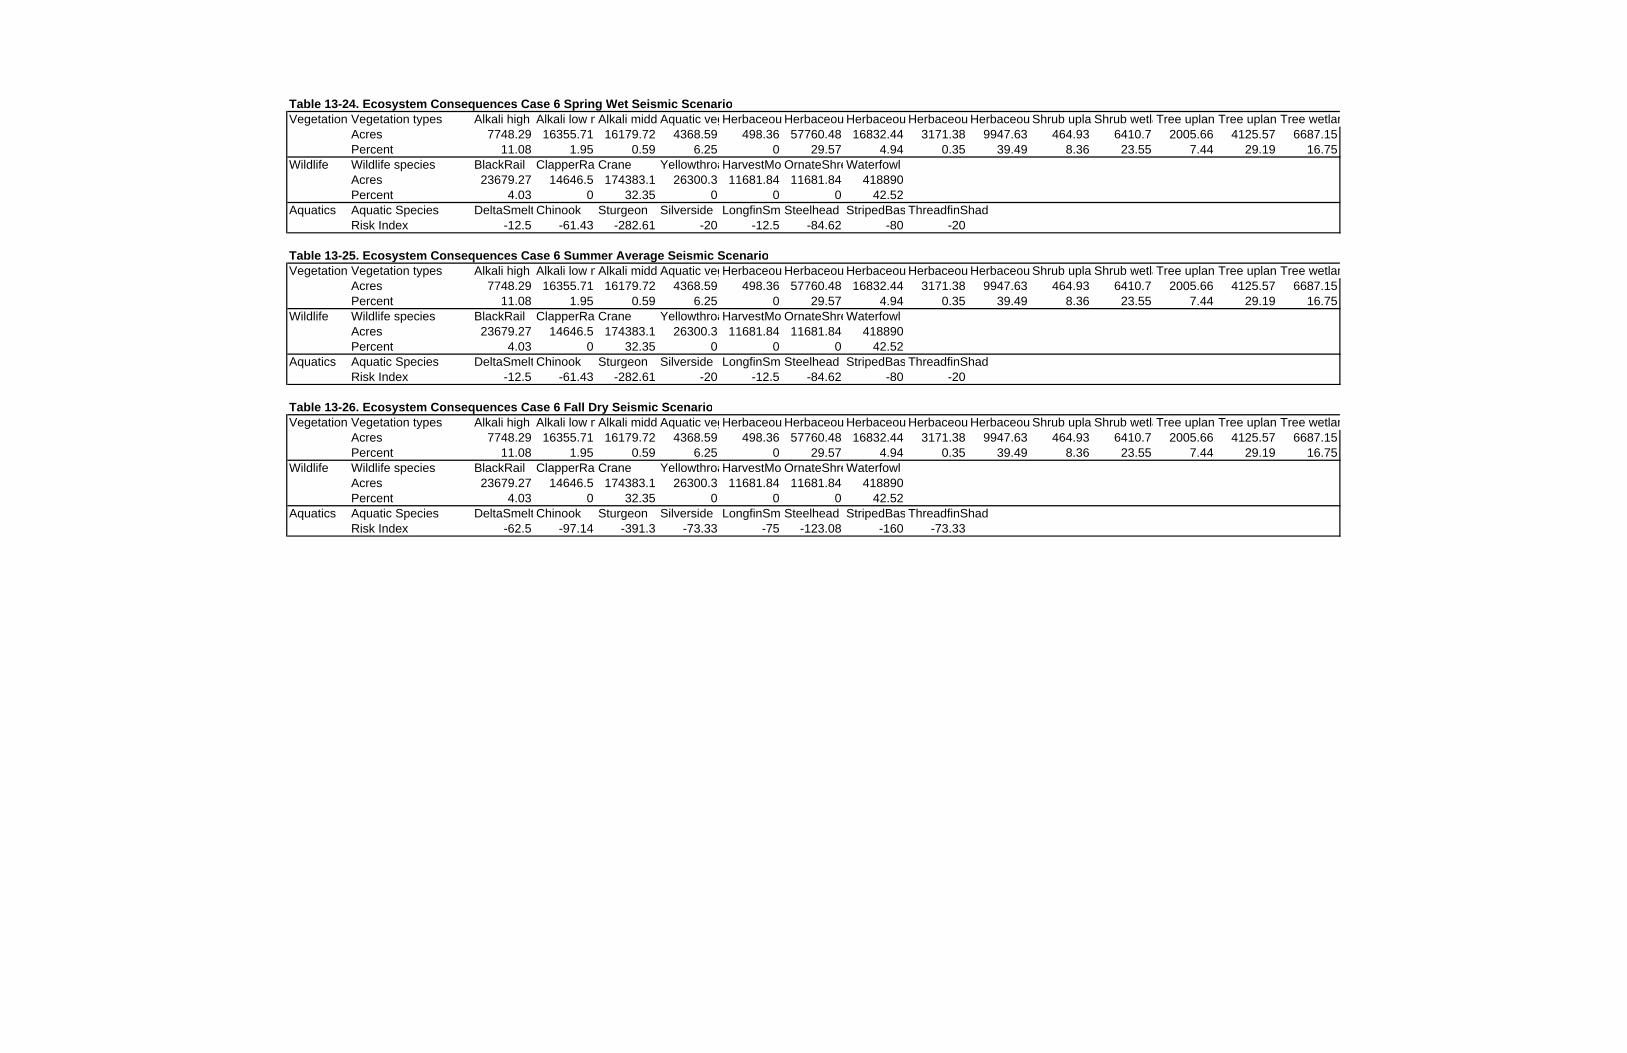
Table 13-24. Ecosystem Consequences Case 6 Spring Wet Seismic ScenarioVegetation Vegetation types Alkali high Alkali low mAlkali midd Aquatic vegHerbaceou Herbaceou Herbaceou Herbaceou Herbaceou Shrub upla Shrub wetlaTree uplandTree uplandTree wetlan
Acres 7748.29 16355.71 16179.72 4368.59 498.36 57760.48 16832.44 3171.38 9947.63 464.93 6410.7 2005.66 4125.57 6687.15Percent 11.08 1.95 0.59 6.25 0 29.57 4.94 0.35 39.49 8.36 23.55 7.44 29.19 16.75
Wildlife Wildlife species BlackRail ClapperRa Crane YellowthroaHarvestMo OrnateShreWaterfowlAcres 23679.27 14646.5 174383.1 26300.3 11681.84 11681.84 418890Percent 4.03 0 32.35 0 0 0 42.52
Aquatics Aquatic Species DeltaSmelt Chinook Sturgeon Silverside LongfinSmeSteelhead StripedBas ThreadfinShadRisk Index -12.5 -61.43 -282.61 -20 -12.5 -84.62 -80 -20
Table 13-25. Ecosystem Consequences Case 6 Summer Average Seismic ScenarioVegetation Vegetation types Alkali high Alkali low mAlkali midd Aquatic vegHerbaceou Herbaceou Herbaceou Herbaceou Herbaceou Shrub upla Shrub wetlaTree uplandTree uplandTree wetlan
Acres 7748.29 16355.71 16179.72 4368.59 498.36 57760.48 16832.44 3171.38 9947.63 464.93 6410.7 2005.66 4125.57 6687.15Percent 11.08 1.95 0.59 6.25 0 29.57 4.94 0.35 39.49 8.36 23.55 7.44 29.19 16.75
Wildlife Wildlife species BlackRail ClapperRa Crane YellowthroaHarvestMo OrnateShreWaterfowlAcres 23679.27 14646.5 174383.1 26300.3 11681.84 11681.84 418890Percent 4.03 0 32.35 0 0 0 42.52
Aquatics Aquatic Species DeltaSmelt Chinook Sturgeon Silverside LongfinSmeSteelhead StripedBas ThreadfinShadRisk Index -12.5 -61.43 -282.61 -20 -12.5 -84.62 -80 -20
Table 13-26. Ecosystem Consequences Case 6 Fall Dry Seismic ScenarioVegetation Vegetation types Alkali high Alkali low mAlkali midd Aquatic vegHerbaceou Herbaceou Herbaceou Herbaceou Herbaceou Shrub upla Shrub wetlaTree uplandTree uplandTree wetlan
Acres 7748.29 16355.71 16179.72 4368.59 498.36 57760.48 16832.44 3171.38 9947.63 464.93 6410.7 2005.66 4125.57 6687.15Percent 11.08 1.95 0.59 6.25 0 29.57 4.94 0.35 39.49 8.36 23.55 7.44 29.19 16.75
Wildlife Wildlife species BlackRail ClapperRa Crane YellowthroaHarvestMo OrnateShreWaterfowlAcres 23679.27 14646.5 174383.1 26300.3 11681.84 11681.84 418890Percent 4.03 0 32.35 0 0 0 42.52
Aquatics Aquatic Species DeltaSmelt Chinook Sturgeon Silverside LongfinSmeSteelhead StripedBas ThreadfinShadRisk Index -62.5 -97.14 -391.3 -73.33 -75 -123.08 -160 -73.33

Failure Scenario
No. of Flooded Islands
No. of Damaged Islands
In-Delta Costs ($M)
Statewide Cost ($M)
Total Cost ($M)
7 20 0 14,628 369 14,9978 30 0 21,364 380 21,744
Value of Lost Output
($M)Lost Employ-ment (Jobs)
Lost Labor Income ($M)
Lost Value Added ($M)
7 20 0 5,723 46,551 1,801 2,9018 30 0 7,501 60,893 2,393 3,884
Table 13-30 Summary of Economic Costs of Flood Failure Scenarios
Total Statewide Economic Impacts
Table 13-31 Summary of Economic Impacts of Flood Failure Scenarios
No. of Damaged Islands
No. of Flooded Islands
Failure Scenario
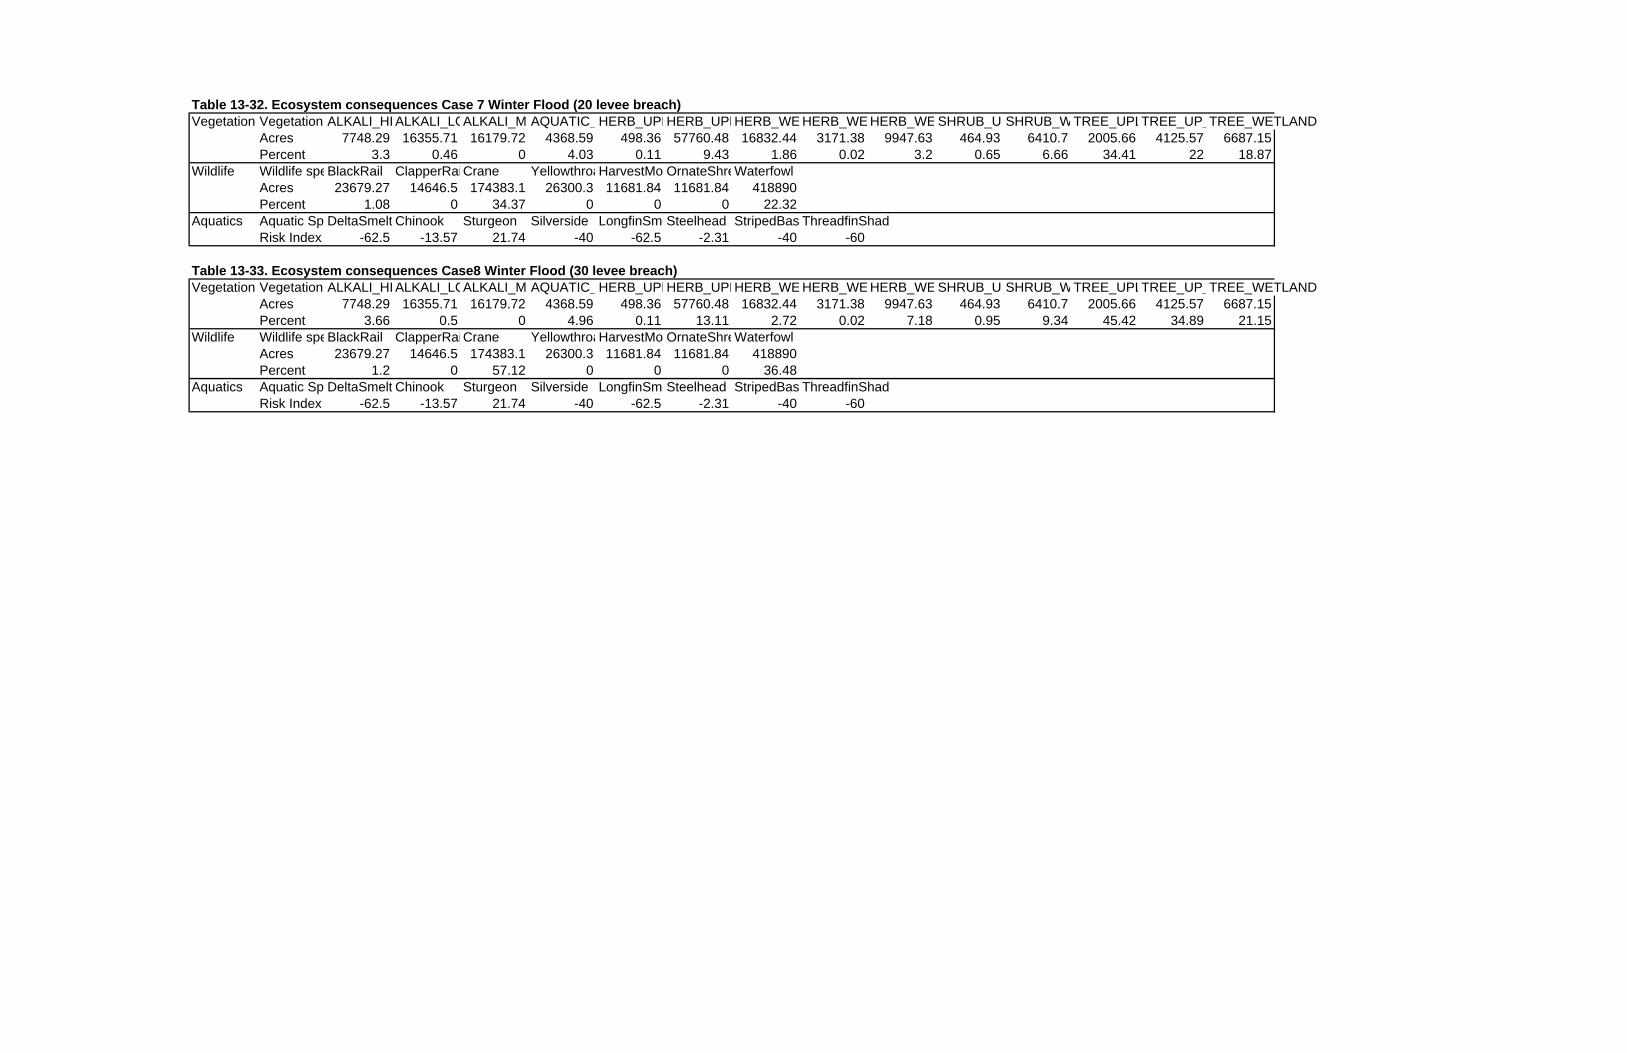
Table 13-32. Ecosystem consequences Case 7 Winter Flood (20 levee breach)Vegetation Vegetation ALKALI_HI ALKALI_LOALKALI_M AQUATIC_HERB_UPLHERB_UPRHERB_WE HERB_WE HERB_WE SHRUB_UPSHRUB_WTREE_UPLTREE_UP_TREE_WETLAND
Acres 7748.29 16355.71 16179.72 4368.59 498.36 57760.48 16832.44 3171.38 9947.63 464.93 6410.7 2005.66 4125.57 6687.15Percent 3.3 0.46 0 4.03 0.11 9.43 1.86 0.02 3.2 0.65 6.66 34.41 22 18.87
Wildlife Wildlife speBlackRail ClapperRaiCrane YellowthroaHarvestMo OrnateShreWaterfowlAcres 23679.27 14646.5 174383.1 26300.3 11681.84 11681.84 418890Percent 1.08 0 34.37 0 0 0 22.32
Aquatics Aquatic Sp DeltaSmelt Chinook Sturgeon Silverside LongfinSmeSteelhead StripedBas ThreadfinShadRisk Index -62.5 -13.57 21.74 -40 -62.5 -2.31 -40 -60
Table 13-33. Ecosystem consequences Case8 Winter Flood (30 levee breach)Vegetation Vegetation ALKALI_HI ALKALI_LOALKALI_M AQUATIC_HERB_UPLHERB_UPRHERB_WE HERB_WE HERB_WE SHRUB_UPSHRUB_WTREE_UPLTREE_UP_TREE_WETLAND
Acres 7748.29 16355.71 16179.72 4368.59 498.36 57760.48 16832.44 3171.38 9947.63 464.93 6410.7 2005.66 4125.57 6687.15Percent 3.66 0.5 0 4.96 0.11 13.11 2.72 0.02 7.18 0.95 9.34 45.42 34.89 21.15
Wildlife Wildlife speBlackRail ClapperRaiCrane YellowthroaHarvestMo OrnateShreWaterfowlAcres 23679.27 14646.5 174383.1 26300.3 11681.84 11681.84 418890Percent 1.2 0 57.12 0 0 0 36.48
Aquatics Aquatic Sp DeltaSmelt Chinook Sturgeon Silverside LongfinSmeSteelhead StripedBas ThreadfinShadRisk Index -62.5 -13.57 21.74 -40 -62.5 -2.31 -40 -60
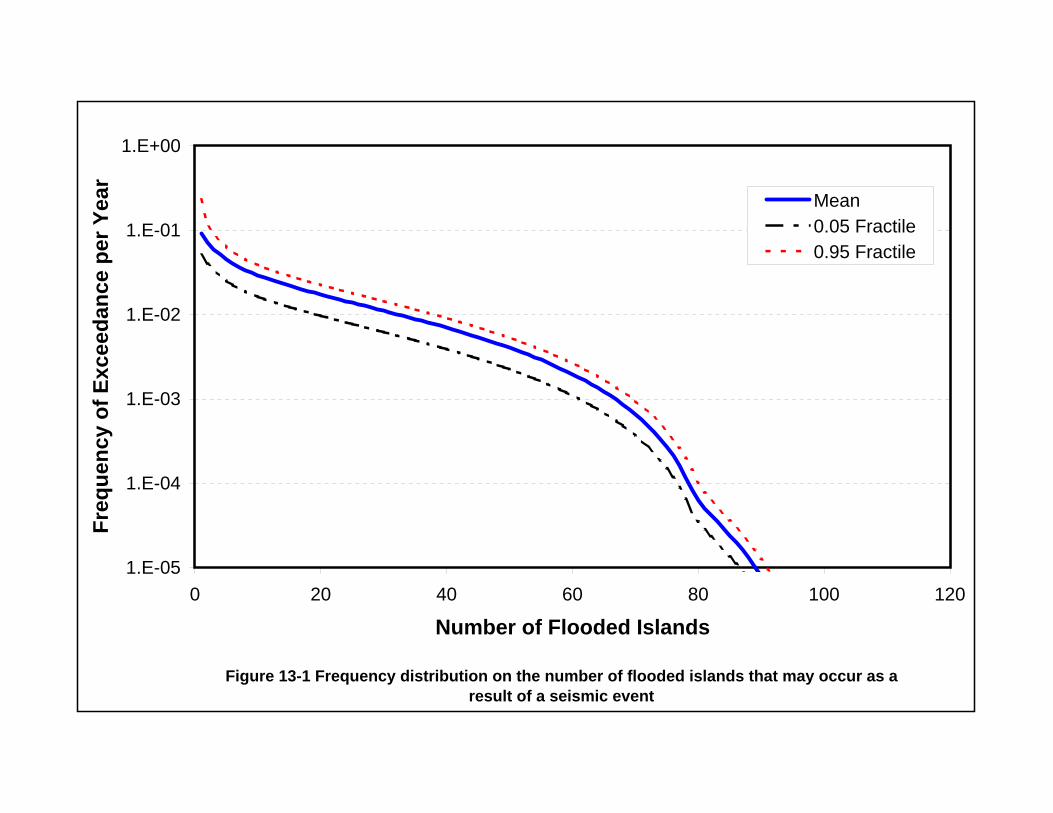
Figure 13-1 Frequency distribution on the number of flooded islands that may occur as a result of a seismic event
1.E-05
1.E-04
1.E-03
1.E-02
1.E-01
1.E+00
0 20 40 60 80 100 120
Number of Flooded Islands
Freq
uenc
y of
Exc
eeda
nce
per Y
ear
Mean0.05 Fractile0.95 Fractile
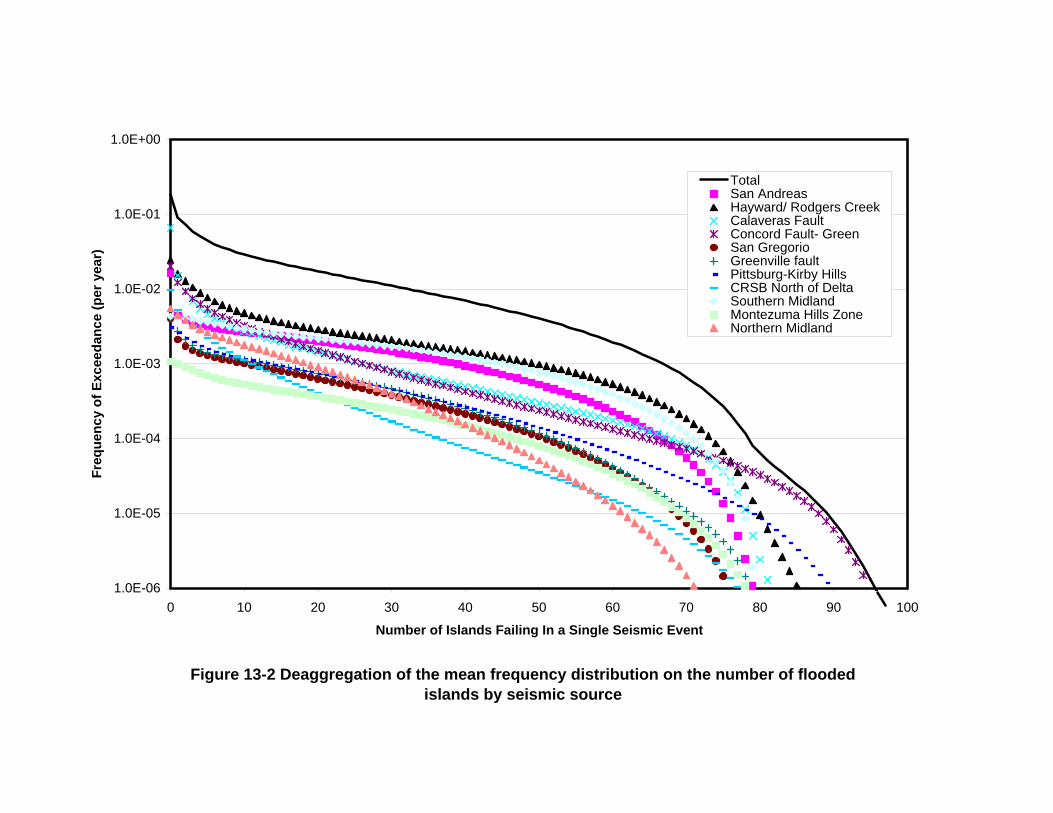
Figure 13-2 Deaggregation of the mean frequency distribution on the number of flooded islands by seismic source
1.0E-06
1.0E-05
1.0E-04
1.0E-03
1.0E-02
1.0E-01
1.0E+00
0 10 20 30 40 50 60 70 80 90 100
Number of Islands Failing In a Single Seismic Event
Freq
uenc
y of
Exc
eeda
nce
(per
yea
r)
TotalSan AndreasHayward/ Rodgers CreekCalaveras FaultConcord Fault- GreenSan GregorioGreenville faultPittsburg-Kirby HillsCRSB North of DeltaSouthern MidlandMontezuma Hills ZoneNorthern Midland

Figure 13-3 Estimate of the probability of occurrence of flooded islands due to seismic events for exposure periods of (a) 25, (b) 50 and (c) 100 years
0.0
0.1
0.2
0.3
0.4
0.5
0.6
0.7
0.8
0.9
1.0
0 20 40 60 80 100 120
Number of Flooded Islands
Prob
abili
ty o
f Exc
eeda
nce
in F
utur
e Ye
ars
25 Years50 Years100 Years
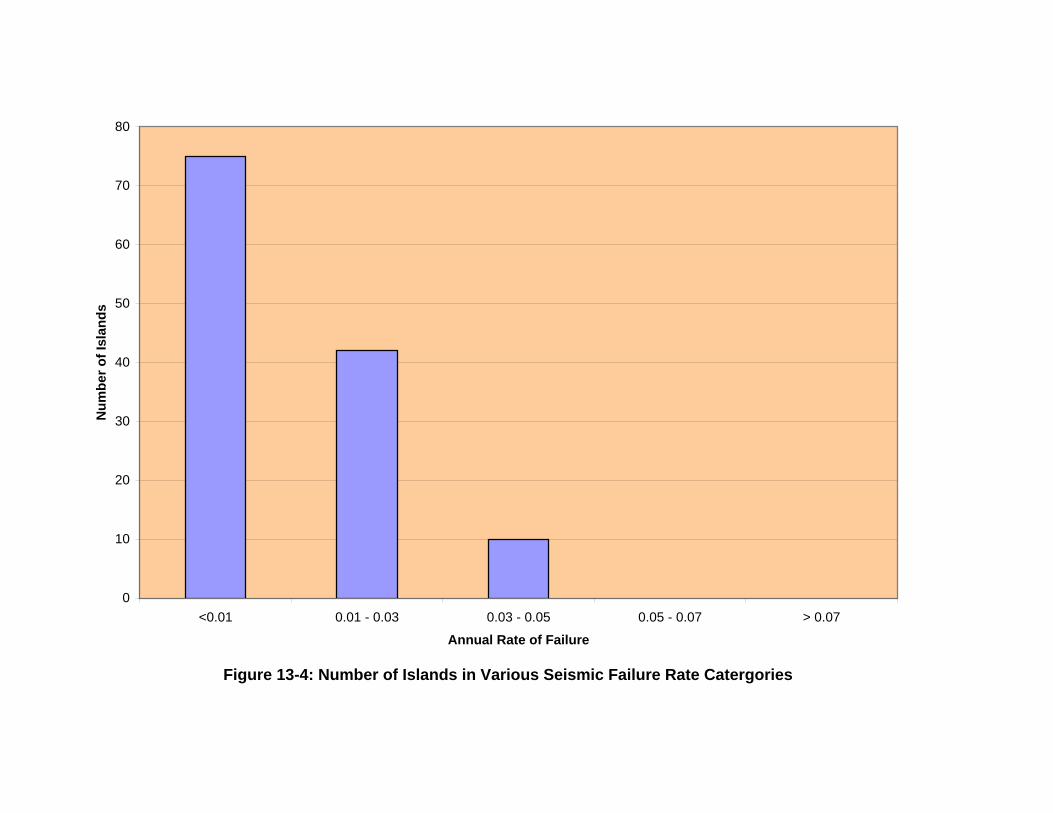
Figure 13-4: Number of Islands in Various Seismic Failure Rate Catergories
0
10
20
30
40
50
60
70
80
<0.01 0.01 - 0.03 0.03 - 0.05 0.05 - 0.07 > 0.07
Annual Rate of Failure
Num
ber o
f Isl
ands
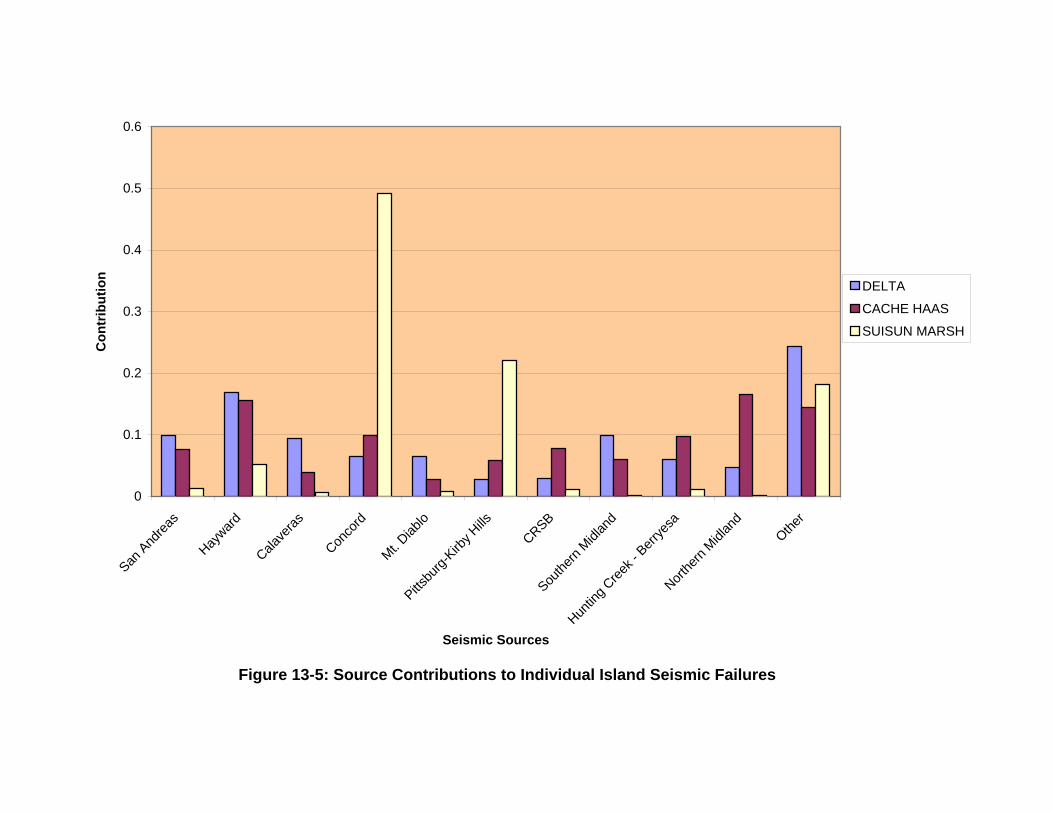
Figure 13-5: Source Contributions to Individual Island Seismic Failures
0
0.1
0.2
0.3
0.4
0.5
0.6
San A
ndrea
s
Hayward
Calave
ras
Conco
rd
Mt. Diab
loPitts
burg-
Kirby H
ills
CRSBSou
thern
Midlan
d
Huntin
g Cree
k - B
errye
saNort
hern
Midlan
d
Other
Seismic Sources
Con
trib
utio
n
DELTA
CACHE HAAS
SUISUN MARSH
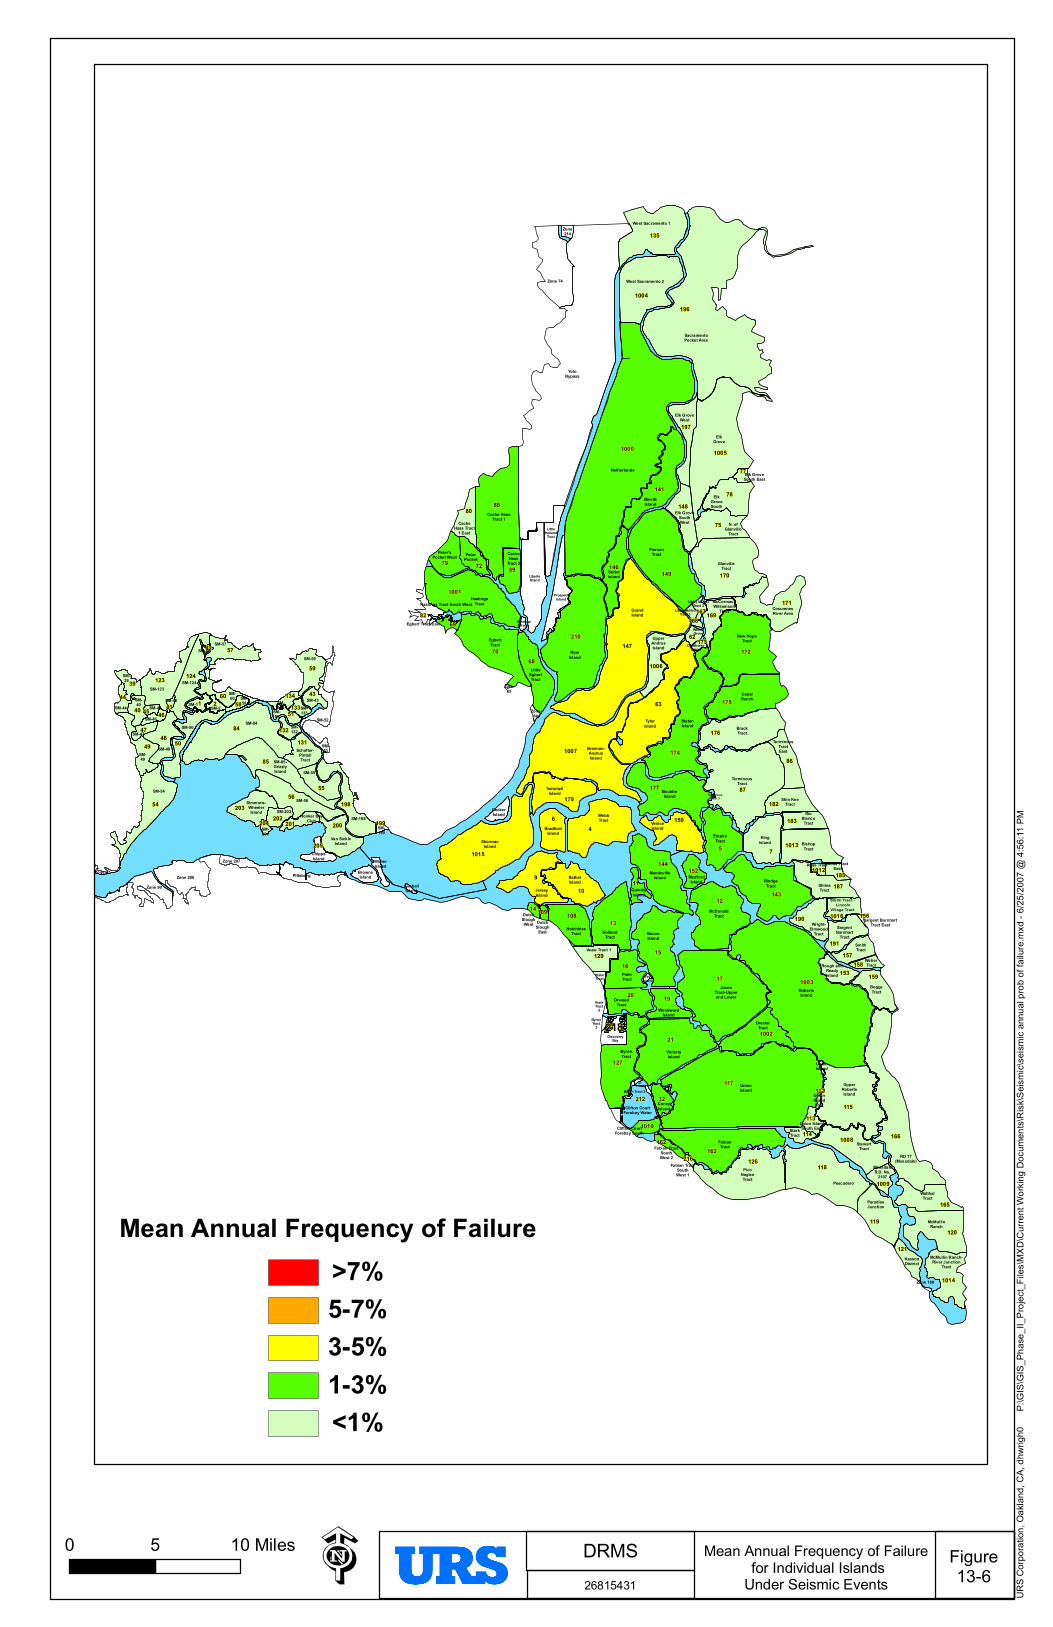
120119
165
1014
196
1000
117
100317
147
87
4
63
88
210
84
21
1015
166
1007
5
149
9
174
12
70
7
1005
172
15
118
115
170
143
126163
85
13
177
135
6
54
1001
176
127
175
144
1004
10
56
141
68
171
78
75
16
179
20
50
150
123
1008
86
124
48
79
108
198
1013
59
19
57
187
80
49
146
55
200
1002
89
148
197
203
212
159
190
182
191
72
60
131
1006
129
169
183
157
153
32
82
1016
39
140
11
121
152
218
432
44
202
205
51
201
47
1009
113
114
62
46
158
69
1010
132
185
58134
77
162
13345
168167
14
41
1012
204
109
173
112
199
216
42
156
RobertsIsland
Byron Tract 2
MossdaleR.D. No.
2107
UpperAndrusIsland
DrexlerTract
Fabian TractSouthWest 1
Fabian TractSouthWest 2
TerminousTract 3
TerminousTract
LittleHolland
Tract
CacheHaas
Tract 2
Cache HaasTract 1
West Sacramento 1Zone214
Zone 74
ByronTract
DiscoveryBay
ByronTract
3
SargentBarnhart
Tract
Clifton CourtForebay Water
GrandIsland
UpperRobertsIsland
UnionIsland
UnionIsland
4
JonesTract-Upperand Lower
Wright-Elmwood
Tract
OrwoodTract
PalmTract
Veale Tract 1
QuimbyIsland
BaconIsland
WoodwardIsland
McDonaldTract
MedfordIsland
BethelIsland
JerseyIsland
HotchkissTract
DutchSlough
East
DutchSloughWest
MandevilleIsland
VeniceIsland
WebbTract
BradfordIsland
TwitchellIsland
VictoriaIsland
Zone31
FabianTract
PicoNagleeTract Pescadero
RD 17(Mossdale)
McMullinRanch
ParadiseJunction
McMullin Ranch-River Junction
Tract
WinterIsland
TerminousTractEast
TylerIsland
WalnutGrove
Zone64
LittleEgbertTract
EgbertTract
PiersonTract
HastingsTract
Elk GroveSouthWest N. of
GlanvilleTract
PeterPocket
Peter'sPocket West
SutterIsland
Elk GroveWest
ProspectIsland
RyerIsland
Pittsburg
KimballIsland
Zone 207
Zone 206
ChippsIsland
SM-204
Simmons-WheelerIsland SM-202
Honker BayClub
Van SickleIsland
SM-199
SM-198
SacramentoPocket Area
West Sacramento 2
YoloBypass
Smith Tract - Lincoln
Village Tract
ShimaTract
Atlas TractAtlas TractEast
BishopTract
RioBlancoTract
Shin KeeTract
ShermanIsland
Brannan-AndrusIsland
BouldinIsland
BrackTract
CanalRanch
StatenIsland
DeadhorseIsland
New HopeTract
CosumnesRiver Area
GlanvilleTract
McCormackWilliamson
TractLibby McNeilTract 1
Libby McNeilTract 2
WalthalTract
StewartTract
Zone 160
BoggsTract
WeberTract
SmithTract
Sargent BarnhartTract East
Rough andReadyIsland
RindgeTract
Netherlands
MerrittIsland
LiberteIsland
SM-134 SM-
133
SM-132
Schafter-PintailTract
VealeTract
2
Clifton CourtForebay South
BixlerTract
SM-124SM-123
KassonDistrict
StarkTract
Union IslandSouth East
UnionIslandEast
BrownsIsland
Zone 90
SM-85-GrizzlyIsland
SM-84
Hastings Tract South West
CacheHaas Tract
1 East
ElkGroveSouth
Elk GroveSouth East
ElkGrove
HastingsTract
1Egbert Tract East
Zone65SM-
60
SM-59
SM-58
SM-57
SM-56
SM-55
SM-54
SM-53
SM-52SM-51
SM-50
SM-49
SM-48
SM-47
SM-46
SM-45SM-44SM-43
SM-42
SM-41SM-40
SM-39
Zone 37
Zone33
ConeyIsland
FayIsland
HollandTract
KingIsland
EmpireTract
DeckerIsland
SM-2SM-1
0 105 Miles Figure13-6
DRMS26815431
Mean Annual Frequency of Failure for Individual IslandsUnder Seismic Events
Mean Annual Frequency of Failure>7%5-7%3-5%1-3%<1%
URS C
orpora
tion,
Oakla
nd, C
A, dh
wrigh
0P:\
GIS\
GIS_
Phas
e_II_
Proje
ct_Fil
es\M
XD\C
urren
t Work
ing D
ocum
ents\
Risk
\Seis
mic\s
eismi
c ann
ual p
rob of
failu
re.mx
d - 6/
25/20
07 @
4:56
:11 PM
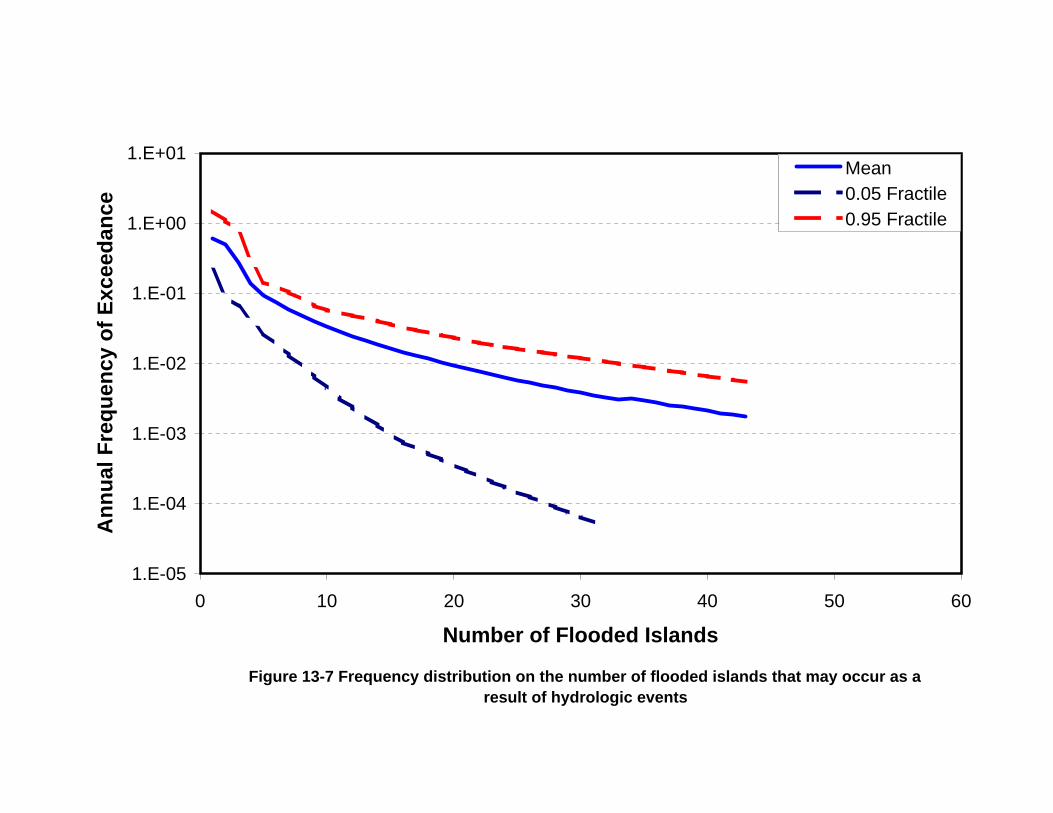
Figure 13-7 Frequency distribution on the number of flooded islands that may occur as a result of hydrologic events
1.E-05
1.E-04
1.E-03
1.E-02
1.E-01
1.E+00
1.E+01
0 10 20 30 40 50 60
Number of Flooded Islands
Ann
ual F
requ
ency
of E
xcee
danc
e
Mean0.05 Fractile0.95 Fractile

0.0
0.1
0.2
0.3
0.4
0.5
0.6
0.7
0.8
0.9
1.0
0 10 20 30 40 50 60 70
Number of Flooded Islands
Prob
abili
ty o
f Exc
eeda
nce
in 2
5 Ye
ars
Mean0.050.95
(a) Probability of Exceedance in 25 Years
0.0
0.1
0.2
0.3
0.4
0.5
0.6
0.7
0.8
0.9
1.0
0 10 20 30 40 50 60 70
Number of Flooded Islands
Prob
abili
ty o
f Exc
eeda
nce
in 2
5 Ye
ars
Mean0.050.95
(b) Probability of Exceedance in 50 Years
0.0
0.1
0.2
0.3
0.4
0.5
0.6
0.7
0.8
0.9
1.0
0 10 20 30 40 50 60 70
Number of Flooded Islands
Prob
abili
ty o
f Exc
eeda
nce
in 2
5 Ye
ars
Mean0.050.95
(c) Probability of Exceedance in 100 Years
Figure 13-8 Estimate of the probability of occurrence of flooded islands due to hydrologic events for future periods of a)25, b) 50 and c) 100 years
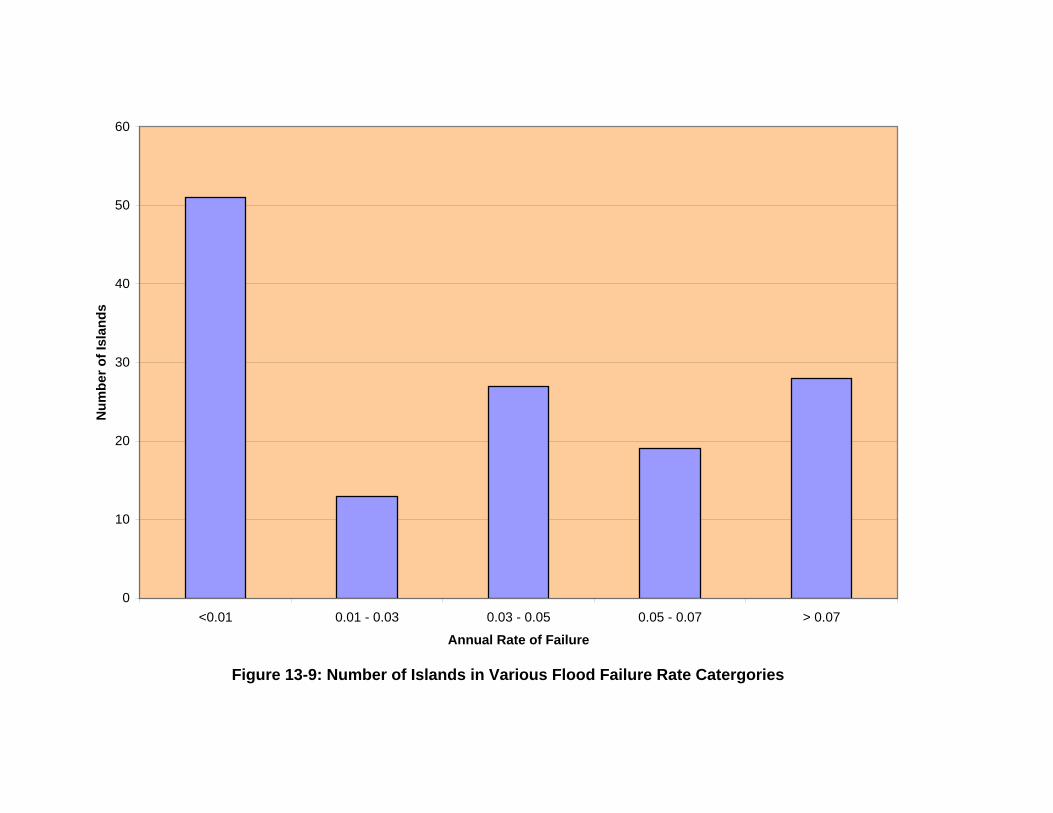
Figure 13-9: Number of Islands in Various Flood Failure Rate Catergories
0
10
20
30
40
50
60
<0.01 0.01 - 0.03 0.03 - 0.05 0.05 - 0.07 > 0.07
Annual Rate of Failure
Num
ber o
f Isl
ands

120119
165
1014
196
1000
117
100317
147
87
4
63
88
210
84
21
1015
166
1007
5
149
9
174
12
70
7
1005
172
15
118
115
170
143
126163
85
13
177
135
6
54
1001
176
127
175
144
1004
10
56
141
68
171
78
75
16
179
20
50
150
123
1008
86
124
48
79
108
198
1013
59
19
57
187
80
49
146
55
200
1002
89
148
197
203
212
159
190
182
191
72
60
131
1006
129
169
183
157
153
32
82
1016
39
140
11
121
152
218
432
44
202
205
51
201
47
1009
113
114
62
46
158
69
1010
132
185
58134
77
162
13345
168167
14
41
1012
204
109
173
112
199
216
42
156
RobertsIsland
Byron Tract 2
MossdaleR.D. No.
2107
UpperAndrusIsland
DrexlerTract
Fabian TractSouthWest 1
Fabian TractSouthWest 2
TerminousTract 3
TerminousTract
LittleHolland
Tract
CacheHaas
Tract 2
Cache HaasTract 1
West Sacramento 1Zone214
Zone 74
ByronTract
DiscoveryBay
ByronTract
3
SargentBarnhart
Tract
Clifton CourtForebay Water
GrandIsland
UpperRobertsIsland
UnionIsland
UnionIsland
4
JonesTract-Upperand Lower
Wright-Elmwood
Tract
OrwoodTract
PalmTract
Veale Tract 1
QuimbyIsland
BaconIsland
WoodwardIsland
McDonaldTract
MedfordIsland
BethelIsland
JerseyIsland
HotchkissTract
DutchSlough
East
DutchSloughWest
MandevilleIsland
VeniceIsland
WebbTract
BradfordIsland
TwitchellIsland
VictoriaIsland
Zone31
FabianTract
PicoNagleeTract Pescadero
RD 17(Mossdale)
McMullinRanch
ParadiseJunction
McMullin Ranch-River Junction
Tract
WinterIsland
TerminousTractEast
TylerIsland
WalnutGrove
Zone64
LittleEgbertTract
EgbertTract
PiersonTract
HastingsTract
Elk GroveSouthWest N. of
GlanvilleTract
PeterPocket
Peter'sPocket West
SutterIsland
Elk GroveWest
ProspectIsland
RyerIsland
Pittsburg
KimballIsland
Zone 207
Zone 206
ChippsIsland
SM-204
Simmons-WheelerIsland SM-202
Honker BayClub
Van SickleIsland
SM-199
SM-198
SacramentoPocket Area
West Sacramento 2
YoloBypass
Smith Tract - Lincoln
Village Tract
ShimaTract
Atlas TractAtlas TractEast
BishopTract
RioBlancoTract
Shin KeeTract
ShermanIsland
Brannan-AndrusIsland
BouldinIsland
BrackTract
CanalRanch
StatenIsland
DeadhorseIsland
New HopeTract
CosumnesRiver Area
GlanvilleTract
McCormackWilliamson
TractLibby McNeilTract 1
Libby McNeilTract 2
WalthalTract
StewartTract
Zone 160
BoggsTract
WeberTract
SmithTract
Sargent BarnhartTract East
Rough andReadyIsland
RindgeTract
Netherlands
MerrittIsland
LiberteIsland
SM-134 SM-
133
SM-132
Schafter-PintailTract
VealeTract
2
Clifton CourtForebay South
BixlerTract
SM-124SM-123
KassonDistrict
StarkTract
Union IslandSouth East
UnionIslandEast
BrownsIsland
Zone 90
SM-85-GrizzlyIsland
SM-84
Hastings Tract South West
CacheHaas Tract
1 East
ElkGroveSouth
Elk GroveSouth East
ElkGrove
HastingsTract
1Egbert Tract East
Zone65SM-
60
SM-59
SM-58
SM-57
SM-56
SM-55
SM-54
SM-53
SM-52SM-51
SM-50
SM-49
SM-48
SM-47
SM-46
SM-45SM-44SM-43
SM-42
SM-41SM-40
SM-39
Zone 37
Zone33
ConeyIsland
FayIsland
HollandTract
KingIsland
EmpireTract
DeckerIsland
SM-2SM-1
0 105 Miles Figure13-10a
DRMS26815431
Mean Annual Frequency of Failure for Individual Islands
Under Flooding Events
Mean Annual Frequency of Failure>7%5-7%3-5%1-3%<1%
URS C
orpora
tion,
Oakla
nd, C
A, dh
wrigh
0P:\
GIS\
GIS_
Phas
e_II_
Proje
ct_Fil
es\M
XD\C
urren
t Work
ing D
ocum
ents\
Risk
\Floo
ding\F
loodin
g ann
ual p
rob of
failu
re.mx
d - 6/
25/20
07 @
4:59
:21 P
M

120119
165
1014
196
1000
117
100317
147
87
4
63
88
210
84
21
1015
166
1007
5
149
9
174
12
70
7
1005
172
15
118
115
170
143
126163
85
13
177
135
6
54
1001
176
127
175
144
1004
10
56
141
68
171
78
75
16
179
20
50
150
123
1008
86
124
48
79
108
198
1013
59
19
57
187
80
49
146
55
200
1002
89
148
197
203
212
159
190
182
191
72
60
131
1006
129
169
183
157
153
32
82
1016
39
140
11
121
152
218
432
44
202
205
51
201
47
1009
113
114
62
46
158
69
1010
132
185
58134
77
162
13345
168167
14
41
1012
204
109
173
112
199
216
42
156
RobertsIsland
Byron Tract 2
MossdaleR.D. No.
2107
UpperAndrusIsland
DrexlerTract
Fabian TractSouthWest 1
Fabian TractSouthWest 2
TerminousTract 3
TerminousTract
LittleHolland
Tract
CacheHaas
Tract 2
Cache HaasTract 1
West Sacramento 1Zone214
Zone 74
ByronTract
DiscoveryBay
ByronTract
3
SargentBarnhart
Tract
Clifton CourtForebay Water
GrandIsland
UpperRobertsIsland
UnionIsland
UnionIsland
4
JonesTract-Upperand Lower
Wright-Elmwood
Tract
OrwoodTract
PalmTract
Veale Tract 1
QuimbyIsland
BaconIsland
WoodwardIsland
McDonaldTract
MedfordIsland
BethelIsland
JerseyIsland
HotchkissTract
DutchSlough
East
DutchSloughWest
MandevilleIsland
VeniceIsland
WebbTract
BradfordIsland
TwitchellIsland
VictoriaIsland
Zone31
FabianTract
PicoNagleeTract Pescadero
RD 17(Mossdale)
McMullinRanch
ParadiseJunction
McMullin Ranch-River Junction
Tract
WinterIsland
TerminousTractEast
TylerIsland
WalnutGrove
Zone64
LittleEgbertTract
EgbertTract
PiersonTract
HastingsTract
Elk GroveSouthWest N. of
GlanvilleTract
PeterPocket
Peter'sPocket West
SutterIsland
Elk GroveWest
ProspectIsland
RyerIsland
Pittsburg
KimballIsland
Zone 207
Zone 206
ChippsIsland
SM-204
Simmons-WheelerIsland SM-202
Honker BayClub
Van SickleIsland
SM-199
SM-198
SacramentoPocket Area
West Sacramento 2
YoloBypass
Smith Tract - Lincoln
Village Tract
ShimaTract
Atlas TractAtlas TractEast
BishopTract
RioBlancoTract
Shin KeeTract
ShermanIsland
Brannan-AndrusIsland
BouldinIsland
BrackTract
CanalRanch
StatenIsland
DeadhorseIsland
New HopeTract
CosumnesRiver Area
GlanvilleTract
McCormackWilliamson
TractLibby McNeilTract 1
Libby McNeilTract 2
WalthalTract
StewartTract
Zone 160
BoggsTract
WeberTract
SmithTract
Sargent BarnhartTract East
Rough andReadyIsland
RindgeTract
Netherlands
MerrittIsland
LiberteIsland
SM-134 SM-
133
SM-132
Schafter-PintailTract
VealeTract
2
Clifton CourtForebay South
BixlerTract
SM-124SM-123
KassonDistrict
StarkTract
Union IslandSouth East
UnionIslandEast
BrownsIsland
Zone 90
SM-85-GrizzlyIsland
SM-84
Hastings Tract South West
CacheHaas Tract
1 East
ElkGroveSouth
Elk GroveSouth East
ElkGrove
HastingsTract
1Egbert Tract East
Zone65SM-
60
SM-59
SM-58
SM-57
SM-56
SM-55
SM-54
SM-53
SM-52SM-51
SM-50
SM-49
SM-48
SM-47
SM-46
SM-45SM-44SM-43
SM-42
SM-41SM-40
SM-39
Zone 38Zone 37
Zone33
ConeyIsland
FayIsland
HollandTract
KingIsland
EmpireTract
DeckerIsland
SM-2SM-1
IncompleteHistorical
Data
0 5 102.5 Miles Figure13-10b
DRMS26815935
Historical Number of Failures in theLast 100 years for Individual
Islands Under Flooding Events
Number of Failuresin the Last 100 years
>75-73-51-3<1
URS C
orpora
tion,
Oakla
nd, C
A, dh
wrigh
0P:\
GIS\
GIS_
Phas
e_II_
Proje
ct_Fil
es\M
XD\C
urren
t Work
ing D
ocum
ents\
Risk
\Floo
ding\H
istori
cal In
unda
tion F
ailure
Map
.mxd
- 6/25
/2007
@ 4:
59:11
PM
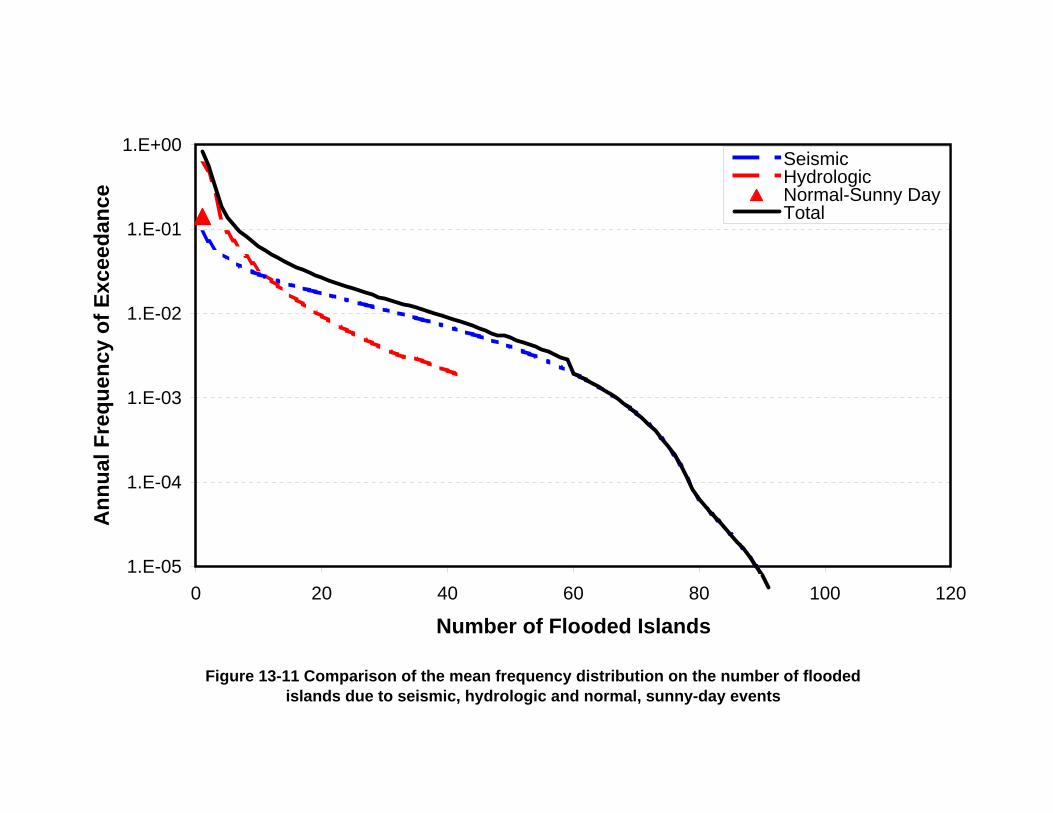
Figure 13-11 Comparison of the mean frequency distribution on the number of flooded islands due to seismic, hydrologic and normal, sunny-day events
1.E-05
1.E-04
1.E-03
1.E-02
1.E-01
1.E+00
0 20 40 60 80 100 120
Number of Flooded Islands
Ann
ual F
requ
ency
of E
xcee
danc
e
SeismicHydrologicNormal-Sunny DayTotal
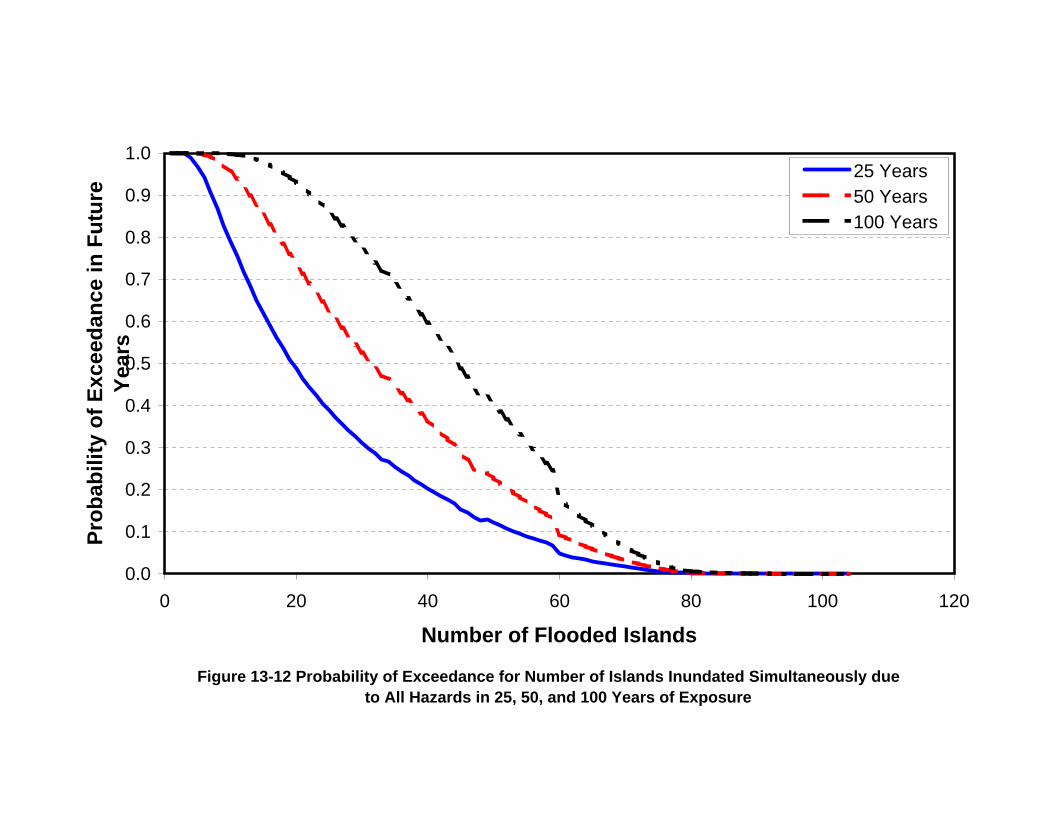
Figure 13-12 Probability of Exceedance for Number of Islands Inundated Simultaneously due to All Hazards in 25, 50, and 100 Years of Exposure
0.0
0.1
0.2
0.3
0.4
0.5
0.6
0.7
0.8
0.9
1.0
0 20 40 60 80 100 120
Number of Flooded Islands
Prob
abili
ty o
f Exc
eeda
nce
in F
utur
e Ye
ars
25 Years50 Years100 Years
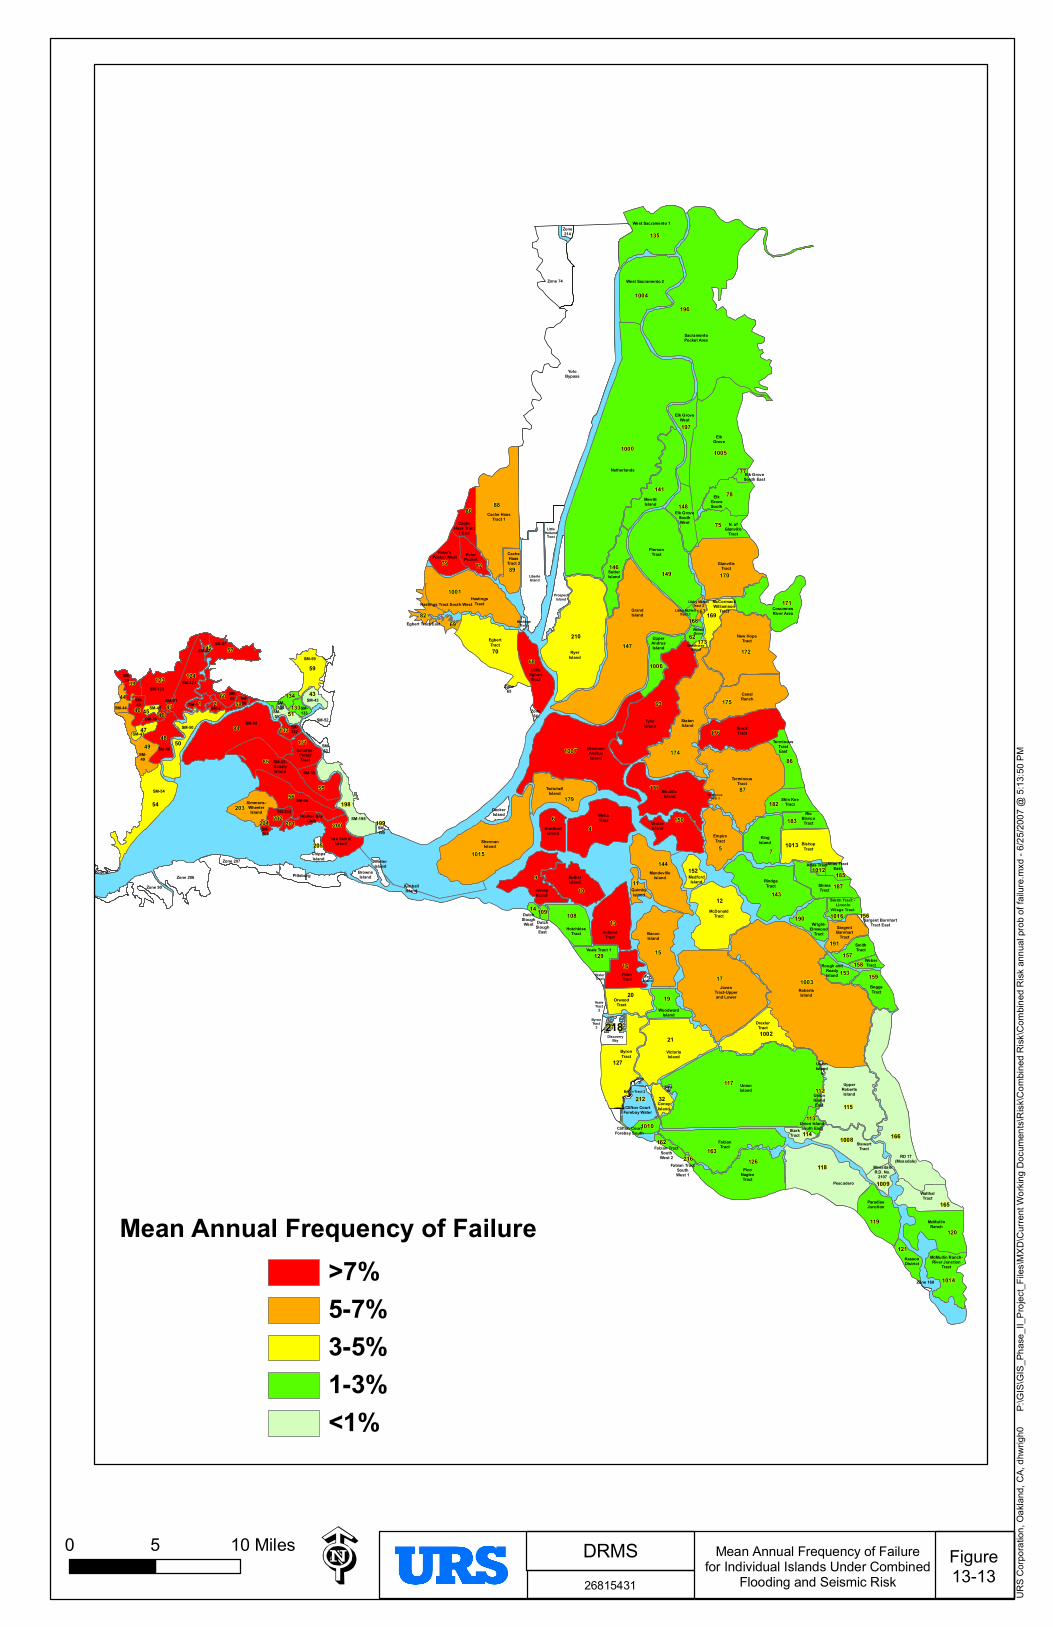
120119
165
1014
196
1000
117
100317
147
87
4
63
88
210
84
21
1015
166
1007
5
149
9
174
12
70
7
1005
172
15
118
115
170
143
126163
85
13
177
135
6
54
1001
176
127
175
144
1004
10
56
141
68
171
78
75
16
179
20
50
150
123
1008
86
124
48
79
108
198
1013
59
19
57
187
80
49
146
55
200
1002
89
148
197
203
212
159
190
182
191
72
60
131
1006
129
169
183
157
153
32
82
1016
39
140
11
121
152
218
432
44
202
205
51
201
47
1009
113
114
62
46
158
69
1010
132
185
58134
77
162
13345
168167
14
41
1012
204
109
173
112
199
216
42
156
RobertsIsland
Byron Tract 2
MossdaleR.D. No.
2107
UpperAndrusIsland
DrexlerTract
Fabian TractSouthWest 1
Fabian TractSouthWest 2
TerminousTract 3
TerminousTract
LittleHolland
Tract
CacheHaas
Tract 2
Cache HaasTract 1
West Sacramento 1Zone214
Zone 74
ByronTract
DiscoveryBay
ByronTract
3
SargentBarnhart
Tract
Clifton CourtForebay Water
GrandIsland
UpperRobertsIsland
UnionIsland
UnionIsland
4
JonesTract-Upperand Lower
Wright-Elmwood
Tract
OrwoodTract
PalmTract
Veale Tract 1
QuimbyIsland
BaconIsland
WoodwardIsland
McDonaldTract
MedfordIsland
BethelIsland
JerseyIsland
HotchkissTract
DutchSlough
East
DutchSloughWest
MandevilleIsland
VeniceIsland
WebbTract
BradfordIsland
TwitchellIsland
VictoriaIsland
Zone31
FabianTract
PicoNagleeTract Pescadero
RD 17(Mossdale)
McMullinRanch
ParadiseJunction
McMullin Ranch-River Junction
Tract
WinterIsland
TerminousTractEast
TylerIsland
WalnutGrove
Zone64
LittleEgbertTract
EgbertTract
PiersonTract
HastingsTract
Elk GroveSouthWest N. of
GlanvilleTract
PeterPocket
Peter'sPocket West
SutterIsland
Elk GroveWest
ProspectIsland
RyerIsland
Pittsburg
KimballIsland
Zone 207
Zone 206
ChippsIsland
SM-204
Simmons-WheelerIsland SM-202
Honker BayClub
Van SickleIsland
SM-199
SM-198
SacramentoPocket Area
West Sacramento 2
YoloBypass
Smith Tract - Lincoln
Village Tract
ShimaTract
Atlas TractAtlas TractEast
BishopTract
RioBlancoTract
Shin KeeTract
ShermanIsland
Brannan-AndrusIsland
BouldinIsland
BrackTract
CanalRanch
StatenIsland
DeadhorseIsland
New HopeTract
CosumnesRiver Area
GlanvilleTract
McCormackWilliamson
TractLibby McNeilTract 1
Libby McNeilTract 2
WalthalTract
StewartTract
Zone 160
BoggsTract
WeberTract
SmithTract
Sargent BarnhartTract East
Rough andReadyIsland
RindgeTract
Netherlands
MerrittIsland
LiberteIsland
SM-134 SM-
133
SM-132
Schafter-PintailTract
VealeTract
2
Clifton CourtForebay South
BixlerTract
SM-124SM-123
KassonDistrict
StarkTract
Union IslandSouth East
UnionIslandEast
BrownsIsland
Zone 90
SM-85-GrizzlyIsland
SM-84
Hastings Tract South West
CacheHaas Tract
1 East
ElkGroveSouth
Elk GroveSouth East
ElkGrove
HastingsTract
1Egbert Tract East
Zone65SM-
60
SM-59
SM-58
SM-57
SM-56
SM-55
SM-54
SM-53
SM-52SM-51
SM-50
SM-49
SM-48
SM-47
SM-46
SM-45SM-44SM-43
SM-42
SM-41SM-40
SM-39
Zone 37
Zone33
ConeyIsland
FayIsland
HollandTract
KingIsland
EmpireTract
DeckerIsland
SM-2SM-1
0 105 Miles Figure13-13
DRMS26815431
Mean Annual Frequency of Failurefor Individual Islands Under Combined
Flooding and Seismic Risk
Mean Annual Frequency of Failure>7%5-7%3-5%1-3%<1%
URS C
orpora
tion,
Oakla
nd, C
A, dh
wrigh
0P:\
GIS\
GIS_
Phas
e_II_
Proje
ct_Fil
es\M
XD\C
urren
t Work
ing D
ocum
ents\
Risk
\Com
bined
Risk
\Com
bined
Risk
annu
al pro
b of fa
ilure.
mxd -
6/25
/2007
@ 5:
13:50
PM
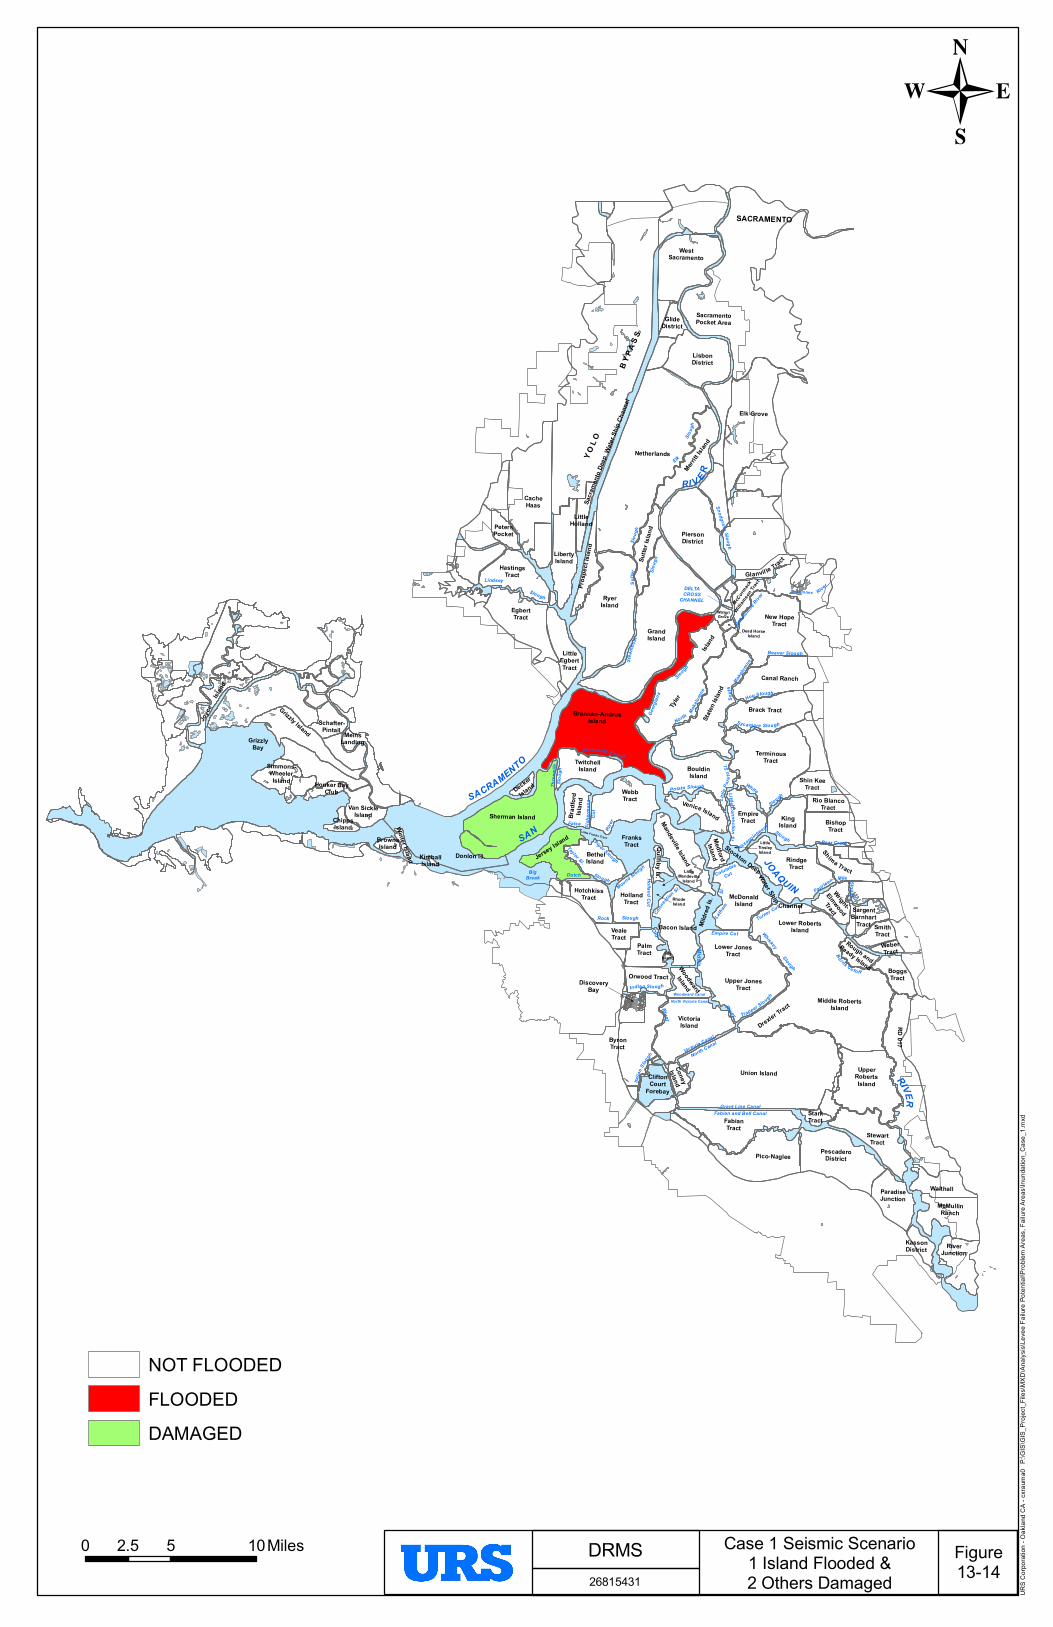
FranksTract
Sevenmile Slough
DELTACROSS
CHANNEL
Island
LindseySlough
Victoria Canal
North Canal
Trapper Slough
North Victoria CanalWoodward Canal
Whiskey Slough
Empire Cut
Indian Slough
Grant Line CanalFabian and Bell Canal
Italia
n Slou
gh
SloughRock
Dutch Slough
Taylor Sl.
Piper Slough
Conn
ection
Sl.
ColumbiaCut
Mound Slough
Holland Cut
Latha
mSl.
Turner Cut
Litt le Co n n ection Sl.
DissapointmentSlough
White
SloughPotato Slough
Littl e
Pota
to Sl
.
Burns Cutoff
Fourteen- Mile Slough
Fishe
rman
sCu
t
False
River
Thre
emile
Sloug
h
Hog Slough
Beaver Slough
SACRAMENTO
YOLO
B YPA
S S
RI V ER
SACRAMENTO
Water
Ship
Chan
nel
Sacra
mento
Dee
p
LittleTinsleyIsland
RhodeIsland
LittleMandeville
Island
Litt le Franks Tract
Lower RobertsIsland
UpperRobertsIsland
Netherlands
VealeTract
Middle RobertsIsland
Union Island
GrandIsland
RyerIsland
Upper JonesTract
ByronTract
Lower JonesTract
DiscoveryBay
RIVER
JOAQUIN
Tyler
TerminousTract
Staten
Islan
dBrannan-Andrus
Island
PiersonDistrict
Sherman Island
New HopeTract
FabianTract
Brack Tract
RindgeTract
Canal Ranch
VictoriaIsland
WebbTract
StewartTract
Bacon Island
BouldinIsland
McDonaldIsland
Merritt
Island
HastingsTract
HollandTract
BishopTract
Mandeville Island
BethelIsland
EmpireTract King
Island
Jersey Island
Venice Island
Drexler Tract
PalmTract
Sh ima Tract
TwitchellIsland
Sutte
r Islan
d
HotchkissTract
SargentBarnhart
Tract
Orwood Tract
Shin KeeTract
Van SickleIsland Br
adfor
dIsl
and
Wright-
Elmwood
Tract
Woodward
Island
Glanvil le Tract
CliftonCourt
Forebay
Rio BlancoTract
ChippsIsland
BrownsIsland
Pros
pect
Islan
d
MedfordIsland
ConeyIsland
Mildr
ed Is
.
McCorm
ack
William
son T
ract
Rough andReady Island
Quimby Is.
Decker
Island
Winter Island KimballIsland
Dead HorseIsland
FayIsland
SAN
Sycamore Slough
Stockton Deep
Channel
BigBreak
Stea
mboa
t
Sloug
hGe
orgian
a
Slough
Sutte
rSlo
ugh
Elk
Slou g
h
Snodgrass Slough
Honker BayClub
Simmons-WheelerIsland
WestSacramento
LisbonDistrict
GlideDistrict
LibertyIsland
CacheHaas
PetersPocket
GrizzlyBay
MeinsLanding
Grizzly Island
McMullinRanch
RiverJunction
KassonDistrict
ParadiseJunction
PescaderoDistrictPico-Naglee
Walthall
StarkTract
SmithTract
BoggsTract
WeberTract
Schafter-Pintail
EgbertTract
RD 017
Water Ship
Bear Creek
Mokelumne R
iver Cosumnes River
North
Mokelu
mne
Sout
h
Moke
lumne
SacramentoPocket Area
Donlon Is.
LittleEgbertTract
LittleHolland
Middle
River
OldRiver
Joyc
eIsla
nd
Elk Grove
WalnutGrove
0 5 102.5 Miles Figure13-14
DRMS26815431
Case 1 Seismic Scenario1 Island Flooded &2 Others Damaged
URS C
orpora
tion -
Oak
land C
A - cx
rauma
0P:\
GIS\
GIS_
Proje
ct_Fil
es\M
XD\A
nalys
is\Le
vee F
ailure
Poten
tial\P
roblem
Area
s, Fa
ilure
Area
s\Inu
ndati
on_C
ase_
1.mxd
NOT FLOODEDFLOODEDDAMAGED

FranksTract
Sevenmile Slough
DELTACROSS
CHANNEL
Island
LindseySlough
Victoria Canal
North Canal
Trapper Slough
North Victoria CanalWoodward Canal
Whiskey Slough
Empire Cut
Indian Slough
Grant Line CanalFabian and Bell Canal
Italia
n Slou
gh
SloughRock
Dutch Slough
Taylor Sl.
Piper Slough
Conn
ection
Sl.
ColumbiaCut
Mound Slough
Holland Cut
Latha
mSl.
Turner Cut
Litt le Co n n ection Sl.
DissapointmentSlough
White
SloughPotato Slough
Littl e
Pota
to Sl
.
Burns Cutoff
Fourteen- Mile Slough
Fishe
rman
sCu
t
False
River
Thre
emile
Sloug
h
Hog Slough
Beaver Slough
SACRAMENTO
YOLO
B YPA
S S
RI V ER
SACRAMENTO
Water
Ship
Chan
nel
Sacra
mento
Dee
p
LittleTinsleyIsland
RhodeIsland
LittleMandeville
Island
Litt le Franks Tract
Lower RobertsIsland
UpperRobertsIsland
Netherlands
VealeTract
Middle RobertsIsland
Union Island
GrandIsland
RyerIsland
Upper JonesTract
ByronTract
Lower JonesTract
DiscoveryBay
RIVER
JOAQUIN
Tyler
TerminousTract
Staten
Islan
dBrannan-Andrus
Island
PiersonDistrict
Sherman Island
New HopeTract
FabianTract
Brack Tract
RindgeTract
Canal Ranch
VictoriaIsland
WebbTract
StewartTract
Bacon Island
BouldinIsland
McDonaldIsland
Merritt
Island
HastingsTract
HollandTract
BishopTract
Mandeville Island
BethelIsland
EmpireTract King
Island
Jersey Island
Venice Island
Drexler Tract
PalmTract
Sh ima Tract
TwitchellIsland
Sutte
r Islan
d
HotchkissTract
SargentBarnhart
Tract
Orwood Tract
Shin KeeTract
Van SickleIsland Br
adfor
dIsl
and
Wright-
Elmwood
Tract
Woodward
Island
Glanvil le Tract
CliftonCourt
Forebay
Rio BlancoTract
ChippsIsland
BrownsIsland
Pros
pect
Islan
d
MedfordIsland
ConeyIsland
Mildr
ed Is
.
McCorm
ack
William
son T
ract
Rough andReady Island
Quimby Is.
Decker
Island
Winter Island KimballIsland
Dead HorseIsland
FayIsland
SAN
Sycamore Slough
Stockton Deep
Channel
BigBreak
Stea
mboa
t
Sloug
hGe
orgian
a
Slough
Sutte
rSlo
ugh
Elk
Slou g
h
Snodgrass Slough
Honker BayClub
Simmons-WheelerIsland
WestSacramento
LisbonDistrict
GlideDistrict
LibertyIsland
CacheHaas
PetersPocket
GrizzlyBay
MeinsLanding
Grizzly Island
McMullinRanch
RiverJunction
KassonDistrict
ParadiseJunction
PescaderoDistrictPico-Naglee
Walthall
StarkTract
SmithTract
BoggsTract
WeberTract
Schafter-Pintail
EgbertTract
RD 017
Water Ship
Bear Creek
Mokelumne R
iver Cosumnes River
North
Mokelu
mne
Sout
h
Moke
lumne
SacramentoPocket Area
Donlon Is.
LittleEgbertTract
LittleHolland
Middle
River
OldRiver
Joyc
eIsla
nd
Elk Grove
WalnutGrove
0 5 102.5 Miles Figure13-15
DRMS26815431
Case 2 Seismic Scenario3 Islands Flooded &No Others Damaged
URS C
orpora
tion -
Oak
land C
A - cx
rauma
0P:\
GIS\
GIS_
Proje
ct_Fil
es\M
XD\A
nalys
is\Le
vee F
ailure
Poten
tial\P
roblem
Area
s, Fa
ilure
Area
s\Inu
ndati
on_C
ase_
2.mxd
NOT FLOODEDFLOODEDDAMAGED
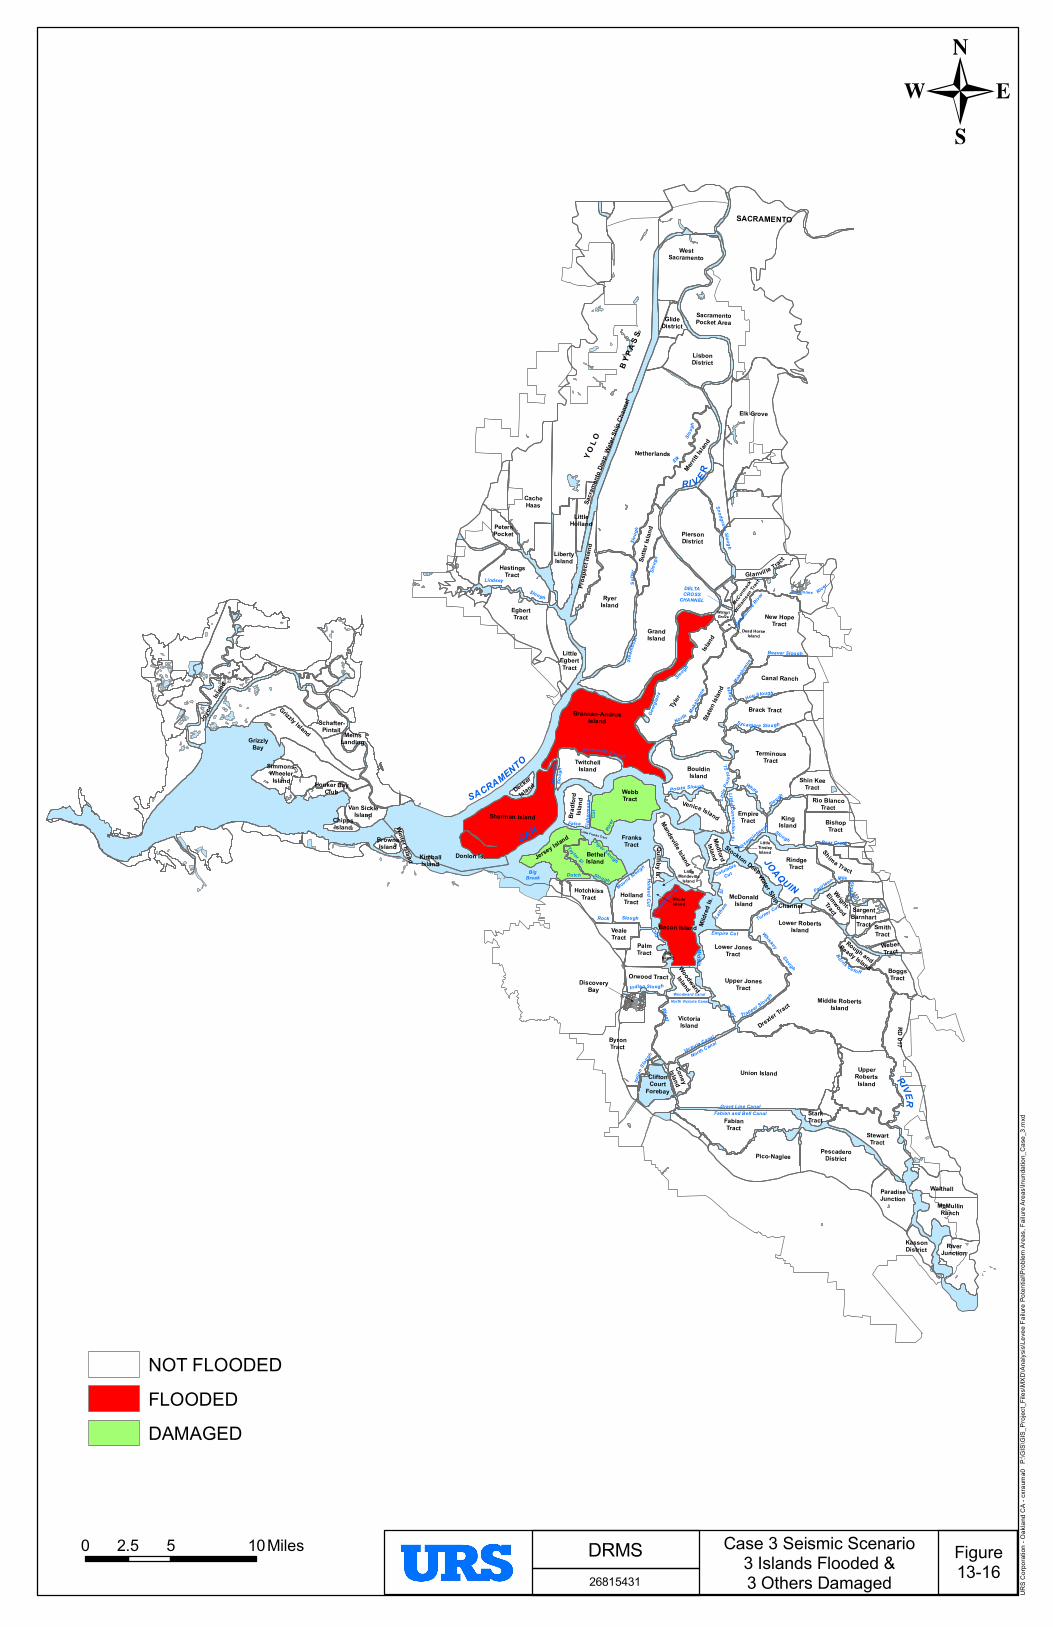
FranksTract
Sevenmile Slough
DELTACROSS
CHANNEL
Island
LindseySlough
Victoria Canal
North Canal
Trapper Slough
North Victoria CanalWoodward Canal
Whiskey Slough
Empire Cut
Indian Slough
Grant Line CanalFabian and Bell Canal
Italia
n Slou
gh
SloughRock
Dutch Slough
Taylor Sl.
Piper Slough
Conn
ection
Sl.
ColumbiaCut
Mound Slough
Holland Cut
Latha
mSl.
Turner Cut
Litt le Co n n ection Sl.
DissapointmentSlough
White
SloughPotato Slough
Littl e
Pota
to Sl
.
Burns Cutoff
Fourteen- Mile Slough
Fishe
rman
sCu
t
False
River
Thre
emile
Sloug
h
Hog Slough
Beaver Slough
SACRAMENTO
YOLO
B YPA
S S
RI V ER
SACRAMENTO
Water
Ship
Chan
nel
Sacra
mento
Dee
p
LittleTinsleyIsland
RhodeIsland
LittleMandeville
Island
Litt le Franks Tract
Lower RobertsIsland
UpperRobertsIsland
Netherlands
VealeTract
Middle RobertsIsland
Union Island
GrandIsland
RyerIsland
Upper JonesTract
ByronTract
Lower JonesTract
DiscoveryBay
RIVER
JOAQUIN
Tyler
TerminousTract
Staten
Islan
dBrannan-Andrus
Island
PiersonDistrict
Sherman Island
New HopeTract
FabianTract
Brack Tract
RindgeTract
Canal Ranch
VictoriaIsland
WebbTract
StewartTract
Bacon Island
BouldinIsland
McDonaldIsland
Merritt
Island
HastingsTract
HollandTract
BishopTract
Mandeville Island
BethelIsland
EmpireTract King
Island
Jersey Island
Venice Island
Drexler Tract
PalmTract
Sh ima Tract
TwitchellIsland
Sutte
r Islan
d
HotchkissTract
SargentBarnhart
Tract
Orwood Tract
Shin KeeTract
Van SickleIsland Br
adfor
dIsl
and
Wright-
Elmwood
Tract
Woodward
Island
Glanvil le Tract
CliftonCourt
Forebay
Rio BlancoTract
ChippsIsland
BrownsIsland
Pros
pect
Islan
d
MedfordIsland
ConeyIsland
Mildr
ed Is
.
McCorm
ack
William
son T
ract
Rough andReady Island
Quimby Is.
Decker
Island
Winter Island KimballIsland
Dead HorseIsland
FayIsland
SAN
Sycamore Slough
Stockton Deep
Channel
BigBreak
Stea
mboa
t
Sloug
hGe
orgian
a
Slough
Sutte
rSlo
ugh
Elk
Slou g
h
Snodgrass Slough
Honker BayClub
Simmons-WheelerIsland
WestSacramento
LisbonDistrict
GlideDistrict
LibertyIsland
CacheHaas
PetersPocket
GrizzlyBay
MeinsLanding
Grizzly Island
McMullinRanch
RiverJunction
KassonDistrict
ParadiseJunction
PescaderoDistrictPico-Naglee
Walthall
StarkTract
SmithTract
BoggsTract
WeberTract
Schafter-Pintail
EgbertTract
RD 017
Water Ship
Bear Creek
Mokelumne R
iver Cosumnes River
North
Mokelu
mne
Sout
h
Moke
lumne
SacramentoPocket Area
Donlon Is.
LittleEgbertTract
LittleHolland
Middle
River
OldRiver
Joyc
eIsla
nd
Elk Grove
WalnutGrove
0 5 102.5 Miles Figure13-16
DRMS26815431
Case 3 Seismic Scenario3 Islands Flooded &3 Others Damaged
URS C
orpora
tion -
Oak
land C
A - cx
rauma
0P:\
GIS\
GIS_
Proje
ct_Fil
es\M
XD\A
nalys
is\Le
vee F
ailure
Poten
tial\P
roblem
Area
s, Fa
ilure
Area
s\Inu
ndati
on_C
ase_
3.mxd
NOT FLOODEDFLOODEDDAMAGED