section 11: hy-8 · design and analyze energy dissipators. 3 section 11 hy8 example design flow for...
TRANSCRIPT

Section 11: HY-8

2
Section 11HY8 Culvert Design Software
HY8 is a Window interactive program with a DOS engine that allows the user to :
1. Design and analyze a culvert or a system of culvert
2. Consider and analyze roadway overtopping
3. Generate and route hydrographs through a culvert
4. Design and analyze energy dissipators

3
Section 11HY8 Example
Design Flow for Q25 = 100cfs Check Flow for Q100 = 250cfs
Tailwater Data-Trapezoidal Channel
Side Slopes = 1.5:1 Bottom Width = 3.5ft Channel Slope = 0.008ft/ft Channel Invert Elevation = 1342.6ft Manning’s n value = 0.035 Natural stream channel with gravel, cobbles, few boulders
S = 0.008 ft/ft
300ft
El = 1345ft
El=1360ft40ft

4
Section 11HY8 Example
1. Open up the HY8 Input Generator
2. Create a new project
Select Continue

5
Section 11HY8 Example
3. Add new culvert crossing

6
Section 11
Minimum Flow 0.0 cfsDesign Flow 100.0 cfsMaximum Flow 250.0 cfs
HY8 Example
4. Enter the following “Discharge Data” into the Crossing Data
5. Enter the following “Tailwater Data” into the Crossing Data window
Channel Type Trapezoidal ChannelBottom Width 3.5 ftSide Slope (H:V) 1.5:1Channel Slope 0.008 ft/ftManning’s n (channel) 0.035Channel Invert Elevation 1345.0 ft

7
Section 11HY8 Example
6. Click “View” button to see the Rating Curve

8
Section 11HY8 Example
7. Plot the Rating Curve, but when finished, close the plot window and choose “OK” in the Rating Curve window.

9
Section 11
HY8 Example
8. Enter the following “Roadway Data” into the Crossing Data
Roadway Profile Shape Constant Roadway Elev.First Roadway Station 0.0 ftCrest Length 100.0 ftCrest Elevation 110.0 ftRoadway Surface PavedTop Width 150.0 ft

10
Section 11
HY8 Example
9. Enter the following “Culvert Data” into the Crossing Data
Name Example 1
Shape Circular
Material Concrete
Diameter 4.0 ft
Manning’s n 0.012
Inlet Type Conventional
Inlet Edge Condition Grooved End Projection
Inlet Depression? No

11
Section 11
HY8 Example
10. Enter the following “Site Data” into the Crossing Data
Site Data Input Option Culvert Invert DataInlet Station 100.0 ftInlet Elevation 1345.0 ftOutlet Station 400.0 ftOutlet Elevation 1342.6 ftNumber of Barrels 1.0

12
Section 11HY8 Example
11. Select the Analyze Crossing button. This runs the analysis, but does not save the information.

13
Section 11HY8 Example
12. Select the Crossing Rating Curve button.

14
Section 11HY8 Example
13. A plot of the rating curve (Headwater Elevation vs. Discharge) will appear. After viewing, close plot window.

15
Section 11HY8 Example
14. Select Culvert Summary Table option in the Display box.
16
Section 11HY8 Example
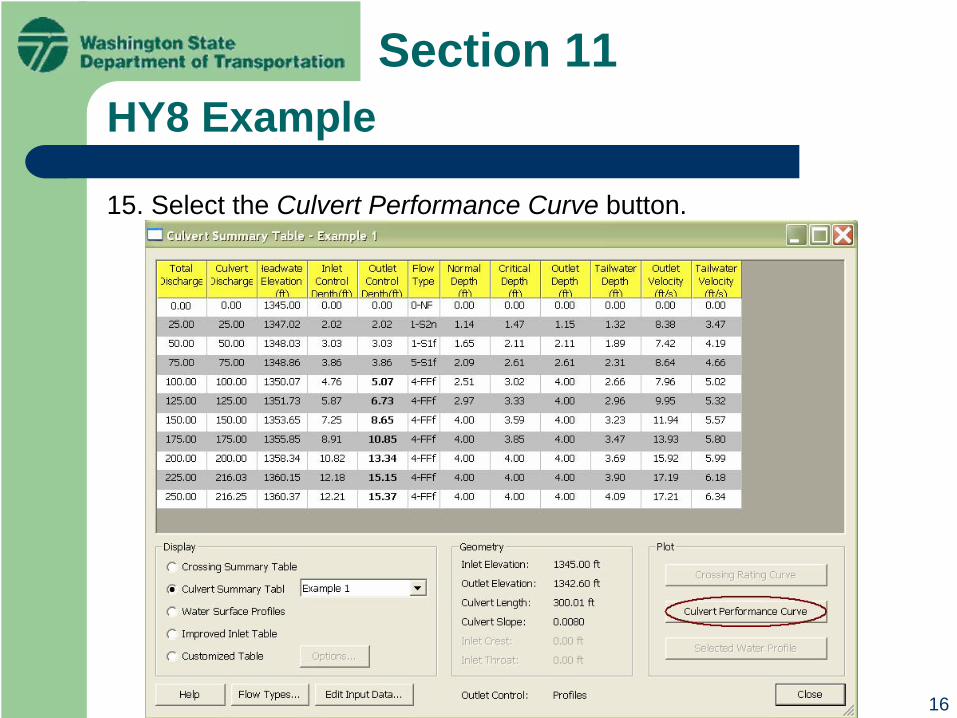
15. Select the Culvert Performance Curve button.

17
Section 11HY8 Example
16. A plot of the performace curve (Inlet/Outlet Control Headwater Elevation vs. Discharge) will appear. After viewing, close window.

18
Section 11HY8 Example
17. Select the Water Surface Profiles option in the Display box.

19
Section 11HY8 Example
18. Select the 100 cfs profile (fourth from the top) and select the Selected Water Profile button.

20
Section 11HY8 Example
19. A plot of the curve profile (for the selected discharge of 100 cfs) will appear. After viewing, close window.

21
Section 11HY8 Example
20. Select the Close button on the Analysis window.

22
Section 11HY8 Example21. Select the “Example 1” culvert in the project explorer to show the culvert profile for the design discharge in the main window.

23
Section 11HY8 Example Optional: Defining View
FV-1. Select the Front View icon. A message will appear in the Main window describing the requirement to define lateral culvert sections. Right click to do so.
24
Section 11HY8 Example
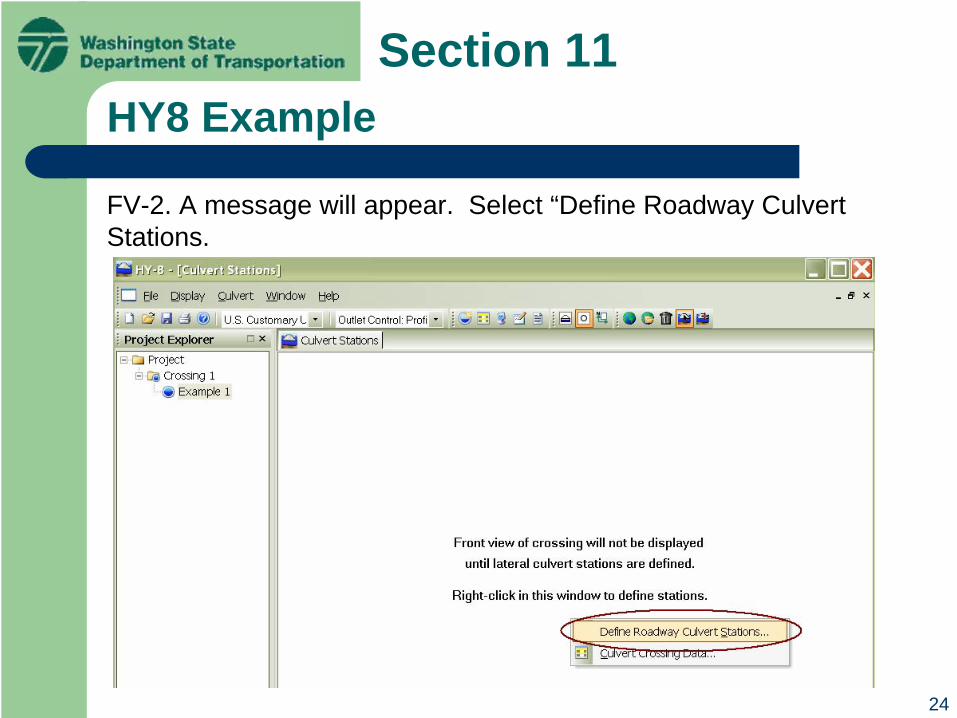
FV-2. A message will appear. Select “Define Roadway Culvert Stations.

25
Section 11HY8 Example
FV-3. The Roadway Profile window appears. Notice that the roadway station data (0.00 ft and 50.00 ft) entered in step 7 are in this window. Click on Example 1 Station field (currently the default is zero.

26
Section 11HY8 Example
FV-4. Enter the station of the centerline of the culvert system. For this example, let’s assume that this is at roadway station 25.0 ft ( or halfway between the roadway section acting as a weir.
27
Section 11HY8 Example
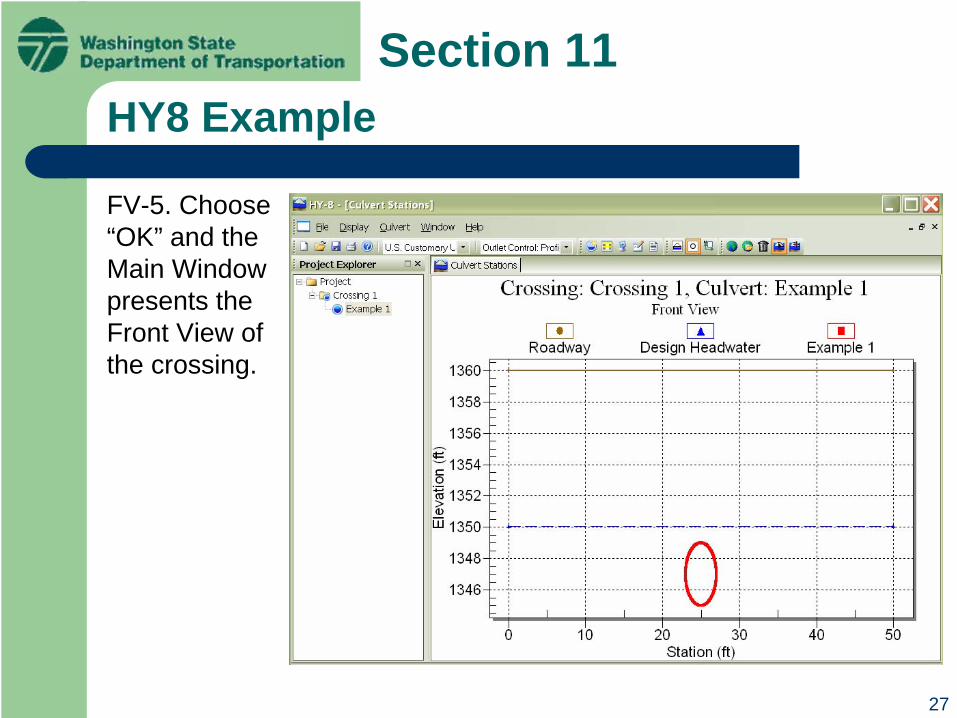
FV-5. Choose “OK” and the Main Window presents the Front View of the crossing.

28
Section 11HY8 Example
Saving the Project File22. Select the Save As option from the File menu.When prompted, call the project file TrainingClass. The program will automatically add the .HY8 extension to this file.

29
Section 11HY8 ExampleViewing Report23. Select the Create Report option from the Culvert menu.

30
Section 11HY8 Example
24. The ReportGenerator windowwill appear:

31
Section 11HY8 Example
25. Select “OK” to export the data in the Included fields window to a report file. Additional data could be exported by selecting some or all items in the Available fields window and using the right arrow (>) to copy the fields from the available fields to the included fields window.
26. After selecting “OK”, a rich text (RTF) file is exported and opened in Microsoft Word or whatever application is assigned to open RTF files (possibly Wordpad if you do not have Microsoft Word installed). The report could have been exported in PDF format by selecting PDF for the FileFormat in the Report Generator window.

32
Section 11HY8 Optional Editing HY8 Report
ED-1. If you have Microsoft Word, you should see the following view after exporting the report:

33
Section 11HY8 Optional Editing HY8 Report
ED-2. Scroll down to the following page. You should see the following table:

34
Section 11HY8 Optional Editing HY8 Report
ED-3. Click within the table so the border appears around the table.Then right-click on the border of the table and select the Format Frame option as shown below:

35
Section 11HY8 Optional Editing HY8 Report
ED-4. In the Frame window, select the Remove Frame button:

36
Section 11HY8 Optional Editing HY8 Report
ED-5. Scroll down to the next page. You should see the following graph:

37
Section 11HY8 Optional Editing HY8 Report
ED-6. Right-click on this graph and select the Format Picture option:

38
Section 11HY8 Optional Editing HY8 Report
ED-7. In the Format Picture window, select the Layout tab, select the Inline with text option, and select OK.

39
Section 11HY8 Optional Editing HY8 Report
ED-8. Continue editing all your tables and graphs as described in the steps above by locking the anchor on all the tables and setting the graphs so they are all in line with the text.
ED-9. Select the View / Normal menu item. Finish formatting your report document by removing all the unwanted page breaks and adding any additional information you wish to add to the report. After you are done editing, you can select the View / Print Layout menu item to see what the report will look like when it is printed.

40
Wrap Up of Day 2
That Ends our training course on HY8
Questions?