section 1: wind turbines section 2: crookwell aerodrome · section 1: wind turbines ... section i...
TRANSCRIPT

Section 1: Wind TurbinesSection 2: Crookwell Aerodrome
By Ralph Holland, B Sc., Dip Ed., Dip. Com. Sc., ACT Australia. Nov 2009(c) Copyright 2009
11/12/2009 version 2.1

Section I
Covers Turbine Wake
– pressure changes
– velocity deficit
– turbulence– turbulence
– and visual evidence
21/12/2009 version 2.1

Parameters and assumptions
Blade max tip Max tip tip
wind
speed at
max tip
wind
speed
at max
tip 16 *Blade
Diameter
m
Total
height m
Max
RPM
max tip
speed
kph
Max tip
speed
knots
tip
speed
ratio
max tip
speed
Knots
tip
speed
m/s
16 *
blade
diam. m
93 126.5 17 298.0 160.9 6.0 26.8 13.8 1488
120 195 17 384.5 207.6 6.0 34.6 17.8 1920
31/12/2009 version 2.1
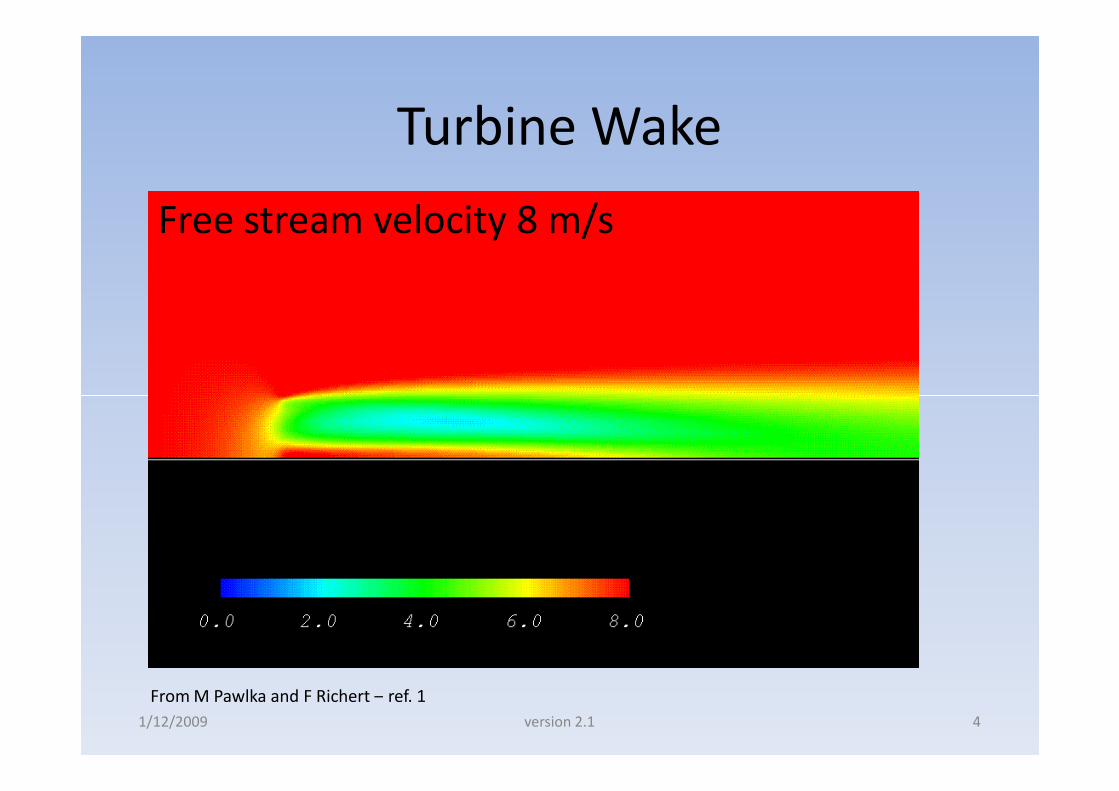
Turbine Wake
Free stream velocity 8 m/s
From M Pawlka and F Richert – ref. 1
41/12/2009 version 2.1

Pressure Differential• Severe pressure differential crossing the blade/disk
• pressure differential represents a bio hazard to air-borne mammalscrossing the disk.
• blade tip velocities of the order of 160 Kts (298 kph) for 93 m diameterturbines.turbines.
Gary L Johnson – Ref 3 51/12/2009 version 2.1

Velocity deficit• airspeed reduced to 2/3 of free flow velocity in front
• airspeed reduced to 1/3 of free flow velocity behind
• airspeed deficit 37% at 16 blade/disk diameters downstream
• how far downstream does it return to normal?
Gary L Johnson – Ref 3
61/12/2009 version 2.1

Profile of Velocity Deficit
• A plume, almost contained within the diameter
of the blades, extends downstream behind the
turbine
• velocity is 0.33 times free stream velocity at 6• velocity is 0.33 times free stream velocity at 6
blade diameters (558/600 m) downstream
• velocity is 0.55 times free stream velocity at 10
blade diameters (930/1200 m) downstream
• velocity is 0.63 times free stream velocity at 16
blade diameters (1488/1920 m) downstream
Hand M et al – Ref 4.
71/12/2009 version 2.1

How far does the deficit extend?
0.6
0.8
1
1.2
(U / Uo)
Velocity change versus axial distance from wind tunnel measurements
1/12/2009 version 2.1 8
0
0.2
0.4
0.6
0 10 20 30 40 50 60
(U / Uo)
(X / D)
measured U/U0
Linear Extrapolation
asymptotic extrapolation
• Blue line obtained from data on the Profile graph• Red and green lines are extrapolations

Hornes Rev Wind Farm Denmark
1/12/2009 version 2.1 9
Measurements made via Dromader Aircraft equipped with Synthetic Aperture Radar, Christiansen and Hasager – Ref 16

Satellite Data
ship
wind farm
plumes
1/12/2009 version 2.1 10
Hornes Rev Wind Farm data from E-SAR track L1, Christiansen and Hasager - ref 16.

ERS-2 SAR and ENVISAT ASARsatellite data
Start of farm End of farm
1/12/2009 version 2.1 11
Velocity deficit as a percentage versus distance, Christiansen and Hasager - ref 16

Tip Vorticesand Turbulence
Alfredson P-H, Dahlberg J-A. - Ref 2
121/12/2009 version 2.1

Turbulence• The wake turbulence is generated as a side-effect of the rotation and
power.
• The wake turbulence at 10 blade diameters downstream is 12% of thevelocity at that point (variation of 12% in wind speed @ 930/1200 m)
Hand M et al. – Ref 4
131/12/2009 version 2.1

Power
Assumptions:• 3.3MW generated with turbine operating at Betz limit• with blade tip speed of 6• 17 rpm with wind velocity of 13.8 m/s• blade disk diameter 93 metres
P = T 2π rpm / 60T = P * 60 / ( 2π rpm)
= 3300000 * 60 / (6.283 * 17)= 1853686.9 Kg m
F = T / d= 39,864 kg force at blade tips (approx 39.9 metric tonnes)
(Ref. 5)
141/12/2009 version 2.1
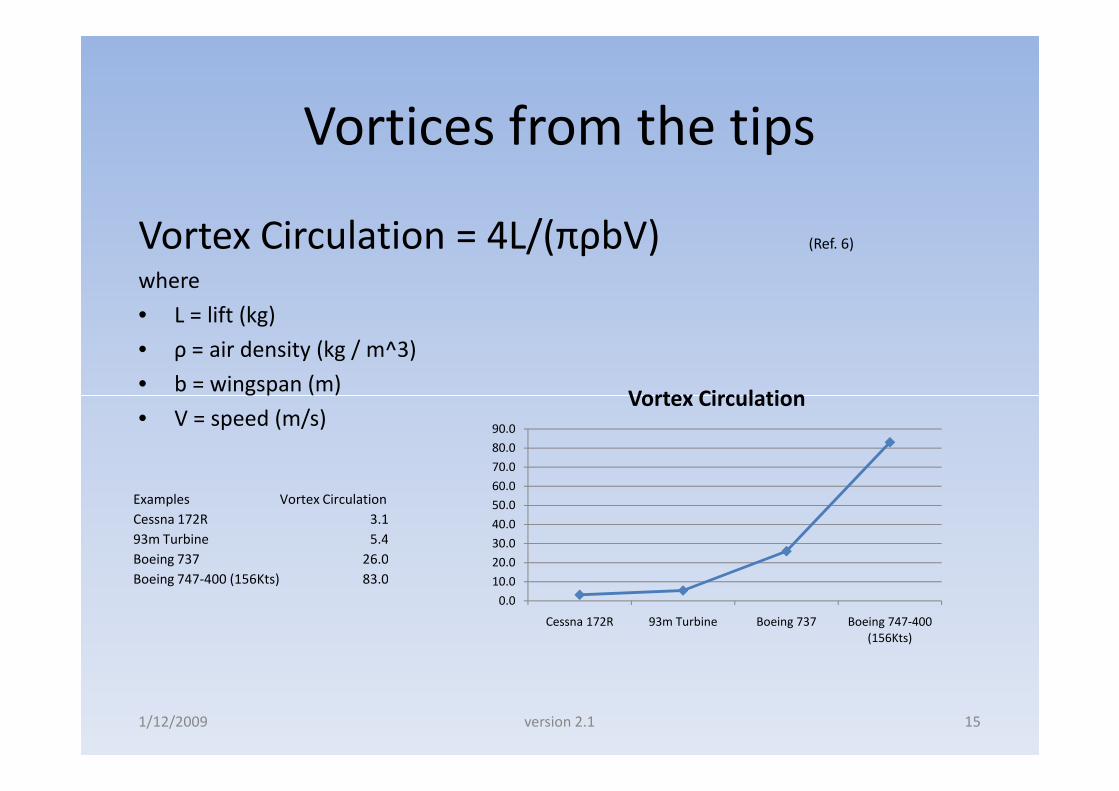
Vortices from the tips
Vortex Circulation = 4L/(πρbV) (Ref. 6)
where
• L = lift (kg)
• ρ = air density (kg / m^3)
• b = wingspan (m)Vortex Circulation
• b = wingspan (m)
• V = speed (m/s)
0.0
10.0
20.0
30.0
40.0
50.0
60.0
70.0
80.0
90.0
Cessna 172R 93m Turbine Boeing 737 Boeing 747-400(156Kts)
Vortex Circulation
15
Examples Vortex Circulation
Cessna 172R 3.1
93m Turbine 5.4
Boeing 737 26.0
Boeing 747-400 (156Kts) 83.0
1/12/2009 version 2.1

Windmills in the Mist
Please view the video at this point to see:
• the danger of the blade-tips hidden by cloud,
• the downstream void in the cloud, and
• the turbulence effects in that cloud, around
Cullerin Wind Farm situated 33.4 km SSW of Crookwell Aerodrome.
Windmills in the Mist
161/12/2009 version 2.1

Summary• By direct wind tunnel measurements the velocity deficit in the wake is 37% at
16 blade diameters (1,488 /1920) metres.
• The wake extends more than 16 blade/disk diameters downstream (1488/1920m) , and by asymptotic extrapolation the wake could extend 50 blade diameters(4,650/11,112m) or more.
• Airborne Synthetic Aperture Radar measurements of offshore wind farms showthe velocity deficit extending more than 15 km (>100D), from turbine clusterswith a total height of only 110 m.
• The velocity deficit is coupled with turbulence being 12% of the free streamvelocity at 10D 930 (1200) metres downstream, and by accounts extends furthervelocity at 10D 930 (1200) metres downstream, and by accounts extends furtherthan the velocity deficit.
• The wake interacts with terrain and airflow as it flows downstream.
• The wake represents wind-sheer, which is dangerous to passing aircraft.
• Light aircraft taking off and landing are at substantial risk.
• Ultra-light aircraft with little momentum are more at risk.
• In aviation terms, the volume behind a turbine is a no-go zone for an aircraft (ref15). 171/12/2009 version 2.1

Section II
Covers:
• Turbine locations
• Simulated vista from Crookwell Aerodrome
• Flight path after take off from R27• Flight path after take off from R27
• Standards
• Operational airspace extent and buffer zones
181/12/2009 version 2.1

Turbine locationsTurbine Name Easting Northing Lat Lon
KIA_05 722477 6178958 -34 ° 30 ' 25.27282 “ 149 ° 25 ' 24.07198 "
KIA_04 722293 6178775 -34 ° 30 ' 31.3517 " 149 ° 25 ' 17.03418 "
KIA_06 722744 6178681 -34 ° 30 ' 34.04990 " 149 ° 25 ' 34.79421 "
KIA_03 722267 6178510 -34 ° 30 ' 39.96754 " 149 ° 25 ' 16.26416 "
KIA_02 722171 6178251 -34 ° 30 ' 48.44313 " 149 ° 25 ' 12.74549 "
KIA_01 722125 6177964 -34 ° 30 ' 57.78809 " 149 ° 25 ' 11.21224 "
KIA_14 723709 6177613 -34 ° 31 ' 7.93843 " 149 ° 26 ' 13.61523 "
KIA_07 723379 6177555 -34 ° 31 ' 10.07770 '' 149 ° 26 ' 0.73806 ''
KIA_08 723227 6177336 -34 ° 31 ' 17.29988 '' 149 ° 25 ' 54.98805 ''
KIA_10 723918 6177304 -34 ° 31 ' 17.79753 '' 149 ° 26 ' 22.09777 ''KIA_10 723918 6177304 -34 ° 31 ' 17.79753 '' 149 ° 26 ' 22.09777 ''
KIA_11 723623 6177203 -34 ° 31 ' 21.30443 '' 149 ° 26 ' 10.63250 ''
KIA_09 723200 6177054 -34 ° 31 ' 26.46792 '' 149 ° 25 ' 54.19592 ''
BAN_01 722828 6177027 -34 ° 31 ' 27.63386 '' 149 ° 25 ' 39.64260 ''
KIA_12 723560 6176950 -34 ° 31 ' 29.55998 '' 149 ° 26 ' 8.40260 ''
Turbine locations supplied by Epuron (Ref. 9) as GDA zone 55 Northing and Eastings. Theposition data were sorted by Northings and converted to WGS84 Latitude and Longitude forentry into Google Earth.A 93 metre height turbine tower model was chosen from the Google Sketchup 3D Warehouseand used to place turbines at each way-point for visualisation, note the proposed Crookwellturbines will be taller.
191/12/2009 version 2.1

Vista looking southwest near aerodrome
1/12/2009 version 2.1 20

Take-off from R27, then heading south
211/12/2009 version 2.1

Instructions to Pilots
• MOS Part 139 - Cat 1 aerodrome 2.5 km arc.
• MOS Part 139 - Cat 2 aerodrome 3.0 km arc.
• AIP ENR 1.5 Cat A aircraft 3.111 km arc,
• ... Cat B aircraft 2.66 nm (4.926 km) arc.• ... Cat B aircraft 2.66 nm (4.926 km) arc.
• Old ICAO rules 3 nm (5.556 km) fromaerodrome reference point (i.e. a circle).
221/12/2009 version 2.1

CAT – B Aircraft circling area
1/12/2009 version 2.1 23

15 km Buffer Zone &CAT B aircraft circling area
72 GUR_07 -34 ° 40 ' 27.28176 '' 149 ° 29 ' 13.90608 ''73 GUR_06 -34 ° 40' 34.92435" 149 ° 28 ' 50.83822 "
1/12/2009 version 2.1 24
73 GUR_06 -34 ° 40' 34.92435" 149 ° 28 ' 50.83822 "

Summary
• Wind Turbines are dynamic obstructions that generate a plume in their wake,by measurements extends more than 16 blade diameters (1488/1920 m) downstream, and by extrapolation we can expect the plume to extend to 30 bladediameters (2790/3600m) or more downstream, airborne SAR evidence shows itextending > 15 kms downstream for offshore wind farm clusters.
• The wake plume contains turbulence energy.
• This wake and turbulence plume cannot be seen directly, and is a void to flight.• This wake and turbulence plume cannot be seen directly, and is a void to flight.
• Pilots should avoid flying behind the turbine blades, because the velocity deficitextends downstream in the plume like a tube for a few kilometres. Note there isalso an upstream velocity deficit close in front of the turbine.
• A suitable buffer zone is required around any aerodrome to permit safeoperations of aircraft.
• To ensure pilots can avoid the wake, the turbines should be set-back so it is notpossible for the wake plume to affect expected aerodrome traffic andoperational areas.
251/12/2009 Version 2.1

Safety Considerations1. The NSW Rural fire services requires the aerodrome to
support Category B Aircraft (ref-14), namely the twins:Cessna 310, Piper Cheiftain, Beechcraft Baron, and thePartenavia P86.
2. That Category-B circling requirements and areas be usedbecause they match the category of aircraft operating intobecause they match the category of aircraft operating intothe aerodrome.
3. That consideration be given to the extent of the turbinewake plumes when determining set-back of turbines toensure that the wake does not infringe on the operationalareas of any aircraft using the aerodrome and associatedoperational areas.
1/12/2009 version 2.1 26

References and Credits1. New Model for Calculating the Intensities of Turbulence in the Wake of Wind-Turbines. M Pawlka, F Richert.
2. A preliminary wind tunnel study of windmill wake dispersion in various flow conditions. Technical Note AI-1499, Part 7,FFA, Stockholm, Sweden, September 1979. Alfredson P-H, Dahlberg J-A.
3. Wind Energy Systems. Gary L Johnson.
4. Unsteady aerodynamics experiments phase VI: Wind tunnel test configuration and available data campaigns. Technicalreport BREL/TP-500-29955, NREL, December 2001. Hand M, Simms D, Finger L, Jager D, Coteril J, Schreck S, Larwood S .
5. Torque and Power equations http://en.wikipedia.org/wiki/Torque.
6. Departure Exclusion Zone: Monitoring System Concept. Carmine Primeggia FAA, Washington DC.
7. Manual of Standards Part 139 – Aerodromes, CASA www.casa.gov.au/rules/1998casr/139/139m04.pdf
8. AIP ENR 1.5 http://www.airservicesaustralia.com/publications/pending/aip/enr/1_5_1-5.pdf
9. Turbine locations supplied by Epuron www.epuron.com.au and converted from GDA84 to WGS84.
10. GDA84 to WGS84 conversions via calculator from GeoSciences website10. GDA84 to WGS84 conversions via calculator from GeoSciences websitehttp://www.ga.gov.au/geodesy/datums/redfearn_grid_to_geo.jsp.
11. Google Sketchup tool http://sketchup.google.com/ and turbine model from the Sketchup Warehouse.
12. Google Keyhole markup file containing Turbine waypoints etc supplied by Ralph Holland.
13. Google Earth and Maps (c) copyright by Google and Google providers, used under fair use for academic and forenvironmental report reasons as per the terms on www.earthgoogle.com. All the maps views in this presentation canbe reproduced entirely from the CrookwellAerodrome.kmz data file by importing into the Google Earth application.
14. Letter from Alan Lawrance, the Director of Works and Operations, Upper Lachlan Shire Council, regarding NSW FireService aircraft. Tabled Thursday 15 October 2009.
15. Email from Richard Thompson, regarding Wind Turbine affect on the flight of an Aero Commander 680E aeroplane.
16. Wake Studies around a large offshore wind farm using Satellite and Airborne SAR, Christiansen and Hasagerhttp://www.isprs.org/publications/related/ISRSE/html/papers/272.pdf
271/12/2009 version 2.1
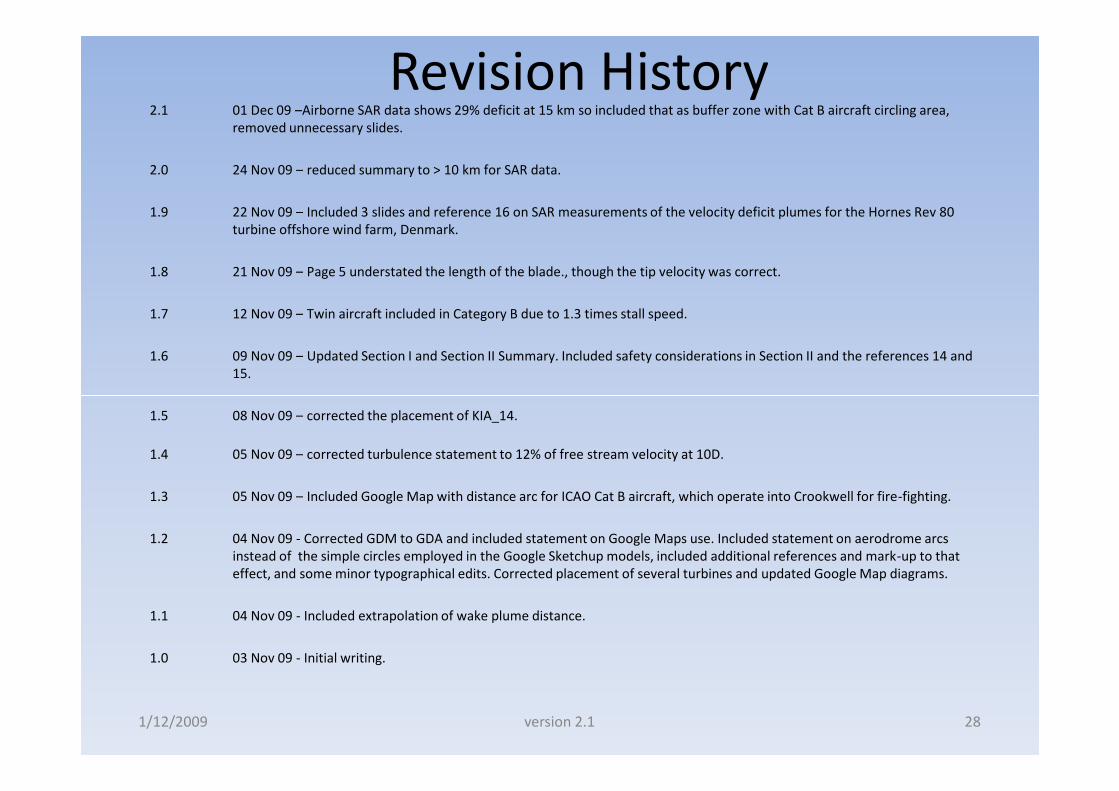
Revision History2.1 01 Dec 09 –Airborne SAR data shows 29% deficit at 15 km so included that as buffer zone with Cat B aircraft circling area,
removed unnecessary slides.
2.0 24 Nov 09 – reduced summary to > 10 km for SAR data.
1.9 22 Nov 09 – Included 3 slides and reference 16 on SAR measurements of the velocity deficit plumes for the Hornes Rev 80turbine offshore wind farm, Denmark.
1.8 21 Nov 09 – Page 5 understated the length of the blade., though the tip velocity was correct.
1.7 12 Nov 09 – Twin aircraft included in Category B due to 1.3 times stall speed.
1.6 09 Nov 09 – Updated Section I and Section II Summary. Included safety considerations in Section II and the references 14 and15.
1.5 08 Nov 09 – corrected the placement of KIA_14.
1.4 05 Nov 09 – corrected turbulence statement to 12% of free stream velocity at 10D.
1.3 05 Nov 09 – Included Google Map with distance arc for ICAO Cat B aircraft, which operate into Crookwell for fire-fighting.
1.2 04 Nov 09 - Corrected GDM to GDA and included statement on Google Maps use. Included statement on aerodrome arcsinstead of the simple circles employed in the Google Sketchup models, included additional references and mark-up to thateffect, and some minor typographical edits. Corrected placement of several turbines and updated Google Map diagrams.
1.1 04 Nov 09 - Included extrapolation of wake plume distance.
1.0 03 Nov 09 - Initial writing.
1/12/2009 version 2.1 28