section 1: the scientific method: using...
TRANSCRIPT
1
Marine Conservation Science and Policy Service learning Program
The scientific method is a process for experimentation that is used to explore observations and answer questions. Scientists use the scientific method to search for cause and effect relationships in nature. In other words, they design an experiment so that changes to one item cause something else to vary in a predictable way.
Module 5: Management, Conservation, research and Actions
Sunshine State Standards SC.912.N1.1, SC.912.N.1.3, SC.912.N.1.6, SC.912.N.1.7, SC.912.N.2.2, SC.912.N.2.4, SC.912.N.2.5, SC.912.N.3.1, SC.912.N.3.3, SC.912.N.4.1
Objectives
Understand the Scientific Method
Learn and understand the different steps of the Scientific Method
Understand the important of the Scientific Method
Create your own experiment and test your hypothesis using the Scientific Method
Section 1: The Scientific Method: using Data
2
Vocabulary
Data- refers to groups of information that represent the qualitative or quantitative attributes of a variable or set of variables. Data (plural of "datum", which is seldom used) are typically the results of measurements and can be the basis of graphs, images, or observations of a set of variables. Empirical- denotes information gained by means of observation, experience, or experiment. A central concept in science and the scientific method is that all evidence must be empirical, or empirically based, that is, dependent on evidence or consequences that are observable by the senses. Evidence- in its broadest sense includes everything that is used to determine or demonstrate the truth of an assertion.
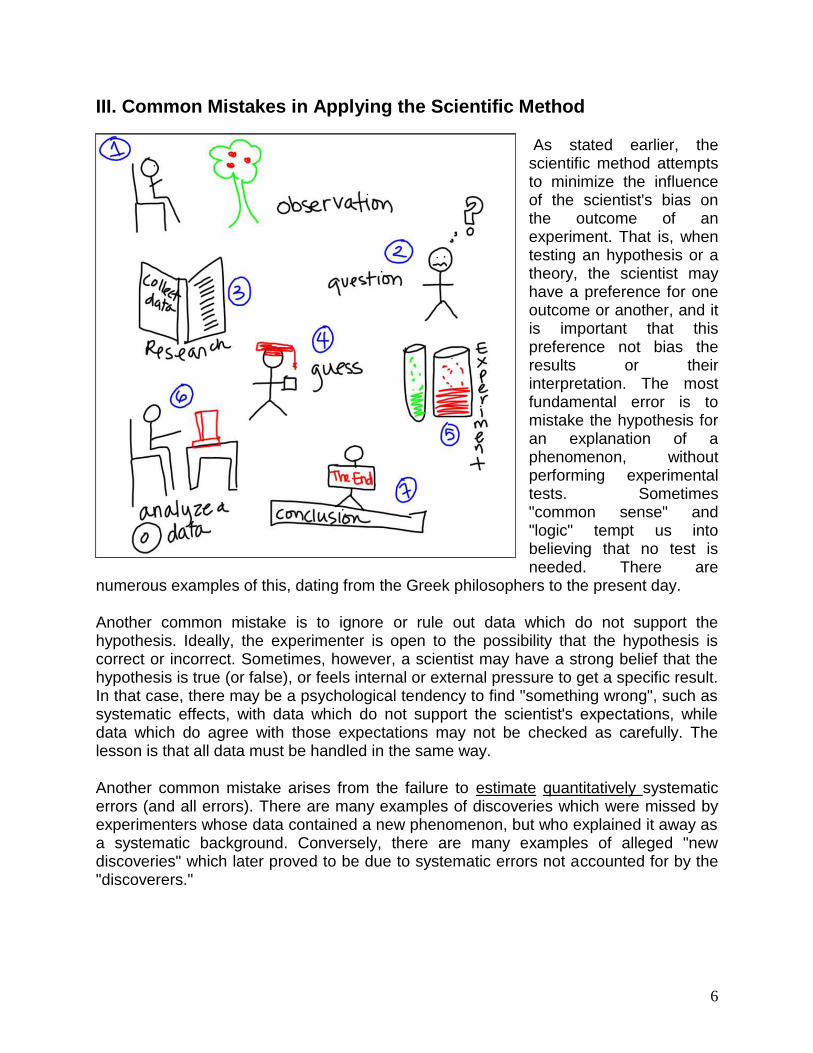
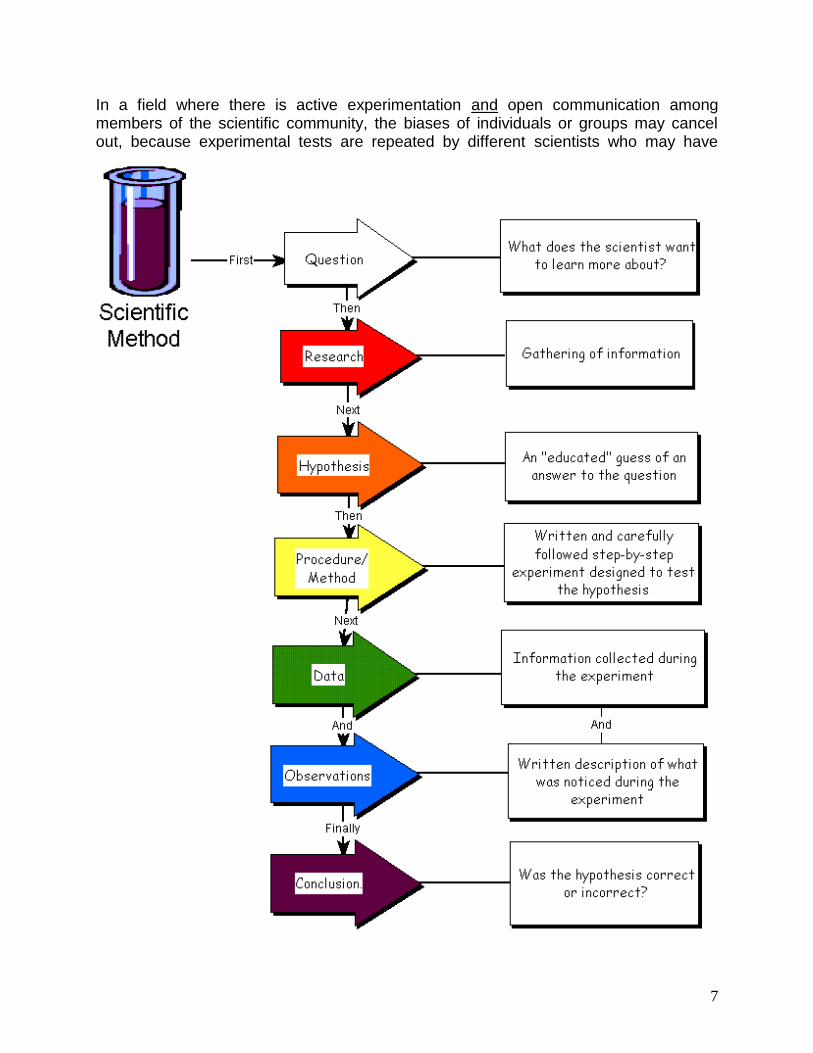
Experiment- is the step in the scientific method that arbitrates between competing models or hypotheses. Experimentation is also used to test existing theories or new hypotheses in order to support them or disprove them. An experiment or test can be carried out using the scientific method to answer a question or investigate a problem. First an observation is made. Then a question is asked, or a problem arises. Next, a hypothesis is formed. Then experiment is used to test that hypothesis. The results are analyzed, a conclusion is drawn, sometimes a theory is formed, and results are communicated through research papers.
Hypothesis- is a proposed explanation for an observable phenomenon. Inquiry- is any process that has the aim of augmenting knowledge, resolving doubt, or solving a problem.
Observation- is either an activity of a living being (such as a human), consisting of receiving knowledge of the outside world through the senses, or the recording of data using scientific instruments. The term may also refer to any data collected during this activity.
Phenomenon- plural phenomena or phenomenons, is any observable occurrence. A scientific technique is any systematic method to obtain information of a scientific nature or to obtain a desired material or product.
3
Background
Introduction to the Scientific Method
The scientific method is the process by which scientists, collectively and over time, endeavor to construct an accurate (that is, reliable, consistent and non-arbitrary) representation of the world. Recognizing that personal and cultural beliefs influence both our perceptions and our interpretations of natural phenomena, we aim through the use of standard procedures and criteria to minimize those influences when developing a theory. As a famous scientist once said, "Smart people (like smart lawyers) can come up with very good explanations for mistaken points of view." In summary, the scientific method attempts to minimize the influence of bias or prejudice in the experimenter when testing an hypothesis or a theory.
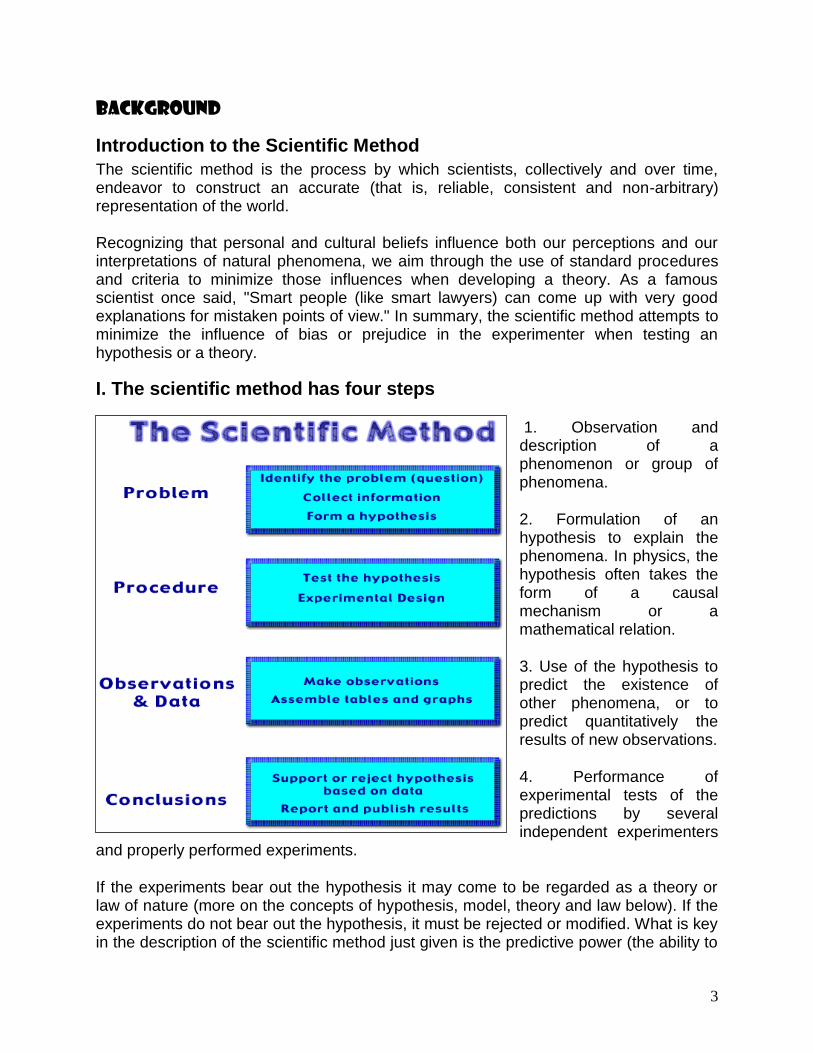
I. The scientific method has four steps
1. Observation and description of a phenomenon or group of phenomena.
2. Formulation of an hypothesis to explain the phenomena. In physics, the hypothesis often takes the form of a causal mechanism or a mathematical relation.
3. Use of the hypothesis to predict the existence of other phenomena, or to predict quantitatively the results of new observations.
4. Performance of experimental tests of the predictions by several independent experimenters
and properly performed experiments.
If the experiments bear out the hypothesis it may come to be regarded as a theory or law of nature (more on the concepts of hypothesis, model, theory and law below). If the experiments do not bear out the hypothesis, it must be rejected or modified. What is key in the description of the scientific method just given is the predictive power (the ability to
4
get more out of the theory than you put in; see Barrow, 1991) of the hypothesis or theory, as tested by experiment. It is often said in science that theories can never be proved, only disproved. There is always the possibility that a new observation or a new experiment will conflict with a long-standing theory.
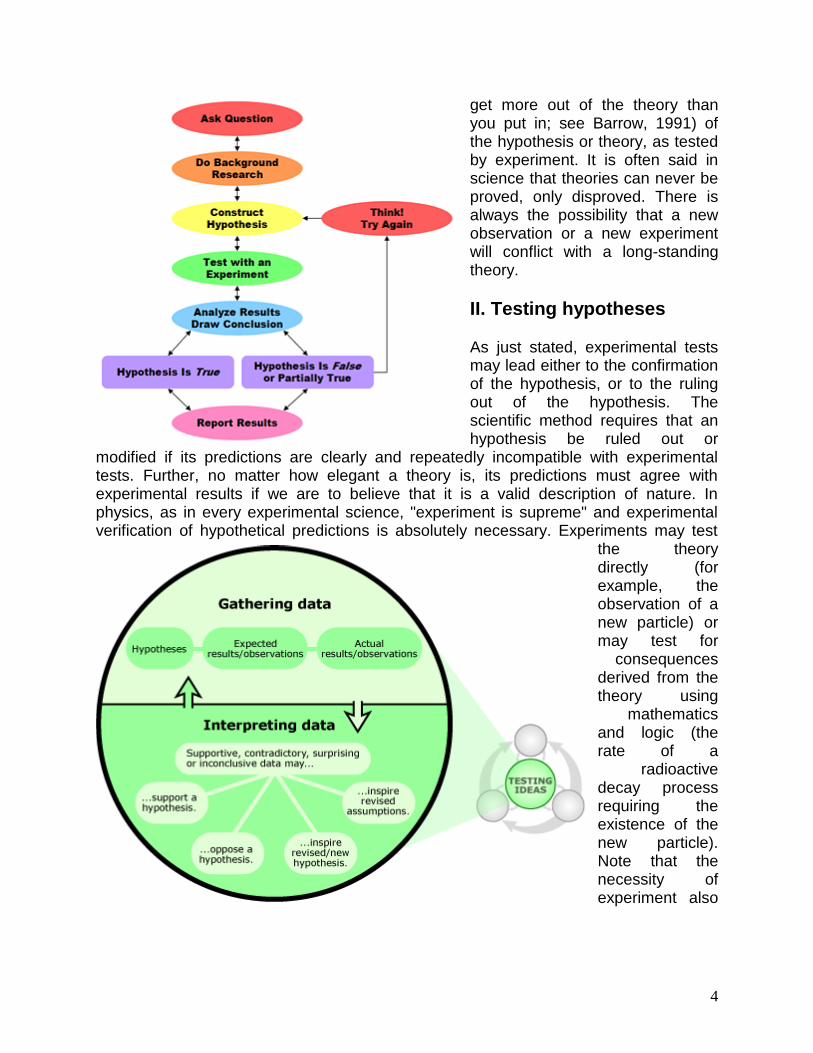
II. Testing hypotheses
As just stated, experimental tests may lead either to the confirmation of the hypothesis, or to the ruling out of the hypothesis. The scientific method requires that an hypothesis be ruled out or
modified if its predictions are clearly and repeatedly incompatible with experimental tests. Further, no matter how elegant a theory is, its predictions must agree with experimental results if we are to believe that it is a valid description of nature. In physics, as in every experimental science, "experiment is supreme" and experimental verification of hypothetical predictions is absolutely necessary. Experiments may test
the theory directly (for example, the observation of a new particle) or may test for
consequences derived from the theory using
mathematics and logic (the rate of a
radioactive decay process requiring the existence of the new particle). Note that the necessity of experiment also

5
implies that a theory must be testable. Theories which cannot be tested, because, for instance, they have no observable ramifications (such as, a particle whose characteristics make it unobservable), do not qualify as scientific theories.
If the predictions of a long-standing theory are found to be in disagreement with new experimental results, the theory may be discarded as a description of reality, but it may continue to be applicable within a limited range of measurable parameters. For example, the laws of classical mechanics (Newton's Laws) are valid only when the velocities of interest are much smaller than the speed of light (that is, in algebraic form, when v/c << 1). Since this is the domain of a large portion of human experience, the laws of classical mechanics are widely, usefully and correctly applied in a large range of technological and scientific problems. Yet in nature we observe a domain in which v/c is not small. The motions of objects in this domain, as well as motion in the "classical" domain, are accurately described through the equations of Einstein's theory of relativity. We believe, due to experimental tests, that relativistic theory provides a more general, and therefore more accurate, description of the principles governing our universe, than the earlier "classical" theory. Further, we find that the relativistic equations reduce to the classical equations in the limit v/c << 1. Similarly, classical physics is valid only at distances much larger than atomic scales (x >> 10-8 m). A description which is valid at all length scales is given by the equations of quantum mechanics.
We are all familiar with theories which had to be discarded in the face of experimental evidence. In the field of astronomy, the earth-centered description of the planetary orbits was overthrown by the Copernican system, in which the sun was placed at the center of a series of concentric, circular planetary orbits. Later, this theory was modified, as measurements of the planets motions were found to be compatible with elliptical, not circular, orbits, and still later planetary motion was found to be derivable from Newton's laws.
Error in experiments have several sources. First, there is error intrinsic to instruments of measurement. Because this type of error has equal probability of producing a measurement higher or lower numerically than the "true" value, it is called random error. Second, there is non-random or systematic error, due to factors which bias the result in one direction. No measurement, and therefore no experiment, can be perfectly precise. At the same time, in science we have standard ways of estimating and in some cases reducing errors. Thus it is important to determine the accuracy of a particular measurement and, when stating quantitative results, to quote the measurement error. A measurement without a quoted error is meaningless. The comparison between experiment and theory is made within the context of experimental errors. Scientists ask, how many standard deviations are the results from the theoretical prediction? Have all sources of systematic and random errors been properly estimated?
6
III. Common Mistakes in Applying the Scientific Method
As stated earlier, the scientific method attempts to minimize the influence of the scientist's bias on the outcome of an experiment. That is, when testing an hypothesis or a theory, the scientist may have a preference for one outcome or another, and it is important that this preference not bias the results or their interpretation. The most fundamental error is to mistake the hypothesis for an explanation of a phenomenon, without performing experimental tests. Sometimes "common sense" and "logic" tempt us into believing that no test is needed. There are
numerous examples of this, dating from the Greek philosophers to the present day.
Another common mistake is to ignore or rule out data which do not support the hypothesis. Ideally, the experimenter is open to the possibility that the hypothesis is correct or incorrect. Sometimes, however, a scientist may have a strong belief that the hypothesis is true (or false), or feels internal or external pressure to get a specific result. In that case, there may be a psychological tendency to find "something wrong", such as systematic effects, with data which do not support the scientist's expectations, while data which do agree with those expectations may not be checked as carefully. The lesson is that all data must be handled in the same way.
Another common mistake arises from the failure to estimate quantitatively systematic errors (and all errors). There are many examples of discoveries which were missed by experimenters whose data contained a new phenomenon, but who explained it away as a systematic background. Conversely, there are many examples of alleged "new discoveries" which later proved to be due to systematic errors not accounted for by the "discoverers."
7
In a field where there is active experimentation and open communication among members of the scientific community, the biases of individuals or groups may cancel out, because experimental tests are repeated by different scientists who may have
8
different biases. In addition, different types of experimental setups have different sources of systematic errors. Over a period spanning a variety of experimental tests (usually at least several years), a consensus develops in the community as to which experimental results have stood the test of time.
IV. Hypotheses, Models, Theories and Laws
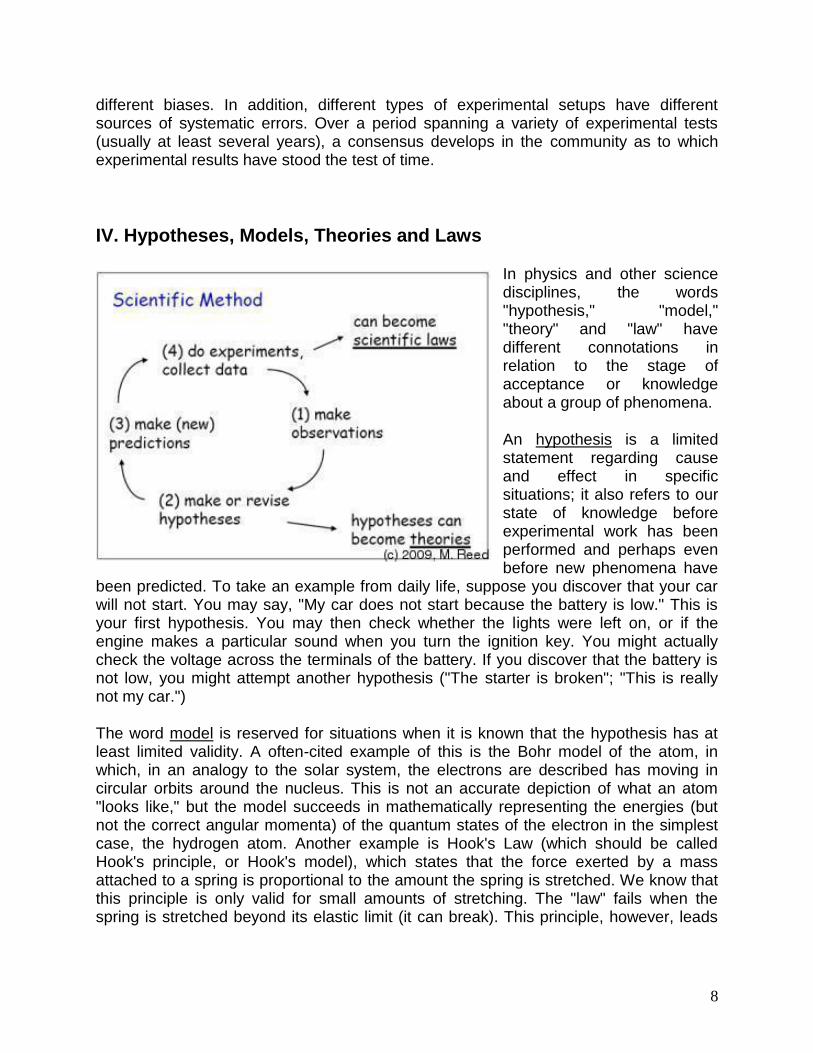
In physics and other science disciplines, the words "hypothesis," "model," "theory" and "law" have different connotations in relation to the stage of acceptance or knowledge about a group of phenomena.
An hypothesis is a limited statement regarding cause and effect in specific situations; it also refers to our state of knowledge before experimental work has been performed and perhaps even before new phenomena have
been predicted. To take an example from daily life, suppose you discover that your car will not start. You may say, "My car does not start because the battery is low." This is your first hypothesis. You may then check whether the lights were left on, or if the engine makes a particular sound when you turn the ignition key. You might actually check the voltage across the terminals of the battery. If you discover that the battery is not low, you might attempt another hypothesis ("The starter is broken"; "This is really not my car.")
The word model is reserved for situations when it is known that the hypothesis has at least limited validity. A often-cited example of this is the Bohr model of the atom, in which, in an analogy to the solar system, the electrons are described has moving in circular orbits around the nucleus. This is not an accurate depiction of what an atom "looks like," but the model succeeds in mathematically representing the energies (but not the correct angular momenta) of the quantum states of the electron in the simplest case, the hydrogen atom. Another example is Hook's Law (which should be called Hook's principle, or Hook's model), which states that the force exerted by a mass attached to a spring is proportional to the amount the spring is stretched. We know that this principle is only valid for small amounts of stretching. The "law" fails when the spring is stretched beyond its elastic limit (it can break). This principle, however, leads
9
to the prediction of simple harmonic motion, and, as a model of the behavior of a spring, has been versatile in an extremely broad range of applications.
A scientific theory or law represents an hypothesis, or a group of related hypotheses, which has been confirmed through repeated experimental tests. Theories in physics are often formulated in terms of a few concepts and equations, which are identified with "laws of nature," suggesting their universal applicability. Accepted scientific theories and laws become part of our understanding of the universe and the basis for exploring less well-understood areas of knowledge. Theories are not easily discarded; new discoveries are first assumed to fit into the existing theoretical framework. It is only when, after repeated experimental tests, the new phenomenon cannot be accommodated that scientists seriously question the theory and attempt to modify it. The validity that we attach to scientific theories as representing realities of the physical world is to be contrasted with the facile invalidation implied by the expression, "It's only a theory." For example, it is unlikely that a person will step off a tall building on the assumption that they will not fall, because "Gravity is only a theory."
Changes in scientific thought and theories occur, of course, sometimes revolutionizing our view of the world (Kuhn, 1962). Again, the key force for change is the scientific method, and its emphasis on experiment.
V. Are there circumstances in which the Scientific Method is not applicable?
While the scientific method is necessary in developing scientific knowledge, it is also useful in everyday problem-solving. What do you do when your telephone doesn't work? Is the problem in the hand set, the cabling inside your house, the hookup outside, or in the workings of the phone company? The process you might go through to solve this problem could involve scientific thinking, and the results might contradict your initial expectations.
Like any good scientist, you may question the range of situations (outside of science) in which the scientific method may be applied. From what has been stated above, we determine that the scientific method works best in situations where one can isolate the phenomenon of interest, by eliminating or accounting for extraneous factors, and where one can repeatedly test the system under study after making limited, controlled changes in it.
There are, of course, circumstances when one cannot isolate the phenomena or when one cannot repeat the measurement over and over again. In such cases the results may depend in part on the history of a situation. This often occurs in social interactions between people. For example, when a lawyer makes arguments in front of a jury in court, she or he cannot try other approaches by repeating the trial over and over again in front of the same jury. In a new trial, the jury composition will be different. Even the same jury hearing a new set of arguments cannot be expected to forget what they heard before.
10
VI. Conclusion
The scientific method is intricately associated with science, the process of human inquiry that pervades the modern era on many levels. While the method appears simple and logical in description, there is perhaps no more complex question than that of knowing how we come to know things. In this introduction, we have emphasized that the scientific method distinguishes science from other forms of explanation because of its requirement of systematic experimentation. We have also tried to point out some of the criteria and practices developed by scientists to reduce the influence of individual or social bias on scientific findings. Further investigations of the scientific method and other aspects of scientific practice may be found in the references listed below.
11
Activity: Using Scientific Method: Using data for Management, Research and Actions
Duration: 2 hours
Objectives
Understand and use the scientific method to solve issues in the environment.
Materials
Computer access
Paper
Pencil
Procedure Anyone who has ever read a mystery novel or seen a “whodunit” on TV, has seen the scientific method in action. Anyone who has ever tried to figure out what happens to the refrigerator light when you close the door, or where that other sock goes after you put it in the drier, has used the scientific method. The scientific method is not a mystical, incomprehensible rite that only “polyester plaid” science nerds use to solve esoteric problems. Instead, it is a logical, organized mechanism for identifying and researching a problem, and devising a strategy for solving it. The scientific method is split up into five major steps: 1. Determining the problem or question. - In this step, you (the researcher) must decide what it is that you will be studying. This sounds like a simple procedure, but it is actually very important. It identifies exactly what you wish to learn and it allows you to focus only on that material. 2. Development of a hypothesis. - The hypothesis is not a just a random W.A.G (Wild @$$#& Guess) to your problem. Instead, the hypothesis is an Educated Guess. In other words, it involves researching the problem and finding out what other people have learned, and using that information to help devise an answer. An important aspect of the hypothesis is that it should answer the original question, and it should be testable! 3. Design an experiment to test the hypothesis. - Design an experiment whose results will either support or disprove your hypothesis. If your hypothesis is supported, then the results of your experiment will indicate that your hypothesis is correct. However, this does not mean that your hypothesis is 100%, beyond a shadow of a doubt, correct. There may be other factors that will influence the results that you haven’t
12
tested. Therefore, it is important to say that the hypothesis is supported, you should never say that it is proven! However, the results of your experiment can prove your hypothesis wrong! - There should be at least two groups in your experiment. The first group is the experimental group. This group is the group that has the factor that is being tested (Experimental Variable). It is easy to identify the experimental variable, since it is usually stated in the hypothesis. The second group is the control group. The control group is identical to the experimental group in every way, except that they lack the experimental variable. (If there were other differences, then they would invalidate the results of the experiment.) 4. Conduct the experiment and collect the data. - Run the experiment that you have so carefully constructed. In this step, you will be measuring the dependent variable. This variable (DO NOT confuse it with the experimental variable) is the thing that is being observed or measured. Any pieces of information that you collect regarding the dependent variable are called DATA. 5. Draw Conclusions from your data. - Here, it is stated directly whether the hypothesis was supported or disproven. - If your hypothesis is supported, it should be repeated, since one of the basic foundations of the scientific method is that it is repeatable. The more an experiment is repeated, the more valid the results are. However, if there is a hypothesis that is supported by many experiments and a lot of data, we call that hypothesis a theory. - The word theory is often misused in everyday language. Theory and hypothesis are not synonyms, a hypothesis is just an educated guess that perhaps has been supported once or twice by an experiment. A theory was once a hypothesis, but is now supported by a lot of data and is accepted as being correct, until new information is discovered to disprove it. 1. List the parts of the scientific method in order. ____________________________________________________________________________________________________________________________________________________________________________________________________________________________________________________________________________________________________________________________________________________________________________________________________________________________________________________________________________________________________ 2. What are dependent and experimental variables? ________________________________________________________________________________________________________________________________________________________________________________________________________________________________________________________________________________________________________________________________________________________
13
3. Suppose you are a researcher who is studying Pacific White-sided Dolphins (Lagenorhyncus obliquidens). While studying a captive group of dolphins at an aquarium, you notice a strange tendency for the dolphins to stay close to the surface shortly after being fed. You are intrigued, and after looking for more information, you learn that some species of dolphins will sometimes stay close to the surface when they have gas. Dolphins may normally feed on many species of fish in the wild, but you notice that the dolphins tend to stay close to the surface after being fed fish belonging to species “A”. Thus, you hypothesize that fish belonging to species “A”, gave the dolphins gas. Design an experiment to test this hypothesis. a. What is the hypothesis (Hint, it is already given)? ____________________________________________________________________________________________________________________________________________________________________________________________________________ b. Design an experiment to test this hypothesis, and use another sheet of paper if necessary. (Be sure you can explain how you are going to conduct the test, and predict what the results will be if they support the experiment.) You are not to create the data for your results section. __________________________________________________________________________________________________________________________________________________________________________________________________________________________________________________________________________________________________________________________________________________________________________________________________________________________________________________________________________________________________________________________________________________________________________________________________________________________________________________________________________________________________________________________________________________________________________________________________________________________________________________________________________________________________________________________________________________________________________________________________________________________________________________________________________________________ 4. You are conducting an experiment to determine if increased ultraviolet radiation from the decrease in the ozone layer is killing off frog tadpoles. After examining all of the data available in the library, you decide to go with a hypothesis that increased ultraviolet radiation from the sun is killing off the tadpoles. You design an experiment with a control and an experimental group. Your control group (group 1) involves 100 tadpoles in a five gallon container of water, that is covered by
14
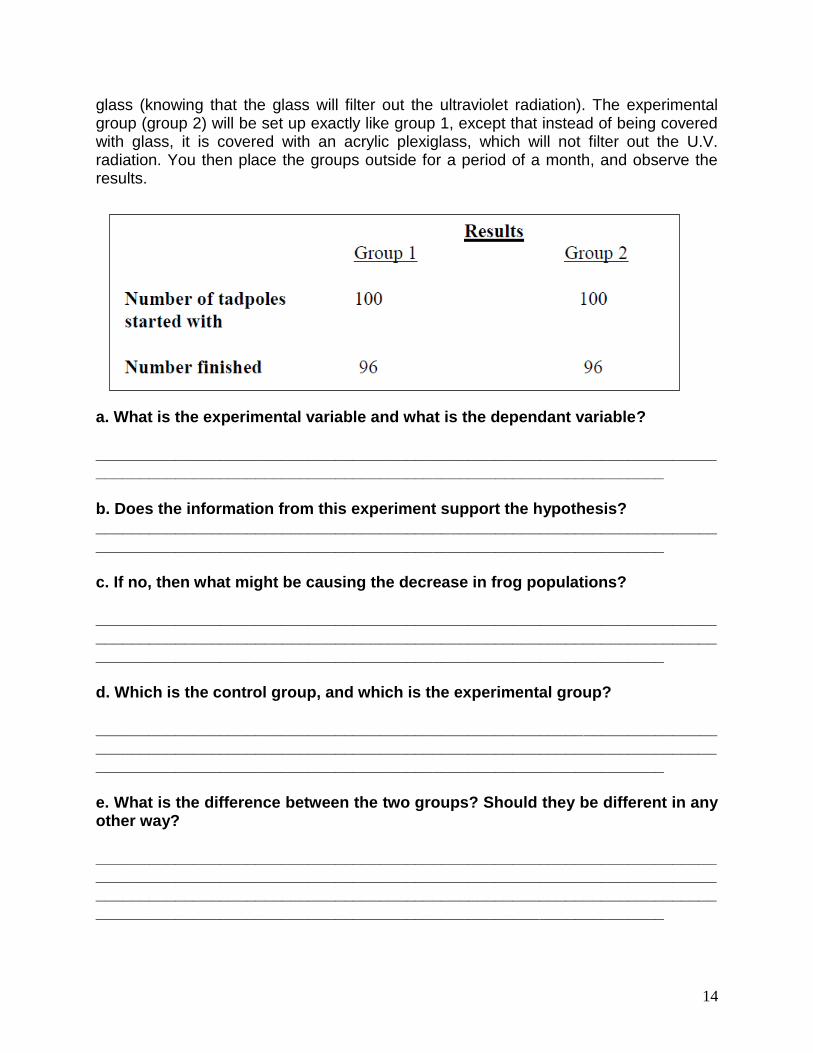
glass (knowing that the glass will filter out the ultraviolet radiation). The experimental group (group 2) will be set up exactly like group 1, except that instead of being covered with glass, it is covered with an acrylic plexiglass, which will not filter out the U.V. radiation. You then place the groups outside for a period of a month, and observe the results.
a. What is the experimental variable and what is the dependant variable? ______________________________________________________________________________________________________________________________________ b. Does the information from this experiment support the hypothesis? ______________________________________________________________________________________________________________________________________ c. If no, then what might be causing the decrease in frog populations? ____________________________________________________________________________________________________________________________________________________________________________________________________________ d. Which is the control group, and which is the experimental group? ____________________________________________________________________________________________________________________________________________________________________________________________________________ e. What is the difference between the two groups? Should they be different in any other way? __________________________________________________________________________________________________________________________________________________________________________________________________________________________________________________________________________________
15
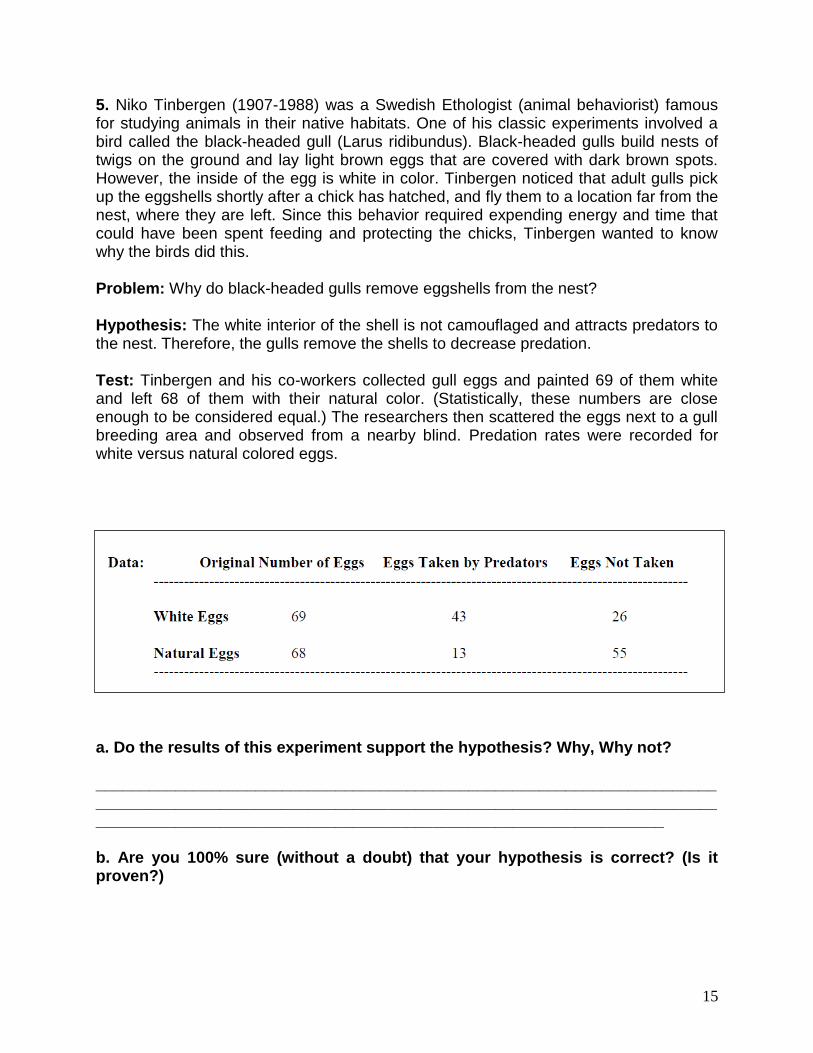
5. Niko Tinbergen (1907-1988) was a Swedish Ethologist (animal behaviorist) famous for studying animals in their native habitats. One of his classic experiments involved a bird called the black-headed gull (Larus ridibundus). Black-headed gulls build nests of twigs on the ground and lay light brown eggs that are covered with dark brown spots. However, the inside of the egg is white in color. Tinbergen noticed that adult gulls pick up the eggshells shortly after a chick has hatched, and fly them to a location far from the nest, where they are left. Since this behavior required expending energy and time that could have been spent feeding and protecting the chicks, Tinbergen wanted to know why the birds did this. Problem: Why do black-headed gulls remove eggshells from the nest? Hypothesis: The white interior of the shell is not camouflaged and attracts predators to the nest. Therefore, the gulls remove the shells to decrease predation. Test: Tinbergen and his co-workers collected gull eggs and painted 69 of them white and left 68 of them with their natural color. (Statistically, these numbers are close enough to be considered equal.) The researchers then scattered the eggs next to a gull breeding area and observed from a nearby blind. Predation rates were recorded for white versus natural colored eggs.
a. Do the results of this experiment support the hypothesis? Why, Why not? ____________________________________________________________________________________________________________________________________________________________________________________________________________ b. Are you 100% sure (without a doubt) that your hypothesis is correct? (Is it proven?)
16
____________________________________________________________________________________________________________________________________________________________________________________________________________ c. If you were working with Tinbergen, what would you suggest be done next? ____________________________________________________________________________________________________________________________________________________________________________________________________________ d. Identify the experimental and dependent variables ________________________________________________________________________________________________________________________________________________________________________________________________________________________________________________________________________________________________________________________________________________________ 6. The media has given a lot of attention recently to shark attacks on humans, due in part to several high profile incidents. Are the numbers of shark attacks becoming more frequent, or are we just hearing about them more often than before because of the previous cases in the news? The following chart was made using data from the ISAF (International Shark Attack File) a group that tracks shark attacks world-wide.
17
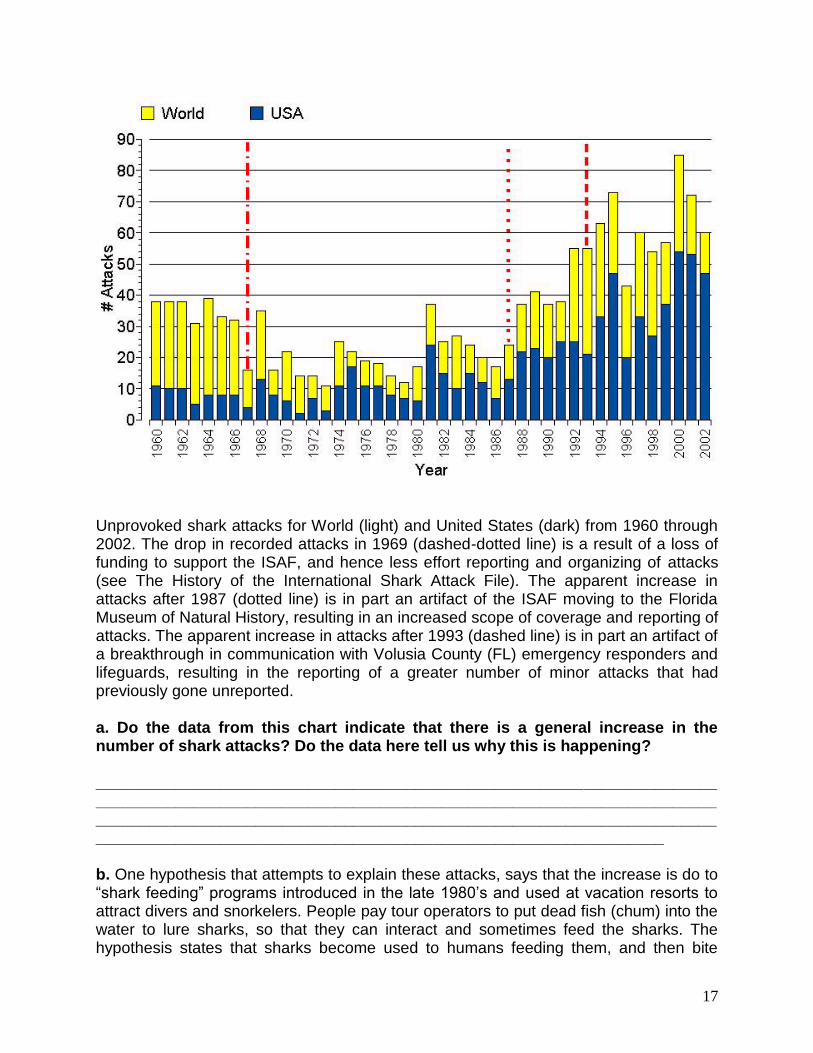
Unprovoked shark attacks for World (light) and United States (dark) from 1960 through 2002. The drop in recorded attacks in 1969 (dashed-dotted line) is a result of a loss of funding to support the ISAF, and hence less effort reporting and organizing of attacks (see The History of the International Shark Attack File). The apparent increase in attacks after 1987 (dotted line) is in part an artifact of the ISAF moving to the Florida Museum of Natural History, resulting in an increased scope of coverage and reporting of attacks. The apparent increase in attacks after 1993 (dashed line) is in part an artifact of a breakthrough in communication with Volusia County (FL) emergency responders and lifeguards, resulting in the reporting of a greater number of minor attacks that had previously gone unreported. a. Do the data from this chart indicate that there is a general increase in the number of shark attacks? Do the data here tell us why this is happening? __________________________________________________________________________________________________________________________________________________________________________________________________________________________________________________________________________________ b. One hypothesis that attempts to explain these attacks, says that the increase is do to “shark feeding” programs introduced in the late 1980’s and used at vacation resorts to attract divers and snorkelers. People pay tour operators to put dead fish (chum) into the water to lure sharks, so that they can interact and sometimes feed the sharks. The hypothesis states that sharks become used to humans feeding them, and then bite
18
other humans when they don’t get fed. Design an experiment to test this hypothesis on the next page. Be sure to identify the variables and the groups. Question: Why is there an overall increase in the number of shark attacks? Hypothesis: Shark feeding programs are causing an increase in shark attacks. __________________________________________________________________________________________________________________________________________________________________________________________________________________________________________________________________________________ C. From the chart, it is obvious to see that there is an overall increase in the number of shark attacks, even though some years (such as 1996) have fewer than others. However, is it possible that some other factor may be influencing the results? One thing the chart doesn’t say is that many shark attacks occur in areas where there aren’t a lot of people, such as in Western Australia. With the introduction of the internet and cellular communication in the 1990’s, would you expect the ability of biologists to REPORT shark attacks to increase? ________________________________________________________________________________________________________________________________________________________________________________________________________________________________________________________________________________________________________________________________________________________ D. One problem with data like this is that it doesn’t always indicate other factors that might influence the results. This is why it is so necessary to repeat and continue to test hypotheses. The ISAF states on their web site that while this data is accurate, it doesn’t take into account the fact that human populations are increasing world-wide. With this increase in population, there are more people around, therefore there will be less habitat for the sharks to hunt for food (since humans are now living and playing on beaches not inhabited before). Could this increase in contact between humans and sharks result in more attacks? ________________________________________________________________________________________________________________________________________________________________________________________________________________________________________________________________________________________________________________________________________________________ E. Does the chart now say the same thing to you that it did before? It is very important when looking at a study to be objective. You may be surprised to learn that not everything that you see on the internet or in the media is as it seems on the surface. In this class, we will learn to look objectively and think critically about information.
19
Introduction to Evolution Scientific Method Worksheet Name ________________________________________________________________ Date _________________________________________________________________ Write in the word or short phrase needed to answer the question or complete the statement in the space provided. Give the general name for the factor that is tested in an experiment. ______________________________________________________________________ Give the general name for the factor that is observed, measured or counted in an experiment. ______________________________________________________________________ Which group contains the variable that is being tested? ______________________________________________________________________ Which group is identical the group above in every way EXCEPT for lacking the variable that is being tested? ______________________________________________________________________ If a hypothesis is tested a number of times and supported each time, the best term to describe the “correctness” of that hypothesis is:
If a hypothesis is tested and found to be incorrect, then we say that the hypothesis has been: ______________________________________________________________________ In question number 4 dealing with the tadpoles, which group (give the number) was the control group? ______________________________________________________________________
20
In question number 4 dealing with the tadpoles, what was the experimental variable?
In question number 5 dealing with the Black-headed gull, did the experiment support the hypothesis? (yes or no) _____________________________________________________________________ According to the graph, it appears that the number of shark attacks are increasing world-wide. However, other factors not necessarily related to the shark attacks themselves may sometimes be responsible for altering data. Name one of the two factors that may have caused an increase in the number of shark attacks reported on the graph without necessarily indicating an increase in the number of actual shark attacks. ____________________________________________________________________________________________________________________________________________________________________________________________________________

21
Resources http://www.biology4kids.com/files/studies_scimethod.html http://teacher.pas.rochester.edu/phy_labs/appendixe/appendixe.html http://www.sciencebuddies.com/mentoring/project_scientific_method.shtml http://en.wikipedia.org/wiki/Scientific_method http://www.experiment-resources.com/history-of-the-scientific-method.html