section 1 - drainage policy - austin,...
TRANSCRIPT

Drainage Criteria Manual
SECTION 1 - DRAINAGE POLICY
1.1.0 GENERAL
This manual represents the application of accepted principles of surface drainage engineering and is a working supplement to basic information obtainable from standard drainage handbooks and other publications on drainage. The policy statements of this section provide the underlying principles by which all drainage facilities shall be designed. The application of the policy is facilitated by the technical criteria contained in the remainder of the manual.
1.2.0 CITY OF AUSTIN DRAINAGE POLICY The intent of Austin’s drainage policy for stormwater management is to implement design principles and practices that control post-development runoff from all development such that no development will result in identifiable additional adverse flooding impacts in accordance with Chapter 25-7 of the Land Development Code.
1.2.1 Application
The City of Austin drainage policy shall govern the planning and design of drainage infrastructure within the City of Austin and within all areas subject to its extraterritorial jurisdiction. Definitions, formulae, criteria, procedures and data in this manual have been developed to support this policy. If any condition requiring some additional measure of protection is identified during design or construction, the engineer shall make provisions within the design. In order to receive a waiver an administrative variance to any of the criteria or policy policies in this manual, the applicant must receive approval from the Director of the Watershed Protection Watershed Protection and Development Review Department. A request for an administrative a waiver must comply with State law regarding engineering work and must include justification from the engineer that compliance is not feasible.
1.2.2 General
A. Stormwater runoff peak flow rates for the two (2), ten (10), twenty-five (25) and one-hundred (100) year frequency storms shall not cause increased inundation of any building or roadway surface or create any identifiable additional adverse flooding impacts.
B. Street curbs, gutters, inlets and storm sewers drains shall be designed to intercept, contain and transport all runoff from the 25-year frequency storm.
C. In addition to B above, the public drainage system shall be designed to convey those flows from greater than the 25-year frequency storm up to and including the 100-year frequency storm within defined public rights-of-way or drainage easements.
D. Stormwater runoff peak flow rates shall not be increased at any point of discharge from a site for the two (2), ten (10), twenty-five (25) and one hundred (100) year storm frequency events.
E. Regulation of peak flows to allowable levels, as determined by the provisions of this policy, shall be achieved by storage on-site or off-site or by participation in an approved Regional Stormwater Management Program. The Stormwater Management Detention Section of this manual provides a guide to acceptable methods, but does not limit the designer to the methods presented therein. Guidelines for participation in
the Regional Stormwater Management Program are contained in the Stormwater Management Detention Section of this manual.
F. For those developments which are immediately adjacent to and discharge directly into Lake Travis, Lake Austin, Lady Bird Lake and the Colorado River, on-site detention is not required.
G. Development activity is not subject to D. or E. above if the following conditions are satisfied:
1. The activity is located in the Waller Creek, Shoal Creek (downstream from the West 38th St. bridge), Boggy Creek, East Bouldin Creek, West Bouldin Creek, Blunn Creek, Johnson Creek, Harper's Branch or Lady Bird Lake watersheds; and
2. The activity involves an existing legal lot that is limited to single-family (SF-1, 2, or 3) land use by zoning, restrictive covenant or plat note; and
3. The proposed impervious cover does not exceed 45%; and
4. A site plan is not required; and
5. The existing lot size is equal to or less than 1.00 acre; and
6. The existing lot does not receive significant off-site drainage.
7 6. An engineer submits a signed, sealed and dated letter, addressed to the Director of the Watershed Protection Planning and Development Review Department, stating the following without qualification: "I certify that I have personally conducted a topographic review and field investigation of the existing and proposed flow patterns for stormwater runoff from the subject development subdivision to the main stem of (name of creek). At build-out conditions allowable by zoning, restrictive covenant or plat note, the stormwater flows from the subject development subdivision will not cause any additional identifiable adverse flooding impacts increase in flooding conditions to the interior of existing building structures, including basement areas, for storms of magnitude up through the 100-year event."
8. Calculations supporting the certification statement in Part 7 must be submitted if requested.
1.2.3 Street Drainage
A. No lowering of the standard height of street crown shall be allowed for the purposes of obtaining additional hydraulic capacity.
B. For non-curbed streets, all flows for the 100-year frequency storm shall be contained within paralleling roadside ditches, medians, drainage channels or other drainage facilities located within public rights-of-way or drainage easements.
C. No outlet structures from stormwater management facilities, groundwater collection, parking detention, or other improvements discharging concentrated flows shall be designed to discharge concentrated flow directly onto arterial or collector streets. For local streets, no concentrated discharge from sites larger than 0.25 acres shall be permitted. All concentrated discharges shall be conveyed by a closed conduit to the nearest existing storm drain.
D. Concentrated discharge across a sidewalk area will not be allowed. A channel section can be used under the sidewalk area, provided it is covered by a method approved by the Public Works Department and the outlet device utilizes sheet flow methods.
1.2.4 Drainage System

A. All drainage system components that are within public right-of-way or public drainage easements shall be manufactured and installed in compliance with the City of Austin Standard Specifications and Standards and shall comply with all applicable portions of the Transportation Criteria Manual published by the Department of Transportation, unless:
1. Those components receive stormwater runoff solely from private property,
2. That property consists solely of the property being developed, and
3. Those components are privately maintained.
This provision applies only to those drainage systems, which are to become an integral part of the public storm drain system, and excludes any private internal site systems. Drainage infrastructure to be constructed either in an easement that will not be privately maintained or in public or private right of way shall comply with all applicable portions of Section 11 of the Transportation Criteria Manual published by the Department of Public Works and Transportation.
B. Construction plans for proposed reinforced concrete box culverts, bridges and related structures may be adaptations of the Texas Department of Transportation (TxDOT) Standards.
C. For bridges and culverts in crossing residential local streets, runoff from the fully developed 100-year frequency storm shall not produce a headwater elevation at the roadway greater than either twelve (12) inches above the roadway crown elevation or any top of upstream curb elevation, whichever is lower.
D. For bridges and culverts in crossing streets other than a local residential street, runoff from the fully developed 100-year frequency storm shall not produce a headwater elevation at the roadway greater than six (6) inches above the roadway crown elevation or six (6) inches above any top of upstream curb elevation, whichever is lower.
E. All drainage facilities (including but not limited to headwalls, open channels, storm drains, area inlets, and detention, retention and water quality controls and their appurtenances) shall comply with the following requirements, unless otherwise noted in this section or the Environmental Criteria Manual (ECM). (See Figure 1-1 8-7 in DCM Appendix E D for approximate representation). For the purposes of this section (1.2.4.E), the term “residential structure” means a building used for living accommodations.
1. (a) Where a portion of the stormwater pond facility either has an interior slope or wall steeper than three (3) feet horizontal to one (1) foot vertical with a height exceeding one (1) foot, or, an exterior slope or wall steeper than three (3) feet horizontal to one (1) foot vertical with a height exceeding three (3) feet above adjacent ground, barrier-type fences at least six (6) feet high, and/or steel grating are required for all single-family or duplex residential development, City city maintained stormwater pond facilities, and/or for any privately maintained stormwater pond facilities located within 500 feet of a residential structure. Barrier type fences include, but are not limited to chain link, solid wood, masonry, stone or wrought iron.
(b) Metal components of the fence shall be corrosion-resistant and wood components of the fence shall be weather-resistant. Placement of the fence, shall be 20 feet past the toe of the embankment or to the edge of the property line. Any fence posts used shall be galvanized steel with a concrete footing of at least twelve (12) inches in diameter and at least eighteen (18) inches in depth (refer to City of Austin Standard Specification No. 701). All fences shall have at least one gate, which shall open fully inward and outward and shall be at least twelve (12) feet in width. The first gate shall provide access from either the easement or right-of-way. Access to the outfall structures strtuctures is required for inspection and maintenance. If the fencing prohibits access to the outfall structure, then a second gate shall be provided allowing access to the outfall structure. Corrosion-resistant aluminum or hot-dipped galvanized steel grates of load bearing strength are an acceptable means of vertical access control. Grates shall be securely bolted to the structure but shall allow for easy removal and replacement during maintenance operations.
2. The landscaping requirements of Section 2.9.1, part B. and C. only, of the Environmental Criteria Manual ECM apply for all detention, retention and water quality facilities for single-family or duplex residential development and/or for such facilities that will be maintained by the City. Landscaping and other vegetation shall not encroach into or impede use of any access drive or access strip, based upon the

nominal size of the landscaping or vegetation at maturity.
3. (a) A 12-foot maintenance access strip is required around the perimeter of detention, retention, and water quality facilities for single-family or duplex residential development and/or for such facilities that will be maintained by the City. This 12-foot maintenance access strip shall be outside the toe of any fill slope and the top of any cut slope and shall not have a post-construction longitudinal slope greater than 15% nor a post-construction transverse slope greater than 5%, shall not have a vertical grade break of greater than 12%, shall have an inside turning radius of no less than thirty-six (36) feet, shall be cleared and graded, and shall have vertical clearance from existing and proposed vegetation and all other objects of no less than 14 feet.
(b) A setback shall be provided for all detention, retention, and water quality facilities for single-family or duplex residential development and/or for such facilities that will be maintained by the City so that no such facility shall be located within 50 feet of a residential structure. All detention, retention and water quality facilities that will be for single-family or duplex residential development and/or for such facilities maintained by the City shall have a permanent maintenance equipment access ramp into each basin of the facilities, with a longitudinal slope not to exceed 4:1, a transverse slope not to exceed 5%, no vertical grade break greater than 12%, no vertical curve with a grade change greater than 1% per horizontal foot, an inside turning radius of no less than 36 feet, a minimum width of 12 feet and a clear distance from the bottom of the ramp to any facility interior slope of at least 15 feet.
(c) Access/drainage easements and access drives are required for those detention, retention and water quality facilities for single-family or duplex residential development and/or for such facilities that will be maintained by the City. Access drives shall have a longitudinal slope not to exceed 15%, a transverse slope not to exceed 5%, no vertical grade break greater than 12%, no vertical curve with grade change greater than 1% per horizontal foot, a centerline turning radius of no less than 50 feet, and a minimum width of 12 feet. The access drive shall include a means for equipment to turn around when located more than 200 feet from a paved public roadway. Access drives shall be cleared, graded and stabilized with stones in accordance with Figure 1-2 in Appendix D of this manual.
4. (a) For drainage facilities within a drainage easement, but not for single-family or duplex residential development or such facilities maintained by the City city, the 50 feet set back rule discussed in section 3(b) above in this section is not applicable for the proposed internal building(s), if they have a restrictive covenant for maintenance and 4-foot feet high barrier-type fences with accessible maintenance ramp.
(b) Any new commercial or multi-family pond(s) shall have a minimum 50-foot set back setback from any adjacent existing residential structure.
5. The setback requirement shall be measured from the edge of any portion of the facility such as the top of facility embankment, end of concrete apron/rock rip rap or top of structural wall and shall be dedicated by deed restriction or restrictive covenant, and a note referencing the restriction will be placed on the plat, if a plat is being processed as part of the development. Replatting to add the note is not required.
6. Discharge from storm drain outfalls shall not cause channel, bluff, or stream bank erosion. If the storm drain discharges to an open drainage facility (as determined by the City), the applicant must show acceptable nonerosive conveyance to that drainage facility, and appropriately designed outfall including adequate energy dissipation, which may include stream stabilization. appropriate energy dissipation at the outfall and a stable headwall.
7. Free standing structural walls/facilities located on or adjacent to a residential structure lot shall not be greater than six (6) feet in height.
8. Drainage or drainage access easements that are required along side lot lines shall be located adjacent to a property line and shall not be centered on a property line.
9. Access/drainage easements and access drives are required for those detention, retention and water quality facilities for single-family or duplex residential development and/or for such facilities that will be maintained by the City. Access drives shall have a longitudinal slope not to exceed 15%, a transverse

slope not to exceed 5%, no vertical grade break greater than 12%, no vertical curve with grade change greater than 1% per horizontal foot, a centerline turning radius of no less than 50 feet, and a minimum width of 12 feet. The access drive shall include a means for equipment to turn around when located more than 200 feet from a paved public roadway. Access drives shall be cleared, graded and stabilized with stones in accordance with Figure 8-9 in Appendix E of this manual.
9. 10. Access drives are required for those area inlets and headwalls for single-family or duplex residential development and/or for such facilities that will be maintained by the City when access is proposed between single-family lots or when access from any other location exceeds 20% grade. Access drives shall meet the criteria of section 3 (c) 9. above.
10. 11. Points of access to water quality and detention facilities for single-family or duplex residential development and/or for such facilities that will be maintained by the City shall have a standard City of Austin Type II concrete driveway approach and curb cut on the abutting street. A pipe gate is required at the end of the driveway at the ROW limits. See Figure 1-3 8-8 in Appendix E D of the Drainage Criteria Manual for details.
11. 12. Detention, retention and water quality facilities for single-family or duplex residential development and/or for such facilities that will be maintained by the City shall have a staging area not less than 800 square feet in area (with no dimension less than 20 feet) if the storage volume of the pond exceeds 2,000 cubic feet. No portion of the staging area shall be located further than 100 feet from the detention, retention or water quality facility and the access drive and the staging area shall be within an access easement. No portion of the staging area shall be located within or on any ponding area, interior slope of the facility, or access drive or strip. The staging area shall be cleared, shall have vertical clearance from existing and proposed vegetation and all other objects of no less than 14 feet and shall have no finished slope greater than 10%.
12. 13. Section 1.6.3.B of the Environmental Criteria Manual ECM shall apply to for all drainage facilities for single-family or duplex residential development and/or for such facilities that will be maintained by the City.
13. 14. All pond bottoms, side slopes and earthen embankments shall be compacted to 95% of maximum density in accordance with City of Austin COA Standard Specifications, excluding rain gardens and any water quality features that require infiltration to meet water quality standards. Side slopes for earthen embankments shall not exceed three (3) horizontal to one (1) vertical (3H:1V). Rock slopes may exceed these limits if a geotechnical report warrants a deviation. Actual field conditions may override the geotechnical report. Concrete walls shall be built to City of Austin COA Standards Specifications. Expansion joints on free-standing walls shall have water-tight seals as needed. Ponds for single-family or duplex residential development and/or for City maintained ponds with other than full concrete bottoms must have bottom slopes of no less than 2%. Ponds with full concrete bottoms must have bottom slopes of no less than 0.5%; all grass-lined portions of the pond bottom must have a slope of no less than 2% from that portion to the concrete-lined pilot channel. The pilot channel must be at least four (4) feet wide and have a V-shaped cross-sectional flow area two (2) inches deep. Pilot channels are discouraged in water quality ponds due to the creation of short-circuiting and standing water problems. Where it is deemed necessary due to topographic constraints, a pilot channel installed in a water quality pond must be designed to prevent short-circuiting, standing water problems, and shall have a flow spreader installed, refer to Section 1.6.2.D of the Environmental Criteria Manual ECM. The bottom slope for ponds is defined as the effective slope from any point in the bottom of the pond to the discharge elevation at the point of discharge from the pond, as measured by a straight line between those two points.
14. 15. Section 8.3.4 3 of this manual shall apply for all stormwater management facilities, including water quality facilities and stormwater management infrastructure.
15. 16. All mechanical stormwater management facilities and systems for single-family or duplex residential development and/or for such facilities to be maintained by the City shall meet City of Austin Water and Wastewater criteria. OSHA requirements for ingress and egress are also required for any facility that will be located in a confined space above or under ground.
16. 17. Signs stating “Stormwater Facility - No Vehicles Allowed. No Dumping. Violators will be
prosecuted. For information call the City of Austin.” are required on each side of a single-family residential, duplex residential, and/or City-maintained stormwater pond.
17. 18. No area within the limits of construction of the development shall allow stormwater to become stagnant. Maximum retention or “draw-down” time for detention ponds shall not exceed 24 hours from the time of peak storage to the time of complete emptying of the pond, as determined by hydrograph routing or other calculations acceptable to the City. This requirement does not apply to facilities in which retention or “draw-down” time is required to be greater than 24 hours. All volume required for detention shall be available after 24 hours to allow for subsequent storms, including any portion of the water quality volume utilized for detention purposes.
18. 19. In order to minimize vandalism and deterioration, use of exposed piping and appurtenances and any loose materials (other than access drive rock) shall be avoided or minimized. Use of all such items shall be approved by the City.
F. Any concentrated flow necessitates the dedication of a drainage easement to the larger of following: the limits of the fully developed 100-year storm water surface elevation, or minimum easements widths as required in this Drainage Criteria Manual.
G. An easement or right-of-way as required in this Drainage Criteria Manual must be of sufficient width to provide continuous access for the operation, maintenance, or repair of a drainage facility or conveyance of stormwater.
(1) A minimum of 25 feet in width for an open drainage system; or
(2) A minimum of 15 feet in width for an enclosed drainage system.
1.2.5 Computations
Computations to support all drainage designs shall be submitted to the appropriate City city departments for review. The computations should be in such form as to allow for timely and consistent review and also to be made a part of the permanent City city record for future reference. All computations submitted shall be certified by a professional engineer registered in the State of Texas.
1.2.6 Floodplain Flood Plain Delineations
A. City of Austin.
1. For purposes of this Drainage Criteria Manual, a drainage area of 64 acres or greater is required within a contributing watershed to create a "floodplain". For areas of flow with less than 64 acres of contributing area, no floodplain shall be defined unless the City or FEMA currently indicates the area as a floodplain. In all cases where a floodplain flood plain delineation is required, its determination shall be based on the projected full development of all properties contributing to the point of consideration. It is the responsibility of the design engineer to determine, based on the most accurate information available, what the floodplain delineation fully developed drainage area is.
2. The design engineer may elect to utilize a floodplain flood plain delineation previously approved by the Director of the Watershed Protection and Development Review Department, assuming the same is still applicable under present requirements and criteria. In so doing the engineer does not remove himself from the responsibility for the delineation's accuracy.
3. For purposes of this Drainage Criteria Manual, a drainage area of 64 acres or greater is required within a contributing watershed to create a "flood plain". For areas of flow with less than 64 acres of contributing area, no flood plain shall be defined; however, with regards to the drainage criteria contained in this manual any concentrated flow necessitates the dedication of a drainage easement.

B. Federal Emergency Management Agency.
1. The Federal Emergency Management Agency (FEMA) maintains Flood Insurance Rate Maps (FIRM's) that depict floodplain and floodway boundaries. The floodplain and floodway boundaries depicted on FIRM's are based on existing conditions of development in the contributing area at the time the floodplain study that delineated the floodplain was completed.
2. FEMA reviews and approves or denies all revisions or amendments to FIRM's. FEMA revises or amends FIRM's by approval of a Letter of Map Amendment or Letter of Map Revision. These documents are referred to collectively as a Letter of Map Change (LOMC). FEMA establishes the process and fees necessary for review of an application for a LOMC.
3. FEMA reviews the impact of proposed site developments and offers or denies conditional assurance that a FIRM may be changed by the proposed development. FEMA offers this assurance by a Conditional Letter of Map Amendment or Conditional Letter of Map Revision. These documents are referred to collectively as a Conditional Letter of Map Change (CLOMC). The CLOMC is a conditional statement that the FIRM may be changed if (1) the development is constructed as proposed in the CLOMC application, and if (2) a complete LOMC is submitted after construction of the proposed development.
4. As the local floodplain administrator, the City must review and acknowledge certain LOMC or CLOMC requests. The City establishes the process necessary for review of an application for a LOMC or CLOMC.
C. Coordination of City of Austin and FEMA Floodplain Delineations.
1. The 100-year floodplain as determined in accordance with this Manual is a standard for dedication of drainage easements. This floodplain is theoretically equal to or greater than the 100-year floodplain depicted by FEMA on the FIRM. If the floodplain on the FIRM extends beyond a drainage easement required by the Land Development Code, or offered by the applicant, then the floodplain depicted on the FIRM must be changed by FEMA. This requirement assures that floodplain boundaries and associated regulations are coordinated between the City of Austin and FEMA. Floodplain mapping may be changed due to updated analysis of the floodplain under existing conditions, or due to land development activities that alter existing conditions.
2. If the floodplain depicted on the FIRM is required to be changed, pursuant to C.1. above, due to updated analysis of the floodplain under existing conditions, then the following requirements are applicable:
(a) Prior to approval of a preliminary plan, the applicant must provide to the City a letter of acknowledgement by FEMA of receipt of a complete application for a LOMC.the applicant must provide to the City evidence of receipt by FEMA of an application for a LOMC.
(b) Prior to approval of a final plat, the applicant must provide to the City evidence of approval by FEMA of the LOMC submitted under C.2.(a). If the final plat is approved before it is determined that a LOMC is necessary or desired, then prior to release of a subdivision construction permit or site plan permit plans, the applicant must provide to the City a letter of acknowledgement by FEMA of receipt of a complete application for a LOMC.
(c) Prior to final acceptance of the construction of the subdivision or issuance of building permits for buildings that are within the floodplain at the time of application, the applicant must provide to the City evidence of final acceptance by FEMA of the LOMC submitted under C.2.(a) above.
3. If the floodplain depicted on the FIRM is required to be changed, pursuant to C.1. above, due to land development activities that alter existing conditions, then the following requirements are applicable:
(a) Prior to approval of a preliminary plan, the applicant must provide to the City either: evidence that the proposed land development activities do not increase the level of the FEMA floodplain; or a letter of acknowledgement by FEMA of receipt of a complete application for a CLOMC. the applicant must provide to the City evidence of receipt by FEMA of an application for a CLOMC.

(b) Prior to approval of a final plat, the applicant must provide to the City either: evidence that the proposed land development activities do not increase the level of the FEMA floodplain; or evidence of approval by FEMA of the CLOMC submitted under (a).
(c) If the final plat is approved before it is determined that a CLOMC is necessary or desired, then prior to approval release of a subdivision construction permit or site plan permit plans, the applicant must provide to the City either: evidence that the proposed land development activities do not increase the level of the FEMA floodplain; or a letter of acknowledgement by FEMA of receipt of a complete application for a CLOMC.
(d) Prior to final acceptance of the subdivision construction or site plan improvements of the subdivision or issuance of building permits for buildings that are within the portion of the FEMA floodplain affected by a required LOMC, the applicant must provide to the City evidence of final acceptance by FEMA of the CLOMC if required submitted under C.3 (c ) above, and a letter of acknowledgement by FEMA of a complete application for a LOMC.
(e) Prior to issuance of a certificate of occupancy for buildings within the portion of the FEMA floodplain affected by a required LOMC, the applicant must provide to the City evidence of final acceptance by FEMA of the LOMC.
4. The applicant shall bear the cost of engineering services required to develop the application, respond to review comments, and obtain final approval of LOMC's and CLOMC's. The applicant shall bear the cost of any fees associated with review and disposition of LOMC's and CLOMC's that are established by FEMA.
1.2.7 City Ordinances
The ordinances empowering the drainage policies and criteria presented in this Manual manual are contained in Chapter 25-7 of the Code of the City of Austin as amended. Any revisions or changes to the policies, criteria or guidelines shall be posted in accordance with the notification procedures in the development code.
1.3.0 DEFINITIONS
All terms and abbreviations used in the text are presented in the " Glossary" of this manual.
1.4.0 DESIGNATION AND DELINEATION OF AUSTIN AREA WATERSHEDS The Austin area is divided into drainage basins with outlets at the Colorado, Blanco and Brazos Rivers. These basins, in turn, are divided into drainage areas contributing to the main tributaries. Subareas are formed within the drainage areas by natural branches or by the construction of open or enclosed storm sewers drains. Please refer to http://www.austintexas.gov/page/austin-watersheds-list for a list of the Austin area watersheds, tributaries, and their codes. Watershed boundary delineations are maintained by the City. Use of any other delineation must be approved by the City and reflected on official City GIS maps, as designated by the Director of the Watershed Protection Department, prior to use.
Table 1-1 lists the Austin area watershed codes named after the primary watercourse of the watershed and indicates those watershed basins which are presently a part of the Regional Stormwater Management Program. However, this does not preclude a regional application in any watershed. Watershed boundary delineations are maintained by the City. Use of any other delineation must be approved by the City and reflected on official City GIS maps, as designated by the Director of the Watershed Protection and Development Review Department, prior to use.

Table 1-1 CODE DESIGNATION OF AUSTIN AREA WATERSHEDS
CODE WATERSHED NAME DISCHARGE INTO RSMP
BAR Barton Creek Lady Bird Lake Yes
BER Bear Creek Onion Creek Yes
BRW Bear Creek West Lake Austin No
BEE Bee Creek Lake Austin No
BSY Big Sandy Creek Lake Travis No
BLK Block Creek Brushy Creek No
BLU Blunn Creek Lady Bird Lake No
BOG Boggy Creek Colorado River No
BOH Bohls Hollow Lake Austin No
BRU Brushy Creek San Gabriel River No
BUK Buck Hollow Barton Creek Yes
BUL Bull Creek Lake Austin Yes
BHW Bullick Hollow Lake Travis No
BCP Buttercup Creek South Brushy Creek No
BMK Buttermilk Branch Little Walnut Creek No
CAR Carson Creek Colorado River Yes
CDR Cedar Creek Colorado River No
CED Cedar Hollow Lake Austin No
CHK Chalk Knob Hollow Barton Creek Yes
CHE Cherry Creek Branch Williamson Creek Yes
CLK Cluck Creek South Brushy Creek No
CMF Commons Ford Creek Lake Austin No
CRN Cuernavaca Creek Lake Austin No
CWR Coldwater Creek Lake Austin No
CHW Collier Hollow Lake Travis No
COL Colorado River* Gulf of Mexico No
CNR Connors Creek Lake Austin No

CTM Cottonmouth Creek Onion Creek Yes
CTW Cottonwood Creek Brushy Creek No
CCW Country Club West Colorado River Yes
CCE Country Club East Colorado River Yes
COW Cow Fork Bull Creek Bull Creek Yes
CYP Cypress Creek Lake Travis No
DNE Dry Creek NE Wilbarger Creek No
DNZ Danz Creek Slaughter Creek Yes
DVS Davis Spring Branch Lake Creek Yes
DKR Decker Creek Gilleland Creek Yes
DVL Devil's Hollow Lake Travis No
DVP Devil's Pen Creek Lake Travis No
DRN Dry Creek North Lake Austin No
DRE Dry Creek East Colorado River Yes
EAN Eanes Creek** Lady Bird Lake No
EBO East Bouldin Creek Lady Bird Lake Yes
ELM Elm Creek Colorado River/Gilleland Creek Yes
ELS Elm Creek South Blanco River No
FOR Fort Branch Boggy Creek No
GIL Gilleland Creek Colorado River Yes
GRG Gragg Hollow Lake Travis No
GRP Grape Creek Barton Creek Yes
HAN Hancock Branch Shoal Creek Yes
HRP Harper's Branch Lady Bird Lake No
HRS Harris Branch Gilleland Creek Yes
HRN Harrison Hollow Lake Austin No
HKS Hickson Hollow Little Barton Creek No
HOG Hog Pen Creek Lake Austin No

HOL Holman Hollow Barton Creek Yes
HNY Honey Creek Lake Austin No
HUK Huck's Slough Lake Austin No
HUR Hurst Creek Lake Travis No
JOH Johnson Creek Lady Bird Lake No
KIN Kincheon Branch Williamson Creek Yes
LKC Lake Creek Brushy Creek Yes
LKT Lake Travis Lake Austin No
LKA Lake Austin Lady Bird Lake No
LIM Lime Creek Lake Travis No
LWA Little Walnut Creek Walnut Creek Yes
LBA Little Barton Creek Barton Creek No
LBE Little Bee Creek Bee Creek No
LBL Lady Bird Lake Colorado River No
LBR Little Bear Creek Bear Creek Yes
LDE Little Devil's Hollow Lake Travis No
LOC Lockwood Creek Colorado River No
LNB Long Branch Barton Creek Yes
LNH Long Hollow Lake Travis No
LHC Long Hollow Creek Lake Travis No
MAH Maha Creek Cedar Creek No
MAR Marble Creek Onion Creek Yes
MAS Mason Creek Brushy Creek No
MYR Myrtle Creek Barton Creek Yes
NFB North Fork Brushy Creek Brushy Creek No
NFD North Fork Dry Creek Dry Creek (East) Yes
ONI Onion Creek Colorado River Yes
OWL Owl Hollow Little Barton Creek No
PAN Panther Hollow Lake Austin No

PLM Plum Creek Blanco River No
POK Post Oak Creek Brushy Creek No
QUB Quail Creek Branch Little Walnut Creek Yes
RAT Rattan Creek Lake Creek Yes
RDR Running Deer Creek Lake Austin No
RIN Rinard Creek Onion Creek Yes
RKY Rocky Creek Barton Creek Yes
SHL Shoal Creek Lady Bird Lake Yes
SSB Short Spring Branch Barton Creek Yes
SLA Slaughter Creek Onion Creek Yes
SBG South Boggy Creek Onion Creek Yes
SBR South Brushy Creek Brushy Creek No
SFB South Fork Brushy Creek Brushy Creek No
SFD South Fork Dry Creek Dry Creek (East) Yes
SPN Spanish Oak Creek Brushy Creek No
SPL Spillman Hollow Little Barton Creek No
SPH Spring Hollow Bear Creek No
STP St. Stephens Creek Lake Austin No
STN Steiner Creek Lake Austin No
SYC Sycamore Creek Barton Creek Yes
TAN Tannehill Branch Boggy Creek No
TRB Tar Branch Walnut Creek Yes
TRH Tar Hollow Lake Austin No
TYN Taylor Slough North Lake Austin No
TYS Taylor Slough South Lake Austin No
THO Thomas Spring Branch Barton Creek Yes
TRK Turkey Creek Lake Austin No
WLR Waller Creek Lady Bird Lake No
WLN Walnut Creek Colorado River Yes

WLL Walter E. Long Lake Decker Creek Yes
WLS Wells Branch Walnut Creek Yes
WBL West Bull Creek Bull Creek Yes
WBO West Bouldin Creek Lady Bird Lake No
WHT White Branch Barton Creek Yes
WLB Wilbarger Creek Colorado River No
WMS Williamson Creek Onion Creek Yes
WLW Willow Creek Wilbarger Creek No
YAU Yaupon Creek Lake Travis No
YET Yett Branch Walnut Creek Yes
* Colorado River is separated into four reaches: Lake Travis (upstream of Mansfield Dam), Lake Austin (Mansfield Dam to Tom Miller Dam), Lady Bird Lake (Tom Miller Dam to Longhorn Dam) and Colorado River (downstream of Longhorn Dam).
** Two unofficial names are used for Eanes Creek. The others are Dry Creek (South) and Lanes Creek.
Sources (For Table 1-1):
1. Continental Map Inc., Austin Map, 1986 edition.
2. Continental Map Inc., Round Rock, Georgetown, Leander and Cedar Park Map, 1986 edition.
3. Texas Highway Department, General Highway Maps, 1974.
4. U.S. Geological Survey, Quadrangle Maps (Austin, Bee Cave, Jollyville, Montopolis, Mansfield Dam, Oak Hill, Pflugerville, Signal Hills, Travis Peak), 1968.
5. City of Austin, Drainage Criteria Manual, First Edition, Austin, Texas, January, 1977. Disclaimer: This Code of Ordinances and/or any other documents that appear on this site may not reflect the most current legislation adopted by the Municipality. American Legal Publishing Corporation provides these documents for informational purposes only. These documents should not be relied upon as the definitive authority for local legislation. Additionally, the formatting and pagination of the posted documents varies from the formatting and pagination of the official copy. The official printed copy of a Code of Ordinances should be consulted prior to any action being taken. For further information regarding the official version of any of this Code of Ordinances or other documents posted on this site, please contact the Municipality directly or contact American Legal Publishing toll-free at 800-445-5588.
© 2013 American Legal Publishing Corporation [email protected]
1.800.445.5588.

Drainage Criteria Manual
SECTION 2 - DETERMINATION OF STORM RUNOFF
2.1.0 GENERAL
If continuous records of the amounts of runoff from urban areas were as readily available as records of precipitation, they would provide the best source of data on which to base the design of storm drainage and flood protection systems. Unfortunately, such records are available in very few areas in sufficient quantity to permit an accurate prediction of the stormwater runoff. The accepted practice, therefore, is to relate runoff to rainfall, thereby providing a means for predicting the amount of runoff to be expected from urban watersheds at given recurrence intervals.
Numerous methods of rainfall runoff computations are available on which the design of storm drainage systems may be based. The method chosen is dependent upon the engineer's technical familiarity and the size of the area to be analyzed. For Within the method chosen, the engineer will be responsible for making reasonable assumptions as to the development characteristics of the study area.
2.2.0 EFFECTS OF URBANIZATION
It has long been recognized that urban development has a pronounced effect on the rate of runoff from a given rainfall event. The hydraulic efficiency of a drainage area is generally improved increased as a byproduct of by urbanization, which in effect reduces the storage capacity of a watershed. This reduction of a watershed's storage capacity is a direct result of the elimination of pervious porous surfaces, small ponds, and holding areas. This comes about by the grading and paving of building sites, streets, drives, parking lots, and sidewalks and by construction of buildings and other facilities characteristic of urban development. The result of the improved hydraulic efficiency is illustrated graphically in Figure 2-1 in Appendix E D of this manual, which is a plot of the runoff rate versus time for the same storm with two different stages of watershed development.
2.2.1 Design Assumptions For Storm Runoff Stormflow Analysis
A. When analyzing an area for channel or storm drain design purposes, urbanization of the full watershed without stormwater detention facilities ponds shall be assumed (except as noted in (D. E.) below). Zoning maps, future land use maps, and master plans should be used as aids in establishing the anticipated surface character of the ultimate development. The selection of design runoff coefficients and/or percent impervious cover factors are explained in the following discussions of runoff calculation.
B. An exception to (A.) above may be granted if the channel is immediately downstream of a City maintained regional detention pond facility and written approval is obtained from the Director of the Watershed Protection and Development Review Department.
C. In designing a storm drain system within a residential subdivision, full development of adjoining and interior tracts without detention shall must be assumed.
D. In designing a storm drain system within a commercial or multifamily subdivision, 25-year stormflows can at the Engineer's discretion, reflect the flow reduction anticipated by future detention ponds. This applies exclusively to the flows generated by those properties contained within the subdivision. Provisions for conveyance of the 100-year undetained flows within the right-of-way or drainage easements still apply. (See Sec. 1.2.2)
D E. In the event the engineer desires to incorporate the flow reduction benefits of existing upstream

detention facilities ponds, the following field investigations and hydrologic analysis will be required: (Please note that under no circumstances will the previously approved construction plans of the upstream detention facilities ponds suffice as an adequate analysis. While the responsibility of the individual site or subdivision plans rests with the engineer of record, any subsequent engineering analysis must ensure assure that all the incorporated detention facilities ponds work collectively.)
1. A field survey of the existing physical characteristics of both the outlet structure and ponding volume. Any departure from the original engineer's design must be accounted for. If a dual use for the detention facility pond exists, (e.g., storage of equipment) then this too should be accounted for.
2. A comprehensive hydrologic analysis which simulates the flow attenuation produced by the existing detention facility in of the upstream contributing area ponds. This should not be limited to a linear additive analysis but rather a network of hydrographs hydrographies which considers incremental timing of discharge and potential coincidence of outlet peaks.
2.3.0 METHOD OF ANALYSIS
Numerous methods of rainfall-runoff computation are available on which the design of storm drainage and flood control systems may be based. The Rational Method is accepted as adequate for drainage areas totaling 100 acres or less. The Soil Conservation Service (now called the National Resources Conservation Service) (formerly the Soil Conservation Service) hydrologic methods (available in the NRCS SCSTR-20, and the US Army Corps of Engineers' Hydrologic Engineering Center’s' (HEC) HEC-1 (note that HEC-1 is DOS based and will not be updated) and HEC-HMS programs) should be used for drainage areas larger than 100 acres but may also be used for drainage areas of any size. The method of analysis must remain consistent when drainage areas are combined. In cases where the Rational Method is used for storm drainage system design and NRCS methods are used for off-site drainage calculations, detention facility analysis or design or evaluation of downstream impacts, the results of the Rational and NRCS Methods should be consistent at common analysis points. and the method which applies to the largest combined drainage area should be used unless the situation requires the use of NRCS hydrologic methods (i.e., a detention pond facility connected to a downstream storm drainage system). The engineer can use other methods but must have their acceptability approved by the Director of the Watershed Protection and Development Review Department.
2.4.0 RATIONAL METHOD
The Rational Method is based on the direct relationship between rainfall and runoff, and is expressed by the following equation:
Qp = CiA (Eq. 2-1)
Where:
Qp is defined as the peak runoff in cubic feet per second. Actually, Qp is in units of acre-inches per hour. inches per hour per acre. Since this rate of acre-in/hr in/hr/ac differs from cubic feet per second by less than one (1) percent (1 acre-in/hr in/hr/ac = 1.008 cfs), the more common units of cfs are used.
C is the composite coefficient of runoff representing the ratio of peak runoff rate "Qp" to average rainfall intensity rate "i" for the soil types and land uses characteristic of the contributing drainage area. a specified area "A".
i is the average intensity of rainfall in inches per hour for a period of time equal to the time of concentration (tc) for the drainage area to the design point under consideration.
A is the area in acres contributing runoff to the point of design.
The following basic assumptions are associated with the Rational Method:
A. The storm duration is equal to the time of concentration.
B. The computed peak rate of runoff at to the design point is a function of the average rainfall rate over a duration equal to during the time of concentration at to that point.
C. The return period or frequency of the computed peak flow is the same as that for the design storm.
D. The necessary basin characteristics can be identified and the runoff coefficient does not vary during a storm.
E. Rainfall intensity is constant during the storm duration and spatially uniform for the area under analysis.
F. The maximum rate of discharge at the point of design will occur when the entire area above the point of design is contributing runoff.
2.4.1 Runoff Coefficient (C)
The proportion of the total rainfall that will reach the drainage system depends on the surface vegetation condition, soil type, imperviousness of the surface, and the land slope and ponding characteristics of the area. Impervious surfaces, such as asphalt pavements and roofs of buildings, will be subject to approximately 100 percent runoff (regardless of the slope). On-site inspections and aerial photographs may prove valuable in estimating the nature of the surfaces within the drainage area.
The runoff coefficient "C" in the Rational Formula is also dependent on the character of the soil. The type and condition of the soil determines its ability to absorb precipitation. The rate at which a soil absorbs precipitation generally decreases as the rainfall continues for an extended period of time. The soil infiltration rate is influenced by the presence of soil moisture (antecedent precipitation), the rainfall intensity, the proximity of the ground water table, the degree of soil compaction, the porosity of the subsoil, and ground slopes.
It should be noted that the runoff coefficient "C" is the Rational Method variable of the Rational Method which is least amenable susceptible to precise determination. A reasonable coefficient must be chosen to represent the integrated effects of infiltration, surface ponding detention storage, evaporation, retention, flow routing and interception, all of which affect the time distribution and peak rate of runoff.
Table 2-1 presents recommended ranges for "C" values based on specific land use types and ground slope.
It is often desirable to develop a composite runoff coefficient based upon the percentages of different types of surfaces in the drainage area. This procedure is often applied to typical "sample blocks" as a guide to selection of reasonable values of the coefficient for an entire area. Suggested coefficients with respect to specific surface types are given in Table 2-12. “C” values for developed conditions should be based on maximum allowable impervious cover as listed in the City’s city’s zoning and watershed ordinances.
2.4.2 Time of Concentration
The time of concentration is the time for surface runoff a drop of water to flow from the most remote point in the watershed to the point of interest. This applies to the most remote point in time, not necessarily the most remote point in distance. Runoff from a drainage area usually reaches a peak at the time when the entire area is contributing. However, runoff Runoff may reach a peak prior to the time the entire drainage area is contributing if the area is irregularly shaped or if land use characteristics differ significantly within the area. Sound engineering judgment should be used to determine a flow path representative of the drainage area and in the subsequent calculation of the time of concentration. The time of concentration to any point in a storm drainage system is a combination of the sheet flow (overland), the shallow concentrated flow and the

channel flow, which may includes storm drains. The minimum time of concentration for any drainage area shall be 5 minutes. Additionally, the minimum slope used for calculation of sheet and shallow flow travel time components should be 0.005 feet per foot (0.5%). The preferred procedure for estimating time of concentration is the NRCS method as described in NRCS's Technical Release 55 (TR-55). This method is outlined below. The overall time of concentration is calculated as the sum of the sheet, shallow concentrated and channel flow travel times. Note that there may be multiple shallow concentrated and channel segments depending on the nature of the flow path.
Tc = Tt(sheet) + Tt(shallow concentrated) + Tt(channel) (Eq. 2-2)
A. Sheet Flow. Sheet flow is shallow flow over land surfaces, which usually occurs in the headwaters of streams. The engineer should realize that sheet flow occurs for only very short distances, especially in urbanized conditions. While sheet Sheet flow for both natural (undeveloped) and developed existing conditions should be is typically limited to a maximum of 100 300 feet., sheet Sheet flow for developed conditions should be based on the actual pavement or grass conditions for areas that are already developed and should be representative of the anticipated land use within the headwater area in the case of currently undeveloped areas. In a typical residential subdivision, sheet flow may be the distance from one end of the lot to the other or from the house to the edge of the lot. limited to 150 feet. In some heavily urbanized drainage areas, sheet flow may not exist in the headwater area. The NRCS method employs equation 2-3, which is a modified form kinematic wave equation, for the calculation of the sheet flow travel time. The following equation 2-2 has been developed for sheet flow of less than 300 feet.
Tt = 0.007(nL)0.8/(P2)0.5s0.4 Tt = Ln/(42s0.5) (Eq. 2-32)
Where,
Tt = Sheet flow travel time in minutes L = Length of the reach in ft. n = Manning's n (see Table 2-2 table 2-3) P2 = 2-year, 24-hour rainfall in inches (see Table 2-3)
s = Slope of the ground in ft/ft
B. Shallow Concentrated Flow. After a maximum of approximately 100 300 feet, sheet flow usually becomes shallow concentrated flow. collecting in swales, small rills, and gullies. Shallow concentrated flow is assumed not to have a well-defined channel and has flow depths of 0.1 to 0.5 feet. The travel time for shallow concentrated flows can be computed by equations 2-4 and 2-5. 2-3: These two equations are based on the solution of Manning’s equation with different assumptions for n (Manning’s roughness coefficient) and r (hydraulic radius, ft). For unpaved areas, n is 0.05 and r is 0.4; for paved areas, n is 0.025 and r is 0.2.
Unpaved Tt = L/(60(16.1345)(s)0.5) (Eq. 2-4)
Paved Tt = L/(60(20.3282)(s)0.5) (Eq. 2-5)
Tt = Ln/(60s0.5) (Eq. 2-3)
Where,
Tt = Travel time for shallow concentrated flows in minutes L = Length of the reach in ft. n = Manning's n (see Table 2-3) s = Slope of the ground in ft/ft
C. Channel or Storm Drain Flow. The velocity in an open channel or a storm drain not flowing full can be determined by using Manning's Equation. Channel velocities can also be determined by using backwater profiles. For open channel flow, average flow velocity is usually determined by assuming a bank-full condition. Note that the channel flow component of the time of concentration may need to be divided into

multiple segments in order to represent significant changes in channel characteristics. The details of using Manning's equation and selecting Manning's "n" values for channels can be obtained from Section 6.
For storm drain flow under pressure conditions (hydraulic grade line is higher than the lowest crown of a storm drain) the following equation should be applied:
V = Q/A (Eq. 2-64)
Where:
V = Average velocity, ft/s Q = Design discharge, cfs A = Cross-sectional area, ft2
Flow travel time through a channel can be calculated by equation (2-75):
Tt = ∑S (Li/60 Vi) (Eq. 2-75)
Where:
Li = The i-th channel segment length, ft Vi = The average flow velocity within the i-th channel segment, ft/s Tt = Total Flow travel time through the channel, min
TABLE 2-1 RATIONAL METHOD RUNOFF COEFFICIENTS BY LAND USE TYPE FOR USE IN Q = CiA Runoff Coefficient (C)
Land Use* 100-Year Runoff Coefficients (C) for Basin Slopes
I.C. % 0-2% 2-7% 7%+
Single Family (SF-1) 40 0.60 0.66 0.69
Multifamily (MF-3) 65 0.76 0.79 0.81
Commercial (LR), General Office (GO) 80 0.85 0.87 0.88
Commercial Service (CS) 95 0.94 0.94 0.95
Assumptions:
1. Composite “C” value for developed conditions (CDEV) is : CDEV = IC1 + (1 – I)C2
Where: I = Impervious cover, percent C1 = “C” value for impervious cover C2 = “C” value for pervious area (grass, lawns, parks, etc.)
*2. For other land use and corresponding maximum allowable impervious coverage values refer to the Zoning Ordinance.
Source: 1. City of Ausitn, Watershed Engineering Division
2. City of Austin Zoning Ordinance
TABLE 2-12 RATIONAL METHOD RUNOFF COEFFICIENTS FOR COMPOSITE ANALYSIS

Runoff Coefficient (C)
Character of Surface Return Period
2 Years
5 Years
10 Years
25 Years
50 Years
100 Years
500 Years
DEVELOPED
Asphaltic 0.73 0.77 0.81 0.86 0.90 0.95 1.00
Concrete 0.75 0.80 0.83 0.88 0.92 0.97 1.00
Grass Areas (Lawns, Parks, etc.)
Poor Condition* Flat, 0-2% Average, 2-7% Steep, over 7%
0.32 0.37 0.40
0.34 0.40 0.43
0.37 0.43 0.45
0.40 0.46 0.49
0.44 0.49 0.52
0.47 0.53 0.55
0.58 0.61 0.62
Fair Condition** Flat, 0-2% Average, 2-7% Steep, over 7%
0.25 0.33 0.37
0.28 0.36 0.40
0.30 0.38 0.42
0.34 0.42 0.46
0.37 0.45 0.49
0.41 0.49 0.53
0.53 0.58 0.60
Good Condition*** Flat, 0-2% Average, 2-7% Steep, over 7%
0.21 0.29 0.34
0.23 0.32 0.37
0.25 0.35 0.40
0.29 0.39 0.44
0.32 0.42 0.47
0.36 0.46 0.51
0.49 0.56 0.58
UNDEVELOPED
Cultivated Flat, 0-2% Average, 2-7% Steep, over 7%
0.31 0.35 0.39
0.34 0.38 0.42
0.36 0.41 0.44
0.40 0.44 0.48
0.43 0.48 0.51
0.47 0.51 0.54
0.57 0.60 0.61
Pasture/Range Flat, 0-2% Average, 2-7% Steep, over 7%
0.25 0.33 0.37
0.28 0.36 0.40
0.30 0.38 0.42
0.34 0.42 0.46
0.37 0.45 0.49
0.41 0.49 0.53
0.53 0.58 0.60
Forest/Woodlands Flat, 0-7% Average, 2-7% Steep, over 7%
0.22 0.31
0.25 0.34
0.28 0.36
0.31 0.40
0.35 0.43
0.39 0.47
0.48 0.56

0.35 0.39 0.41 0.45 0.48 0.52 0.58
Assumptions:
1. Composite “C” value for developed conditions (CDEV) is : CDEV = I C1 + (1 – I)C2
Where: I = Impervious cover, percent C1 = “C” value for impervious cover C2 = “C” value for pervious area (grass, lawns, parks, etc.)
2. For maximum allowable impervious coverage values for various land use types, refer to the City of Austin Zoning Ordinance.
* Grass cover less than 50 percent of the area. ** Grass cover on 50 to 75 percent of the area. *** Grass cover larger than 75 percent of the area.
Source: 1. Rossmiller, R.L. “The Rational Formula Revisited.” 2. City of Austin, Watershed Engineering Division
TABLE 2-23 Manning's "n" for overland flow and shallow concentrated flow
Manning’s “n”1 Surface Description
0.015 Concrete (rough or smoothed finish) 0.016 Asphalt 0.05 Fallow (no residue)
0.06 0.17
Cultivated Soils: Residue Cover ≤ 20% Residue cover > 20%
0.15 0.24
Grass: Short-grass prairie Dense grasses2
0.13 Range (natural)
0.40 0.80
Woods:3 Light underbrush Dense underbrush
1 The Manning’s n values are a composite of information compiled by Engman (1986). 2 Includes species such as weeping lovegrass, bluegrass, buffalo grass, blue grama grass,
and native grass mixtures. 3 When selecting n, consider cover to a height of about 0.1 ft. This is the only part of the plant cover that will obstruct sheet flow.
Manning’s “n” Condition
0.016 Concrete (rough or smoothed finish)
0.02 Asphalt
0.1 0-50% vegetated ground cover, remaining bare soil or rock outcrops, minimum brush or tree cover
0.2 50-90% vegetated ground cover, remaining bare soil or rock outcrops, minimum- medium brush or tree cover

0.3 100% vegetated ground cover, medium- dense grasses (lawns, grassy fields etc.) medium brush or tree cover
0.6 100% vegetated ground cover with areas of heavy vegetation (parks, green- belts, riparian areas etc.) dense under- growth with medium to heavy tree growth
Source: City of Austin, Watershed Engineering Division
2.4.3 Rainfall Intensity (i)
Rainfall intensity (i) is the average rainfall rate in inches per hour, and is selected on the basis of design rainfall duration and design frequency of occurrence. The design duration is equal to the time of concentration for the drainage area under consideration. The design frequency of occurrence is a statistical variable which is established by design standards or chosen by the engineer as a design parameter.
The selection of the frequency criteria is necessary before applying any hydrologic method. Storm drainage improvements in Austin must be designed to intercept and carry the runoff from a 25-year frequency storm (4% annual chance event), with an auxiliary or overflow system capable of carrying a 100-year frequency storm (1% annual chance event).
The rainfall intensity used in the rational method can be read from the intensity-duration-frequency (IDF) curves based on the selected design frequency and design duration. The design engineer can also calculate the value of rainfall intensity from the best-fit IDF equation (2-68) to be discussed later in this sub-section with known Tc value for the entire drainage area of interest.
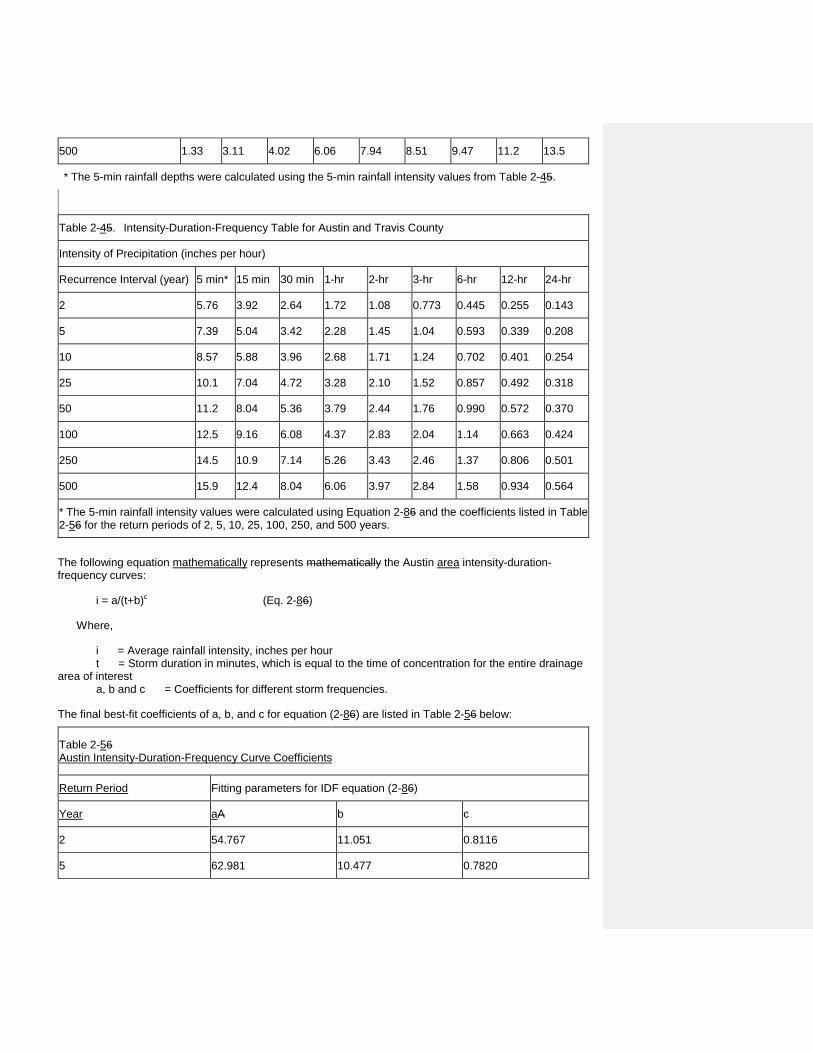
In 1998, William Asquith at the USGS Texas Office analyzed virtually all rainfall data available in the State of Texas using L-moment methodology and published the results in a USGS Water Resources Investigations Report (WRIR 98-4044). In November 2001, Dr. Asquith summarized his rainfall study of 1998 and generated the IDF and the DDF (depth-duration-frequency) values that are suitable for use in the City of Austin and Travis County. These DDF and IDF values are shown in Table 2-34 and Table 2-45.
An explanation of the derivation of the Austin intensity-duration-frequency curves is given in Appendix B.
The Austin intensity-duration-frequency curves are shown in Figure 2-2 in Appendix E D of this manual.
Table 2-34. Depth-Duration-Frequency Table for Austin and Travis County
Depth of Precipitation (in inches)
Recurrence Interval (year) 5 min* 15 min 30 min 1-hr 2-hr 3-hr 6-hr 12-hr 24-hr
2 0.48 0.98 1.32 1.72 2.16 2.32 2.67 3.06 3.44
5 0.62 1.26 1.71 2.28 2.89 3.13 3.56 4.07 4.99
10 0.71 1.47 1.98 2.68 3.42 3.71 4.21 4.81 6.1
25 0.84 1.76 2.36 3.28 4.2 4.55 5.14 5.9 7.64
50 0.94 2.01 2.68 3.79 4.88 5.28 5.94 6.86 8.87
100 1.05 2.29 3.04 4.37 5.66 6.11 6.85 7.96 10.2
250 1.21 2.73 3.57 5.26 6.86 7.38 8.24 9.67 12
500 1.33 3.11 4.02 6.06 7.94 8.51 9.47 11.2 13.5
* The 5-min rainfall depths were calculated using the 5-min rainfall intensity values from Table 2-45.
Table 2-45. Intensity-Duration-Frequency Table for Austin and Travis County
Intensity of Precipitation (inches per hour)
Recurrence Interval (year) 5 min* 15 min 30 min 1-hr 2-hr 3-hr 6-hr 12-hr 24-hr
2 5.76 3.92 2.64 1.72 1.08 0.773 0.445 0.255 0.143
5 7.39 5.04 3.42 2.28 1.45 1.04 0.593 0.339 0.208
10 8.57 5.88 3.96 2.68 1.71 1.24 0.702 0.401 0.254
25 10.1 7.04 4.72 3.28 2.10 1.52 0.857 0.492 0.318
50 11.2 8.04 5.36 3.79 2.44 1.76 0.990 0.572 0.370
100 12.5 9.16 6.08 4.37 2.83 2.04 1.14 0.663 0.424
250 14.5 10.9 7.14 5.26 3.43 2.46 1.37 0.806 0.501
500 15.9 12.4 8.04 6.06 3.97 2.84 1.58 0.934 0.564
* The 5-min rainfall intensity values were calculated using Equation 2-86 and the coefficients listed in Table 2-56 for the return periods of 2, 5, 10, 25, 100, 250, and 500 years.
The following equation mathematically represents mathematically the Austin area intensity-duration- frequency curves:
i = a/(t+b)c (Eq. 2-86)
Where,
i = Average rainfall intensity, inches per hour t = Storm duration in minutes, which is equal to the time of concentration for the entire drainage area of interest a, b and c = Coefficients for different storm frequencies.
The final best-fit coefficients of a, b, and c for equation (2-86) are listed in Table 2-56 below:
Table 2-56 Austin Intensity-Duration-Frequency Curve Coefficients
Return Period Fitting parameters for IDF equation (2-86)
Year aA b c
2 54.767 11.051 0.8116
5 62.981 10.477 0.7820

10 70.820 10.396 0.7725
25 82.936 10.746 0.7634
50 100.60 12.172 0.7712
100 118.30 13.185 0.7736
250 150.10 14.892 0.7822
500 188.00 17.233 0.7959
Source: Asquith, W.H., “Depth-Duration Frequency and Intensity-Duration Frequency for Austin and Travis County, Texas, 2001. Watershed Engineering Division of City of Austin
The a, b and c parameters listed in Table 2-5 were derived using nonlinear regression methods and the data included in Table 2-4. The IDF curves and the IDF equations are applicable for all design frequencies shown. They are required for use in determining peak flows by the Rational Method or other appropriate methods.
2.4.4 Drainage Area (A)
The size (acres) of the watershed needs to be determined for application of the Rational Method. The area may be determined through the use of topographic maps, supplemented by field surveys where topographic data has changed or where the contour interval is too great to distinguish the direction of flow. The drainage divide lines are determined by based on topography, street layout, lot grading, building structure configuration and orientation, drainage system layout and many other features that are created by the urbanization process.
Example 2-1
An urbanized watershed is shown on the following figure. Three types of flow conditions exist between the most distant point in the watershed and the outlet. The calculation of time of concentration and travel time in each reach is as follows:
Reach Description of Flow Slope (%) Length (Ft.)
Drainage Area (Acre)
"n" Value/Surface Type

A to B Sheet flow (grass lawn) 1.8 4.5 50 150 3 0.3
B to C Shallow concentrated flow (gutter) 2.0 840 20 Paved 0.016
C to D Storm drain with inlets (n=0.015; D=3 feet) 1.5 1,200 30 0.015
For reaches A-B and B-C, the travel time can be calculated from Equations 2-32 and 2-53.
Tt(A-B)= 0.0070.24 X 50)0.8/(3.44)0.5s0.4 150(0.3)/42(s)0.5
= 0.028 1.07/(0.0180.045)0.5
= 0.21 5.05 min.
Tt(B-C)= 840/(60(20.3282)(s)0.5) 840(0.016)/60(s)0.5
= 0.69 0.22/(0.02)0.5
=4.87 1.6 min.
The flow velocity in reach C-D needs to be calculated from Manning's Equation, using the assumption of full pipe flow, as follows:
V(C-D) = (1.49/n) R0.67s0.5
= (1.49/n) (D/4)0.67s0.5
= (1.49/0.015) (3/4)0.67 (0.015)0.5
= 10.0 ft/s
The channel flow travel time is calculated by dividing the length by the velocity.
Tt (C-D) = 1200/(60x10.0) = 2.0 min
The total time of concentration is calculated by adding the component sheet, shallow concentrated and channel flow segments.
Tc = 0.21+4.87+2.0 = 7.08 min
The runoff coefficients (C) for the three (3) areas are given as follows for the 100-year storm (1% annual chance event). The channel flow travel time is calculated by dividing the length by the velocity
Area Land Use C Area (acre)
LU1 Grass Area (fair condition, flat) 0.41 3
LU2 Commercial (composite of paved and grassed areas)
0.85 20
LU3 Industrial (composite of paved and grassed areas)
0.81 30
Total 53

Reach Length (ft.) Velocity (fps) Tt (min) C Area (acre)
A-B 300 -- 5.05 0.41 3
B-C 840 -- 1.6 0.85 20
C-D 1200 10.0 2.0 0.81 30
8.65 53
The rainfall intensity (i) of the 100-year storm can be calculated using equation (2-68) together with the coefficients in Table 2-56 for a time of concentration of 7.08 8.65 minutes as 11.54 10.9 inches per hour.
The composite runoff coefficient (C) = (0.41 X 3 + 0.85 X 20 + 0.81 X 30)/53= 0.80
Thus the peak flow Qp = CiA = 0.80 X 11.54 10.9 in/hr X 53 acre = 489 462 cfs
2.5.0 THE SOIL CONSERVATION SERVICE METHOD FOR CALCULATION OF PEAK FLOWS
The Soil Conservation Service hydrologic method is has been widely used by engineers and hydrologists for analyses of small urban watersheds. This method is based on results from extensive analytical work using a wide range of statistical data concerning storm patterns, rainfall-runoff characteristics and many hydrologic observations in the United States.
The SCS method can be applied to urban drainage areas of any size. Major The major parameters required to calculate a runoff the hydrograph with the method include the rainfall distribution, runoff curve numbers, time of concentration and drainage area. For detailed information regarding the SCS method and the TR-20 program, the user is referred to the following NRCS SCS publications. These can be obtained from the Natural Resources Conservation Service at http://www.wcc.nrcs.usda.gov/. They are:
NEH-4: "Hydrology," Section 4, National Engineering Handbook TR-20: Computer Program for Project Formulation, Hydrology TR-55: Urban Hydrology for Small Watersheds TP-149: A Method for Estimating Volume and Rate of Runoff in Small Watersheds
The HEC-1 and HEC-HMS programs can be downloaded from the US Army Corps of Engineers website at http://www.hec.usace.army.mil/. Refer to Section 8.2.3 for information regarding watershed hydrologic models that are maintained by the City. These models may be requested by the public and used as the basis for drainage analysis where applicable. Any results based on models obtained from the City must be certified by a Texas Licensed Professional Engineer.
2.5.1 Austin Twenty-Four (24) Hour Storm Rainfall Distributions
The COA City of Austin has adopted the use of an SCS 24-hour storm duration with a Type type III distribution for use with the SCS method. The DDF and IDF values to be used for the Austin area are shown in Table 2-34 and 2-45 above. For use in spreadsheet calculations, Table 2-67 below provides the Type III distribution ordinates in 5-minute increments as derived from the HEC-HMS program. The ordinates should to be multiplied by the total 24 hour storm precipitation depth depth in 5 minute increments for use in the HEC-1 program. to produce the design rainfall distribution. When using the HEC-HMS model, the computational time interval should be selected based on criteria for the minimum lag time. The maximum computational time interval used in a HEC-HMS model should be 6 minutes.

Table 2-67 Type III Distribution Ordinates In 5-Minute Time Increment
Time Incremental Cumulative Time Incremental Cumulative Time Incremental Cumulative
0:00 0.0000 0.0000 8:05 0.0023 0.1163 16:10 0.0021 0.8903
0:05 0.0008 0.0008 8:10 0.0022 0.1185 16:15 0.0021 0.8924
0:10 0.0009 0.0017 8:15 0.0023 0.1208 16:20 0.0020 0.8944
0:15 0.0008 0.0025 8:20 0.0025 0.1233 16:25 0.0020 0.8964
0:20 0.0008 0.0033 8:25 0.0025 0.1258 16:30 0.0020 0.8984
0:25 0.0009 0.0042 8:30 0.0026 0.1284 16:35 0.0019 0.9003
0:30 0.0008 0.0050 8:35 0.0027 0.1311 16:40 0.0019 0.9022
0:35 0.0008 0.0058 8:40 0.0028 0.1339 16:45 0.0019 0.9041
0:40 0.0009 0.0067 8:45 0.0028 0.1367 16:50 0.0018 0.9059
0:45 0.0008 0.0075 8:50 0.0030 0.1397 16:55 0.0019 0.9078
0:50 0.0008 0.0083 8:55 0.0030 0.1427 17:00 0.0017 0.9095
0:55 0.0009 0.0092 9:00 0.0031 0.1458 17:05 0.0018 0.9113
1:00 0.0008 0.0100 9:05 0.0032 0.1490 17:10 0.0016 0.9129
1:05 0.0008 0.0108 9:10 0.0032 0.1522 17:15 0.0017 0.9146
1:10 0.0009 0.0117 9:15 0.0033 0.1555 17:20 0.0016 0.9162
1:15 0.0008 0.0125 9:20 0.0034 0.1589 17:25 0.0016 0.9178
1:20 0.0008 0.0133 9:25 0.0035 0.1624 17:30 0.0016 0.9194
1:25 0.0009 0.0142 9:30 0.0035 0.1659 17:35 0.0015 0.9209
1:30 0.0008 0.0150 9:35 0.0037 0.1696 17:40 0.0015 0.9224
1:35 0.0008 0.0158 9:40 0.0037 0.1733 17:45 0.0015 0.9239
1:40 0.0009 0.0167 9:45 0.0038 0.1771 17:50 0.0014 0.9253
1:45 0.0008 0.0175 9:50 0.0039 0.1810 17:55 0.0014 0.9267
1:50 0.0008 0.0183 9:55 0.0040 0.1850 18:00 0.0013 0.9280
1:55 0.0009 0.0192 10:00 0.0040 0.1890 18:05 0.0013 0.9293
2:00 0.0008 0.0200 10:05 0.0041 0.1931 18:10 0.0014 0.9307
2:05 0.0008 0.0208 10:10 0.0044 0.1975 18:15 0.0012 0.9319
2:10 0.0009 0.0217 10:15 0.0045 0.2020 18:20 0.0013 0.9332

2:15 0.0008 0.0225 10:20 0.0047 0.2067 18:25 0.0014 0.9346
2:20 0.0009 0.0234 10:25 0.0048 0.2115 18:30 0.0012 0.9358
2:25 0.0009 0.0243 10:30 0.0050 0.2165 18:35 0.0012 0.9370
2:30 0.0009 0.0252 10:35 0.0051 0.2216 18:40 0.0013 0.9383
2:35 0.0009 0.0261 10:40 0.0054 0.2270 18:45 0.0013 0.9396
2:40 0.0009 0.0270 10:45 0.0055 0.2325 18:50 0.0012 0.9408
Time Incremental Cumulative Time Incremental Cumulative Time Incremental Cumulative
2:45 0.0009 0.0279 10:50 0.0057 0.2382 18:55 0.0013 0.9421
2:50 0.0010 0.0289 10:55 0.0058 0.2440 19:00 0.0012 0.9433
2:55 0.0009 0.0298 11:00 0.0060 0.2500 19:05 0.0012 0.9445
3:00 0.0010 0.0308 11:05 0.0064 0.2564 19:10 0.0011 0.9456
3:05 0.0009 0.0317 11:10 0.0070 0.2634 19:15 0.0012 0.9468
3:10 0.0010 0.0327 11:15 0.0077 0.2711 19:20 0.0012 0.9480
3:15 0.0010 0.0337 11:20 0.0084 0.2795 19:25 0.0011 0.9491
3:20 0.0010 0.0347 11:25 0.0089 0.2884 19:30 0.0012 0.9503
3:25 0.0010 0.0357 11:30 0.0096 0.2980 19:35 0.0012 0.9515
3:30 0.0010 0.0367 11:35 0.0131 0.3111 19:40 0.0011 0.9526
3:35 0.0010 0.0377 11:40 0.0187 0.3298 19:45 0.0011 0.9537
3:40 0.0011 0.0388 11:45 0.0261 0.3559 19:50 0.0011 0.9548
3:45 0.0010 0.0398 11:50 0.0289 0.3848 19:55 0.0011 0.9559
3:50 0.0010 0.0408 11:55 0.0425 0.4273 20:00 0.0011 0.9570
3:55 0.0011 0.0419 12:00 0.0727 0.5000 20:05 0.0011 0.9581
4:00 0.0011 0.0430 12:05 0.0727 0.5727 20:10 0.0011 0.9592
4:05 0.0011 0.0441 12:10 0.0425 0.6152 20:15 0.0011 0.9603
4:10 0.0011 0.0452 12:15 0.0289 0.6441 20:20 0.0010 0.9613
4:15 0.0011 0.0463 12:20 0.0261 0.6702 20:25 0.0010 0.9623
4:20 0.0011 0.0474 12:25 0.0187 0.6889 20:30 0.0011 0.9634
4:25 0.0011 0.0485 12:30 0.0131 0.7020 20:35 0.0010 0.9644
4:30 0.0012 0.0497 12:35 0.0096 0.7116 20:40 0.0010 0.9654
Comment [PK1]: Please include as header for each page containing this chart

4:35 0.0012 0.0509 12:40 0.0089 0.7205 20:45 0.0010 0.9664
4:40 0.0011 0.0520 12:45 0.0084 0.7289 20:50 0.0010 0.9674
4:45 0.0012 0.0532 12:50 0.0077 0.7366 20:55 0.0010 0.9684
4:50 0.0012 0.0544 12:55 0.0070 0.7436 21:00 0.0010 0.9694
4:55 0.0011 0.0555 13:00 0.0064 0.7500 21:05 0.0010 0.9704
5:00 0.0012 0.0567 13:05 0.0060 0.7560 21:10 0.0010 0.9714
5:05 0.0012 0.0579 13:10 0.0058 0.7618 21:15 0.0009 0.9723
5:10 0.0013 0.0592 13:15 0.0057 0.7675 21:20 0.0010 0.9733
5:15 0.0012 0.0604 13:20 0.0055 0.7730 21:25 0.0010 0.9743
5:20 0.0013 0.0617 13:25 0.0054 0.7784 21:30 0.0009 0.9752
5:25 0.0013 0.0630 13:30 0.0051 0.7835 21:35 0.0010 0.9762
5:30 0.0012 0.0642 13:35 0.0050 0.7885 21:40 0.0009 0.9771
5:35 0.0012 0.0654 13:40 0.0048 0.7933 21:45 0.0009 0.9780
5:40 0.0014 0.0668 13:45 0.0047 0.7980 21:50 0.0010 0.9790
5:45 0.0012 0.0680 13:50 0.0045 0.8025 21:55 0.0009 0.9799
5:50 0.0013 0.0693 13:55 0.0044 0.8069 22:00 0.0009 0.9808
5:55 0.0014 0.0707 14:00 0.0041 0.8110 22:05 0.0008 0.9816
6:00 0.0013 0.0720 14:05 0.0040 0.8150 22:10 0.0009 0.9825
6:05 0.0013 0.0733 14:10 0.0040 0.8190 22:15 0.0009 0.9834
6:10 0.0014 0.0747 14:15 0.0039 0.8229 22:20 0.0009 0.9843
6:15 0.0014 0.0761 14:20 0.0038 0.8267 22:25 0.0009 0.9852
6:20 0.0015 0.0776 14:25 0.0037 0.8304 22:30 0.0008 0.9860
6:25 0.0015 0.0791 14:30 0.0037 0.8341 22:35 0.0008 0.9868
Time Incremental Cumulative Time Incremental Cumulative Time Incremental Cumulative
6:30 0.0015 0.0806 14:35 0.0035 0.8376 22:40 0.0009 0.9877
6:35 0.0016 0.0822 14:40 0.0035 0.8411 22:45 0.0008 0.9885
6:40 0.0016 0.0838 14:45 0.0034 0.8445 22:50 0.0008 0.9893
6:45 0.0016 0.0854 14:50 0.0033 0.8478 22:55 0.0009 0.9902
6:50 0.0017 0.0871 14:55 0.0033 0.8511 23:00 0.0007 0.9909
Comment [PK2]: Please include as header for each page containing this chart

6:55 0.0016 0.0887 15:00 0.0032 0.8543 23:05 0.0008 0.9917
7:00 0.0018 0.0905 15:05 0.0030 0.8573 23:10 0.0008 0.9925
7:05 0.0017 0.0922 15:10 0.0030 0.8603 23:15 0.0008 0.9933
7:10 0.0019 0.0941 15:15 0.0030 0.8633 23:20 0.0008 0.9941
7:15 0.0018 0.0959 15:20 0.0028 0.8661 23:25 0.0007 0.9948
7:20 0.0019 0.0978 15:25 0.0028 0.8689 23:30 0.0008 0.9956
7:25 0.0019 0.0997 15:30 0.0027 0.8716 23:35 0.0008 0.9964
7:30 0.0019 0.1016 15:35 0.0026 0.8742 23:40 0.0007 0.9971
7:35 0.0020 0.1036 15:40 0.0025 0.8767 23:45 0.0008 0.9979
7:40 0.0020 0.1056 15:45 0.0025 0.8792 23:50 0.0007 0.9986
7:45 0.0020 0.1076 15:50 0.0023 0.8815 23:55 0.0006 0.9992
7:50 0.0021 0.1097 15:55 0.0022 0.8837 24:00 0.0008 1.0000
7:55 0.0021 0.1118 16:00 0.0023 0.8860
8:00 0.0022 0.1140 16:05 0.0022 0.8882
2.5.2 Soil National Resources Conservation Service Runoff Curve Numbers
The Soil National Resources Conservation Service has developed an index, the runoff curve number, to represent the combined hydrologic effect of soil type, land use, agricultural land treatment class, hydrologic condition, and antecedent soil moisture. These watershed factors have the most significant impact in estimating the volume of runoff, and can be assessed from soil surveys, site investigations and land use maps.
The curve number is an indication of the potential runoff producing potential of the drainage area for a given antecedent soil moisture condition, and it ranges in value from zero to 100. The Soil National Resources Conservation Service runoff curve numbers are grouped into three (3) antecedent soil moisture conditions -- Antecedent Runoff Moisture Condition (ARC) I, ARC Antecedent Moisture Condition Il and ARC Antecedent Moisture Condition III. Values of runoff curve numbers for all three (3) conditions may be computed following guidelines in Part 630, Chapter 10 of the National Engineering Handbook. ARC Antecedent Moisture Condition I is the dry soil condition and ARC Antecedent Moisture Condition III is the wet soil condition. ARC Antecedent Moisture Condition II is normally considered to be the average condition. The Antecedent Runoff Condition (ARC) was previously referred to as the Antecedent Moisture Condition (AMC) in older NRCS publications.
However, studies of hydrologic data indicate that ARC Antecedent Moisture Condition II is not necessarily representative of the average condition throughout Texas. Instead, investigations have shown that the average condition ranges from ARC Antecedent Moisture Condition I in west Texas to between ARC Antecedent Moisture Condition II and ARC Antecedent Moisture Condition III in east Texas. The NRCS curve number values provided given in Table 2-711 are for an ARC Antecedent Moisture Condition II. If it is desired to change to an ARC Antecedent Moisture Condition I or Ill condition, the adjustments given in or Part 630, Chapter 10 of the National Engineering Handbook should be used. Justification must be provided for the selection of an ARC other than condition II.
(Note that the Antecedent Moisture Condition is also referred to as the Antecedent Runoff Condition).
The Soil National Resources Conservation Service has classified more than 4,000 soils into four (4) hydrologic groups, identified by the letters A, B, C, and D, to represent watershed characteristics.
Group A: (Low runoff potential). Soils having a high infiltration rate even when thoroughly wetted and consisting chiefly of deep, well-drained to excessively drained sands or gravels.
Group B: Soils having a moderate infiltration rate when thoroughly wetted and consisting chiefly of moderately deep to deep, moderately well to well-drained soils with moderately fine to moderately coarse texture.
Group C: Soils having a slow infiltration rate when thoroughly wetted and consisting chiefly of soils with a layer that impedes downward movement of water or soil with moderately fine to fine texture.
Group D: (High runoff potential). Soils having a very slow infiltration rate when thoroughly wetted and consisting chiefly of clay soils with a high swelling potential, soils with a permanent high water table, soils with a claypan or clay layer at or near the surface and shallow soils over nearly impervious material.
The list of most soils in the United States along with their hydrologic soil classification is given in the TR-55 publication. The minimum infiltration rates for the four (4) soil groups are:
Group Minimum Infiltration Rate (in/hr)
A 0.30 - 0.45
B 0.15 - 0.30
C 0.05 - 0.15
D 0.00 - 0.05
Table 2-87 lists the curve numbers for the four (4) soil groups under various land uses, land treatment and hydrologic conditions. Curve numbers for fully developed conditions should be based on maximum allowable impervious cover listed in Austin zoning and watershed ordinances. When calculating fully developed peak runoff rates it is recommended that the undeveloped curve number and the maximum allowable impervious cover be used as input parameters. In order to determine the soil classifications in the Austin area, the Soil Natural Resource Conservation Service Soil Surveys of Travis, Williamson or Hays County, Texas should be used. Digital versions of these soil datasets are available online at http://soildatamart.nrcs.usda.gov (accessed 12/18/2012).
Table 2-78 SCS NRCS Runoff Curve Numbers for Urban Areas and Agricultural Lands (assuming ARC-II condition)
Cover Description Curve Numbers for
Hydrologic Soil Group
Cover type and Hydrologic Condition
Average % Impervious Area1
A
B
C
D
Fully developed urban areas (vegetation established)
Open space (lawns, parks, golf courses, cemeteries, etc.) Poor condition (grass cover 50%) Fair condition (grass cover 50% to 75%)
68 49 39
79 69 61
86 79 74
89 84 80
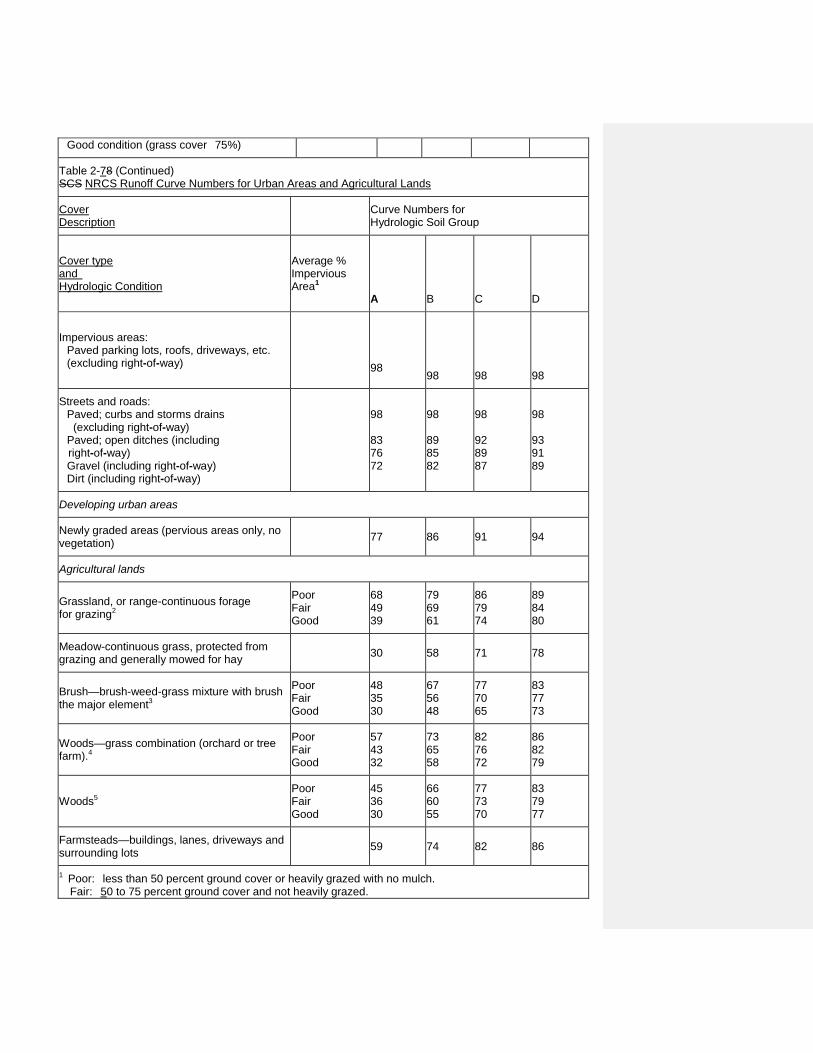
Good condition (grass cover 75%)
Table 2-78 (Continued) SCS NRCS Runoff Curve Numbers for Urban Areas and Agricultural Lands
Cover Description Curve Numbers for
Hydrologic Soil Group
Cover type and Hydrologic Condition
Average % Impervious Area1
A
B
C
D
Impervious areas: Paved parking lots, roofs, driveways, etc. (excluding right-of-way)
98
98
98
98
Streets and roads: Paved; curbs and storms drains (excluding right-of-way) Paved; open ditches (including right-of-way) Gravel (including right-of-way) Dirt (including right-of-way)
98 83 76 72
98 89 85 82
98 92 89 87
98 93 91 89
Developing urban areas
Newly graded areas (pervious areas only, no vegetation) 77 86 91 94
Agricultural lands
Grassland, or range-continuous forage for grazing2
Poor Fair Good
68 49 39
79 69 61
86 79 74
89 84 80
Meadow-continuous grass, protected from grazing and generally mowed for hay 30 58 71 78
Brush—brush-weed-grass mixture with brush the major element3
Poor Fair Good
48 35 30
67 56 48
77 70 65
83 77 73
Woods—grass combination (orchard or tree farm).4
Poor Fair Good
57 43 32
73 65 58
82 76 72
86 82 79
Woods5 Poor Fair Good
45 36 30
66 60 55
77 73 70
83 79 77
Farmsteads—buildings, lanes, driveways and surrounding lots 59 74 82 86
1 Poor: less than 50 percent ground cover or heavily grazed with no mulch. Fair: 50 to 75 percent ground cover and not heavily grazed.

Good: greater than 75 percent ground cover and lightly or only occasionally grazed.
2 Poor: less than 50 percent ground cover. Fair: 50 to 75 percent ground cover. Good: greater than 75 percent ground cover.
3 Curve numbers shown were computed for areas with 50 percent woods and 50 percent grass (pasture) cover. Other combinations of conditions may be computed from the curve numbers for woods and pasture.
4 Poor: Forest litter, small trees and brush are destroyed by heavy grazing or regular burning. Fair: Woods are grazed but not burned, and some forest litter covers the soil. Good: Woods are protected from grazing, and litter and brush adequately cover the soil.
Source: Soil National Resources Conservation Service. TR-55: Urban Hydrology for Small Watersheds
2.5.3 Time of Concentration
The procedures for estimating time of concentration for the SCS NRCS method are described in the SCS's Technical Release 55 (TR-55) and in Section 2.4.2 of this manual. Three (3) types of flow (sheet flow, shallow concentrated flow and channel flow) are considered. Note that Table 2-2 shall be used for determination of sheet flow Manning’s roughness coefficients rather than the table included in TR-55.
In hydrograph analysis, the time of concentration can be defined as is the time from the end of excess rainfall to the point of inflection on the falling limb of the hydrograph. The time of concentration determines the shape of the runoff hydrograph. Times of concentration are required for the existing and developed conditions to adequately model the impact of the development on stormwater runoff. The methodology presented in TR-55 provides a reasonable approach for the estimation of time of concentration. The lag time, defined as the time between the center of mass of excess rainfall to the runoff peak, is typically used in the HEC-HMS implementation of the SCS methodology. The lag time can be estimated with equation 2-9.
Tlag = 0.6 Tc (Eq. 2-9)
In general, times of concentration for the developed condition should be calculated based on conservative assumptions that consider concerning the increased hydraulic efficiency expected with an ultimate developed condition. Times of concentration should be representative of the overall drainage area, not simply based on the longest (in either distance or time) flow path. For instance, while sheet Sheet flow for both existing and proposed conditions is typically limited to 300 feet, sheet flow for developed conditions should be limited to 100 150 feet. This length These lengths should be considered are considered a to be maximums; sheet flow lengths should be measured and justified for all conditions. Additionally, the minimum slope used for calculation of sheet and shall flow travel time components should be 0.005 feet per foot (0.5%).
2.6.0 PROBABLE MAXIMUM STORM/FLOOD DEVELOPMENT
The purpose of this section is to describe a method for developing the Probable Maximum Flood (PMF) within the City of Austin jurisdiction. The PMF is calculated by obtaining the Probable Maximum Precipitation (PMP) for a specific storm duration and drainage area. The PMP rainfall depths presented in this section were derived for the Austin area and are only applicable for designing and managing dams within City of Austin's full purpose, limited purpose and extraterritorial jurisdictions. Typically, a PMF runoff model requires both a temporal and spatial distribution of the PMP. However, if the drainage area is less than 10 square miles, the spatial distribution is not required (i.e. the drainage area is considered small enough that the PMP values can reasonably be considered point rainfall values). The PMP values shown in this section are valid only for drainage areas less than 10 square miles.

2.6.1 Probable Maximum Precipitation (PMP)
The PMP values were derived using Hydrometeorological Report No. 52 (HMR-52) and Hydrometeorological Report No. 51 (HMR-51) per the guidance provided in the Hydrologic and Hydraulic Guidelines for Dams in Texas (January 2007) available from the Dam Safety Program at the Texas Commission on Environmental Quality (TCEQ). Table 2-9 8 contains a summary of PMP depths and intensities for various storm durations for drainage areas less than 10 square miles.
Table 2-98 Probable Maximum Precipitation Depths for the City of Austin
Storm Duration Depth (in)
1 hr 17.4
2 hr 21.6
3 hr 24.9
6 hr 31.1
12 hr 37.6
24 hr 44.7
48 hr 50.0
72 hr 53.4
1. All values are valid for drainage areas less than 10 square miles.
2. Do not use these depths with the Soil Conservation Service (SCS) Type III distribution. The relevant storm distributions are provided in DCM Section 2.6.2 “Probable Maximum Flood (PMF)” and were derived using the Hydrologic and Hydraulic Guidelines for Dams in Texas.
2.6.2 Probable Maximum Flood (PMF)
To determine the PMF, each of the possible storm durations (1, 2, 3, 6, 12, 24, 48, and 72 hour storms) needs to be analyzed in order to determine the critical duration. The critical duration is the storm duration that produces the highest water surface elevation behind the dam. The PMF for each storm duration is derived using the PMP depths from Table 2-9 8 and using a rainfall-runoff model (i.e.HEC-1, HEC-HMS, TR-20). The rainfall-runoff model should use the temporal distribution as provided in the Hydrologic and Hydraulic Guidelines for Dams in Texas. The temporal distribution for each storm duration has been reproduced in Figure 2-4, Appendix E D. Figure 2-4 provides the temporal distribution ordinates to be multiplied by the associated storm depths for use in the various rainfall-runoff models. The runoff parameters used in the PMF model are the same as those used for runoff analyses of the more frequent storm events, with the exception of curve numbers and the temporal distribution of rainfall.
Runoff curve numbers for the PMF need to reflect the assumption that the soils will be saturated. Therefore the runoff curve number should be based on ARC Antecedent Moisture Condition III (AMC). Runoff curve numbers are discussed in the Drainage Criteria Manual (DCM), Section 2.5.2 “Soil Conservation Runoff Curve Numbers”. The appropriate curve number should be chosen using the tables provided in the DCM Section 2.5.2. These values are ARC AMC II values which and can be converted to ARC AMC III values using Table 10.1 in Part 630, Chapter 10 of the National Engineering Handbook. Note that the ARC was previously The Antecedent Moisture Condition (AMC) is referred to as the Natural Resource Conservation Service Antecedent Moisture Runoff Condition (AMC ARC) in the Hydrologic and Hydraulic Guidelines for

Dams in Texas. older NRCS publications. Disclaimer: This Code of Ordinances and/or any other documents that appear on this site may not reflect the most current legislation adopted by the Municipality. American Legal Publishing Corporation provides these documents for informational purposes only. These documents should not be relied upon as the definitive authority for local legislation. Additionally, the formatting and pagination of the posted documents varies from the formatting and pagination of the official copy. The official printed copy of a Code of Ordinances should be consulted prior to any action being taken. For further information regarding the official version of any of this Code of Ordinances or other documents posted on this site, please contact the Municipality directly or contact American Legal Publishing toll-free at 800-445-5588.
© 2013 American Legal Publishing Corporation [email protected]
1.800.445.5588.