secret of successful traders
DESCRIPTION
A guide for stock market.TRANSCRIPT

science for traders
Courtesy of
Second Edition
Experts RevealWinning Stock Strategies
This book was sent to you,
courtesy of MetaStock software
MetaStock is the leader in charting and analysis software. With MetaStock on your side,
you’ll have the most advanced charting, testing and exploration tools available today.
Tools that can help you more accurately forecast when it’s time to get in… or get out.
This book is not a recommendation to buy or sell, but rather contains guidelines to interpreting various analysis methods. This information should only be used by investors who are aware of the risks inherent in securities trading. Thomson Reuters, Robert Deel, Price Headley, Martha Stokes, Shawn Lucas, Steve Nison, Barbara Star, Daryl Guppy, and John Bollinger accept no liability whatsoever for any loss arising from such use of this book or its contents.
©2010 Thomson ReutersMetaStock is a registered trademark of Thomson Reuters. All other names are trademarks of their respective owners.
For more information on MetaStock products, please call 1-800-466-6056or visit www.metastock.com
2
Contents
Introduction: Secrets of Successful Traders . . . . . . . . 3
It’s Your Money, Take Control! . . . . . . . . . . . . . . . . . 4BY RoBeRT DeeL
How to Manage the Highs and Lows in Trading . . . 9BY PRICe HeADLeY
Anatomy of a Stock Chart . . . . . . . . . . . . . . . . . . . . . 14BY MARTHA STokeS, CMT
Using Candle Charts to Spot the early . . . . . . . . . . . 19 Turning Signals – The BasicsBY STeve NISoN, CMT
Catch that Trend! Directional Strength . . . . . . . . . . . 26 and How to Find ItBY BARBARA STAR, PH.D.
Recognize Shifts in volatility. . . . . . . . . . . . . . . . . . . 30BY SHAWN LUCAS
Understanding the Crowd . . . . . . . . . . . . . . . . . . . . . 35BY DARYL GUPP Y
Bollinger Band Basics . . . . . . . . . . . . . . . . . . . . . . . . 39BY JoHN BoLLINGeR
3
Introduction Secrets of Successful Traders
Here it is! Some of the most valuable trading insights for winning in today’s tough markets are waiting to be discovered in this book. This is your opportunity to learn from the Pros. So get ready to collect the latest
strategies and tips on critical topics facing traders today.
First, Robert Deel gives you his “16 Rules of Investology.” Compiled from his 20 years of experience, this checklist will keep you from making many of the common mistakes traders make.
You’ll learn how to better manage the difficult highs and lows in trading from Price Headley. He shows you how psychological factors, such as perfectionism, fear, and lack of confidence can cause disastrous results in your trading, and how you can overcome them.
Martha Stokes takes an essential look at just what the modern stock chart is and how it can be used as a very powerful tool in Anatomy of a Stock Chart.
Steven Nison shows you how candle charts can help you spot early turning signals and enhance your trading power. You’ll learn how this powerful tool can give you a jump on the competition, preserve capital, and “open new and unique doors of analysis.”
Barbara Star discusses two powerful indicators that help you detect, not only trend direction, but strength as well. Learn how to use them to avoid trading pitfalls by signaling changes in price movement.
Shawn Lucas shows us how to recognize shifts in volatility in the market
Daryl Guppy takes on some tough trading questions, such as, what signifies a rally...or a trend? He shows you how his Guppy Multiple Moving Average can help make these initial decisions.
As Robert Deel mentions in his article, professional traders have made millions in the last three years because they have learned how to make money when the market’s going down, as well as up.
Last, but certainly not least, John Bollinger, creator of Bollinger Bands, discusses 15 basic rules for using these popular bands. Learn how they can significantly boost your trading potential.
Now it’s time to discover those secrets of success. enjoy this book, and “Happy Trading.”
3
4
Robert Deel
It’s your money, take control!B Y R o B e R T D e e L
Taking control in the management of your money in today’s world is perhaps one of the most important financial imperatives facing us all. This checklist should serve you well, and possibly keep you from becoming a
victim of the market and false media information. In my twenty-five plus years of trading experience I have found these rules to be an invaluable way of keeping me focused on the trade.
Deel’s 16 Rules of Investology
1. TRADe WITH A PLANSet objectives before you ever buy. Define all outcomes — not only what you will do when it goes right, but what you will do if you are wrong. Determine the amount of capital you are willing to lose and conversely, define when you will take profits. Letting the market take away your profits by holding on to a losing trade is not a good strategy. Write out a trading plan on paper and follow it. Do not become a causality of emotionally involved buying or selling. Trade with a plan.
2. SCReeN YoUR TRADeSTo select trading vehicles you must have a predefined method. Select a method based on price momentum and trend. Don’t guess what the future is going to be, trade the current trend direction. Your method must consider your individual time frame and risk tolerance. Always address liquidity, sector rotation, and technical factors when screening stocks.
3. ALWAYS Look AT A CHARTNever buy a stock without looking at a chart of the stock first. Look at the one-year trading range. Ascertain where you currently are in the trend and what that trend is. Also determine if the chart ref lects a stock split. Never trade against the trend. Buying and selling decisions are technical in nature. Fundamentals will never tell when to buy or sell a stock. Always look at a chart for entry and exit timing decisions.
5
It’s your money, take control!
4. STAY WITH A TReNDYour probabilities of success are far greater if you stay with a definable market trend. Statistically, these trends provide better profit potential with a lower amount of risk. A good rule of thumb is to watch a 50-day exponential moving average of the close. This moving average represents the intermediate trend of a stock. A 12-day exponential moving average represents short-term trend. The use of these two moving averages should yield excellent results in keeping you in the trend. If you perceive the trend beginning to change, act accordingly by taking profits or placing stops to protect your capital and locking in a profit.
5. USe MoNeY MANAGeMeNT TeCHNIqUeSDetermine the probable dollar losses of your trading plan or investment style based on your trading record for the current year. Then devise a way to generate income through passive sources:
• Cutting a loss quickly is the best money management you can have. Too many times traders fall in love with stock, holding on as the stock begins to decline. Never use a hedging strategy, such as options, to justify holding on to a losing position.
• The use of money market, bond, and stock dividend income to offset losses in your trading portfolio is an excellent technique.
• Covered call options may be an appropriate way to generate income for your portfolio to offset losses. Be careful here because you can write covered calls into oblivion. If the stock is going against you, sell it.
• If you are going to hold a trade overnight, never risk more than 3% of your available capital. If you are going to day trade, an excellent rule of thumb is to only risk 1% of your capital in any one trade.
6. BUY AND SeLL oN CoNFIDeNCeMany times you won’t feel quite right about a buy or sell decision. If this feeling persists after you have done all your research and you have followed the rules to this point, don’t take the trade. Too many times individuals try to rationalize a decision. Don’t try to find a good reason for making a bad decision. Your decision must be a confident one.
7. BUY oNLY LIqUID SToCkS AND LIqUID MARkeTSStay with major markets and stocks with millions of shares in the f loat. Make sure the average trading volume is enough for you to sell all of your position on any given day. By following this rule you should be assured of a reasonably good execution of your trade. Don’t buy stocks trading at the lower end of the price range. Generally speaking, do not buy stocks that don’t have good trend characteristics or predictability. True professional traders avoid them and so should you.
6
Robert Deel
8. DoN’T BUY oR SeLL oN HoT TIPSMore money has been lost on hot tips than is in the U.S. Treasury. While this is an exaggeration, it does make the point clear. If someone tells you about an investment or trade, research the recommendation before you put your money into it. Most novice investors and traders fall victim to tips every day. Please don’t fall for the story no matter how good it sounds. Always use technical analysis to make your buy and sell decisions, and buy or sell based on facts.
9. Do NoT DoLLAR CoST AveRAGeIf your timing decision was wrong on an aggressive stock, don’t make the problem worse by trying to buy a stock that is going lower. The probability is that you will only compound the loss. I call this technique disaster cost averaging. Don’t buy a stock until the trend is evident. Dollar cost averaging is good for your broker, but if you continue this technique, the ‘broker’ you will become.
10. No oNe WINS 100 % oF THe TIMeMany people enter the stock market focused only on the profits and do not consider the losses. If you think for one minute you are going to win one hundred percent of the time, you are wrong. Losing is just part of the cost of doing business. Your goal is to make sure you control the risk and not blindly put your money at risk, like a buy and hold investor. You must come to the realization that you will never learn how to win until you first learn how to lose. How you handle loss psychologically is truly the difference between an amateur and a professional. Professional traders don’t react the same way as an amateur to loss. When a professional trader loses, he or she simply says next. They don’t take the loss personally.
11. ALWAYS USe SToPSThe proper use of stops will protect profits and limit your losses. Look at stops as profit and loss insurance. When you enter a trade, you place a stop to limit the loss in case the trade goes against you. When the trade becomes profitable, you use them to lock in a profit.
Anyone who would argue against risk control by discouraging the use of stops is a fool indeed. In effect they are saying you should put your capital at unlimited risk. Does this make any sense to you? of course not, but that is exactly what a buy and hold investor does all the time. Most investors do not use stops because they are afraid of being stopped out. This is a psychological problem of not wanting to be wrong, or having to admit to yourself you lost on a trade. It certainly isn’t based on logic or strategy. Remember, always use stops if you are carrying a trade over night.
7
It’s your money, take control!
12. I DoN’T HAve TIMeMake the time or suffer the consequences. If you are too busy to manage your money, maybe you’re too busy. Take a look at your portfolio and if you lost half of your money without knowing it, you can congratulate yourself on being too busy. Was it worth it? Probably not. It doesn’t make much sense to work yourself to death and have nothing to show for it. You must take time to educate yourself and take control of your future.
13. Be PATIeNT AND LeT TIMe Be YoUR FRIeNDMaking money safely takes time. The only time to hurry is when you’re in trouble. Remember, “everyday is not a trading day.” only trade when the sector, market, and the correlating stocks are in trend. Just because you want to trade doesn’t mean you should. only trade when the probabilities are in your favor, and let the market come to you.
The market is going to do what it is going to do and what you want is irrelevant. Don’t become addicted to the action. You are not an action junky. You are a high probability trader. Profits are made the old fashioned way, one trade at a time. Be patient and make time your friend instead of your enemy.
14. LeARN FRoM YoUR MISTAkeSThe most successful traders and aggressive investors learn from their mistakes. Many even go as far as writing down what went wrong and analyzing the problem. Mistakes can be costly, so use them as learning experiences and don’t make the same mistake twice.
Unfortunately a large number of people are doomed to make the same mistakes over and over again. This behavior is usually a sign of emotional reactions to price momentum and the absence of any well thought out strategy. My father once told me that the best education was to learn from the mistakes of others. Most people fail in the market not because of technology or a lack of information, but because of emotional reactions, and never learning from their mistakes and the mistakes of others.
15. kNoW HoW To SHoRT SToCkMarkets do not go up all the time, a painful lesson some have learned over the last three years. From the year 2000 to the present time, we have experienced one of the most agonizing bear markets in the last 70 years. Does this bear market mean that you can’t make money? No. What has the trend been for most of the last three years? The obvious answer is down.
Common sense says you are to follow the trend. So if the trend has been down, why haven’t you been shorting stocks? The reason is sadly fear and ignorance. only 2 % of the American public ever shorts a stock in their lifetime. This is shocking when you understand that markets and stocks fall 67% to 80% faster than they rise.
8
Robert Deel
In other words shorting stocks tends to compound money faster than buying a stock to go long. Plus, if you can make money when the market is going down and when it goes up, what is it that you have to be afraid of? Professional traders have made millions the last three years. You must learn to short stocks if you are to have any chance of being successful in today’s markets. Fear and ignorance must be overcome because you must know how to short.
16. FoLLoW THe RULeSSome people are doomed to make the same mistakes over and over again. Using this set of 16 trading rules, which has been compiled from over 20 years of experience, should keep you from making many common mistakes.
If you follow Deel’s Rules of Investology, you have a much better chance of success than someone who doesn’t. Always remember, there is never any guarantee of success. But if you are properly educated and develop the correct mind set, you have a major advantage. Don’t become one of the sheep led to the slaughter by media nonsense. You must make your own fortune and control your financial destiny.
Always remember, it’s your money. Take control… and follow the rules.
Robert Deel is an internationally recognized trading expert, and has trained groups of traders throughout the U.S., europe, Asia, and Canada. He is the author of Trading the Plan and The Strategic Electronic Day Trader. He is also the President and Ceo of Tradingschool.com, a school that trains individual and professional traders from all over the world.
9
How to Manage the Highs and Lows in Trading
BY PRICe HeADLeY
In order to manage your emotions effectively when trading, you need to create a written plan that you can review regularly to stay focused on your goal of trading success. By writing down your plan, you put yourself in the top 3% of
individuals who have written goals and plans, giving you an immediate edge on most traders. Make sure you have answered these questions, which are covered in further depth in my book, Big Trends in Trading:1) How will you enter trades? The key to good entries is putting on trades where
there is relatively low risk compared to much higher reward. You should also write down a clear catalyst for the expected stock move.
2) How will you exit trades? You should define an initial stop point for your trade, at the point where the trend is invalidated. You will also need a ‘trailing stop’ technique to protect your profits.
3) What type of orders will you use to enter and exit? When entering, I like to use limit orders, good for the day only, while exits are often market orders. Why? Because limit orders allow me to define my risk and reward clearly on the entry of a trade, while when I need to get out, market orders allow immediate exit compared to the risk of missing my exit with a limit order.
4) How much capital will you need to trade successfully? There are economies of scale as you increase the amount of capital you trade with. Costs related to commissions, quote systems and equipment begin to diminish as the percentage of capital invested goes up.
5) What percentage of your capital will you invest in each trade? The amount of capital I typically use is 10% per trade in my own accounts. I know traders who commit anywhere from 5% of their account per trade, to 20% of their account per trade. Your goal should be to keep portfolio risk per trade at less than 2% per trade. For example, if you invest 20% of your portfolio in a trade, a 10% loss on that position would lead to a 2% loss on your portfolio.
6) How many positions will you focus on at once? I like to concentrate my portfolio on my best ideas, plus I like to stay focused on how each stock is acting. If my portfolio is too big (I’d say more than seven stocks is too many to focus on), then I will lose focus and invariably miss an exit on a trade that I should have previously exited.
10
Price Headley
7) What will your Trading Journal look like? In my Trading Journal, I note daily observations, particularly related to my ability to execute my trading plan. I also commit to doing a post-trade analysis every month. I note what I did right and wrong, and seek to learn from mistakes to minimize future errors in similar circumstances, while also looking for winning patterns where I seek to repeat big successes.
8) What is your Position Review process? I suggest you have an end-of-day routine to close your day. Review your trades, and assess if you followed your plan. keep a log of all your trades, and make comments on each position.
9) What is your Preparation process before trading? You need defined time to prepare for the next trading day and build up your trading confidence. I prepare after the close for the next day’s trading, which allows me to formulate a plan of action BeFoRe I get into the heat of battle. This keeps my trading proactive instead of reactive.
10) What broker will you use? Most traders mistakenly think that com missions are the number one factor they can control. In reality, commissions are a small cost compared to the broker’s effectiveness at executing your trade. Your focus should be finding a broker who gets you speedy and fair execution of your orders.
once you have defined these facets of your trading plan, you are in an excellent position to have a strategy to control your emotions when trading. Make sure to review your plan on a regular basis to create effective trading habits.
Psychological Issue #1 in Trading: PerfectionismWhy do we let losses ride and cut profits short? Perfectionism tends to keep
traders from taking their losses quickly, as they are too concerned about looking good to others and not wanting to admit they are wrong. This leads to the dreaded hope for a return to ‘break even’, to get out without a loss. But does the market care about where you bought the stock? No! The market is going to go wherever it wants to go, and your job is to see that trend, recognize when you are not in tune with it, and get out of such trades.
We all have this tremendous desire to prove ourselves right. But in the markets, we should concern ourselves more with making money than the amount of times we are proved right. This means winning ideas need to be ridden longer than average, while losers need to be cut short quickly. our school training says there is one right answer, but in the markets there are many ways to win.
Perfectionism cannot only keep you hanging on to losers too long, it can also keep you out of the best performing stocks. on stocks that rally sharply, I sometimes have to fight the feeling that I’ve already missed out on the move. In retrospect, many of these stocks go on to much bigger gains than the initial gain I missed. Traders tend to desire a perfect entry, and this leaves them on the sidelines during major trends. It is these huge trending trades that have carried my portfolio historically, so I have to make sure I am participating in these big moves.
Ironically, perfectionism does not lead to higher performance or greater happiness. Perfectionism can destroy your enjoyment of trading. Focusing on f laws
11
How to Manage the Highs and Lows in Trading
and mistakes depletes energy. This may escalate to panic-like states prior to making the trade, impairing objective performance. At some point perfectionist standards get set too high, and life is measured in units of accomplishment. The drive to be perfect becomes self-defeating, as the individual often places the intense pressure on himself, which can become crippling.
Perfectionists share a belief that perfection is required to be accepted by others. The reality is that acceptance cannot be gained through performance or other external factors like money or social approval. Instead, self-acceptance is at the root of happiness. Ultimately you must be the one who must live with yourself. If others think you’re perfect, but you yourself are never happy, then perfectionism is not helping you to grow and develop to your fullest potential.
one way to be less of a perfectionist is to set one goal and make it process oriented, instead of being focused on the outcome. If you achieve the goal to improve your trading via that goal, you win no matter the outcome. Perfectionists often seek to control uncontrollable factors in a trade. For example, waiting for all the risk to be out and everything to look perfect (the quality of the fill on the exit especially), hoping or ‘willing’ a better outcome by doubling down on a loser, etc.
When a trader focuses on these “uncontrollables”, he is more likely to tighten up and resist pulling the trigger and exiting a losing trade, or he’ll miss out on a new winner that has moved ‘too far.’ By focusing on a process that you can control (such as to focus on only five stocks at a time, or work on implementing your entries and exits consistently with a small amount of money to improve your ability to execute trades, or another process-oriented goal), you build confidence in your ability to execute your trading plan.
Based on these perfectionist tendencies, I recommend the following entry strategy for perfectionists. enter half a position as soon as you see an opportunity that generates at least three times the reward for the risk at the current market price. Then place the remaining half at your desired ‘perfect’ entry price. For exits, always place market orders, as the tendency for the perfectionist is to try to get a better exit price with a limit, which often results in missing the exit on the way down.
Psychological Issue #2 in Trading: Fearone of my subscribers, vince, recently wrote to me: “Your commentary is truly
excellent. And your ‘batting average’ has been exceptional during this most awful market that I have ever seen. Do you have any general advice that you would be willing to offer on a very serious problem that I – and perhaps many others – am experiencing in recent weeks? The length of this bear market – and the substantial financial damage that it’s inflicted on me at my age (51), has seriously damaged my investment psychology.
Consequently, while I read and believe your judgment calls, I haven’t been able to get myself to act – to pull the trigger, to try to begin to rebuild from the carnage – for several months. So, I guess you might say I’m suffering from the ‘deer caught in the headlights’ syndrome. Which results in experiencing losses, and not experiencing the gains. These violent moves in both directions, changing on a dime without notice, with an overall 2 1/2 year huge down-move cumulative, have left
12
Price Headley
me at sea. How does one begin to work oneself out of this state of mind after what we have been through?”
vince is suffering from the fear of trading that, after a string of losses, many traders experience at one time or another. The reality is that human beings tend to do things that either maximize pleasure or minimize pain. Not pulling the trigger on trades becomes a way for traders to minimize pain, because mentally, the thought is that we are not causing ourselves any more damage if we do not trade. The problem is that we then remain stuck in a state of fear until we can TRUST our method again and start taking trades. This is why it’s so critical to have a trading plan that is tested, one we’ll be able to stick with it.
Here’s a game plan for getting yourself back on track:
1. Define Your Trading Plan – If you already have a plan, reexamine it. Are you following your rules for entry, exit and money management? Does your plan still have an edge in the current market conditions?
2. “If In Doubt, Get out” – Who says you have to trade every day? If you are not pulling the trigger on your trades, it is because you lack confidence in yourself or your plan. Try taking a step back for a short while. Consciously decide not to trade real dollars, but work on paper trading your buy and sell signals. Sure, it’s not the same as trading real dollars, but this step allows you to work on executing your trading plan. I have found systematic trading to be much easier than discretionary trading, because it helps take my ego out of the equation. I focus instead on the execution of buy and sell signals, as opposed to my ego wanting to be proved right. Paper trading will allow you to get refocused on execution of your ideas.
3. Measure Your Results – Too often traders may have a good plan, but then lose sight of measuring their results on a regular basis. What happens is that 90% of your trades may be done properly, but it is those 5-10% of your trades that eat you up with big losses. If you monitor your results closely, you should start to develop a “Success Profile” which defines what your best trades look like. once a trade doesn’t fit this Success Profile anymore, you should look to exit –whether at a profit or a loss – as your edge no longer exists.
13
How to Manage the Highs and Lows in Trading
Psychological Issue #3 in Trading: Lack of Confidence
In trading as in life, how you think determines the results you achieve. Many traders are filled with doubts and a lack of self-confidence, so you need to coach yourself through tough times with positive and self-motivating beliefs. Check to see if you possess the traits and beliefs of winning traders, including:1. My trading objectives are perfectly clear, and I truly believe I will achieve
these goals. If you have the belief that you will win, you increase your chances of trading to win. In order to have this level of conviction, you must have a thoroughly tested plan. You also must have a clear vision of how you will proceed with your plan in order to reach your goal. The more you can visualize your goals being achieved, the more you will strengthen your internal belief and confidence that you will reach your goals.
2. I have created a plan to achieve my trading goals. I’m sure you’ve heard the saying “I didn’t plan to fail; I failed to plan.” Without a plan, your results will tend to be mixed and uninspiring. Commit to writing down your trading plan and reviewing it regularly.
3. I prepare my plan before the trading day starts. If you don’t have a plan of action once the trading bell rings, you are moving from the proactive mentality into a reactive approach. I contend that the more reactive you become, the more you will get in late to market moves and dramatically diminish your reward-to-risk ratio. I prepare after the close for the next day’s trading, seeking to stay proactive and a step ahead of the rest of the crowd.
4. I regularly monitor my trading results to measure my progress toward my goals. Trading results tend to follow a zigzag approach similar to how a plane is guided to its destination. At periodic steps along the way, if a pilot is off course, he will set a new course towards the target. This is called course correction. once you have defined your trading target, your periodic evaluation should lead you to assess what is taking you off course and encourage you to make the necessary corrections to get you back on target.
5. I quickly discard negative emotions that can hurt my trading results. When you lose, learn from the experience and put it behind you. You cannot afford to dwell on a loss once the trade is complete. You have to have total focus on the new moment and forget about the past, save for the time you allocate to evaluating past trades (which should be done outside market hours).
6. I am focused on the market during the trading day, and not easily distracted by non-market activities during trading hours. This can be a tough one for many traders who have many responsibilities. If this is the case, define the time you will be focused on the market and make arrangements not to be interrupted.
Price Headley is founder and chief analyst at BigTrends.com, which provides daily education and recommendations for active traders of stocks, futures and options. He is also author of the investment best seller, Big Trends in Trading.
14
Martha Stokes
The Anatomy of a Stock Chart
B Y M A R T H A S T o k e S , C . M . T.
Stock charts are a window into the marketplace providing a detailed graphi-cal view that enables a chartist to understand the dynamics behind the price action. Whether you trade stocks, options, currencies, or commodities, you
need to be using charts for your trading analysis.Most people however jump into stock chart reading without getting the
essential training they need to optimize and expedite their chart analysis. So let’s start with the essentials of chart analysis using a stock chart. For new chartists this will be a place to begin. For advanced traders, this may be a review in places but reviewing is something all professionals in any industry do on a regular basis. Honing skills to the highest professional level should be a life-long pursuit.
First, let’s dispel a common myth: Charts do not predict the future. However, when used properly, charts do tell us a great deal about how to trade, when to trade, and what to trade.
Charts tell you:1. When to buy or sell, based on your trading style and risk tolerance.2. What is a reasonable price to pay for a stock, option, etc, based on your
trading style and trading parameters.3. Which stocks are forming Trendline Patterns that fit your trading style.
This tells you what trading strategies will work best at that time.4. Where to place your stop loss based on price patterns rather than the
outdated ‘percentage stop loss’.5. The angle of ascent or descent which tells you whether the current price
action is sustainable, how long the trend is likely to move in that direction, if a change of trend is imminent, and where you are in the trend cycle.
6. When to exit a stock based on your trading style, hold time, and financial goals.
7. Which of the 8 levels of Market Participants are actively trading.8. Which of the 4 positions currently dominate the price action: buyers,
sellers, sell shorters, or buy to cover traders.9. Whether small lots or large lots are in control of price.10. The direction of the long term, intermediate term, and short term trend
and whether the 3 trends are in harmony or opposition to each other. This defines the overall cycle.
15
The Anatomy of a Stock Chart
Stock Chart ComponentsMany people don’t realize that without the invention of the ticker tape, charts as
we know them today would not be possible. The ticker tape was invented by Thomas edison in 1869 and forever changed the stock market. Instead of scribbles of stock quotes on scraps of paper hand-carried via couriers around New York City, anyone with access to a ticker tape could watch market activity anywhere in the country.
With the data from the markets recorded in such a reliable manner it was only a matter of time before someone started recording those transactions in a graphical form we now call stock charts. Although the format for charts has evolved and changed over the years, the basic data used has not.
The 3 components of data available from the market are: PRICe, TIMe, and qUANTITY.
Although price is often considered the most important aspect of a chart, all three pieces of data are critical to successful analysis in today’s Internet driven markets.
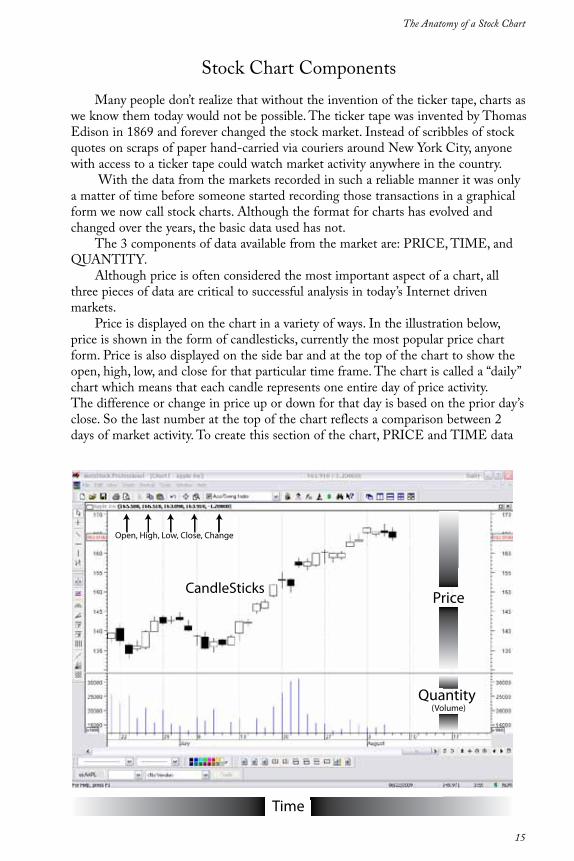
Price is displayed on the chart in a variety of ways. In the illustration below, price is shown in the form of candlesticks, currently the most popular price chart form. Price is also displayed on the side bar and at the top of the chart to show the open, high, low, and close for that particular time frame. The chart is called a “daily” chart which means that each candle represents one entire day of price activity. The difference or change in price up or down for that day is based on the prior day’s close. So the last number at the top of the chart reflects a comparison between 2 days of market activity. To create this section of the chart, PRICe and TIMe data
Price
Quantity (Volume)
Time
CandleSticks
Open, High, Low, Close, Change
16
Martha Stokes
have been used. TIMe is an integral part of how we perceive and determine changes in value (price) for a stock. PRICe is given priority status on the chart with TIMe close behind it. The importance of time is often overlooked by traders and investors.
TIMe is displayed not only in formulation of end of day price difference, but also at the bottom of the chart, and in conjunction with the open, high, low, and close pricing as well. Charts combine PRICe and TIMe to reflect the impact of TIMe on PRICe during the day, week, month, and intraday.
With this screen view, we have about six weeks of daily price action that can be analyzed and studied. TIMe allows us to see not only what is occurring at the moment with price but also to see what has occurred in the immediate past, and several months or years past. TIMe provides the perspective on PRICe needed for proper evaluation of the short term, intermediate term, and long term trend which provides critical information about where price has been and where it is going.
qUANTITY is the final piece of data that is essential for chart analysis. qUANTITY appears as both a graphical histogram called the ‘volume indicator’, and the total quantity of shares traded each day.
The qUANTITY indicator voLUMe provides a visual image of shares traded over TIMe. By studying the quantity of shares traded in relation to price fluctuations, a good chartist can quickly pick out discrepancies, fading volume patterns, exhaustion volume patterns, and speculative volume patterns that can forewarn of changes to price before price actually begins that change. The importance of qUANTITY can’t be overstated.
qUANTITY is not just the number of shares per, minute, day, week, or month it also is the share lot size being traded for every transaction. Share Lot Size provides a higher level of analysis seldom used by small retail traders. With the dominance of the institutions in the marketplace, being able to see visually what the large lots are buying or selling has become increasingly important.
It is the relationship between PRICe, TIMe, and qUANTITY that creates the patterns on charts that expose the direction of trend, and the strength and energy behind the trend.
Indicators Because all transactions are recorded it is possible to take this information and
create formulas that give the chartist a different perspective on what is happening between the relationships of time, price, and quantity.
These formulas are called ‘indicators’. An indicator is precisely what the term implies: an indication changes to trend, price patterns, volume, etc. Indicators are not precision tools however and must be used with judgment and consideration of what is going on elsewhere in the market.
In order to create an indicator, the writer must use at least 2 pieces of market data. Since all data is recorded, applying the formula to the data is simple and provides an accurate line or histogram for more sophisticated analysis of the data.
A moving average for instance, smooths PRICe with TIMe to create a line trend indicator that is much smoother than pure price action and tells the chartist whether or not the trend is still intact. volume can also be changed from a histogram to a line indicator.
17
The Anatomy of a Stock Chart
Most indicators are based on PRICe and TIMe. Some are based on qUANTITY and TIMe. Less common are indicators that use all 3 pieces of data, PRICe, TIMe and qUANTITY but these indicators tend to be the most reliable of all. Such indicators tend to ‘lead’ price, meaning the indicator moves or changes its pattern before price changes.
Setting up your indicator tool kitFor the best chart analysis, use a group of indicators based on your trading style
and the current Market Condition. Common indicator types include:1. Trend, direction of trend, and strength of trend indicators.2. oscillator Indicators for overbought and oversold which expose weakening
sideways action before price breaks out of the sideways trend.3. Accumulation and Distribution indicators which expose the buying and
selling habits of large lot institutional investors and institutional traders. each leaves a different ‘footprint’ on the chart.
4. Convergences and divergences of price or volume, indicating a change of trend direction.
5. Compression or expansion of patterns of price and/or volume in cyclical patterns.
Addtional ConsiderationsTraders and investors need to use the appropriate indicators and not assume a
popular indicator will work for their trading or investing goals. Never use just one indicator for your analysis. Try to include at least 3 and preferably 5.
Be sure that if you are trading short term that you use leading indicators rather than lagging indicators. Leading indicators “signal” a change of price before it actually happens. Leading indicators use all 3 pieces of data or are a combination indicator that uses all 3 data streams in the analysis. In contrast, Moving Averages, by their very nature, are lagging indicators and are best suited for longer term analysis.
There are 6 primary Market Conditions. each requires a different set of indicators for optimal trading profits. As an example: during a platform market, Bollinger Bands, RSI combination indicator, and volume Accumulation with Price Accumulation indicators are ideal. Trending indicators fail dismally.
Be sure you understand which indicator works for each market condition and use the appropriate indicators as market conditions change. Another example: MACD is a price/time indicator that works ideally in a trending or velocity market. It performs poorly in platform market conditions. Stochastic works best in trading range markets but fails during velocity trending markets because it signals an exit just as a stock starts a velocity run. As the market shifts from one condition to the next, change the indicators you are using so that your analysis is correct.
Summary: Chart analysis is a necessary skill for anyone who has money in the financial markets. Charts provide a graphical view of what has happened in the past, near past, as well as current activity. This information helps traders and investors anticipate what will happen next.

18
Martha Stokes
When you first learn to use a chart, start with the basic layout and learn it thoroughly before trying to learn the more advanced features of a charting program. As you become more proficient with chart analysis make sure you customize it to suit your trading style, parameters, and goals. Try not to fall into the trap of “following your neighbor”. each trader is unique and what works for someone else may not work for you.
Remember, no one can predict the markets. Good chartists study the historical data as well as the current data, identify the most common reoccurring patterns, and then act on those consistent patterns, ignoring the atypical patterns. In that way, their analysis may seem to predict when they are actually going with the flow of the trend.
Martha Stokes, C.M.T. is the co-founder and Ceo of TechniTrader®, an educational firm dedicated to helping investors and traders. Martha’s fascination with the markets and business started at a very young age. She made her first investment while still a teen. In her late thirties, when most people are just getting their careers established, she took an early retirement. Martha considers teaching as a way to enjoy her retirement while giving something back. Her infectious energy and vast body of knowledge in economics and financial markets, along with her innate ability to identify newly emerging technology has established her as a market authority. Her theory on Cycle evolution is a landmark work on financial cycles. She has been involved in several startups and has sat on both sides of the venture Capital negotiating table, worked on an IPo, managed a small fund, taught at community colleges, and has been a guest speaker at numerous seminars and investment groups including the Boeing employees Investment Group. She has been a guest on the CFRA radio ottawa Canada. Her long list of educational work include: 15 stock and option courses, 14 semester length Lab Classes, her Annual New Technology Reports, Sector and Industry, and Special edition Reports, hundreds of articles, resource papers, and white papers. Martha writes 6 newsletters each week and still finds time to answer student questions.
19
Using Candle Charts to Spot the Early Turning Signals – The Basics
B Y S T e v e N I S o N , C M T
What are Candlestick Charts?
Candle charts are Japan’s most popular, and oldest, form of technical analysis. They are older than point and figure and bar charts. Amazingly, candlestick charting techniques, used for generations in the Far east, were
unknown to the West until I revealed them in my first book Japanese Candlestick Charting Techniques back in 1991 B.C (Before Candles).
Japanese candlestick (also called candle) charts, so named because the lines look like candles with their wicks, are Japan’s most popular form of technical analysis. Candle charts are over 1,000 years old and as such are older than Western bar charts and point and figure charts. Yet, amazingly, these charts were unknown to the Western world until recently. Candle trading techniques have now become one of the most discussed forms of technical analysis around the world. Almost every technical analysis software package and Internet charting service now has candle charts. This attests to their popularity and usefulness.
This article is a very basic introduction to candle charting techniques. But even with the primary candle signals discussed, you will discover how candles open avenues of analysis not available anywhere else. My goal here is to provide a sense of the potential that the candles can offer.
What are the Benefits of Candle Charts?Candle charts are easy to understand: Anyone, from the first-time chartist
to the seasoned professional can easily harness the power of candle charts. This is because, as will be shown later, the same data that is required to draw the candlestick chart is the same as that needed for the bar chart (the high, low, open, and close).
Candlestick charting tools will give you a jump on the competition: Candle charts not only show the trend of the move, as does a bar chart, but unlike bar charts, candle charts also show the force underpinning the move. In addition, many of the candle signals are given in a few sessions, rather than the weeks often needed for a bar chart signal. Thus, candle charts will help you enter and exit the market with better timing.

20
Steve Nison, CMT
Candlestick charting tools will help preserve capital: In this volatile environment, capital preservation is just as important as capital accumulation. You will discover that the candles shine in helping you preserve capital since they often send out indications that a new high or low may not be sustained.
Candle charting techniques are easily joined with Western charting tools: Because candle charts use the same data as a bar chart, it means that any of the technical analyses used with bar charts (such as moving averages, trend lines, retracements, Bollinger Bands, etc.) can be employed with candle charts. However, candle charts can send signals not available with bar charts.
Candlestick charts can be used in stocks, futures, and any market that has an open, high, low, and close. And they can be used in all time frames—from intraday to weekly.
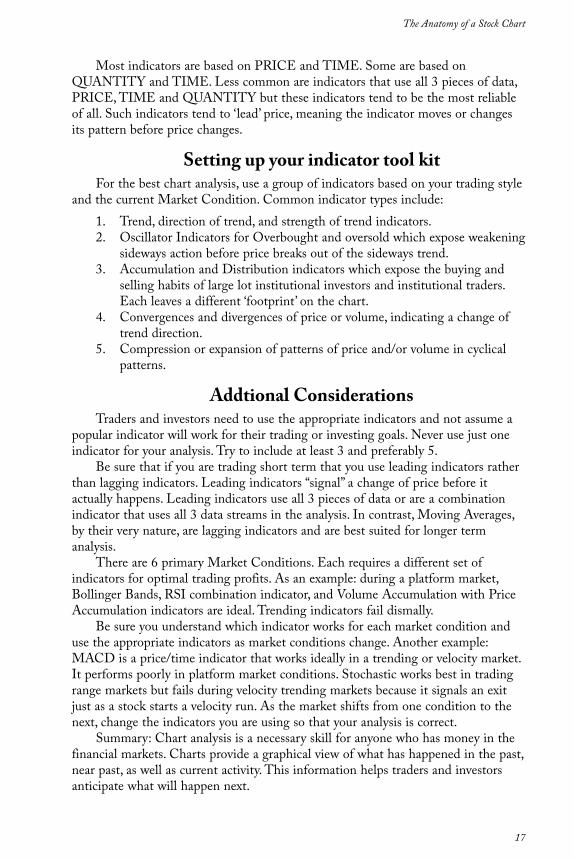
CoNSTRUCTING THe CANDLeSTICk LINeS The broad part of the candlestick line in exhibit 1 is called the real body. The real
body represents the range between the session’s open and close. If the close of the session is above the open, then the real body is white. If the real body is black, the close of the session is lower than the open. The thin lines above and below the real body are the shadows. These are the session’s price extremes. The shadow above the real body is called the upper shadow and the peak of the upper shadow is the high of the session. The shadow under the real body is the lower shadow and the bottom of the lower
shadow is the session’s low.
Candle lines can be drawn for all time frames, from intraday to monthly charts. For example, a 60-minute candle line uses the open, high, low and close of that 60-minute period; for a daily chart it would be the open, high, low and close for the day. on a weekly chart the candle would be based on Monday’s open, the high and low of the week, and Friday’s close.
Notice that the candles to the right in exhibit 1 have no real bodies. These are examples of doji (pronounced doe-gee). A doji is a candle in which the opening and close are the same. Doji represent a market that is in balance between the forces of supply and demand. We will look more at the doji in one of the chart examples below. While the candlestick line uses the same data as a bar chart, the color of the
Exhibit 1
21
Using Candle Charts to Spot the Early Turning Signals—The Basics
candlestick’s real body and the length of the candle line’s real body and shadows convey an instant x-ray into who’s winning the battle between the bulls and the bears. For instance, when the real body is black, that means the stock closed below its opening price. This gives you an instant picture of a positive or negative close. Those of us who stare at charts for hours at a time find candlesticks are not only easy on the eyes, they convey strong visual signals sometimes missed on bar charts.
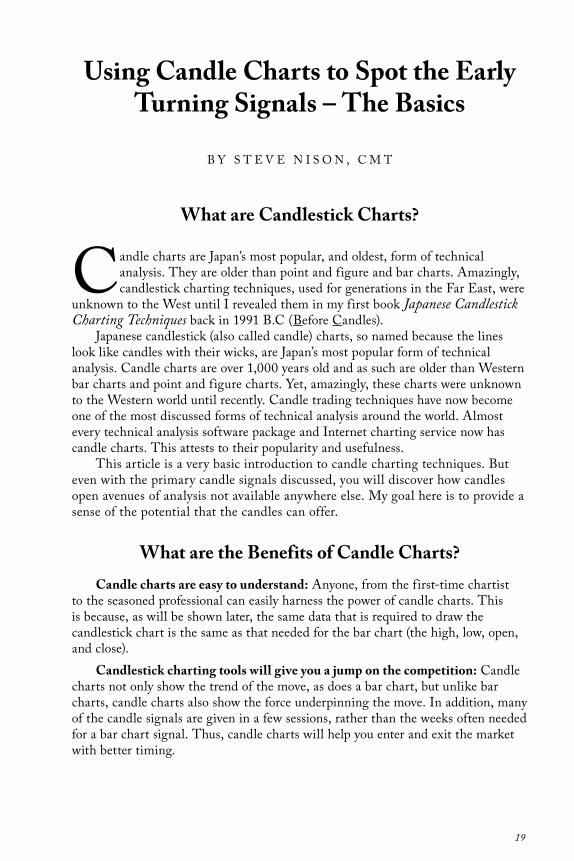
Spinning TopsThe logo of our firm is “Helping Clients Spot Market Turns Before the
Competition.” This is because one of the most powerful aspects of candle charts is that they will often provide reversal signals not available with traditional bar charting techniques. Let’s take a look at this aspect with a “spinning top.”
As mentioned previously, one of the more powerful aspects of candle charts is the quick visual information they relay about the market’s heath. For example, a small real body (white or black) indicates a period in which the bulls and bears are more in a tug of war. The Japanese have a nickname for small real bodies – “spinning tops,” because of their resemblance to the tops we had as children. Such small real bodies give a warning that the market’s trend may be losing momentum. As the Japanese phrase it, the “market is losing its breath.” A spinning top is illustrated in exhibit 2.
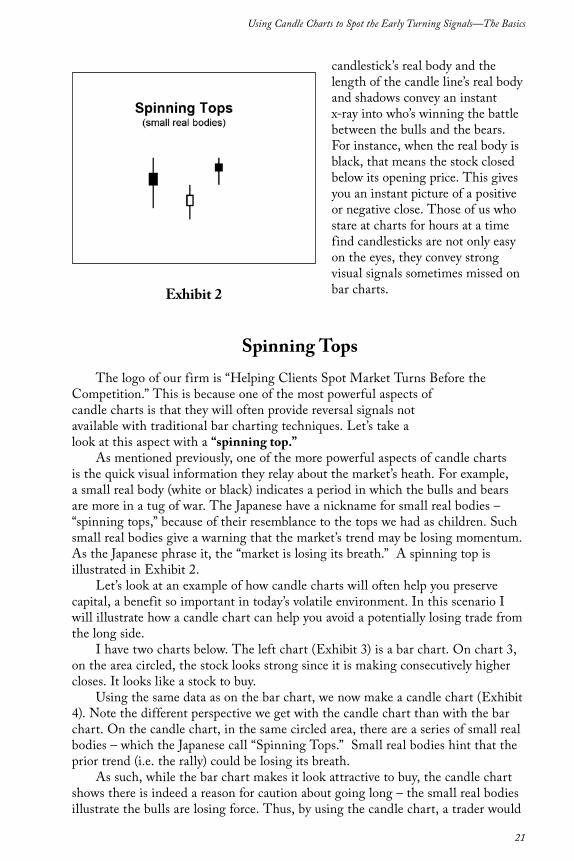
Let’s look at an example of how candle charts will often help you preserve capital, a benefit so important in today’s volatile environment. In this scenario I will illustrate how a candle chart can help you avoid a potentially losing trade from the long side.
I have two charts below. The left chart (exhibit 3) is a bar chart. on chart 3, on the area circled, the stock looks strong since it is making consecutively higher closes. It looks like a stock to buy.
Using the same data as on the bar chart, we now make a candle chart (exhibit 4). Note the different perspective we get with the candle chart than with the bar chart. on the candle chart, in the same circled area, there are a series of small real bodies – which the Japanese call “Spinning Tops.” Small real bodies hint that the prior trend (i.e. the rally) could be losing its breath.
As such, while the bar chart makes it look attractive to buy, the candle chart shows there is indeed a reason for caution about going long – the small real bodies illustrate the bulls are losing force. Thus, by using the candle chart, a trader would
Exhibit 2
22
Steve Nison, CMT
likely not buy in the circled area and thus help avoid a losing trade. This is but one example of how candles can help you preserve
capital. Warren Buffet has two rules: Rule 1 – Don’t lose money. Rule 2 – Don’t forget rule 1. Candles shine at helping you preserve capital.
DojiAs the real body shrinks we ultimately wind up with a doji. As shown on the
right side of exhibit 1, a doji is when the open and close are the same. The doji indicates a market in complete balance between supply and demand.
Since a doji session represents a market at a juncture of indecision, they can often be an early warning that a preceding rally could be losing steam. Indeed, with a doji the Japanese would say, “the market is tired.” (keep in mind a close over the doji would “refresh” the market.)
Properly used, candle charts may not only help improve profits, but will assist in preserving capital. They can do this by helping you avoid a potential losing trade or exiting a profitable trade early.
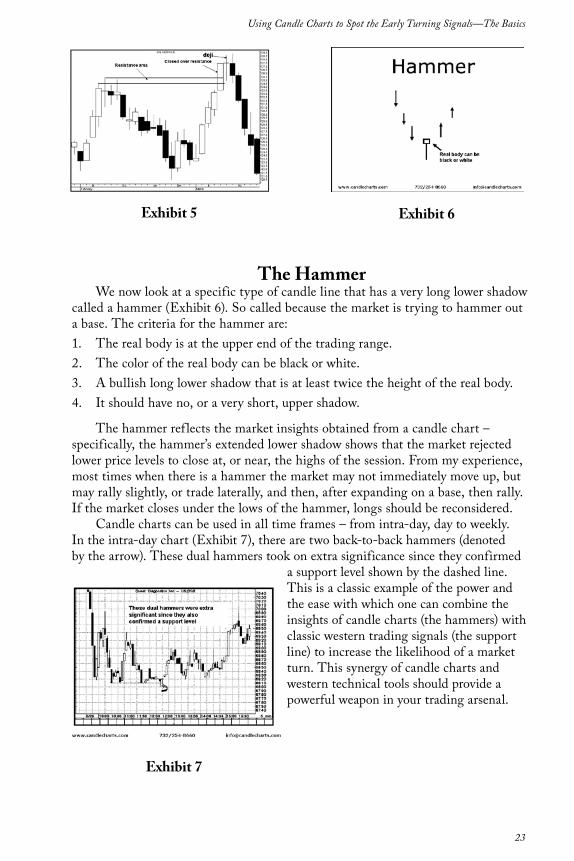
exhibit 5 shows an example of the latter. The horizontal line in exhibit 5 shows a resistance area near 135. A tall white candle pierces this resistance in early March. But observe what unfolded the next session – the doji. This doji line hinted the bulls had lost full control of the market (note: it does not mean that the bears have taken control). This is a classic example of the power of candle charting techniques. Specifically, within one session we were able to see a visual clue via the doji that while the market was maintaining its highs, the doji shouted that the bulls were not in complete control. So while the market looked healthy from the outside, the internals (as shown by the doji) were relaying the fact that this stock was not as healthy as one would think.
Exhibit 3 Exhibit 4
23
Using Candle Charts to Spot the Early Turning Signals—The Basics
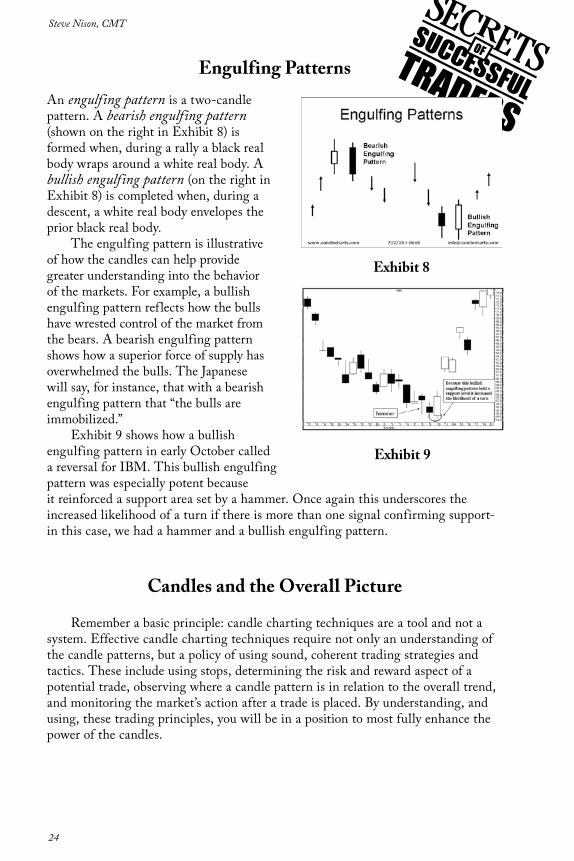
The HammerWe now look at a specific type of candle line that has a very long lower shadow
called a hammer (exhibit 6). So called because the market is trying to hammer out a base. The criteria for the hammer are:1. The real body is at the upper end of the trading range. 2. The color of the real body can be black or white.3. A bullish long lower shadow that is at least twice the height of the real body.4. It should have no, or a very short, upper shadow.
The hammer ref lects the market insights obtained from a candle chart – specifically, the hammer’s extended lower shadow shows that the market rejected lower price levels to close at, or near, the highs of the session. From my experience, most times when there is a hammer the market may not immediately move up, but may rally slightly, or trade laterally, and then, after expanding on a base, then rally. If the market closes under the lows of the hammer, longs should be reconsidered.
Candle charts can be used in all time frames – from intra-day, day to weekly. In the intra-day chart (exhibit 7), there are two back-to-back hammers (denoted by the arrow). These dual hammers took on extra significance since they confirmed
a support level shown by the dashed line. This is a classic example of the power and the ease with which one can combine the insights of candle charts (the hammers) with classic western trading signals (the support line) to increase the likelihood of a market turn. This synergy of candle charts and western technical tools should provide a powerful weapon in your trading arsenal.
Exhibit 5 Exhibit 6
Exhibit 7
24
Steve Nison, CMT
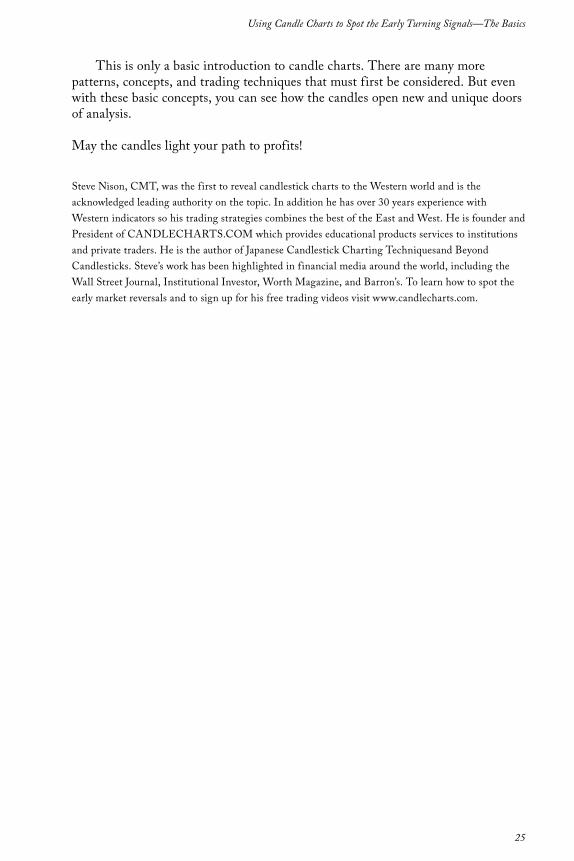
Engulfing PatternsAn engulfing pattern is a two-candle pattern. A bearish engulfing pattern (shown on the right in exhibit 8) is formed when, during a rally a black real body wraps around a white real body. A bullish engulfing pattern (on the right in exhibit 8) is completed when, during a descent, a white real body envelopes the prior black real body.
The engulfing pattern is illustrative of how the candles can help provide greater understanding into the behavior of the markets. For example, a bullish engulfing pattern reflects how the bulls have wrested control of the market from the bears. A bearish engulfing pattern shows how a superior force of supply has overwhelmed the bulls. The Japanese will say, for instance, that with a bearish engulfing pattern that “the bulls are immobilized.”
exhibit 9 shows how a bullish engulfing pattern in early october called a reversal for IBM. This bullish engulfing pattern was especially potent because it reinforced a support area set by a hammer. once again this underscores the increased likelihood of a turn if there is more than one signal confirming support-in this case, we had a hammer and a bullish engulfing pattern.
Candles and the Overall Picture
Remember a basic principle: candle charting techniques are a tool and not a system. effective candle charting techniques require not only an understanding of the candle patterns, but a policy of using sound, coherent trading strategies and tactics. These include using stops, determining the risk and reward aspect of a potential trade, observing where a candle pattern is in relation to the overall trend, and monitoring the market’s action after a trade is placed. By understanding, and using, these trading principles, you will be in a position to most fully enhance the power of the candles.
Exhibit 8
Exhibit 9
25
Using Candle Charts to Spot the Early Turning Signals—The Basics
This is only a basic introduction to candle charts. There are many more patterns, concepts, and trading techniques that must first be considered. But even with these basic concepts, you can see how the candles open new and unique doors of analysis.
May the candles light your path to profits!
Steve Nison, CMT, was the first to reveal candlestick charts to the Western world and is the acknowledged leading authority on the topic. In addition he has over 30 years experience with Western indicators so his trading strategies combines the best of the east and West. He is founder and President of CANDLeCHARTS.CoM which provides educational products services to institutions and private traders. He is the author of Japanese Candlestick Charting Techniquesand Beyond Candlesticks. Steve’s work has been highlighted in financial media around the world, including the Wall Street Journal, Institutional Investor, Worth Magazine, and Barron’s. To learn how to spot the early market reversals and to sign up for his free trading videos visit www.candlecharts.com.
26
Barbara Star, Ph.D.
Catch that Trend! Directional Strength and How to
Find It
B Y B A R B A R A S T A R , P H . D .
Traders usually favor moving averages to help them determine price trend. However two other popular indicators, the Moving Average Convergence/Divergence (MACD) and the Average Directional Index (ADX), can help
traders detect not only trend direction, but trend strength as well.The MACD, created by Gerald Appel, is a momentum indicator that often
identifies price direction as it rises and falls above or below its trigger line and its zero line.
The ADX, part of the Directional Movement system developed by Wells Wilder, is designed to detect the strength of price movement. ADX values in the 20 to 30 range indicate mild to moderate trending behavior while values above 30 usually signify a strong trend. A rising ADX indicates that prices are trending, but does not reveal the direction of that trend.
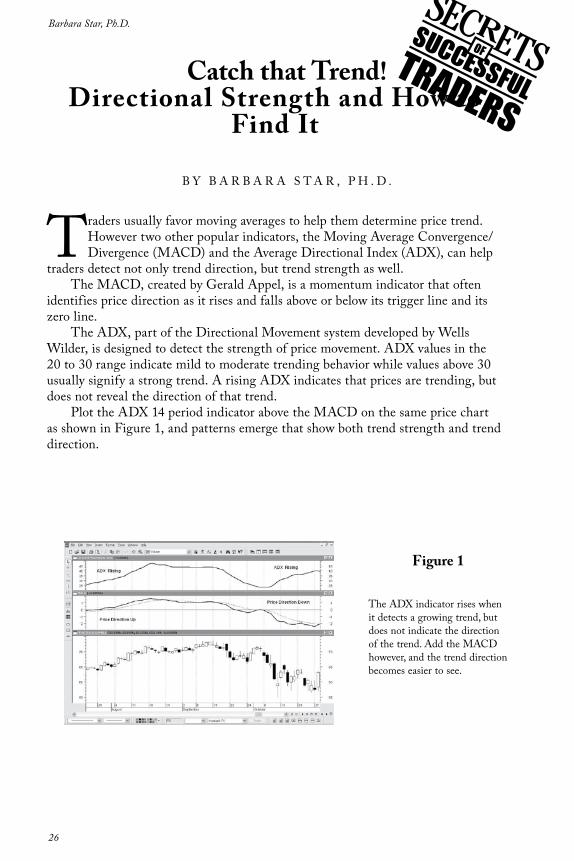
Plot the ADX 14 period indicator above the MACD on the same price chart as shown in Figure 1, and patterns emerge that show both trend strength and trend direction.
Figure 1
The ADX indicator rises when it detects a growing trend, but does not indicate the direction of the trend. Add the MACD however, and the trend direction becomes easier to see.
27
Catch that Trend! Directional Strength and How to Find It
Three Patterns
Three distinct, and profitable, patterns frequently appear. These patterns do not detect tops and bottoms, but can help traders confirm a trend. They are especially useful for those traders who prefer shorter-term trades.
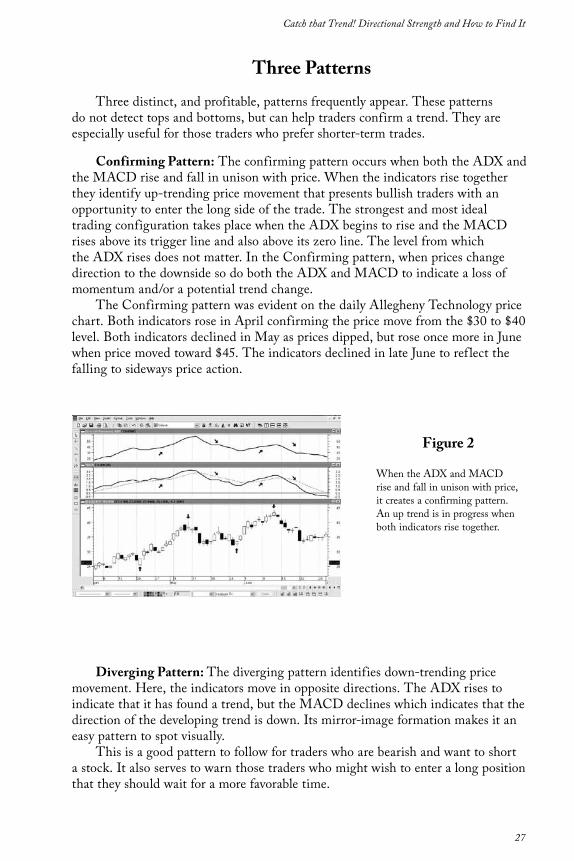
Confirming Pattern: The confirming pattern occurs when both the ADX and the MACD rise and fall in unison with price. When the indicators rise together they identify up-trending price movement that presents bullish traders with an opportunity to enter the long side of the trade. The strongest and most ideal trading configuration takes place when the ADX begins to rise and the MACD rises above its trigger line and also above its zero line. The level from which the ADX rises does not matter. In the Confirming pattern, when prices change direction to the downside so do both the ADX and MACD to indicate a loss of momentum and/or a potential trend change.
The Confirming pattern was evident on the daily Allegheny Technology price chart. Both indicators rose in April confirming the price move from the $30 to $40 level. Both indicators declined in May as prices dipped, but rose once more in June when price moved toward $45. The indicators declined in late June to ref lect the falling to sideways price action.
Diverging Pattern: The diverging pattern identifies down-trending price movement. Here, the indicators move in opposite directions. The ADX rises to indicate that it has found a trend, but the MACD declines which indicates that the direction of the developing trend is down. Its mirror-image formation makes it an easy pattern to spot visually.
This is a good pattern to follow for traders who are bearish and want to short a stock. It also serves to warn those traders who might wish to enter a long position that they should wait for a more favorable time.
Figure 2
When the ADX and MACD rise and fall in unison with price, it creates a confirming pattern. An up trend is in progress when both indicators rise together.
28
Barbara Star, Ph.D.
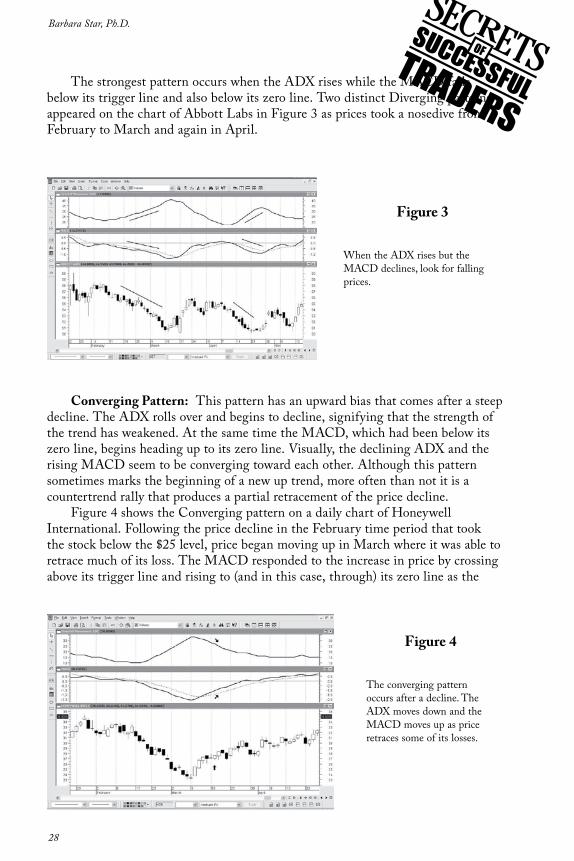
The strongest pattern occurs when the ADX rises while the MACD falls
below its trigger line and also below its zero line. Two distinct Diverging patterns appeared on the chart of Abbott Labs in Figure 3 as prices took a nosedive from February to March and again in April.
Converging Pattern: This pattern has an upward bias that comes after a steep decline. The ADX rolls over and begins to decline, signifying that the strength of the trend has weakened. At the same time the MACD, which had been below its zero line, begins heading up to its zero line. visually, the declining ADX and the rising MACD seem to be converging toward each other. Although this pattern sometimes marks the beginning of a new up trend, more often than not it is a countertrend rally that produces a partial retracement of the price decline.
Figure 4 shows the Converging pattern on a daily chart of Honeywell International. Following the price decline in the February time period that took the stock below the $25 level, price began moving up in March where it was able to retrace much of its loss. The MACD responded to the increase in price by crossing above its trigger line and rising to (and in this case, through) its zero line as the
Figure 3
When the ADX rises but the MACD declines, look for falling prices.
Figure 4
The converging pattern occurs after a decline. The ADX moves down and the MACD moves up as price retraces some of its losses.
29
Catch that Trend! Directional Strength and How to Find It
ADX stopped rising and moved down to complete the Converging pattern. This is an enticing pattern, but often not as profitable as the others because its
moves tend to be short-lived and, even though the MACD rises, prices may move sideways instead of upward.
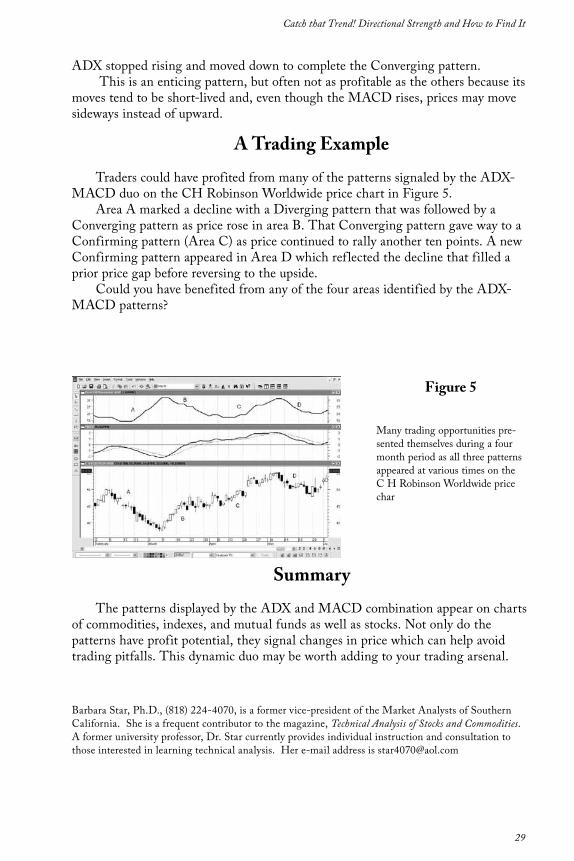
A Trading ExampleTraders could have profited from many of the patterns signaled by the ADX-
MACD duo on the CH Robinson Worldwide price chart in Figure 5.Area A marked a decline with a Diverging pattern that was followed by a
Converging pattern as price rose in area B. That Converging pattern gave way to a Confirming pattern (Area C) as price continued to rally another ten points. A new Confirming pattern appeared in Area D which ref lected the decline that filled a prior price gap before reversing to the upside.
Could you have benefited from any of the four areas identified by the ADX-MACD patterns?
SummaryThe patterns displayed by the ADX and MACD combination appear on charts
of commodities, indexes, and mutual funds as well as stocks. Not only do the patterns have profit potential, they signal changes in price which can help avoid trading pitfalls. This dynamic duo may be worth adding to your trading arsenal.
Barbara Star, Ph.D., (818) 224-4070, is a former vice-president of the Market Analysts of Southern California. She is a frequent contributor to the magazine, Technical Analysis of Stocks and Commodities. A former university professor, Dr. Star currently provides individual instruction and consultation to those interested in learning technical analysis. Her e-mail address is [email protected]
Figure 5
Many trading opportunities pre-sented themselves during a four month period as all three patterns appeared at various times on the C H Robinson Worldwide price char
30
Shawn Lucas
Recognizing Shifts in Volatility
B Y S H A W N L U C A S
Have you ever experienced that foreboding feeling of intense worry during periods of relative calm – a sort of disturbance in the force or calm before the storm? It is the same kind of sense that a mother has when, in the midst of the normally chaotic play of children, she exclaims in horror, “Something’s wrong!” Sometimes the sense actually precedes the event when the mother rushes to the door just in time to see the child dive off the bed or the bookshelf come crashing down. This type of perceptual awareness is a seemingly unconscious capacity for insight, intuition or knowledge – or is it?
Traders – like their mothers – can also exhibit a predisposition to perceptual awareness. You will often hear a trader exclaim, “It feels like this market is going to reverse” or “Things are about to get a little crazy!”
At no time does perception have a greater impact on performance than it does in recognizing volatility shifts. volatility shifts are natural changes in the tempo and magnitude of price f luctuations in the market. It is important to note that a volatility shift is not necessarily a change in the direction of a trend, but in the speed and distance of the trend.
In reality, recognizing a shift in volatility does not need to be a supernatural feeling or intuition. In fact, volatility shifts fit into one of nine patterns easily recognizable on the chart.
In this article you will see how to measure average volatility on a price chart and identify the nine volatility shift patterns that tell you whether volatility is increasing or decreasing.
How to measure average volatility from a price chartA volatility shift is a change in the average price movement over time. There
are two variables you need to establish before you can measure volatility shift: the average price cycle and the average time cycle.
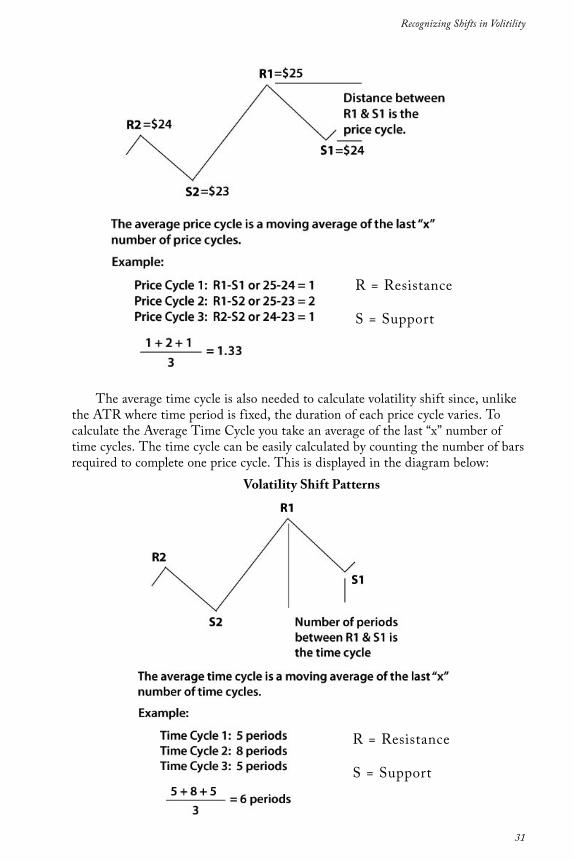
Average price cycle employs the same underlying concept that is used to calculate the Average True Range (ATR). The ATR can be used to give you an approximation of the magnitude (distance between the high and low) of each bar on a price chart. For example, if the range for each price bar for the last three periods is 1.25, 1.50 and 1.25, then the average range for each price bar is 1.33. The average price cycle measures the same thing – only instead of measuring the price bar it measures the price cycle (distance between short term pivot lows and pivot highs).
To calculate the average price cycle you must first measure the last several price cycles. A price cycle is easily measured by subtracting the last pivot from the previous pivot as shown in the diagram below:
31
Recognizing Shifts in Volitility
The average time cycle is also needed to calculate volatility shift since, unlike the ATR where time period is fixed, the duration of each price cycle varies. To calculate the Average Time Cycle you take an average of the last “x” number of time cycles. The time cycle can be easily calculated by counting the number of bars required to complete one price cycle. This is displayed in the diagram below:
Volatility Shift Patterns
R = Resistance
S = Support
R = Resistance
S = Support
32
Shawn Lucas
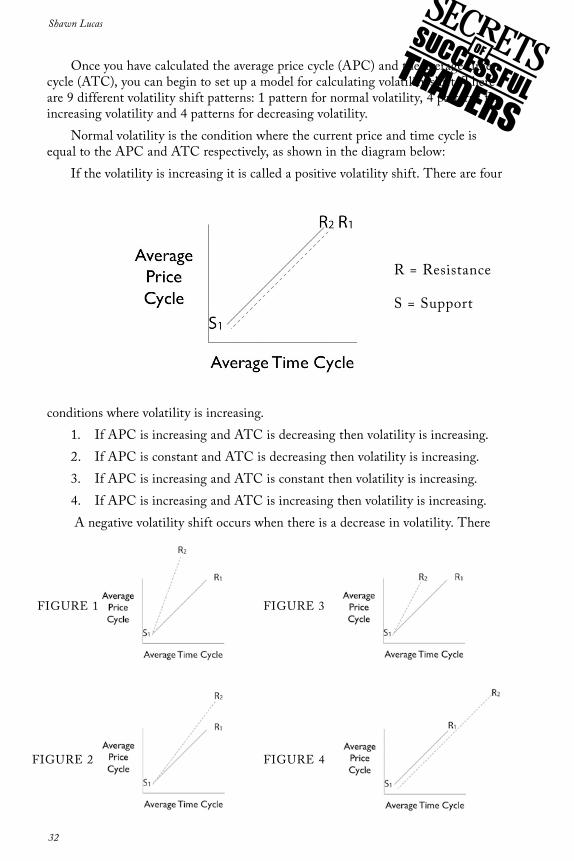
once you have calculated the average price cycle (APC) and the average time cycle (ATC), you can begin to set up a model for calculating volatility shift. There are 9 different volatility shift patterns: 1 pattern for normal volatility, 4 patterns for increasing volatility and 4 patterns for decreasing volatility.
Normal volatility is the condition where the current price and time cycle is equal to the APC and ATC respectively, as shown in the diagram below:
If the volatility is increasing it is called a positive volatility shift. There are four
conditions where volatility is increasing. 1. If APC is increasing and ATC is decreasing then volatility is increasing.2. If APC is constant and ATC is decreasing then volatility is increasing.3. If APC is increasing and ATC is constant then volatility is increasing.4. If APC is increasing and ATC is increasing then volatility is increasing. A negative volatility shift occurs when there is a decrease in volatility. There
FIGURe 1 FIGURe 3
FIGURe 2 FIGURe 4
R = Resistance
S = Support
33
Recognizing Shifts in Volitility
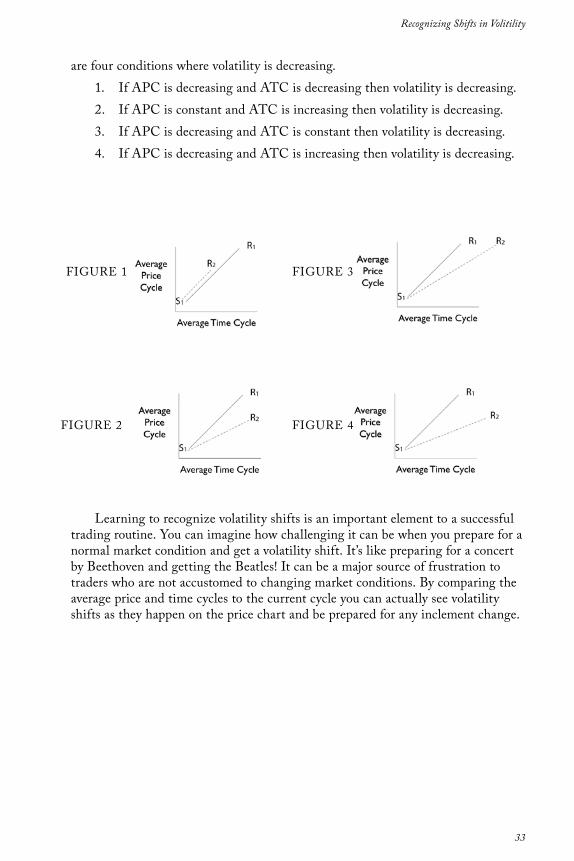
are four conditions where volatility is decreasing.1. If APC is decreasing and ATC is decreasing then volatility is decreasing.2. If APC is constant and ATC is increasing then volatility is decreasing.3. If APC is decreasing and ATC is constant then volatility is decreasing.4. If APC is decreasing and ATC is increasing then volatility is decreasing.
Learning to recognize volatility shifts is an important element to a successful trading routine. You can imagine how challenging it can be when you prepare for a normal market condition and get a volatility shift. It’s like preparing for a concert by Beethoven and getting the Beatles! It can be a major source of frustration to traders who are not accustomed to changing market conditions. By comparing the average price and time cycles to the current cycle you can actually see volatility shifts as they happen on the price chart and be prepared for any inclement change.
FIGURe 1 FIGURe 3
FIGURe 2 FIGURe 4
34
Shawn Lucas
Shawn T. Lucas is a leading expert in the field of technical and economic analysis of the financial markets. He has traveled extensively throughout the United States, Canada, and Asia providing lectures, training, consulting and expert testimony to companies and individuals on the art and science of financial analysis.
The APC and the ATC calculations are available in an indicator format in the Proform Robot plug-in for MetaStock. For more information go to: www.proformrobot.com
35
Understanding the Crowd
B Y D A R Y L G U P P Y
In trading, there are three key questions:
• Is this a short-lived rally or a trend?• Is this really a trend change?• Is this price pullback in a rising trend an opportunity to join the trend,
or a signal that the trend is ending?
Technical analysis indicators are generally designed to answer one or more of these questions. The answers help us to select better trading opportunities, and to trade them in the correct way. It is no good trading a rally as a
major trend change. It calls for different techniques, and we need a method to decide when the rally has ended and the downtrend resumed.
I use a Guppy Multiple Moving Average to help make these initial decisions. once the best opportunity has been found, and the nature of the opportunity identified, I then turn to other tools to fine-tune the entry, define and manage the risk, and to manage the trade. The Guppy MMA relies on understanding the fractal repetition of relationships across multiple time frames. It helps us to understand the behavior of the two most important groups in the market — traders and investors.
When traders use two or more moving averages, their attention is usually focused on the point of the crossover. This is a distraction from the more important messages contained in moving average relationships. The Guppy MMA uses the moving averages to track the activity of traders and investors, and to understand the difference between price and value.
value is what we believe a stock is worth. We make this decision based on our future expectations. Price is what we pay to buy the stock today. When everybody agrees on price and value there is no market. You can walk to the nearest Wal-Mart and see agreement on price and value in action. It is not very exciting and not very profitable if we want to buy an item and later sell it at a profit.
The financial market is driven by the difference between price and value. When some traders see a stock selling at $50 they believe it is under valued. They buy because they believe they can make a profit on the difference between the current price and the future value. When we expand this concept to the broader market we observe periods where there is relative agreement on value and price. The market moves sideways. At other times there is a wide disagreement on price and value so the market moves quickly.
36
Daryl Guppy
Traders make these decisions more rapidly than investors. Traders are always probing to see if current price is good value. Traders lead the market. Investors follow. Traders cannot maintain their momentum unless investors follow, and the Guppy MMA highlights these relationships.
Applying the Guppy MMABefore we apply the Guppy MMA, we start with an observation of the
behavior of the group of short-term averages. These are 3, 5, 10, 12 and 15-day exponential moving averages. When these averages compress, they tell us that short-term traders are in agreement on price and value. Inevitably a few traders see an opportunity to make a dollar because they believe the market is incorrectly valued. They start buying. To get stock they have to outbid their competitors. This causes a separation, or spreading in the short-term group of averages. other traders pick up on the price moves, and before long we see a wide separation of the short-term group.
At its widest, this separation tells us that value has moved well away from price. You probably know the feeling. Desperate to buy a stock that is moving exactly as you anticipated, you end up chasing it to the top price of the day. Next morning you realize you have paid much more than you should have. When you, and other traders reach this conclusion, the selling starts, and the wide spread in the short-term group rapidly collapses. Compression is followed by expansion and followed again by compression. Agreement on value is followed by disagreement about value, and then followed by agreement about value.
Investors show the same relationships, and these are captured with the long term group of averages. These are 30, 35, 40, 45, 50 and 60 day exponential moving averages. The compression and expansion does not develop as quickly as with the short term group but the same behaviors are repeated on a longer time frame. When the long term group of averages spreads out it tells us that the trend is well supported.
Combine these two groups into a single display and we create a Guppy MMA. This is available as a standard MetaStock template in the template menu list.
There are four areas of importance in applying this indicator.
1. The compression and expansion relationships in the short-term group of averages.
2. The compression and expansion relationship in the long-term group of averages.
3. The relationship and degree of separation between the short-term group and the long-term group.
4. The crossover area and the nature of this crossover.
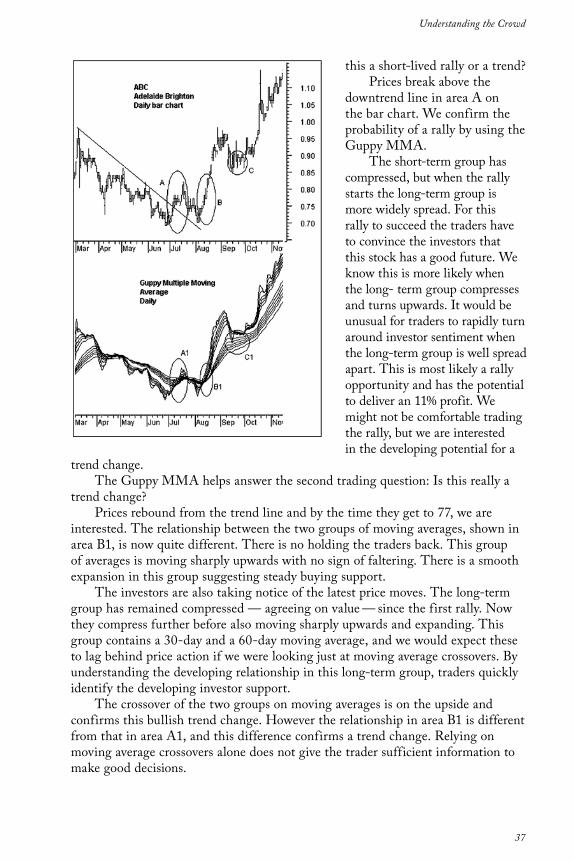
The accompanying chart shows how we use the Guppy MMA to identify the most appropriate trading opportunity. We start with the first trading question: Is
37
Understanding the Crowd
this a short-lived rally or a trend?Prices break above the
downtrend line in area A on the bar chart. We confirm the probability of a rally by using the Guppy MMA.
The short-term group has compressed, but when the rally starts the long-term group is more widely spread. For this rally to succeed the traders have to convince the investors that this stock has a good future. We know this is more likely when the long- term group compresses and turns upwards. It would be unusual for traders to rapidly turn around investor sentiment when the long-term group is well spread apart. This is most likely a rally opportunity and has the potential to deliver an 11% profit. We might not be comfortable trading the rally, but we are interested in the developing potential for a
trend change.The Guppy MMA helps answer the second trading question: Is this really a
trend change?Prices rebound from the trend line and by the time they get to 77, we are
interested. The relationship between the two groups of moving averages, shown in area B1, is now quite different. There is no holding the traders back. This group of averages is moving sharply upwards with no sign of faltering. There is a smooth expansion in this group suggesting steady buying support.
The investors are also taking notice of the latest price moves. The long-term group has remained compressed — agreeing on value — since the first rally. Now they compress further before also moving sharply upwards and expanding. This group contains a 30-day and a 60-day moving average, and we would expect these to lag behind price action if we were looking just at moving average crossovers. By understanding the developing relationship in this long-term group, traders quickly identify the developing investor support.
The crossover of the two groups on moving averages is on the upside and confirms this bullish trend change. However the relationship in area B1 is different from that in area A1, and this difference confirms a trend change. Relying on moving average crossovers alone does not give the trader sufficient information to make good decisions.
38
Daryl Guppy
These relationships suggest there is a high probability that this is the start of a new and strong up trend, led by traders and supported by investors. This opportunity offers a 49% return.
Plucking up the courage to enter on a price pullback in a rising trend is made easy with the Guppy MMA. In area C, the initial trend momentum fails and prices collapse. The reaction of the long-term group of averages tells us this is a buying opportunity. The group is well separated and when prices fall as traders take profits, the investors step in to buy stock at cheaper than expected prices. The long-term group does not compress and continues to move upwards.
Traders who took early profits can buy back into the trend around 88, confident that the underlying trend is intact. Traders and investors who missed out on the initial trend break now have an opportunity to join the trend and collect a 30% return. It is the relationship between the long-term group of averages that confirms the trend strength. This relationship is not revealed if we use just a 10-day and 30-day moving average combination.
Analysis on historical charts always looks good because we already know what has happened in the future. These notes are drawn from my analysis of this stock in real time. I opened a personal trade in area B and rode the trend using the Guppy MMA to deliver the exit signal. This is my primary tool for understanding the trend, the probability of a trend change, and the nature of trading opportunity.
Guppytraders.com is an international financial market education and training organization with offices in Darwin, Singapore, Beijing and Malaysia. We provide independent education, training, analysis and resources for retail and professional financial market traders involved in stocks, CFD’s, warrants, derivatives, futures and commodities. our objective is to provide you with quality independent education and professional assistance because the financial market does not recognise learner traders.
Daryl Guppy appears regularly on CNBCAsia and is known as “The Chart Man”. He is an equity and derivatives trader and author of books including Share Trading, Trend Trading and The 36 Strategies of The Chinese For Financial Traders. He has developed several leading technical indicators used by traders in many markets.
Mr. Guppy is a regular contributor for financial magazines and media in Singapore, Malaysia, China, Australia and the US. He oversees the production of weekly analysis and trading newsletters for the Singapore/ Malaysia market, and Australian markets. He recognized as a leading expert on China markets. He is in demand as a speaker in Asia, China, europe and Australia. Guppytraders has offices in Singapore, Beijing and Darwin .
39
Bollinger Band Basics
B Y J o H N B o L L I N G e R
Bollinger Bands are available on MetaStock and most charting software. They have become popular primarily because they answer a question every investor needs to know: Are prices high or low?
What are Bollinger Bands?Bollinger Bands are curves drawn in and around the price structure on a chart
that provide a relative definition of high and low. Prices near the upper band are high prices, while prices near the lower band are low.
The base of the bands is a moving average that is descriptive of the intermediate-term trend. This average is known as the middle band, and its default length is 20 periods. The width of the bands is determined by a measure of volatility, called standard deviation. The data for the volatility calculation is the same data that was used for the moving average. The upper and lower bands are drawn at a default distance of two standard deviations from the average.
THeSe ARe THe STANDARD BoLLINGeR BAND FoRMULAS:Upper band = Middle band + 2 standard deviationsMiddle band = 20-period moving averageLower band = Middle band – 2 standard deviations Learning how to use Bollinger Bands effectively cannot be fully explained in this article. However, the following rules serve as a good starting point.
15 Basic Rules for Using Bollinger Bands
1. Bollinger Bands provide a relative definition of high and low.2. That relative definition can be used to compare price action and indicator
action to arrive at rigorous buy and sell decisions.3. Appropriate indicators can be derived from momentum, volume, sentiment,
open interest, inter-market data, etc.4. volatility and trend already have been deployed in the construction of
Bollinger Bands, so their use for confirmation of price action is not recommended.
5. The indicators used for confirmation should not be directly related to one another. Two indicators from the same category do not increase confirmation. Avoid colinearity.
40
John Bollinger
6. Bollinger Bands can be used to clarify pure price patterns, such as M-type tops and W-type bottoms, momentum shifts, etc.
7. Price can — and does — walk up the upper Bollinger Band and down the lower Bollinger Band.
8. Closes outside the Bollinger Bands can be continuation signals, not reversal signals—as is demonstrated by the use of Bollinger Bands in some very successful volatility-breakout systems.
9. The default parameters of 20 periods for the moving average and standard deviation calculations, and the two standard deviations for the bandwidth are just that, defaults. The actual parameters needed for any given market/task may be different.
10. The average deployed should not be the best one for crossover signals. Rather, it should be descriptive of the intermediate-term trend.
11. If the average is lengthened, the number of standard deviations needs to be increased simultaneously; from 2 at 20 periods, to 2.1 at 50 periods. Likewise, if the average is shortened, the number of standard deviations should be reduced; from 2 at 20 periods, to 1.9 at 10 periods.
12. Bollinger Bands are based upon a simple moving average. This is because a simple moving average is used in the standard deviation calculation and we wish to be logically consistent.
13. Be careful about making statistical assumptions based on the use of the standard deviation calculation in the construction of the bands. The sample size in most deployments of Bollinger Bands is too small for statistical significance, and the distributions involved are rarely normal.
14. Indicators can be normalized with %b, eliminating fixed thresholds in the process.
15. Finally, tags of the bands are just that, tags, not signals. A tag of the upper Bollinger Band is NoT in-and-of-itself a sell signal. A tag of the lower Bollinger Band is NoT in-and-of-itself a buy signal.
These rules outline the basic guidelines for using Bollinger Bands. For a more comprehensive understanding of the bands, I suggest that you read “Bollinger On Bollinger Bands.” This book starts with the basics, builds to the complex and teaches the technical analysis process, including which indicators to use and how to read charts.
John Bollinger, CFA, CMT is probably best known for his Bollinger Bands, which have been widely accepted and integrated into most of the analytical software currently in use. He is the president of Bollinger Capital Management, a money management firm, and has published The Capital GrowthLettersince 1988. He has eight websites: www.BollingerBands.com, www.equityTrader.com, www.PatternPower.com, www.BollingeronBollingerBands.com, www.GroupPower.com, www.FundsTrader.com, www.MarketTechnician.comand a new forex website, www.BBForex.com
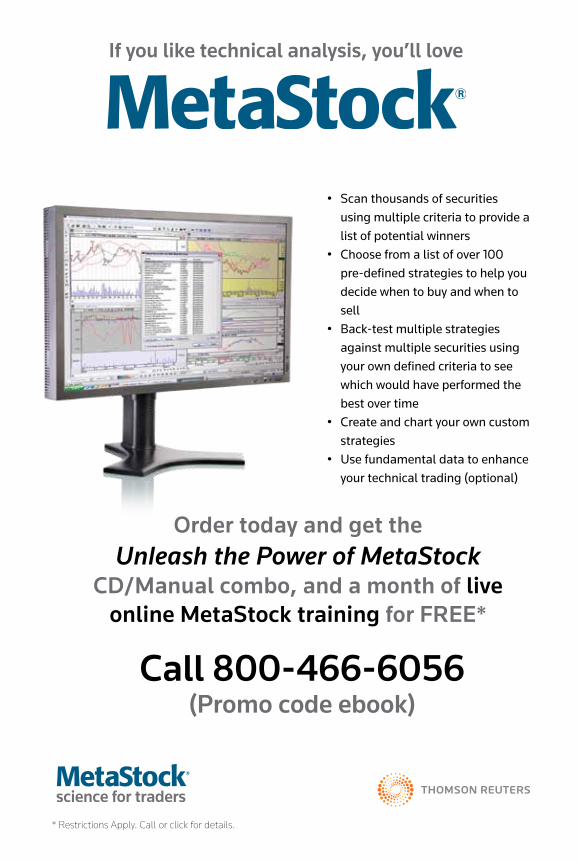
If you like technical analysis, you’ll love
• Scanthousandsofsecuritiesusingmultiplecriteriatoprovidealistofpotentialwinners
• Choosefromalistofover100pre-definedstrategiestohelpyoudecidewhentobuyandwhentosell
• Back-testmultiplestrategiesagainstmultiplesecuritiesusingyourowndefinedcriteriatoseewhichwouldhaveperformedthebestovertime
• Createandchartyourowncustomstrategies
• Usefundamentaldatatoenhanceyourtechnicaltrading(optional)
science for traders
Order today and get the Unleash the Power of MetaStock
CD/Manual combo, and a month of live online MetaStock training for FREE*
Call 800-466-6056(Promo code ebook)
* Restrictions Apply. Call or click for details.