secondary mathematics teachers' perceptions of the ...people.virginia.edu/~rqb3e/bol_berry...
TRANSCRIPT

Secondary Mathematics Teachers'Perceptions of the Achievement Gap
Linda BolOld Dominion University
Robert Q. Berry HIOld Dominion University
The purpose of this study was to survey theperceptions of secondary mathematics teach-ers on factors contributing to the achievementgap and ways to reduce this gap. NationalCouncil of the Teachers of Mathematics(NCTM) members were surveyed, and a total of379 secondary teachers responded. Overall,respondents were most likely to attribute theachievement gap to student characteristics,such as differences in motivational levels,work ethic, and family support. Furthermore,teachers from schools with a higher popula-tion of White students were more likely toattribute the gap to student characteristicsthan were teachers in schools with higher per-centages of minority students. Mathematicssupervisors and university faculty were lesslikely to attribute the achievement gap to stu-dent characteristics than were middle andhigh school teachers. Instead, the supervisorsand university faculty were more likely toendorse explanations related to curriculumand instruction than were secondary teachers.In terms of attributing the achievement gap tofactors related to language, we found that thehigher the percentage of Hispanic or Latinostudents in the respondents' schools, the morelikely they were to endorse Language items.Suggestions for reducing the achievement gapcentered on professional development forteachers, curricular changes, communitybuilding, and policies that included morefunding equity and a reduction in class size.
Though various reform efforts for mathematicshave been implemented in our public schools,an achievement gap still exists between Whitestudents and African American, Hispanic, andNative American students with respect to high-er-level mathematics coursework (Schoenfeld,2002). Disparities in mathematics achievementhave been evident in assessment scores, courseenrollment patterns, and allocation of humanand material resources. Variations in achieve-ment correlate with variations in course enroll-ment patterns and resources. That is, studentswho have access to advance mathematics cours-es, taught by a highly qualified teacher (human
i 2005 The University of North Carolina Press
32
Perceptions of the Achievement Gap
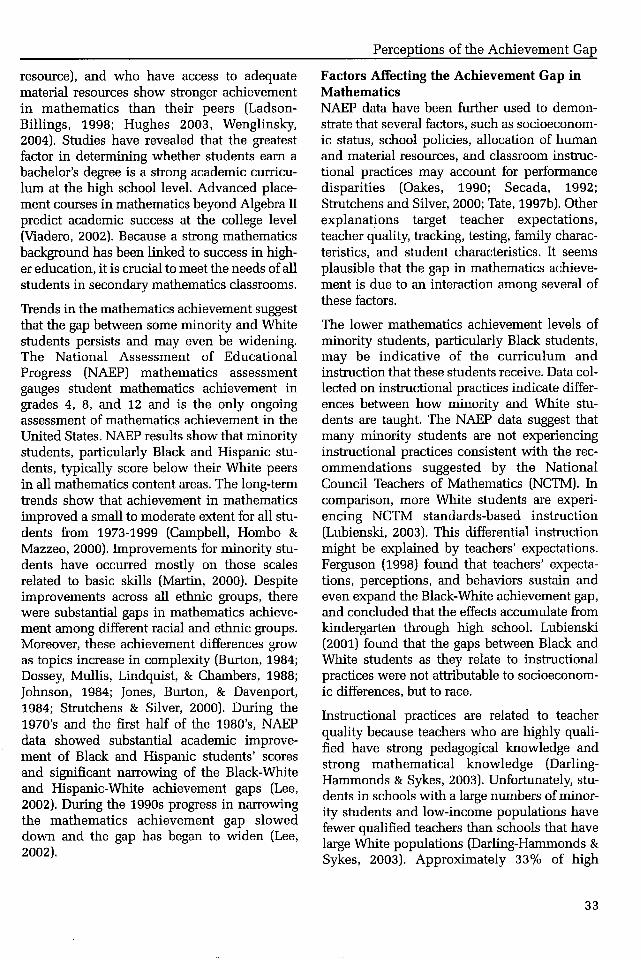
resource), and who have access to adequatematerial resources show stronger achievementin mathematics than their peers (Ladson-Billings, 1998; Hughes 2003, Wenglinsky,2004). Studies have revealed that the greatestfactor in determining whether students earn abachelor's degree is a strong academic curricu-lum at the high school level. Advanced place-ment courses in mathematics beyond Algebra IIpredict academic success at the college level(Viadero, 2002). Because a strong mathematicsbackground has been linked to success in high-er education, it is crucial to meet the needs of allstudents in secondary mathematics classrooms.
Trends in the mathematics achievement suggestthat the gap between some minority and Whitestudents persists and may even be widening.The National Assessment of EducationalProgress (NAEP) mathematics assessmentgauges student mathematics achievement ingrades 4, 8, and 12 and is the only ongoingassessment of mathematics achievement in theUnited States. NAEP results show that minoritystudents, particularly Black and Hispanic stu-dents, typically score below their White peersin all mathematics content areas. The long-termtrends show that achievement in mathematicsimproved a small to moderate extent for all stu-dents from 1973-1999 (Campbell, Hombo &Mazzeo, 2000). Improvements for minority stu-dents have occurred mostly on those scalesrelated to basic skills (Martin, 2000). Despiteimprovements across all ethnic groups, therewere substantial gaps in mathematics achieve-ment among different racial and ethnic groups.Moreover, these achievement differences growas topics increase in complexity (Burton, 1984;Dossey, Mullis, Lindquist, & Chambers, 1988;Johnson, 1984; Jones, Burton, & Davenport,1984; Strutchens & Silver, 2000). During the1970's and the first half of the 1980's, NAEPdata showed substantial academic improve-ment of Black and Hispanic students' scoresand significant narrowing of the Black-Whiteand Hispanic-White achievement gaps (Lee,2002). During the 1990s progress in narrowingthe mathematics achievement gap sloweddown and the gap has began to widen (Lee,2002).
Factors Affecting the Achievement Gap inMathematicsNAEP data have been further used to demon-strate that several factors, such as socioeconom-ic status, school policies, allocation of humanand material resources, and classroom instruc-tional practices may account for performancedisparities (Oakes, 1990; Secada, 1992;Strutchens and Silver, 2000; Tate, 1997b). Otherexplanations target teacher expectations,teacher quality, tracking, testing, family charac-teristics, and student characteristics. It seemsplausible that the gap in mathematics achieve-ment is due to an interaction among several ofthese factors.
The lower mathematics achievement levels ofminority students, particularly Black students,may be indicative of the curriculum andinstruction that these students receive. Data col-lected on instructional practices indicate differ-ences between how minority and White stu-dents are taught. The NAEP data suggest thatmany minority students are not experiencinginstructional practices consistent with the rec-ommendations suggested by the NationalCouncil Teachers of Mathematics (NCTM). Incomparison, more White students are experi-encing NCTM standards-based instruction(Lubienski, 2003). This differential instructionmight be explained by teachers' expectations.Ferguson (1998) found that teachers' expecta-tions, perceptions, and behaviors sustain andeven expand the Black-White achievement gap,and concluded that the effects accumulate fromkindergarten through high school. Lubienski(2001) found that the gaps between Black andWhite students as they relate to instructionalpractices were not attributable to socioeconom-ic differences, but to race.
Instructional practices are related to teacherquality because teachers who are highly quali-fied have strong pedagogical knowledge andstrong mathematical knowledge (Darling-Hanunonds & Sykes, 2003). Unfortunately, stu-dents in schools with a large numbers of minor-ity students and low-income populations havefewer qualified teachers than schools that havelarge White populations (Darling-Hammonds &Sykes, 2003). Approximately 33% of high
33
The High School Journal - April! May 2005
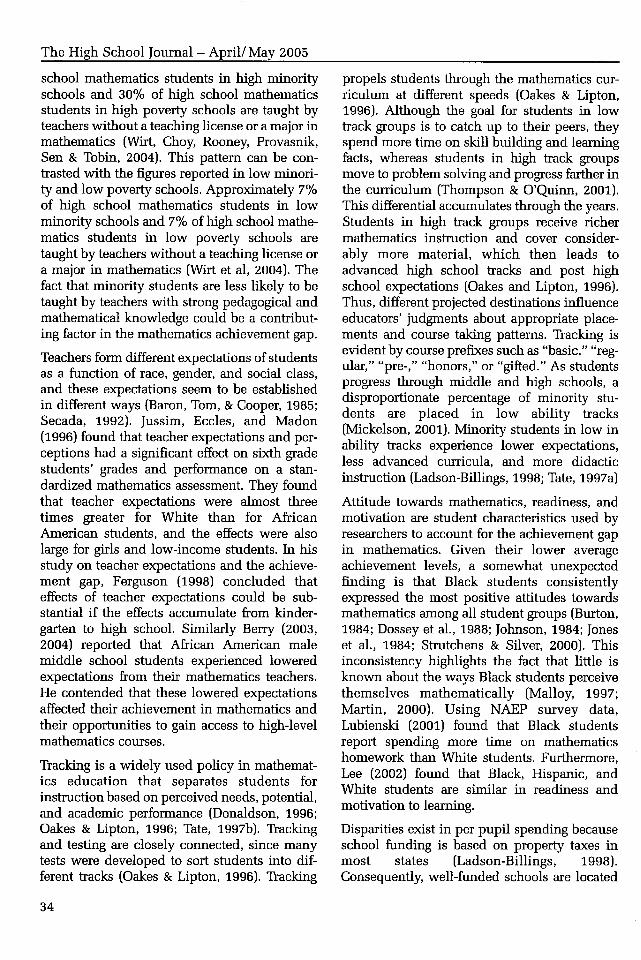
school mathematics students in high minorityschools and 30% of high school mathematicsstudents in high poverty schools are taught byteachers without a teaching license or a major inmathematics (Wirt, Choy, Rooney, Provasnik,Sen & Tobin, 2004). This pattern can be con-trasted with the figures reported in low minori-ty and low poverty schools. Approximately 7%of high school mathematics students in lowminority schools and 7% of high school mathe-matics students in low poverty schools aretaught by teachers without a teaching license ora major in mathematics (Wirt et al, 2004). Thefact that minority students are less likely to betaught by teachers with strong pedagogical andmathematical knowledge could be a contribut-ing factor in the mathematics achievement gap.
Teachers form different expectations of studentsas a function of race, gender, and social class,and these expectations seem to be establishedin different ways (Baron, Tom, & Cooper, 1985;Secada, 1992). Jussim, Eccles, and Madon(1996) found that teacher expectations and per-ceptions had a significant effect on sixth gradestudents' grades and performance on a stan-dardized mathematics assessment. They foundthat teacher expectations were almost threetimes greater for White than for AfricanAmerican students, and the effects were alsolarge for girls and low-income students. In hisstudy on teacher expectations and the achieve-ment gap, Ferguson (1998) concluded thateffects of teacher expectations could be sub-stantial if the effects accumulate from kinder-garten to high school. Similarly Berry (2003,2004) reported that African American malemiddle school students experienced loweredexpectations from their mathematics teachers.He contended that these lowered expectationsaffected their achievement in mathematics andtheir opportunities to gain access to high-levelmathematics courses.
Tracking is a widely used policy in mathemat-ics education that separates students forinstruction based on perceived needs, potential,and academic performance (Donaldson, 1996;Oakes & Lipton, 1996; Tate, 1997b). Trackingand testing are closely connected, since manytests were developed to sort students into dif-ferent tracks (Oakes & Lipton, 1996). Tracking
propels students through the mathematics cur-riculum at different speeds (Oakes & Lipton,1996). Although the goal for students in lowtrack groups is to catch up to their peers, theyspend more time on skill building and learningfacts, whereas students in high track groupsmove to problem solving and progress farther inthe curriculum (Thompson & O'Quinn, 2001).This differential accumulates through the years.Students in high track groups receive richermathematics instruction and cover consider-ably more material, which then leads toadvanced high school tracks and post highschool expectations (Oakes and Lipton, 1996).Thus, different projected destinations influenceeducators' judgments about appropriate place-ments and course taking patterns. Tracking isevident by course prefixes such as "basic," "reg-ular," "pre-," "honors," or "gifted." As studentsprogress through middle and high schools, adisproportionate percentage of minority stu-dents are placed in low ability tracks(Mickelson, 2001). Minority students in low inability tracks experience lower expectations,less advanced curricula, and more didacticinstruction (Ladson-Billings, 1998; Tate, 1997a)
Attitude towards mathematics, readiness, andmotivation are student characteristics used byresearchers to account for the achievement gapin mathematics. Given their lower averageachievement levels, a somewhat unexpectedfinding is that Black students consistentlyexpressed the most positive attitudes towardsmathematics among all student groups (Burton,1984; Dossey et al., 1988; Johnson, 1984; Joneset al., 1984; Strutchens & Silver, 2000). Thisinconsistency highlights the fact that little isknown about the ways Black students perceivethemselves mathematically (Malloy, 1997;Martin, 2000). Using NAEP survey data,Lubienski (2001) found that Black studentsreport spending more time on mathematicshomework than White students. Furthermore,Lee (2002) found that Black, Hispanic, andWhite students are similar in readiness andmotivation to learning.
Disparities exist in per pupil spending becauseschool funding is based on property taxes inmost states (Ladson-Billings, 1998).Consequently, well-funded schools are located
34

Perceptions of the Achievement Gap
in areas with high property values.Furthermore, "property is a powerful determi-nant of academic advantage. Without a commit-ment to redesign funding formulas, one of thebasic inequities of schooling will remain inplace and virtually guarantee the reproductionof the status quo" (Ladson-Billings, 1998; p. 21).Lee (2004) used the 1990 and 1998 CommonCore of Data to examine school spending andfound that predominately Black and/orHispanic school districts generally spend lesson education that their predominately Whitecounterparts.
When examining family characteristics, such asparental educational attainment, parentalinvolvement in their children's education, andsingle parent households, liberal scholars arguethat the culture of school is grounded in theethos of the White middle class culture that val-ues and demands certain ways of talking, writ-ing, dressing, and interacting. (Delpit, 1995;Hughes 2003). Consequently, there is a mis-match between students' home culture and thedominant culture valued by schools. Valdes(1996) argues that this mismatch is particularlysalient in the area of parental involvement inthe schools, with cultural differences viewed ascultural deficits.
In reference to the family's socioeconomic sta-tus, Orr (2003) examined the Black-Whiteachievement gap by investigating the effects ofwealth on achievement. In this study, wealth isdefined as the liquidity of economic capital thatcan be converted into cultural and social capi-tal. Orr found that wealth has a positive effecton mathematics achievement. This finding sup-ports Bourdieu's (1986) notion that economiccapital can be converted into other forms of cap-ital to reproduce status (Orr, 2003). Orr alsofound that race has a negative effect on achieve-ment. That is, Black children scored lower on astandardized mathematics achievement testeven after parental income, education, occupa-tion, family characteristics, and wealth aretaken into account. Similarly, Lee (2002) ana-lyzed trends in the Black-White and Hispanic-White achievement gaps over a 30-year spanand found that family characteristics do notfully account the achievement gap in mathe-matics and reading.
There is some relationship between English lan-guage proficiency and mathematics achieve-ment. Fernandez and Nielson (1986) used theHigh School and Beyond 1980 data to examinethe relationship between English language pro-ficiency and mathematics achievement. Theyfound that there was a significant relationshipbetween English language proficiency andachievement in mathematics. In his review ofstudies on the relationship between languageproficiency and mathematics achievement,Secada (1992) found significant correlationsbetween language proficiency and mathematicsachievement that ranged between .20 and .50.Bradby (1992) used the National EducationLongitudinal Study (NELS) to examine howlanguage characteristics of Asian and Hispanicstudents related to their mathematics achieve-ment. Bradby found that as English proficiencyincreased for Hispanic students, the percentageof those students below basic mathematics leveldecreased. Because of the small sample size,Bradby (1992) did not find a statistically signif-icant difference for Asian students.
Purpose and Overview of Present StudyMuch of the research on the achievement gap inmathematics has focused on instructional prac-tices, teacher expectations, teacher quality,tracking, testing, family characteristics, and stu-dent characteristics as determinants of theachievement gap. Though the research on theachievement gap in mathematics providesinsights on the effects of the aforementionedfactors, they do not promote understanding ofhow the secondary mathematics teachers per-ceive the achievement gap. We did not identifyany other studies that systematically surveyedteachers to explore their explanations of theachievement gap in mathematics and ways toreduce this gap.
There are compelling reasons why understand-ing teachers' perceptions of the achievementgap and strategies for its reduction are signifi-cant. Teacher expectations and bias may play arole in the kinds of explanations offered and thetypes of instructional practices implemented toaddress this gap. A recent study by Downey andPribesh (2004) reported that Black teachers'evaluation of Black students' behavior wasmore favorable than the evaluations made by
35
The High School Journal - April/ May 2005
White teachers. Furthermore, their findingssuggest that bias on the part of White teachersbetter explained the mismatch, as opposed tothe misbehavior of Black students in Whiteteachers' classrooms. Lipman (1998) argues thatteacher participation in school restructuring islargely influenced by ideology, race, and power.Based on her case study of teacher participationin the restructuring of a junior high school, shemade the following conclusion. "If restructur-ing is to transform the educational experiencesof marginalized students, it will require bothpersonal and social change- challenging educa-tors' beliefs and assumptions as well as rela-tions of power in schools and communities" (p.3). In her ethnographic study of bilingual stu-dents, Valdes (1996) points to how cultural dif-ferences may lead to misunderstanding ofMexican students by White majority teachers. Acultural deficit model of the achievement gapsignals more narrow educational interventions,such as fluency in standard English, rather thanbroader solutions, such as desegregation or theamelioration of funding inequities (Valdes,1996).
Given that teachers' beliefs, expectations,instructional practices, and professional devel-opment activities influence their students'achievement, understanding their views is animportant step in identifying strategies for alle-viating the achievement gap in mathematics.Therefore, the purpose of this study was to sur-vey the perceptions of middle and secondarymathematics teachers on the achievd&nent gapin mathematics education. Our sample of teach-ers was drawn from the National Council ofTeachers of Mathematics (NCTM) roster. For thepurposes of this study, the achievement gap wasdefined as an indictor of disparities betweengroups of students usually identified (accurate-ly or not) by racial, ethnic, linguistic or socioeconomic class with regard to a variety of meas-ures (attrition and enrollment rates, drug use,health, alienation for school and society atti-tude toward mathematics, as well as testscores). More specifically the followingresearch questions were addressed.
1. What do secondary mathematics teachersperceive to be the most important contribu-tors to the achievement gap in mathematics?
2. Do these perceptions differ as function ofstudent, school, and district characteristics(i.e., ethnicity and socioeconomic status ofstudents, geographic setting, region of thecountry, size of district)?
3. Do secondary mathematics teachers' per-ceptions of the achievement gap differfrom those of school/district mathematicssupervisors or university faculty?
4. What suggestions do secondary mathemat-ics teachers have for reducing the achieve-ment gap?
MethodThe present study relied on survey methodolo-gy, which yielded both quantitative and qualita-tive data. This study was part of a larger surveyconducted by the NCTM's Achievement GapTask Force. Data was collected via an onlinesurvey sent to a random sample of 5,000 non-student NCTM members. For this study, wefocused on responses obtained from middle andhigh school mathematics teachers.
ParticipantsA total of 379 middle and high school mathe-matics teachers responded to the survey.Middle school mathematics teachers (grades 6-8) represented forty-one percent of the sampleand high school mathematics teachers com-prised 58 percent (grades 9-12). Respondentswere mainly White (89%), female (69%) andhave 4 years or more years of experience in theircurrent position (73%). These demographiccharacteristics are also representative of theNCTM membership at large. Although thelargest group of respondents described theirschools as suburban (46%), more than half ofthe sample designated their schools as urban(25%) or rural (29%). In terms of school charac-teristics, respondents were asked to estimate theethnic distribution and socio-economic level(% free or reduced lunch) of their schools' stu-dent body. On the average, about 66 percent ofthe students were White, 14 percent wereAfrican American, and 12 percent were Latino/Hispanic. The average percentage of students inother ethnic groups was less than 10 percent.On the average, nearly 37 percent of the stu-dents were estimated to receive free or reduced
36
Perceptions of the Achievement Gap
lunch, with percentages ranging from 0 to 100percent.
QuestionnaireThe data source was the questionnaire devel-oped by the researchers. The first section con-tained items requesting information on demo-graphic and employment characteristics. Thenext sections presented 23 rating scale itemspertaining to factors contributing to the achieve-ment gap. The NCTM definition of the achieve-ment gap preceded the rating scale items. Theitems were organized into five sub-areas orscales (4-6 items per scale) and included (1)Background and Societal Influences, (2)Student Characteristics, (3) Curriculum andInstruction, (4) Politics and Policy, and (5)Language. Respondent were asked to rate theextent to which they agreed with the statementon 5-point Likert-type scale, ranging from"strongly disagree" (1) to "strongly agree" (5).The next three items were open-ended andasked respondents to provide their own defini-tion of the achievement gap in mathematics,identify its major causes, and suggest strategiesfor addressing the gap. The final section was tar-geted to respondents based in a school or dis-trict. It contained five items related to the char-acteristics of the school or districts, includingcharacteristics of the student population.
A factor analysis (principal components extrac-tion method with varimax rotation) was con-ducted to empirically investigate the validity ofthe rating scale items. The results supportedonly 4 of the original 5 scales. The componentmatrix did not support the original scale calledBackground and Societal Influences. Two ofthese items were retained on StudentCharacteristics scale. A total of 5 items were dis-carded due to the lack of logical interpretationon a given scale, weak factor loadings, or strong-ly loading on more than one factor. The finalsolution of four factors, all with eigen valuesgreater than one, accounted for 52 percent of thevariance. Reliability coefficients (Cronbach'salphas) for each of the scales ranged from a lowof .61 to a high of .85.
ProcedureOn March 9, 2004, the sample of the NCTMmembership received an email containing the
URL link that opened the online survey. Accessto the online survey was available until March29, 2004. Eight hundred seventy members fromthe random sample visited the website and 623members completed the survey. Of the 623respondents, 379 were middle or high schoolteachers.
ResultsThe results are organized by research question.Both quantitative and qualitative data wereused to address the first question on contribu-tors to the achievement gap. The last question,asking respondents to suggest strategies forreducing the achievement gap, relied exclusive-ly on open-ended, qualitative responses. Thequalitative responses were analyzed using AtlasTI, a qualitative analysis software program. Theremaining questions were addressed usingresponses from quantitative demographic andrating scale items.
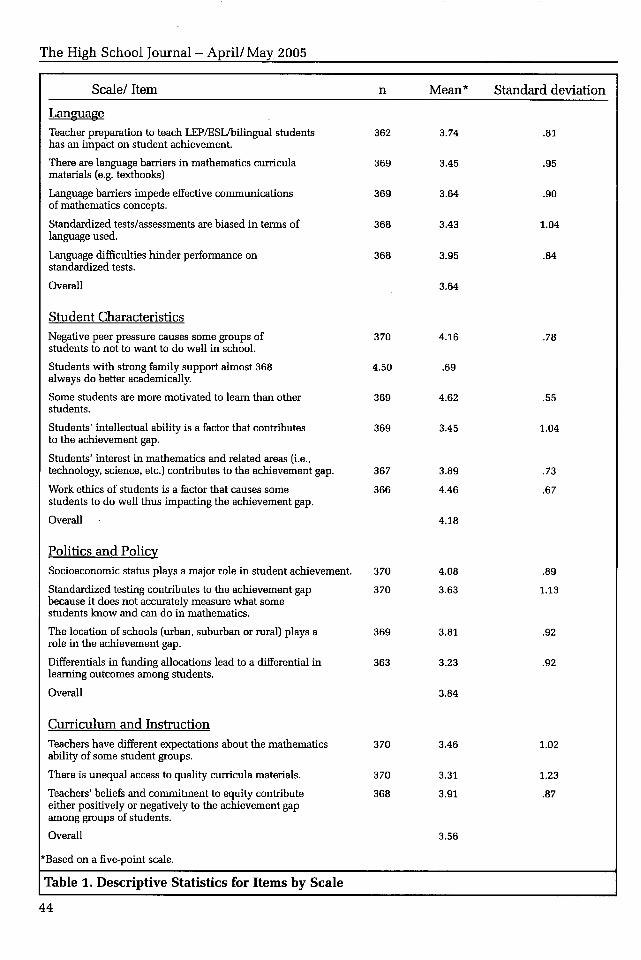
Contributors to the Achievement GapDescriptive analyses were used to address thefirst research question. Table 1 presents thenumber of respondents, mean rating, and stan-dard deviation for each item organized by scale.The overall mean rating is also presented foreach the scales. The highest mean ratings wereobserved on the Student Characteristics scale.The overall mean rating was 4.18, with four ofthe six items on this scale showing means above4.0. The most strongly endorsed items on thisscale were "students with strong family supportalmost always do better academically"(M=4.50), and "some students are more moti-vated to learn than other students" (M=4.62).The high mean rating of items on this scale sug-gest that respondents were more likely to attrib-ute causes of the achievement gap to studentcharacteristics than to other factors. The nexthighest overall mean was observed for thePolitics and Policy scale. On the Policy andPolitics scale, the highest mean rating wasobtained for the item, "socio-economic statusplays a major role in student achievement"(M=4.11). The overall mean ratings on theLanguage (M=3.64) and Curriculum andInstruction scales (M=3.56) were similar, andsuggest more moderate levels of agreement. Themost strongly endorsed item on the Language
37
The High School Journal - April/ May 2005
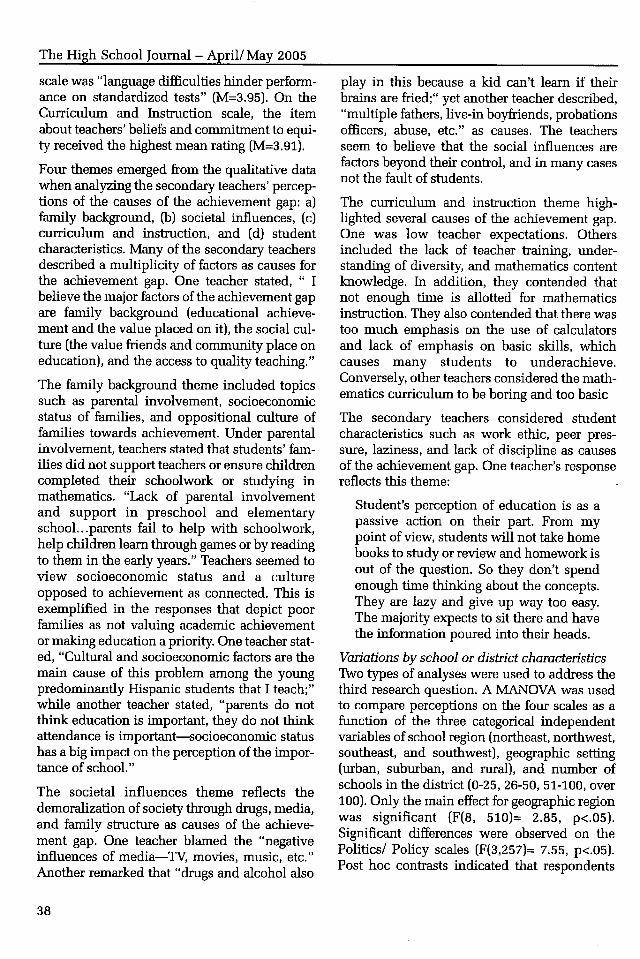
scale was "language difficulties hinder perform-ance on standardized tests" (M=3.95). On theCurriculum and Instruction scale, the itemabout teachers' beliefs and comnitment to equi-ty received the highest mean rating (M=3.91).
Four themes emerged from the qualitative datawhen analyzing the secondary teachers' percep-tions of the causes of the achievement gap: a)family background, (b) societal influences, (c)curriculum and instruction, and (d) studentcharacteristics. Many of the secondary teachersdescribed a multiplicity of factors as causes forthe achievement gap. One teacher stated, " Ibelieve the major factors of the achievement gapare family background (educational achieve-ment and the value placed on it), the social cul-ture (the value friends and community place oneducation), and the access to quality teaching."
The family background theme included topicssuch as parental involvement, socioeconomicstatus of families, and oppositional culture offamilies towards achievement. Under parentalinvolvement, teachers stated that students' fam-ilies did not support teachers or ensure childrencompleted their schoolwork or studying inmathematics. "Lack of parental involvementand support in preschool and elementaryschool.. .parents fail to help with schoolwork,help children learn through games or by readingto them in the early years." Teachers seemed toview socioeconomic status and a cultureopposed to achievement as connected. This isexemplified in the responses that depict poorfamilies as not valuing academic achievementor making education a priority. One teacher stat-ed, "Cultural and socioeconomic factors are themain cause of this problem among the youngpredominantly Hispanic students that I teach;"while another teacher stated, "parents do notthink education is important, they do not thinkattendance is important-socioeconomic statushas a big impact on the perception of the impor-tance of school."
The societal influences theme reflects thedemoralization of society through drugs, media,and family structure as causes of the achieve-ment gap. One teacher blamed the "negativeinfluences of media-TV, movies, music, etc."Another remarked that "drugs and alcohol also
play in this because a kid can't learn if theirbrains are fried;" yet another teacher described,"multiple fathers, live-in boyfriends, probationsofficers, abuse, etc." as causes. The teachersseem to believe that the social influences arefactors beyond their control, and in many casesnot the fault of students.
The curriculum and instruction theme high-lighted several causes of the achievement gap.One was low teacher expectations. Othersincluded the lack of teacher training, under-standing of diversity, and mathematics contentknowledge. In addition, they contended thatnot enough time is allotted for mathematicsinstruction. They also contended that there wastoo much emphasis on the use of calculatorsand lack of emphasis on basic skills, whichcauses many students to underachieve.Conversely, other teachers considered the math-ematics curriculum to be boring and too basic
The secondary teachers considered studentcharacteristics such as work ethic, peer pres-sure, laziness, and lack of discipline as causesof the achievement gap. One teacher's responsereflects this theme:
Student's perception of education is as apassive action on their part. From mypoint of view, students will not take homebooks to study or review and homework isout of the question. So they don't spendenough time thinking about the concepts.They are lazy and give up way too easy.The majority expects to sit there and havethe information poured into their heads.
Variations by school or district characteristicsTwo types of analyses were used to address thethird research question. A MANOVA was usedto compare perceptions on the four scales as afunction of the three categorical independentvariables of school region (northeast, northwest,southeast, and southwest), geographic setting(urban, suburban, and rural), and number ofschools in the district (0-25, 26-50, 51-100, over100). Only the main effect for geographic regionwas significant (F(8, 510)= 2.85, p<.05).Significant differences were observed on thePolitics/ Policy scales (F(3,257)= 7.55, p<.o5).Post hoc contrasts indicated that respondents
38
Perceptions of the Achievement Gap
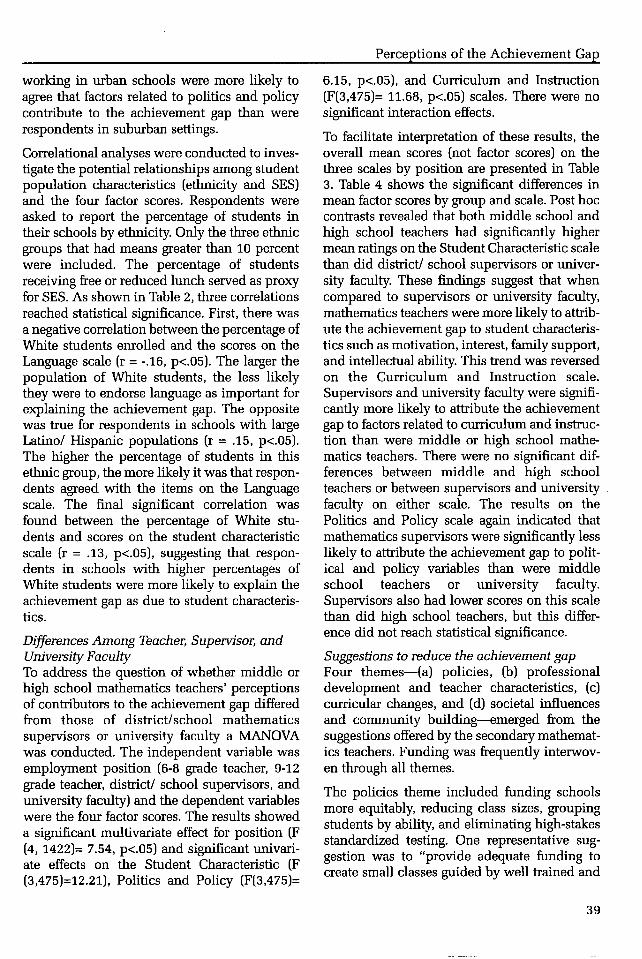
working in urban schools were more likely toagree that factors related to politics and policycontribute to the achievement gap than wererespondents in suburban settings.
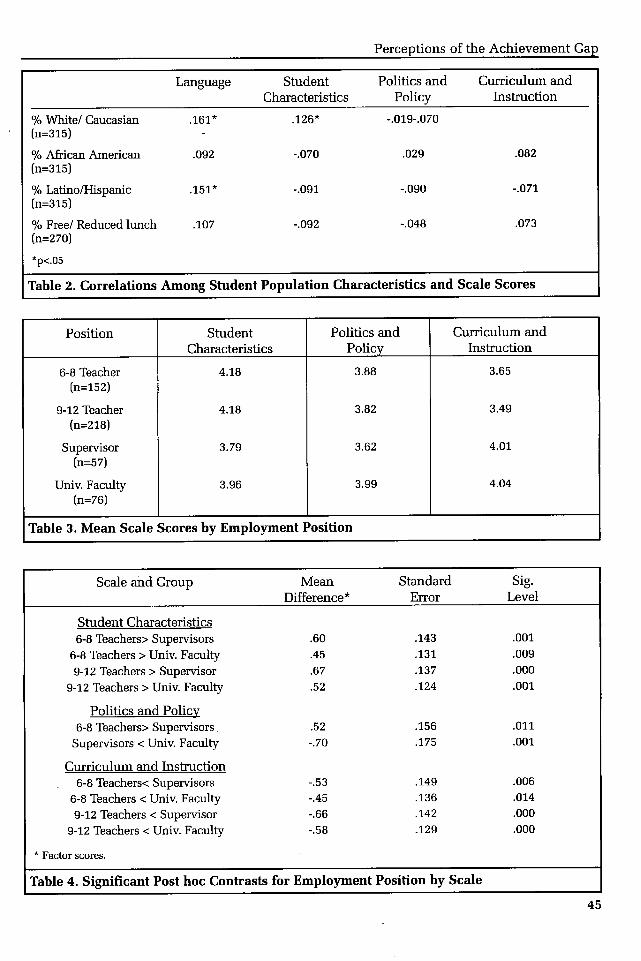
Correlational analyses were conducted to inves-tigate the potential relationships among studentpopulation characteristics (ethnicity and SES)and the four factor scores. Respondents wereasked to report the percentage of students intheir schools by ethnicity. Only the three ethnicgroups that had means greater than 10 percentwere included. The percentage of studentsreceiving free or reduced lunch served as proxyfor SES. As shown in Table 2, three correlationsreached statistical significance. First, there wasa negative correlation between the percentage ofWhite students enrolled and the scores on theLanguage scale (r = -.16, p<.05). The larger thepopulation of White students, the less likelythey were to endorse language as important forexplaining the achievement gap. The oppositewas true for respondents in schools with largeLatino/ Hispanic populations (r = .15, p<.05).The higher the percentage of students in thisethnic group, the more likely it was that respon-dents agreed with the items on the Languagescale. The final significant correlation wasfound between the percentage of White stu-dents and scores on the student characteristicscale (r = .13, p<.05), suggesting that respon-dents in schools with higher percentages ofWhite students were more likely to explain theachievement gap as due to student characteris-tics.
Differences Among Teacher, Supervisor, andUniversity FacultyTo address the question of whether middle orhigh school mathematics teachers' perceptionsof contributors to the achievement gap differedfrom those of district/school mathematicssupervisors or university faculty a MANOVAwas conducted. The independent variable wasemployment position (6-8 grade teacher, 9-12grade teacher, district/ school supervisors, anduniversity faculty) and the dependent variableswere the four factor scores. The results showeda significant multivariate effect for position (F(4, 1422)= 7.54, p<.05) and significant univari-ate effects on the Student Characteristic (F(3,475)=12.21), Politics and Policy (F(3,475)=
6.15, p<.05), and Curriculum and Instruction(F(3,475)= 11.68, p<.05) scales. There were nosignificant interaction effects.
To facilitate interpretation of these results, theoverall mean scores (not factor scores) on thethree scales by position are presented in Table3. Table 4 shows the significant differences inmean factor scores by group and scale. Post hoccontrasts revealed that both middle school andhigh school teachers had significantly highermean ratings on the Student Characteristic scalethan did district/ school supervisors or univer-sity faculty. These findings suggest that whencompared to supervisors or university faculty,mathematics teachers were more likely to attrib-ute the achievement gap to student characteris-tics such as motivation, interest, family support,and intellectual ability. This trend was reversedon the Curriculum and Instruction scale.Supervisors and university faculty were signifi-cantly more likely to attribute the achievementgap to factors related to curriculum and instruc-tion than were middle or high school mathe-matics teachers. There were no significant dif-ferences between middle and high schoolteachers or between supervisors and universityfaculty on either scale. The results on thePolitics and Policy scale again indicated thatmathematics supervisors were significantly lesslikely to attribute the achievement gap to polit-ical and policy variables than were middleschool teachers or university faculty.Supervisors also had lower scores on this scalethan did high school teachers, but this differ-ence did not reach statistical significance.
Suggestions to reduce the achievement gapFour themes-(a) policies, (b) professionaldevelopment and teacher characteristics, (c)curricular changes, and (d) societal influencesand community building-emerged from thesuggestions offered by the secondary mathemat-ics teachers. Funding was frequently interwov-en through all themes.
The policies theme included funding schoolsmore equitably, reducing class sizes, groupingstudents by ability, and eliminating high-stakesstandardized testing. One representative sug-gestion was to "provide adequate funding tocreate small classes guided by well trained and
39
The High School Journal - April/ May 2005
well informed teachers." Several teachers con-tended that homogeneous grouping was appro-priate so that students' individual needs aremet.
The professional development and teachercharacteristics theme focused on improvingteachers' professional knowledge in mathemat-ics content, pedagogy, and ability to work withdiverse students and parents. One representa-tive suggestion follows.
Teachers need more professional develop-ment and better teacher training...Requiring that math teachers take moremath will not help.. .they must be trainedin how to teach math and what the mathconcepts are that they teach, or the mathconcepts that their students are goinglearn.
Another suggestion reflecting this theme wasthe provision of "massive professional develop-ment efforts with teachers hand-in-hand withcommunity education. And all this must besupported with well developed, standards-based curricular materials." Teachers furthersuggested professional development for work-ing with minority and poor students' families.More specifically, some teachers advocatedmore professional development in order tomeet the needs of English Language Learners.One suggested the "use of sheltered instructionfor English Language Learners, including thosewhose first language is English but whose lan-guage development is limited;" another teachersuggested, "have assessment materials that arein multiple languages."
The change in curriculum theme encompassedconflicting suggestions. While many teacherssuggested shifting from basic skills to a stan-dards-based curriculum, many others suggesteda return to basic skills. Teachers in both campsoften advocated for a national mathematics cur-riculum. The call for "the national implementa-tion of NCTM standards, including teachingstandards" was raised by the teachers whoendorsed a national standards-based curricu-lum. "Get back to basics; get back to Saxon styletexts that work towards mastery of skills" was arepresentative comment from teachers endors-ing more basic skills.
A change in societal influences and the build-ing community theme represented strategiessuch as educating parents, building strongerconnections between schools and communities,and eradicating drugs and negative influencethat plague communities. Overwhelmingly,teachers suggested that parent education in howto foster academic success with their homes andcommunities.
Prepare the parents so they can help thestudent and begin to take an active role intheir children's education. The parent hasto be in the home controlling the childand making sure he/she is doing theirassignments and it would help if the par-ent had the necessary education to helpthe child.
After-school community education programs,community based role models or mentors andcommunity support programs for schools werefurther suggested.
DiscussionAlthough secondary mathematics teachersendorsed various explanations for the achieve-ment gap, our results suggest that the most fre-quently endorsed factors were related to stu-dent characteristics. This trend was evident inboth the quantitative ratings and the themesthat emerged from the qualitative data. In par-ticular, differences in students' motivationallevels, work ethic, and family or parent supportwere cited. Given that Black students tend toscore lower on mathematics achievement meas-ures, the perception may be that Black studentsare not as motivated or do not work as hard astheir counterparts in other ethnic groups.However, the NAEP survey findings indicatethat Black students expressed the most positiveattitudes towards mathematics (Struchens &Silver, 2000), reported spending more time onmathematics homework (Lubienski, 2001), andwere similar in their readiness and learningmotivation (Lee 2002) when compared to otherethnic groups. It may be the case that secondaryteachers' perceptions of the motivation andwork ethic of Black or other minority studentsare inaccurate. This may be especially true ofteachers who do not have large numbers ofBlack students in their schools. We found a sig-nificant positive correlation between the per-
40
Perceptions of the Achievement Gap
centage of White students enrolled in therespondents' school and scores on the StudentCharacteristic scale. Perhaps more importantly,the cause of the achievement gap appears to bemore strongly attributed to student factorsrather than more malleable causes that centeron curriculum and instruction.
A related finding was observed when we con-trasted secondary mathematics teachers' ratingswith those of district or school mathematicssupervisors and university faculty who instructprospective teachers. Teachers had significantlyhigher scores on the Student Characteristicscale compared to supervisors and universityfaculty. In contrast, supervisors and universityfaculty had significantly higher scores on theCurriculum and Instruction scale. These resultsindicate that teachers are more likely to attrib-ute the achievement gap to students' character-istics, whereas supervisors and university fac-ulty are more likely to attribute the gap to dif-ferences in the exposure or access to qualitycurriculum and instruction. The supervisorsand university faculty's perceptions are sup-ported by Lubienski's findings (2003) suggest-ing that higher achievement among White stu-dents is explained by more exposure to NCTMstandards based instruction than experiencedby minority students. The implication is a dis-continuity between what supervisors and facul-ty recommend for addressing the achievementgap and mathematics teachers' own perceptionsand expectations for their students. Teachersexpectations of their students and their beliefthat achievement differences are caused bycharacteristics of their students may make itless likely that they will modify their instruc-tional practices to better align with NCTM stan-dards and principles. Similarly, Ferguson(1998) concluded that teachers' expectations,perceptions, and behaviors sustain and evenexpand the gap in achievement between Whiteand Black students.
We uncovered some differences in responsesbased on the demographic characteristics of theschools and districts. The significant correla-tion between the percentage of White studentsenrolled and Student Characteristic scores wasalready discussed. Other significant correla-tions were obtained on the Language scale. Not
surprisingly, respondents in schools with highLatino/Hispanic populations were more likelyto attribute the achievement gap to languageissues, while teachers in mostly White schoolswere less likely to make this attribution. Theseperceptions are supported by Bradby's results(1992), which demonstrated that English lan-guage proficiency was related to mathematicsachievement among Hispanic students. Theonly other school characteristic that yielded asignificant difference was geographic setting.Secondary math teachers working in urbanschools were more likely to agree that factorsrelated to politics and policy influenced theachievement gap when compared to suburbanteachers. It may be the case that public schoolsin urban districts tend to be more diverse andoften segregated in terms of student characteris-tics, with funding inequities more salient.However, this explanation is speculative sincewe could not identify other studies empiricallylinking these factors.
Secondary mathematics teachers offered a myr-iad of suggestions to decrease the achievementgap. One suggestion was to group students intohomogenous ability groups, which is reminis-cent of tracking. Some researchers contend thattracking students based on ability results inlowered expectations and less effective instruc-tional strategies that accelerate rather thanreduce the achievement gap (Oakes & Lipton,1996; Lubienski, 2003). However, some educa-tional programs, geared toward reducing theachievement gap, feature grouping based onachievement levels and have been shown to beeffective (e.g., Slavin 2002). Many teachers fur-ther recommended professional developmentfor teachers as a way to reduce the achievementgap. Foci of professional development opportu-nities included improving knowledge of mathe-matics content, pedagogy, and diverse learners,including English language learners. These rec-ommendations are supported by findings thatrelate effective instructional practices to strongpedagogical and mathematical knowledge ofhighly qualified teachers (Darling-Hammond &Sykes, 2003). Although changes in mathematicscurricula were suggested, there was disagree-ment on the types of changes needed. Somesuggested a movement back to the basic skills,while others advocated a nationwide imple-
41
The High School Journal - April/ May 2005
mentation of NCTM standards that emphasizeshigher order skills such as application, criticalthinking, and problem solving. High-stakes test-ing may be one impetus for the call to a "back tobasics" curriculum associated with more drilland practice rather than application or higherorder thinking, which may be particularly detri-mental to at-risk students (Bol & Nunnery,2004). Another predominate theme thatemerged in teachers' responses was the need toenhance community relations and educate par-ents in order to foster academic success in thehome and community. The suggestion to "edu-cate parents" seems to reflect the cultural deficitmodel (Valdes, 1996), implying that parentsneed to be "fixed." Enhancing conmnunity rela-tions better reflects the position of more liberal,reform minded scholars who attribute much ofthe achievement gap to a mismatch between thestudents' home culture and the dominant cul-ture valued by schools (Delpit, 1995, Hughes,2003). Instead educators might seek to under-stand the cultural differences among familiesrather than "educate parents" as a way to helpstudents succeed.
Our findings represent an initial attempt tounderstand secondary mathematics teachers'perceptions of the causes of the achievementgap and ways to address this gap. It seems plau-sible that efforts to reduce the achievement gapwould be informed by understanding teachers'views and variations between how teachers anddistrict/ school supervisors or university facul-ty perceive the gap. The educators involved indirecting or training teachers tend to have dif-ferent views than do the teachers themselves,with teachers more focused on student charac-teristics than on curriculum and instruction.Perhaps reducing misconceptions or focusingon strategies under educators' control wouldrepresent a first step in reducing the achieve-ment gap.
Although our survey results yielded somepotentially important findings, note of theirlimitations is warranted. First, the generaliz-abilty of findings from NCTM members to allsecondary mathematics teachers is inappropri-ate. Because the response rate was low, the rep-resentativeness of our sample to all NCTM
members is also questionable. However, ourpurpose was not necessarily to generalize to allmath teachers but to get a sense of how they per-ceived the achievement gap and how it mightbe best addressed. Future studies may surveyteachers who are not NCTM members as well asobtain a larger sample of NCTM members.Another direction for future research is to con-duct one on one interviews with secondarymathematics teachers to obtain more in-depth,elaborate descriptions of how they wouldexplain the achievement gap and how to bestaddress it. Their input is invaluable because thesuccess of interventions developed to reducethe achievement gap in mathematics largelyhinges on the efforts of the teachers themselves.
ReferencesBaron, R., Tom, D., & Cooper, H. (1985). Social class,
race, and teacher expectations. In J. B. Dusek (Ed.),Teacher expectancies (pp. 251-269). Hillsdale, NJLawrence Erlbaum.
Berry, m, R. Q. (2004). The Equity Principle through thevoices of African American males. MathematicsTeaching in the Middle School 10(2), 100-103.
Berry, III, R. Q. (2003). Voices of African American MaleMiddle School Students: A Portrait of SuccessfulMiddle School Mathematics Students. UnpublishedDoctoral Dissertation, University of North Carolina atChapel Hill, Chapel Hill, NC.
Bol, L. & Nunnery, J.A. (2004). The impact of high-stakes testing on restructuring efforts in schools serv-ing at risk students. In G. Taylor (Ed.), The impact ofhigh-stakes testing on the academic futures of non-mainstreamed students (pp.101-117). Lewiston, NewYork: Edwin Mellon Press.
Bradby, D. (1992). Language characteristics and aca-demic achievement: A look at Asian and Hispaniceight graders in NELS: 88. Washington, DC: U.S.Department of Education.
Bourdieu, P. (1986). The forms of capital. In J. G.Richardson (Ed) Handbook of theory and research forthe sociology of education (pp. 241-256). New York:Greenwood Press
Burton, L. (1984). Mathematical thinking: The strugglefor meaning. Journal for Research in MathematicsEducation, 15(1), 35-49.
Campbell, J. R., Hombo, C. M., & Mazzeo, J. (2000).NAEP 1999 trends in academic progress: Threedecades of student performance. Washington, DC:OERI U.S. Department of Education
Darling-Hammonds, L. & Sykes, G. (2003) Wanted: Anational teacher supply policy for education: Theright way to meet the "highly qualified teacher" chal-lenge. Education Policy Analysis Archives. 11(33).Retrieved on September 17, 2004 fromhttp://epaa.asu.edu/epaa/v1ln33/.
Delpit, L. (1995). Other people's children: Cultural con-flicts in the classroom. New York: The New Press.
Donaldson, K. (1996). Through students' eyes:Combating racism in United States schools. Westport,CT: Praeger.
42
Perceptions of the Achievement Gap
Dossey, J. A., Mullis, I. V. S., Lindquist, M., &Chambers, D. L. (1988). The mathematics report card.Princeton, NJ: National Assessment of EducationalProgress.
Downey, D.B., & Pribesh, S. (2004). When race matters:Teachers' evaluations of students' classroom behav-ior. Sociology of Education, 77, 267-282.
Fernandez, R M. & Nielson, F. (1986). Bilingualism andHispanic scholastic achievement: Some baselineresults. Social Science Research, 15, 43-70.
Ferguson, R. F. (1998). Teachers perceptions and expec-tations and Black-White test score gap. In C. Jencks &M. Phillips (Eds.) The Black-White test score gap (pp.273-317). Washington DC: Brookings Institution Press
Hughes, S. A. (2003). An early gap in Black-Whitemathematics achievement Holding school and homeaccountable in an affluent city school district. TheUrban Review, 35(4), 297-322.
Johnson, M. L. (1984). Blacks in mathematics: A statusreport. Journal for Research in MathematicsEducation, 15, 145-153.
Jones, L. V., Burton, N. W., & Davenport, E. C. (1984).Monitoring the mathematics achievement of Blackstudents. Journal for Research in MathematicsEducation, 15, 154-164.
Jussium, L., Eccles, J., & Madon, S. (1996). Social per-ceptions, social stereotypes, and teacher expectations:Accuracy and the quest for the powerful self-fulfill-ing prophecy. Advances in experimental social psy-chology 28, 281-287.
Ladson-Billings, G. (1998). Just what is critical race the-ory and what's it doing in a nice field like education?International Journal of Qualitative Studies inEducation, 11(1), 7-24.
Lee, J. (2002). Racial and ethnic achievement gaptrends: Reversing the progress towards equity?Educational Researcher, 31(1), 3-12.
Lee, J. (2004). Multiple facets of inequality in racial andethnic achievement gaps. Peabody Journal ofEducation, 79(2), 51-73.
Lipman, P. (1997). Restructuring in context: A casestudy of teacher participation and the dynamics ofideology, race, and power. American EducationalResearch Journal, 34, 3-37.
Lubienski, S. T. (2001). A second look at mathematicsachievement gaps: Intersections of race, class andgender in NAEP data. Paper presented at theAmerican Educational Research Association, Seattle,WA.
Lubienski, S. T. (2003). A closer look at Black-Whitemathematics gaps: Intersections of race and SES inNAEP achievement and instructional practices data.Journal of Negro Education, 71(4), 269-287.
Malloy, C. E. (1997). Including African American stu-dents in the mathematics community. In J. Trentcosta& M. J. Kenney (Eds.), Multicultural and gender equi-ty in the mathematics classroom: The gift of diversity(pp. 23-33). Reston, VA: NCTM.
Martin, D. B. (2000). Mathematics success and failureamong African-American youth: The roles of socio-historical context, communityforces, school influ-ence, and individual agency. Mahwah, NJ. LawrenceErlbaum Associates.
Mickelson, R. A. (2001). Subverting Swann: First- andsecond-generation segregation in the Charlotte-Mecklenburg Schools. American EducationalResearch Journal, 38(2), 215-252.
Oakes, J. (1990). Opportunities, achievement andchoice: Women and minority students in science andmathematics. In C. Cazden (Ed.), Review of researchin education, 16 (pp. 153-222). Washington, DC:American Educational Research Association.
Oakes, J., & Lipton, M. (1996). Developing alternativesto tracking and grading. In L. I. Rendon & R. 0. Hope(Eds.), Educating a new majority: transformingAmerica's educational system for diversity. SanFrancisco: Jossey-Bass.
Orr, A. (2003). Black-White differences in achievement:The importance of wealth. Sociology of Education,76(October), 281-304.
Schoenfeld, A. (2002). Making mathematics work for allchildren: Issues of standards, testing, and equity.Educational Researcher, 31 (1), 13-25.
Secada, W. (1992). Race, ethnicity, social class, languageand achievement in mathematics. In D. Grouws (Ed.),Handbook of research on mathematics teaching andlearning (pp. 146-164). New York: Macmillian.
Slavin, R. E., (2002). Mounting evidence supports theachievement effects of Success for All. Phi DeltaKappan, 83, 469-471, 480.
Strutchens, M. E., & Silver, E. A. (2000). NAEP findingsregarding race/ethnicity: Students' performance,school experiences, and attitudes and beliefs. In E. A.Silver & P. A. Kenney (Eds.), Results from the seventhmathematics assessment of the National Assessmentof Educational Progress (pp. 45-72). Reston, VA:NCTM.
Tate, W. F. (1997a). Critical race theory and education:History, theory and implications. In M. Apple (Ed.),Review of Research in Education (pp. 195-247).Washington, D.C.: American Educational ResearchAssociation.
Tate, W. F. (1997b). Race ethnicity, SES, gender and lan-guage proficiency trends in mathematics achieve-ment: An update. Journal for Research inMathematics Education, 28(6), 652-679.
Thompson, C. L., & O'Quinn, S. D. (2001). Eliminatingthe Black-White achievement gap: A summary ofresearch. Chapel Hill: The North Carolina EducationResearch Council.
Valdes, G. (1996). Con respecto: Bridging the distancebetween culturally diverse families and schools. NewYork, NY: Teachers College Press.
Viadero, D. (2000). Lags in minority achievement defytraditional explanations. Education Week [on-line].Available: http://www.edweek.org/ew/ewstory.Cfm?slug=28causes.hl9.
Wenglinsky, H. (2004) Closing the racial achievementgap: The role of reforming instructional practices.Education Policy Analysis Archives, 12(64). Retrieved[date] from http://epaa.asu.edu/epaa/vl2n64/.
Wirt, J., Choy, S., Rooney, P., Provasnik, S., Sen, A., &Tobin, R. (2004). The condition of education 2004(NCES 2004-077). Washington, DC: U.S. Departmentof Education; Institute of Education Sciences.
E88
43
The High School Journal - April/ May 2005
n Mean* Standard deviation
LanguageTeacher preparation to teach LEP/ESL/bilingual studentshas an impact on student achievement.
There are language barriers in mathematics curriculamaterials (e.g. textbooks)
Language baffiers impede effective communicationsof mathematics concepts.
Standardized tests/assessments are biased in terms oflanguage used.
Language difficulties hinder performance onstandardized tests.
Overall
362 3.74
369 3.45
369 3.64
368 3.43
368 3.95
3.64
Student CharacteristicsNegative peer pressure causes some groups ofstudents to not to want to do well in school.
Students with strong family support almost 368always do better academically.
Some students are more motivated to learn than otherstudents.
Students' intellectual ability is a factor that contributesto the achievement gap.
Students' interest in mathematics and related areas (i.e.,technology, science, etc.) contributes to the achievement gap.
Work ethics of students is a factor that causes somestudents to do well thus impacting the achievement gap.
Overall
370 4.16
4.50 .69
369 4.62
369 3.45
367
366
3.89
4.46
4.18
Politics and PolicySocioeconomic status plays a major role in student achievement.
Standardized testing contributes to the achievement gapbecause it does not accurately measure what somestudents know and can do in mathematics.
The location of schools (urban, suburban or rural) plays arole in the achievement gap.
Differentials in funding allocations lead to a differential inlearning outcomes among students.
Overall
370
370
4.08
3.63
369 3.81
363 3.23
3.84
Curriculum and InstructionTeachers have different expectations about the mathematicsability of some student groups.
There is unequal access to quality curricula materials.
Teachers' beliefs and commitment to equity contributeeither positively or negatively to the achievement gapamong groups of students.
Overall
370 3.46
370
368
3.31
3.91
3.56
*Based on a five-point scale.
Table 1. Descriptive Statistics for Items by Scale
44
Scale/ Item
.81
.95
.90
1.04
.84
.78
.55
1.04
.73
.67
.89
1.13
.92
.92
1.02
1.23
.87
Perceptions of the Achievement Gap
StudentCharacteristics
Politics andPolicy
Curriculum andInstruction
% White/ Caucasian(n=315)
% African American(n=315)
% Latino/Hispanic(n=315)
% Free/ Reduced lunch(n=270)
.161*
.092
.151*
.107
.126*
-.070
-.091
-.092
-.019-.070
.029
-.090
-.048
.082
-.071
.073
*p<. 05
Table 2. Correlations Among Student Population Characteristics and Scale Scores
Position Student Politics and Curriculum andCharacteristics Policy Instruction
6-8 Teacher 4.18 3.88 3.65(n=152)
9-12 Teacher 4.18 3.82 3.49(n=218)
Supervisor 3.79 3.62 4.01(n=57)
Univ. Faculty 3.96 3.99 4.04(n=76)
Table 3. Mean Scale Scores by Employment Position
Scale and Group Mean Standard Sig.Difference* Error Level
Student Characteristics6-8 Teachers> Supervisors .60 .143 .001
6-8 Teachers > Univ. Faculty .45 .131 .0099-12 Teachers > Supervisor .67 .137 .000
9-12 Teachers > Univ. Faculty .52 .124 .001
Politics and Policy6-8 Teachers> Supervisors .52 .156 .011
Supervisors < Univ. Faculty -.70 .175 .001
Curriculum and Instruction6-8 Teachers< Supervisors -.53 .149 .006
6-8 Teachers < Univ. Faculty -.45 .136 .014
9-12 Teachers < Supervisor -.66 .142 .000
9-12 Teachers < Univ. Faculty -.58 .129 .000
* Factor scores.
Table 4. Significant Post hoc Contrasts for Employment Position by Scale
45
Language
COPYRIGHT INFORMATION
TITLE: Secondary Mathematics Teachers’ Perceptions of theAchievement Gap
SOURCE: High Sch J 88 no4 Ap/My 2005WN: 0509103012005
The magazine publisher is the copyright holder of this article and itis reproduced with permission. Further reproduction of this article inviolation of the copyright is prohibited. To contact the publisher:http://www.uncpress.unc.edu/
Copyright 1982-2005 The H.W. Wilson Company. All rights reserved.