secondary and primary education in jamaica: … secondary and primary education in jamaica:...
TRANSCRIPT
1
Secondary and Primary Education in Jamaica: Financial Requirements for Quality
Peter-John Gordon
Dept. of Economics University of the West Indies (Mona)
May 2012
In attempting to discuss the financing of the education system in Jamaica we must first postulate what
we think the idea school should look like. This exercise will not seek to address the issue of financing the
central administrative cost of the education system, i.e. the cost of running the Ministry of Education.
We make no attempt to cost the transition from where we are to where we want to be. What we do is
to construct what we perceive to be a reasonable school system and ask ourselves what it would cost to
maintain such a system; we therefore jump immediately to the desired configuration.
We are concerned only with the operation of the school, not the provision of welfare services through
the school. This means that we do not consider the provision of meals or textbooks, or other welfare
services, all of which might be vital for the success of the educational process, but which are strictly
speaking outside of the central mandate of a school.
High School
We start with the secondary system. We do not consider boarding schools. Our model high school will
consist of 1,500 students, distributed as follows: 300 (20%) in the sixth form and 1,200 (80%) between
Grades 7 – 11. The average class size in the sixth form is 25 while between Grades 7 – 11 it is 35. The
average class size throughout the school is therefore 33. Our model school therefore has 7 streams in
each grade between Grades 7 – 11. It is assumed that 150 students enter the 6th form each year i.e.
62.5% of the Grade 11 cohort.
The current secondary system has 246,965 students (2010/11) of which 8,798 are in sixth form i.e. 3.6%,
a far cry from the targeted 20%. Not all of the current students are in designated secondary institutions.
6,233 are in All Age Schools (158) and 17,300 are in Primary & Junior High Schools (87). The secondary
education system should seek to educate all secondary students in designated secondary school i.e. the
approximately 23,500 students of secondary age who are currently housed in All Age and Primary &
Junior High Schools should be transferred to designated secondary institutions. The shift system should
also be ended and these students transferred to institutions with regular school hours. There are
currently 107 institutions operating the shift system – 25 primary; 9 all age; 32 primary & junior high; 40
secondary high; and 1 technical high. We do not know the precise number of students being educated
on a second shift. This number does not affect our steady state funding estimates; what it affects is the
transition path from where we are to where we would like to go.
Based on our assumption of 1,500 students being the ideal school size, the current secondary school
population would require 165 schools. There are currently 165 designated secondary schools in the

2
public education system – 149 secondary high, 14 technical high and 2 agricultural schools. Because the
population is not uniformly distribution throughout the country we cannot assume that our simply math
implies that we do not need any additional schools. If schools were to be built to accommodate the
23,500 secondary students who are not in designated secondary schools we would need an additional
16 schools. It is therefore reasonable that we require additional schools in the range of 0 – 16.
Demographic data and existing capacity would have to be used to identify the precise number of
additional schools needed. Expansion of some existing schools might be possible to absorb some
students, rather than the construction of ‘greenfield’ schools.
The pupil/teacher ratio in our model school is 19:1. This means that in our 1,500 pupil school there will
be 79 teachers, inclusive of a principal, 2 vice principals, 1 librarian and 2 guidance counselors (we do
not take account of teachers on leave). The current pupil/teacher ratio in exclusively designated
secondary schools is 19.02:1 (19.2:1 in secondary high; 17:8 in technical high and 10:1 in agricultural
high – these figures include teachers on leave). There are 581 teachers in the All Age Schools who teach
secondary students and 1,337 in the Primary & Junior High Schools. The pupil/teacher ratio in these
schools combined is 12.2:1. Great care must be exercised in interpreting this number as it is very likely
that these teachers also teach at the primary level, so the ratio would be greatly understated.
Our model school will have all teachers being trained university graduates. The current state of affairs is
that 44% of all teachers teaching at the secondary level have this level of education/training. Both All
Age and Primary & Junior High Schools have 47% of their teachers so trained; Secondary High Schools
have 44% while Technical High and Agricultural High Schools have 40% and 33% respectively.
In our model school 30% of teachers (excluding principal and vice principals) will be senior teachers.
Currently 17% of teachers who teach secondary students are senior teachers. 18% of the teachers in the
Technical High and Secondary High Schools are senior teachers while 14% of teachers in Agricultural
High and 11% in All Age Schools are senior teachers.
In order to estimate academic staff cost per annum we take the current salary scale as given, make
adjustments for inflation and make assumptions as to where on the scale the ‘average’ teacher would
fall. All academic staff salaries are calculated using the 2008/2010 Heads of Agreement between the
Ministries of Finance and the Public Services and Education on the one hand, and the Jamaica Teachers’
Association representing teachers in the government service on the other hand. The contract period is
from April 2008 to March 31, 2010. These staff cost are adjusted for inflation first to March 2011 (7.9%)
and then to March 2012 (7.3%).
Personnel Cost
Academic
Principal
We assume that the average principal is a principal of a Secondary III school being paid at the 4th
increment of a 6 increment scale. All values given below are in J$.

3
Basic Salary
2,710,821
Housing
372,118
Travelling
142,405
Special Teachers' Allowance 493,224
Special Responsibility 139,099
Book Allowance
117,282
Total
3,974,949
Vice Principal
We assume that a vice principal is at the 4th increment of a 6 increment scale.
Basic Salary
2,033,394
Housing
279,126
Travelling
142,405
Special Teachers' Allowance 221,033
Special Responsibility 139,099
Book Allowance
117,282
Total
2,932,339
Senior Teacher
We assume that a senior teacher is at the 9th increment on an 11 increment scale
Basic Salary
1,429,114
Travelling
142,405
Special Teachers' Allowance 41,419
Special Responsibility 139,099
Book Allowance
117,282
Total
1,869,319
Teacher
The assumption is the teacher is at the 4th increment on an 11 increment scale
Basic Salary
1,281,777
Special Teachers' Allowance 365,825
Book Allowance
117,282
Total
1,764,884
Given our assumption that 30% of the teachers (excluding the principal and vice principals) will be senior
teachers, our representative teacher is 0.3(senior teacher) + 0.7(teacher). Such a representative teacher
will receive emoluments valued at $1,796,215 (= 0.3(1,869,319) + 0.7(1,764,884)) per annum.

4
Academic staff cost at our model high school is given in the table below
Academic Staff Cost
Numbers Position Per unit cost J$ Cost J$
1 Principal 3,974,949 3,974,949
2 Vice Principal 2,932,339 5,864,678
76 Teachers 1,796,214 136,512,302
NIS
2,429,442
NHT
4,383,240
Total
153,164,601
Administration
Administrative salaries were not taken as given. In our model school these payments are varied. We
will attempt to justify the recommendations which we make.
Secretary/Bursar
The position of Secretary/Bursar should be raised to the level of a Vice Principal. This person is in charge
of the administrative arm of the school. Overall responsibility for the running of the school resides with
the principal. The bursar should report to the principal and should be put in charge of all the support
services in the school – accounting, human resource management, property and grounds, security,
record keeping and any other administrative function. Current salary levels of approximately $1.2
million (adjusted for inflation) are totally inadequate for the scale of responsibility. At these salary levels
it is unlikely that a school will be able to attract/retain the skill set required to carry out this function
effectively.
Assistant Bursar
An assistant bursar should be paid at the same level of a teacher. The broad scope of oversight which
the bursar has is likely to require some delegation to an assistant bursary. Current levels of
approximately $831,000 (adjusted for inflation) will definitely not attract the required skill set.
Registrar
Each school should have a registrar paid at the level of a teacher. The role of the registrar is going to be
vital if the teaching staff is to have immediate access to each student’s history. The registrar in a school
should be versed in Information Technology, be competent in storing, retrieving and manipulating data.
Without current information being always accessible the ability to design a targeted response to each
student’s need in a timely fashion becomes impossible. The current remuneration of approximately
$650,000 is very unlikely to deliver a person who is to become the information centre of the school.
This person could also be relied upon to keep personnel records.
School Nurse
Currently nurses are paid the basic pay of nurses in the government service (approximately $930,000).
However nurses in the public hospitals and other public facilities are able to earn sessional payments

5
which results in the salary package for a school nurse being very uncompetitive. The result is that
nurses tend to spend a very short period of time as a school nurse. It is proposed that nurses be paid at
the level of a teacher.
Plant Manager
A school is a complex plant, which requires many different things to keep the school functions smoothly.
Children tend to be more destructive than adults, so within a school things are constantly being broken
and in need of repair. A plant manager is required to ensure the smooth functioning of the school plant
and equipment, inclusive of esthetics. A person who can interact with and contact tradesmen and who
therefore have some knowledge of estate management, pluming, carpentry, metal work, electrical
issues is required. This person cannot be seen as a low level ancillary worker. This person is a vital part
of the administrative structure of a school. It is proposed that a salary of $1 million be attached to this
post.
Our model high school would incur the following staff cost for administration
Administrative Staff Cost
Number Position Unit Cost J$ Cost J$
1 Bursar 2,932,339 2,932,339
2 Assist. Bursars 1,764,884 3,529,768
1 Registrar 1,764,884 1,764,884
1 Plant Manager 1,000,000 1,000,000
1 Nurse 1,764,884 1,764,884
4 Secretaries 950,000 3,800,000
2 Lab Technicians 600,000 1,200,000
1 Library Assistant 600,000 600,000
3 Clerical Assistants 600,000 1,800,000
NIS
454,279
NHT
545,135
Total
19,391,289
Ancillary
Ancillary Staff costing are presented in the table below
Ancillary Staff Cost
Number Position Per Unit Cost J$ Cost J$
6 Cleaners 438,284 2,629,704
5 Grounds men 438,284 2,191,420
4 Watchmen 462,305 1,849,220
1 Messenger 407,038 407,038
NIS
176,935
NHT
212,251
Total
7,466,567

6
Administrative Expenses
There are some costs which a school must incur which are not related to the personnel cost of the
people employed to the school. These we have chosen to collective call Administrative Expenses.
Included in this category are utility bills (electricity, water, and telephone), supplies for the school –
cleaning material, toiletries, stationary, security etc. We estimate these costs for our model high school
to be $30 million per annum
Teaching/Learning Supplies
These inputs are vital for the school’s primary mission. This category includes material for laboratories,
libraries, classroom material (chalk/markers, duster, maps etc). We estimate these expenditures for our
model school to be $6 million per annum.
Co-curricular Expenditure
Spending on this category throughout the secondary school system is very uneven. There are school
with highly developed sports programme (including school challenge quiz), and those which have well
established cultural programmes (choir, orchestra, dance groups) which utilize vast amount of resources
in keeping these programmes going and which incur significant expenses in moving these groups
around the island (or even overseas). Many of these schools spend significantly in excess of our
recommendation. We are however trying to estimate what it would cost to have a vibrant co- curricular
programme which would give each student an opportunity to be involved meaningful in something. We
estimate that a co-curricular budget of $8 million should give students of our model school a very rich
sports/cultural/service experience. The idea is to try to get as many students are possible involved in
some activity outside of the classroom as these activities are essential complements to the classroom
and through which much of the social aspect of education is transmitted.
Maintenance Cost
We estimate a depreciation rate of 7.5% per annum. Maintenance would therefore require that each
school spends 7.5% of the replacement cost of the school each year on maintenance. We estimate that
the cost of building a school which would accommodate 1500 students is $700 million. This would mean
that the annual maintenance cost for our model school would be $52.5 million.

7
Estimated Cost of Operating Our Model High School
The table below summarizes the cost of operating our model school for a year.
Estimate for the Operation of the Model High School
Cost J$ Cost per Student J$
Total Staff Cost 180,022,457 120,015
Academic Staff 153,164,601 102,110
Administrative Staff 19,391,289 12,928
Ancillary Staff 7,466,567 4,978
Administrative Expenses 30,000,000 20,000
Teaching Supplies 6,000,000 4,000
Co-curricular Expenditure 8,000,000 5,333
Total Recurrent Expenditure 224,022,457 149,348
Maintenance 52,500,000 35,000
Total Annual Cost 276,522,457 184,348
Note that these estimates do not include cost of teachers on leave, any welfare programmes delivered
through the school (school feeding or school books) or the cost for any net addition to the capital stock
of the school.
Progression through the Secondary System
Our data indicate the following distribution of students by grade throughout the secondary system
Grades
7 8 9 10 11 12 13
Actual Enrolment 46,292 47,613 54,395 46,057 42,679 6,007 3,932
Estimated Enrolment without repeaters 46,152 47,646 53,664 46,437 41,605 7,526 3945
This information is presented graphically below

8
The estimation of the grade population without repeaters is based on subtracting the repeaters of a
particular grade from the grade population and adding them to the grade population of the higher
grade. This is a crude estimate assuming that the number of repeaters remain roughly the same from
year to year. The highest numbers of repeaters occur at Grade 11 (1,532) and Grade 9 (838). According
to the data for 2010/11 the expected population of Grade 8 was approximately 1,500 more than the
expected population of Grade 7. The expected population of Grade 9 was approximately 6,000 more
than the expected population of Grade 8. It is difficult to explain such large differences in the grade
populations since population bulges are not expected to be so significant in a one year period. The
population of Grade 9 students housed in All Age and Primary & Junior High Schools is approximately
9,100. The Grade 9 population in these schools is approximately 1,500 more than the Grade 8
population. Of the overall difference of 6,000 students between Grades 8 and 9, the All Age and Primary
& Junior High schools accounted for a quarter.
The grade population falls by approximately 12,000 between Grades 9 and 11. This is very significant. If
we think that the Grade 9 bulge is artificial and instead use the Grade 8 figure as a more representative
number of what the expected population of Grade 9 should be, there is still an approximately 6,000 fall
in the student population between Grades 9 and 11. The attrition rate between Grades 9 and 11 is high.
It is not unreasonable to assume that a significant part of the 12,000 difference between Grades 9 and
11 are accounted for by students coming from the All Age and Primary & Junior High Schools. These
0
10000
20000
30000
40000
50000
60000
7 8 9 10 11 12 13
Grade
Enrolment by Grade
Actual Enrolment Estimate of Emrolment without Repeaters

9
students would have finished the lower cycle of the secondary system in these schools but would have
had to transfer to other schools for the upper cycle, since All Age and Primary & Junior High Schools do
not offer the upper cycle. The secondary system is in need of approximately 6,000 additional spaces in
Grade 11, if the attrition rate between Grade 9 and Grade 11 is to fall to zero. Likewise an additional
1,200 spaces would be required for Grade 10.
Costing of the Entire Secondary System
Using our estimate of $184,348 as the cost of educating each secondary student we estimate the cost of
educating the total existing student population for a year. We also simulate the replication of our model
school throughout the secondary system and cost it. We assume:
1) We move all students not in exclusively designated secondary institutions into such institutions;
2) We take the average of the Grade 7 and Grade 8 population as the ‘normal’ cohort of students
entering the secondary system each year and we project that population over 5 years of
secondary schooling;
3) We also promote 62.5% of the Grade 11 cohort into sixth form (Grades 12 and 13) for two years.
4) Repetition rate is held at the current level of 1.125%.
Our simulation assumes a grade population of 46,960 in each grade between 7 and 11 i.e. a total
student population between Grades 7 – 11 of 234,800. We assume a sixth form population of 58,700.
This would mean a total high school population of 293,500. If we allow repeating at the current rate of
1.125% this would move the high school population to 297,200.
Number of Students Total Cost $million
Existing 246,975 45,530
Simulation 297,200 54,788
The Estimates of Expenditure for the Fiscal Year 2011/12 had the Government of Jamaica allocating
$22,744 million to the secondary sector. This sum represents 50% of what we estimate it would take to
educate existing secondary school students according to the model we have outlined above. If we were
able to retain the entire secondary age population for grades 7 – 11 and a six form population of 20% of
the entire secondary school system, the current allocation would amount to 41.5% of the required
funding.
Using our estimated cost of $184,348 per student at the secondary level and our estimate that the
government is only supplying approximately half of this amount, the question must be raised as to
additional sources of funding. Cost sharing must be considered. If parents were asked to bear directly
10% of the cost of a child’s education at high school this would require a payment of $18,435 per
annum. A payment plan where parents pay in three installments would mean a payment of $6,145 each
term per child. A 15% contribution would mean $27, 653 per year or $9,218 per term. Whatever the
figure chosen there will be some parents who either cannot or will not pay. Since there is a social

10
benefit to education the option of exclusion cannot be pursued. The government will therefore have to
pay for those who are unable to pay. What the market can bear is as much a political as well as an
economic question. There needs to be some coalescing in the society around the idea that parents will
have to bear directly a portion of the cost of secondary schools. The society needs to understand that
the better resourced schools do not rely exclusively on the government for resources. If a significant
portion of the population does not contribute to the cost of running the high schools which their
children attend, the gulf between the high performing secondary schools and the others will continue.
This is the single biggest reason for the intense competition at Grade 6 for placements in secondary
schools – the relatively small percentage of well-resourced and therefore high performing secondary
schools.
Canteens can be outsourced with a concessionaire fee paid to the school. Such a model would relieve
the school of administrative cost of managing canteens. We estimate that a school with a population of
15,000 should be able to command a concessionaire fee of approximately $10 million per annum.
Should schools implement a 10% cost-sharing scheme as well as outsource their canteen operations we
estimate that they would be able to collect approximately 14% of the cost of running the school. This
with 50% coming from the government would mean that there is a short fall of approximately 36%. If
the cost-sharing was 20% and there was full compliance, this along with the canteen earning would
mean that the school would be able to raise 24% of its financing cost, leaving a deficit of 26%. Of course
these figures represent upper bounds, and further refinements would have to be made to estimate the
extent of compliance and hence the amount of additional resources which would actually flow into the
schools. Some amount of deficit will still exist, probably somewhere between 30% and 40%. It might be
impossible to close this gap financially, and therefore it will be closed in terms of quality i.e. we might
not be able to get to our model school but must be satisfied at this time with something less.
Improvements in the funding prospects for the secondary system will improve with overall economic
expansion. If the economy grows on average by 3% per annum, all other things remaining constant in 9
years the government would be able to spend 30% more on education than it currently spends (if the
average growth rate is 2% it will take 14 years). Economic growth not only implies that the government
is able to spend more, but also that parents are in a better position to contribute a larger share of the
cost of their children’s education. It might therefore not be unrealistic to think that the country over the
next 10 to 20 years will be in a position to finance a more equitable high quality secondary system.
It is common in countries which seek to expand education that they first concentrate on access, largely
ignoring quality, at first. After sufficient progress has been made on access, education policy makers
turn their attention to the issue of quality. Jamaica has had fairly good access at the primary level for a
very long time, and now enjoys significant improvement in access at the secondary level. There is great
disparity in output from different schools, which indicates that the issue of system-wide quality needs to
be addressed.

11
Primary School
We start with our ideal primary school consisting of 450 students. Currently primary education is
delivered in four types of institutions: Primary Schools (grades 1-6 and public); Preparatory Schools
(grades 1-6 and private); All Age Schools (grades 1-9); and Primary & Junior High Schools (grades 1-9)
both public institutions. The average class size in our model school will be 25 students. The
student/teacher ratio in such a school is 21.4:1 (this does not include teachers on leave). Included in the
teacher corps are a principal, a vice principal, a guidance counselor and a librarian (teachers on leave are
not included). It is assumed that the vice-principal is also a classroom teacher. The current
student/teacher ratios are: Primary 24.6:1; All Age – 24:1; Primary & Junior High – 25.5:1; and
Preparatory – 16:1. For the public system it is 24.6:1 (these figures exclude teachers on leave and
administrators). In our configuration of the educational system, public primary education would be
delivered exclusively in primary schools.
We make the same assumption about a primary school teacher as we do about a high school teacher i.e.
the teacher is a trained graduate. Currently 42% of teachers teaching at the primary level are so trained
(42% in Primary Schools; 40% in All Age Schools; 46% in Primary & Junior High).
Personnel Cost
Academic
Principal
We assume that the average principal is a principal of a Primary III school being paid at the 4th increment
of a 6 increment scale. We use the rates given in the Heads of Agreement concluded between the
Ministries of Finance and the Public Service, and Education on the one hand and the Jamaica Teachers’
Association on the other dated October 28, 2008 (adjusted for inflation). All values given below are in
J$.
Basic Salary
2,064,407
Housing
280,205
Travelling
142,405
Special Teachers' Allowance 61,738
Special Responsibility 139,099
Book Allowance
117,282
Total
2,805,136

12
Vice Principal
We assume that a vice principal is at the 4th increment of a 6 increment scale.
Basic Salary
1,563,391
Housing
214,663
Travelling
142,405
Special Teachers' Allowance 61,738
Special Responsibility 139,099
Book Allowance
117,282
Total
2,238,578
We further adjust the Special Teachers’ Allowance payable to vice principals to the level paid to
principals to sufficiently differentiate the payments to a vice principal and a teacher.
We assume the same rate of pay for teachers in the primary schools as in high schools. We also assume
the same ratio of senior teachers to junior teacher. The average cost of a teacher is therefore
$1,796,215 per annum
Academic staff cost at our model Primary school is given in the table below
Academic Staff Cost
Numbers Position Per unit cost J$ Cost J$
1 Principal 2,805,136 2,805,136
1 Vice Principal 2,238,578 2,238,578
19 Teachers 1,796,214 34,128,006
NIS
620,434
NHT
1,119,398
Total
40,911,613
Administration
The administrative staff cost for our model school are as follows:
Administrative Staff Cost
Number Position Unit Cost J$ Cost J$
1 Bursar/Registrar 2,238,578 2,238,578
1 Maintenance Manager 750,000 750,000
1 Nurse 1,764,884 1,764,884
1 Secretary 950,000 950,000
2 Clerical Assistants 600,000 1,200,000
NIS
170,515
NHT
204,618
Total
7,278,596

13
For the primary school we do not designate a plant manager, instead we use a maintenance manager –
a different nomenclature is used to indicate that the tasks required of this person at a primary school is
likely to be less onerous than his/her counterpart at a high school.
Ancillary
Ancillary Staff costing are presented in the table below
Ancillary Staff Cost
Number Position Per Unit Cost J$ Cost J$
2 Cleaners 438,284 876,568
2 Grounds men 438,284 876,568
2 Watchmen 462,305 924,610
1 Messenger 407,038 407,038
NIS
77,120
NHT
92,512
Total
3,254,416
Administrative Expenses
Our estimate for administrative expenses (non-salary cost) for our model primary school is $4.5 million
per year. This will cover utility bills, cleaning material, stationery etc.
Teaching/Learning Supplies
We estimate the cost for teaching/learning supplies to be $1.8 million.
Co-curricular Expenditure
Co-curricular activities are estimated to cost $1.8 million.
Maintenance Cost
In estimating the maintenance cost of our model primary school we make the assumption that a primary
school student utilizes approximately 50 percent of the space utilized by a high school student. A high
school has more space dedicated to specific activities – science laboratories, gymnasiums, auditoriums
etc. For a high school student we estimated a maintenance cost of $35,000 per student. We estimate a
maintenance cost at primary school of $18,000 per student (making allowance for diseconomies of
scale).

14
Estimated Cost of Operating Our Model Primary School
The table below summarizes the cost of operating our model primary school for a year.
Estimate for the Operation of the Model Primary School
Cost J$ Cost per Student J$
Total Staff Cost 51,444,625 114,321
Academic Staff 40,911,613 90,914
Administrative Staff 7,278,596 16,175
Ancillary Staff 3,254,416 7,232
Administrative Expenses 4,500,000 10,000
Teaching Supplies 1,800,000 4,000
Co-curricular Expenditure 1,500,000 3,333
Total Recurrent Expenditure 59,244,625 131,655
Maintenance 8,100,000 18,000
Total Annual Cost 67,344,625 149,655
Note that these estimates do not include cost of teachers on leave, any welfare programmes delivered
through the school (school feeding or school books) or the cost for any net addition to the capital stock
of the school.
Costing of the Entire Primary System
Currently there are 273,802 primary students (grades 1-6) distributed as follows:
Primary Schools 191,557
All Age Schools 33,101
Primary & Junior High 33,924
Total Public Primary System 256,582
Preparatory 15,220
Total 273,802
We are concerned with the public education system. Some parents will choose private education for
their children. At an annual cost of $149,655/student the entire public primary system would cost
$38,698 million.
Currently 3.4% (8,789) of the primary students in the public system repeat a grade annually (3% -
Primary; 5.5% - All Age; 3.5% - Primary & Junior High).

15
Repetition by grade for 2010/11 is presented below
Repetition by Grade 2010/11
Grade 1 Grade 2 Grade 3 Grade 4 Grade 5 Grade 6
1,664 543 493 581 860 4,648
Allowing for such a repeat rate adds $1,315 million to the primary budget i.e. if there were no repeaters
the annual primary school budget would be approximately $37,383 million. The following table
summarizes this information.
Number of Students Cost ($ million)
Current Situation (3.4% repeaters) 256,582 38,698
No repeaters 249,796 37,383
It might be cheaper to put in place mechanisms which reduce repeaters than incurring the cost of
$1,315 million annually to accommodate them.
The estimates of expenditure for the fiscal year 2011/12 had the Government of Jamaica allocating
$21,854 million to the primary education sector. This represents 56.5% of our estimated cost of what it
should take to educate the students currently in the public primary system. The notion of a ‘free’
primary education system has been practiced in Jamaica for a very long time. This has led to a sparsity
of resources. Approximately 5.6% of the children of primary school age are being educated in the
private sector (prep schools). Politically, it might be impossible to impose user fees at the primary level.
The resourcing of this sector might be more dependent on improvements in public finances than the
secondary or tertiary levels.
Comparison between the cost of our model Primary and High Schools
For ease of comparison we present below tables of our model primary and secondary schools.
Comparison between cost (J$)of model high and primary schools
High School
Share %
Primary School
Share %
Raito High:Primary
Total Staff Cost 180,022,457 65.1 51,444,625 76.4 3.5
Academic Staff 153,164,601 55.4 40,911,613 60.7 3.7
Administrative Staff 19,391,289 7.0 7,278,596 10.8 2.7
Ancillary Staff 7,466,567 2.7 3,254,416 4.8 2.3
Administrative Expenses 30,000,000 10.4 4,500,000 6.7 6.7
Teaching Supplies 6,000,000 2.2 1,800,000 2.7 3.3
Co-curricular Expenditure 8,000,000 2.9 1,500,000 2.2 5.3
Total Recurrent Expenditure 224,022,457 81.0 59,244,625 88.0 3.7
Maintenance 52,500,000 19.0 8,100,000 12.0 6.5
Total Annual Cost 276,522,457 100 67,344,625 100 4.1
16
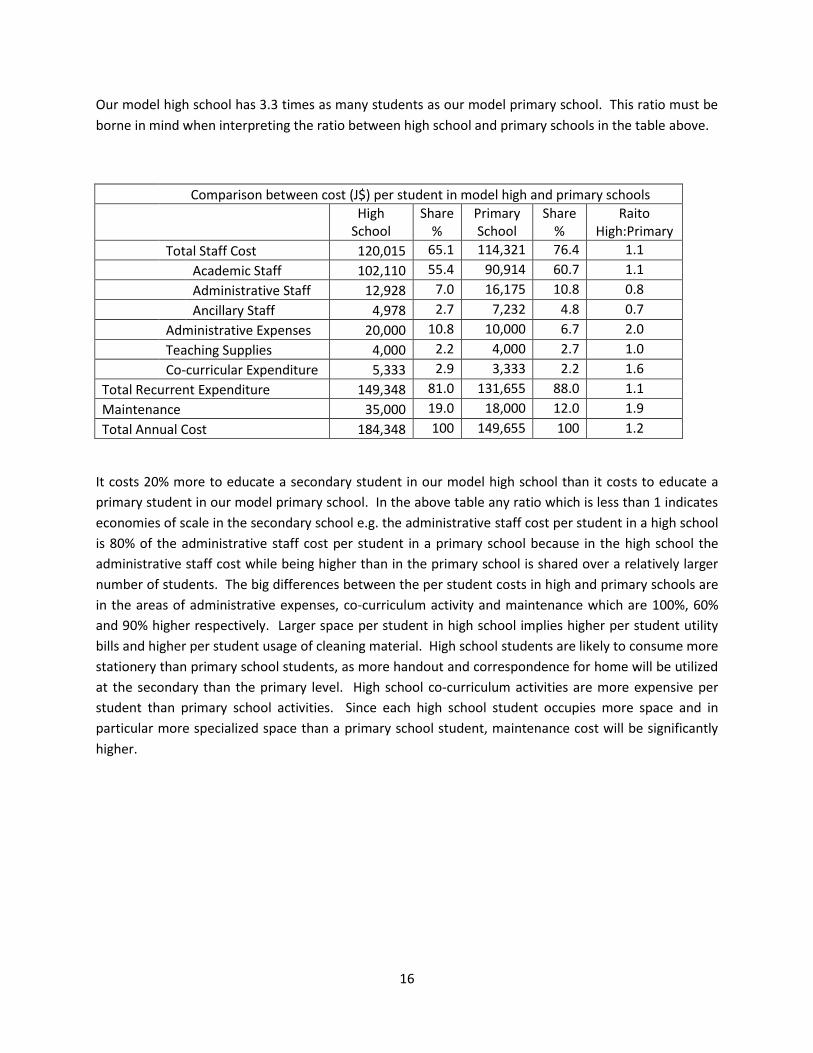
Our model high school has 3.3 times as many students as our model primary school. This ratio must be
borne in mind when interpreting the ratio between high school and primary schools in the table above.
Comparison between cost (J$) per student in model high and primary schools
High School
Share %
Primary School
Share %
Raito High:Primary
Total Staff Cost 120,015 65.1 114,321 76.4 1.1
Academic Staff 102,110 55.4 90,914 60.7 1.1
Administrative Staff 12,928 7.0 16,175 10.8 0.8
Ancillary Staff 4,978 2.7 7,232 4.8 0.7
Administrative Expenses 20,000 10.8 10,000 6.7 2.0
Teaching Supplies 4,000 2.2 4,000 2.7 1.0
Co-curricular Expenditure 5,333 2.9 3,333 2.2 1.6
Total Recurrent Expenditure 149,348 81.0 131,655 88.0 1.1
Maintenance 35,000 19.0 18,000 12.0 1.9
Total Annual Cost 184,348 100 149,655 100 1.2
It costs 20% more to educate a secondary student in our model high school than it costs to educate a
primary student in our model primary school. In the above table any ratio which is less than 1 indicates
economies of scale in the secondary school e.g. the administrative staff cost per student in a high school
is 80% of the administrative staff cost per student in a primary school because in the high school the
administrative staff cost while being higher than in the primary school is shared over a relatively larger
number of students. The big differences between the per student costs in high and primary schools are
in the areas of administrative expenses, co-curriculum activity and maintenance which are 100%, 60%
and 90% higher respectively. Larger space per student in high school implies higher per student utility
bills and higher per student usage of cleaning material. High school students are likely to consume more
stationery than primary school students, as more handout and correspondence for home will be utilized
at the secondary than the primary level. High school co-curriculum activities are more expensive per
student than primary school activities. Since each high school student occupies more space and in
particular more specialized space than a primary school student, maintenance cost will be significantly
higher.

17
Reference
Caillods, F. (2001): “Financing the Expansion of Secondary Education” International Institute for
Educational Planning Newsletter; Vol. XIS. No 4
Lewin, Keith M. (2008): “Strategies for Sustainable Financing of Secondary Education in Sub-Saharan
Africa” The World Bank
Lewin, Keith M. (2006): “Financing Secondary Education in Commonwealth Countries: New Challenges
for Policy and Practice” 16th Conference of Commonwealth Education Ministers; Cape Town, South
Africa.
Lewin, Keith and Francoise Caillods (ed.) (2001): “Financing Secondary Education in Developing
Countries: Strategies for Sustainable Growth” International Institute for Educational Planning/UNESCO
Ministry of Education, Jamaica (2011); “Education Statistics 2010-11
Ministry of Finance and the Public Service, Jamaica (April 2011); “Jamaica Estimates of Expenditure for
Financial Year ending March 31, 2012.
Ministry of Finance and the Public Service, Jamaica (2008) “Heads of Agreement Concluded Between the
Ministries of Finance and he Public Service, and Education on the One Hand and the Jamaica Teachers’
Association representing Teachers in the Government Service on the Other Hand, for the Contract
Period April 1, 2008 to March 31, 2010 signed on October 27, 2008”
Onsomu, Eldah N., David Muthaka, Moses Ngware and Geroge Kosimbei (2006): “Financing of Secondary
Education in Kenya: Costs and Options” Kenya Institute of Public Policy Research and Analysis Discussion
Paper No. 55