second quarter operations review - rio tinto
TRANSCRIPT

Second quarter operations review
Page 1 of 27
Rio Tinto releases second quarter production results 16 July 2019 Rio Tinto chief executive J-S Jacques said “We saw a challenging operational performance across our portfolio in the first half, while also investing in future growth at Richards Bay Minerals and Resolution. Whilst we experienced operational and weather issues at our iron ore operations in Australia, pricing and market demand has remained robust. We remain focused on safely improving and optimising the performance and productivity of our assets in order to drive future cash flow. This, combined with our value over volume strategy and the disciplined allocation of capital, will continue to deliver superior returns to our shareholders in the short, medium and long term.” Q2 2019 vs Q2 2018 vs Q1 2019 H1 2019 vs H1 2018 Pilbara iron ore shipments (100% basis) Mt 85.4 -3% +24% 154.6 -8% Pilbara iron ore production (100% basis) Mt 79.7 -7% +5% 155.7 -8% Bauxite kt 13,407 +1% +5% 26,171 +1% Aluminium kt 803 0% +1% 1,599 0% Mined copper kt 137.1 -13% -5% 281.0 -5% Titanium dioxide slag kt 303 +31% +2% 599 +14% IOC iron ore pellets and concentrate Mt 2.5 +191% +2% 5.0 +55%
Operational update
• Pilbara iron ore shipments of 85.4 million tonnes (100% basis) in the second quarter were 3% lower than the second quarter of 2018. Shipments were impacted in April due to recovery works following Tropical Cyclone Veronica.
• 2019 guidance for Pilbara shipments was revised on 19 June 2019 to between 320 and 330 million tonnes, 100% basis (previously between 333 and 343 million tonnes) due to mine operational challenges. Unit cost guidance has been revised to $14 - $15 per tonne (previously $13 - $14 per tonne).
• Lower iron ore production was the primary driver of a 2% reduction in copper equivalent production in the first half compared to the corresponding period of 2018.
• Bauxite production of 13.4 million tonnes in the second quarter was 1% higher than the same period of 2018.
• Aluminium production of 0.8 million tonnes was in line with the second quarter of 2018.
• Mined copper production of 137 thousand tonnes was 13% lower than the second quarter of 2018, with lower production from Escondida and Kennecott reflective of lower grades.
• Titanium dioxide slag production of 303 thousand tonnes was 31% higher than the second quarter of 2018, reflecting improved operational performance following operational challenges faced in the corresponding period of 2018.
• Second quarter production at Iron Ore Company of Canada was significantly higher than the corresponding quarter of 2018, which was impacted by a labour strike. However, guidance for Rio Tinto’s share of iron ore pellets and concentrate production is revised to between 10.7 and 11.3 million tonnes (previously 11.3 to 12.3 million tonnes), due to adverse weather conditions in the first quarter and a flooding incident in June.
• Rio Tinto today released a separate announcement providing an update on the Oyu Tolgoi underground project.
Page 2 of 27
• On 8 April 2019, Rio Tinto announced the approval of the construction of the Zulti South project at Richards Bay Minerals (RBM) in South Africa for $463 million (Rio Tinto share $343 million).
• On 15 April 2019, Rio Tinto announced it had committed $302 million ($166 million Rio Tinto share) of additional expenditure to advance its Resolution Copper project in Arizona.
All figures in this report are unaudited. All currency figures in this report are US dollars, and comments refer to Rio Tinto’s share of production, unless otherwise stated. To allow production numbers to be compared on a like-for-like basis, production from asset divestments completed in 2018 is excluded from Rio Tinto share of production data.

Page 3 of 27
IRON ORE Rio Tinto share of production (million tonnes) Q2 2019 vs Q2 2018 vs Q1 2019 H1 2019 vs H1 2018 Pilbara Blend Lump 19.8 -9% -1% 39.8 -7% Pilbara Blend Fines 28.5 -9% -1% 57.2 -6% Robe Valley Lump 1.2 -16% +89% 1.8 -39% Robe Valley Fines 2.1 -19% +72% 3.4 -41% Yandicoogina Fines (HIY) 14.0 -2% +4% 27.4 -3% Total Pilbara production 65.6 -8% +2% 129.7 -8% Total Pilbara production (100% basis) 79.7 -7% +5% 155.7 -8% Total Pilbara shipments (a) (100% basis) 85.4 -3% +24% 154.6 -8% (a) Pilbara Blend sales include 2.4 million tonnes of alternate products in Q2 2019 and 3.9 million tonnes in H1 2019 Pilbara operations Pilbara operations produced 155.7 million tonnes (Rio Tinto share 129.7 million tonnes) in the first half of 2019, 8% lower than the same period in 2018. As highlighted in our first quarter Operations Review, significant disruptions were caused by Tropical Cyclone Veronica, and a fire at Cape Lambert A. The impacts of Cyclone Veronica continued into the second quarter, with repairs to the Cape Lambert A port facilities impacting Robe Valley and Yandicoogina shipments and operations. All repairs are now complete. As announced on 19 June 2019, mine operational challenges are being experienced, particularly at our Greater Brockman hub. This has seen shortfalls in planned material movement and impacted mine sequencing both in the Greater Brockman hub and in the broader system. Waste material movement will be increased over 2019 and 2020 to improve mine performance and pit sequencing. Cost guidance (below) has been revised to include these additional mining activities. First half sales of 154.6 million tonnes (Rio Tinto share 129.6 million tonnes) were 8% lower than the first half of last year due to lower mine production and damage to the port facilities caused by the cyclone. Approximately 16% of sales in the first half of 2019 were priced by reference to the prior quarter’s average index lagged by one month. The remainder was sold either on current quarter average, current month average or on the spot market. We continue to prioritise meeting our long-term customer commitments. Approximately 33% of sales in the first half were made free on board (FOB), with the remainder sold including freight. Achieved average pricing in the first half of 2019 was $78.5 per wet metric tonne on an FOB basis (2018 first half: $57.9 per wet metric tonne) which equates to $85.3 per dry metric tonne. Pilbara Blend sales included an additional 2.4 million tonnes of alternate products in the second quarter, bringing the total alternate product sales in the first half of 2019 to 3.9 million tonnes. Pilbara projects The Koodaideri iron ore mine is progressing to plan with engineering, procurement and construction activities on schedule, including the ramp-up of the mine bulk earthworks and commencement of rail bulk earthworks. First ore from Koodaideri is expected in late 2021, consistent with previous guidance. The Robe River Joint Venture sustaining production projects (West Angelas C&D and Mesa B, C and H at Robe Valley) are progressing through the necessary environmental and heritage approval process. Mesa H environmental approvals have experienced some delays, with contingency plans being assessed in case required. Consistent with previous guidance, first ore from these projects is anticipated in 2021.

Page 4 of 27
2019 guidance As announced on 19 June 2019, Rio Tinto’s Pilbara shipments in 2019 are expected to be between 320 and 330 million tonnes, 100% basis (previously between 333 and 343 million tonnes). Guidance will remain subject to weather. Major rail maintenance is scheduled to occur in October, and is reflected in the existing guidance. Rio Tinto’s Pilbara unit cost guidance in 2019 has been revised to $14 - $15 per tonne (previously $13 - $14 per tonne), which incorporates costs for the additional waste movement in the mines in the second half, and the overall reduction in shipments.

Page 5 of 27
ALUMINIUM Rio Tinto share of production (‘000 tonnes) Q2 2019 vs Q2 2018 vs Q1 2019 H1 2019 vs H1 2018 Rio Tinto Aluminium Bauxite 13,407 +1% +5% 26,171 +1% Bauxite third party shipments 9,477 +8% +7% 18,318 +8% Alumina 1,878 -6% -6% 3,886 -3% Aluminium 803 0% +1% 1,599 0% Bauxite Second quarter bauxite production of 13.4 million tonnes was 1% higher than the same period of 2018. Production at managed operations increased by 2%, with the ramp-up of Amrun progressing despite weather related impacts in the first quarter. This was partly offset by lower production from the non-managed Porto Trombetas (MRN) JV in Brazil. The expansion project at CBG, a non-managed JV in Guinea, experienced a slower than expected ramp-up, but is now delivering at target run-rates. 9.5 million tonnes of bauxite were shipped to third parties in the second quarter, 8% higher than the same period of 2018. Alumina Alumina production in the second quarter of 2019 was 6% lower than the same period in 2018 due primarily to major maintenance activities at non-managed QAL and the lower bauxite supply from MRN impacting production at Vaudreuil. Aluminium Aluminium production of 0.8 million tonnes in the second quarter was in line with the corresponding period of 2018. Excluding the non-managed Becancour operation, where a lock-out constrained operations, aluminium production in the first half was 1% higher than the corresponding period in 2018, reflecting continued productivity improvement. On 2 July 2019, management and unions at the Becancour smelter agreed a new labour arrangement which will lead to restart of production at the end of July, with full ramp-up expected by mid-2020. Average realised aluminium prices in the first half of 2019 were $2,174 per tonne (H1 2018: $2,547 per tonne). This includes premiums for value-added products (VAP), which represented 54% of primary metal sold in the first half of 2018 (H1 2018: 58%) and generated attractive product premiums averaging $242 per tonne of VAP sold (H1 2018: $222 per tonne) on top of the physical market premiums. The mid-west premium duty paid increased from $396 per tonne in the first half of 2018 to $420 per tonne in the first half of 2019. A 10% tariff on aluminium imports into the United States under Section 232, which was effective for Canadian imports, was paid until the tariffs were removed on 19 May 2019. There was some respite from cost inflation in Aluminium compared with 2018 for certain raw materials, in particular for caustic soda and petroleum coke albeit with a lag effect due to the pricing mechanism. However, this was partly offset by inflationary pressures on other costs. Kemano At the Kemano hydro-power facility at Kitimat, British Columbia, the tunnel boring machine has achieved a total of 828 metres excavated as at 30 June 2019. Current progress is slightly behind schedule, but cost forecasts remain on budget. 2019 guidance 2019 guidance is unchanged. Rio Tinto’s expected share of bauxite production in 2019 is between 56 and 59 million tonnes. Aluminium production guidance is between 3.2 and 3.4 million tonnes and alumina production guidance is 8.1 to 8.4 million tonnes.

Page 6 of 27
COPPER & DIAMONDS Rio Tinto share of production (‘000 tonnes) Q2 2019 vs Q2 2018 vs Q1 2019 H1 2019 vs H1 2018 Mined copper Rio Tinto Kennecott 41.1 -20% -22% 93.7 +8% Escondida 82.9 -10% +9% 158.9 -13% Oyu Tolgoi 13.1 -1% -15% 28.5 +9% Refined copper Rio Tinto Kennecott 63.3 +55% +114% 92.8 +22% Escondida 19.0 -9% +2% 37.7 -10% Diamonds (‘000 carats) Argyle 3,292 -5% +18% 6,079 -13% Diavik 1,188 +3% +18% 2,198 -1% Rio Tinto Kennecott Second quarter mined copper production was 20% lower than the same period of 2018. Lower grades experienced as mining activity moved into lower levels of the pit were partially offset by increased mined ore. Refined copper production was 55% higher than the second quarter of 2018, reflecting strong smelter performance and improved mining rates. Production was significantly higher than the prior quarter, when the anode furnace was shut for planned maintenance. Rio Tinto Kennecott continues to toll and purchase third party concentrate to optimise smelter utilisation, with 31.8 thousand tonnes of concentrate received for processing in the second quarter of 2019, compared with 31.3 thousand tonnes in the second quarter of 2018. Purchased and tolled copper concentrate are excluded from reported production figures. Grades were higher in the second quarter for molybdenum, with concentrate production more than two and a half times higher than the same quarter in 2018. Escondida Mined copper production at Escondida in the second quarter of 2019 was 10% lower than the same period of 2018 mainly due to lower copper grades feeding the concentrators. Oyu Tolgoi Mined copper production from the open pit in the second quarter of 2019 was 1% lower than the same period in 2018 and 15% lower than the prior quarter as ore sources move to lower grade areas of the pit, as planned. Oyu Tolgoi Underground Project On 16 July 2019, Rio Tinto released a separate announcement providing an update on the Oyu Tolgoi underground project. Provisional pricing At 30 June 2019, the Group had an estimated 287 million pounds of copper sales that were provisionally priced at 275 cents per pound. The final price of these sales will be determined during the second half of 2019. This compares with 240 million pounds of open shipments at 31 December 2018, provisionally priced at 277 cents per pound. Resolution Copper On 15 April 2019, Rio Tinto announced it had committed $302 million ($166 million Rio Tinto share) of additional expenditure to advance its Resolution Copper project in Arizona. The investment will fund

Page 7 of 27
additional drilling, ore-body studies, infrastructure improvements and permitting activities as Rio Tinto looks to progress the project to the final stage of the project’s permitting phase. Diamonds At Argyle, carat production in the second quarter of 2019 was 5% lower than the same period in 2018 due to lower recovered grade, partially offset by stronger mining rates. At Diavik, carats recovered in the second quarter were 3% higher than the second quarter of 2018 due to slightly higher grades and ore processing throughput. 2019 guidance 2019 guidance is unchanged. Rio Tinto’s share of mined copper production for 2019 is expected to be between 550 and 600 thousand tonnes, subject to grade availability. Refined copper production is expected to be between 220 and 250 thousand tonnes. Diamond production guidance for 2019 is between 15 and 17 million carats.
Page 8 of 27
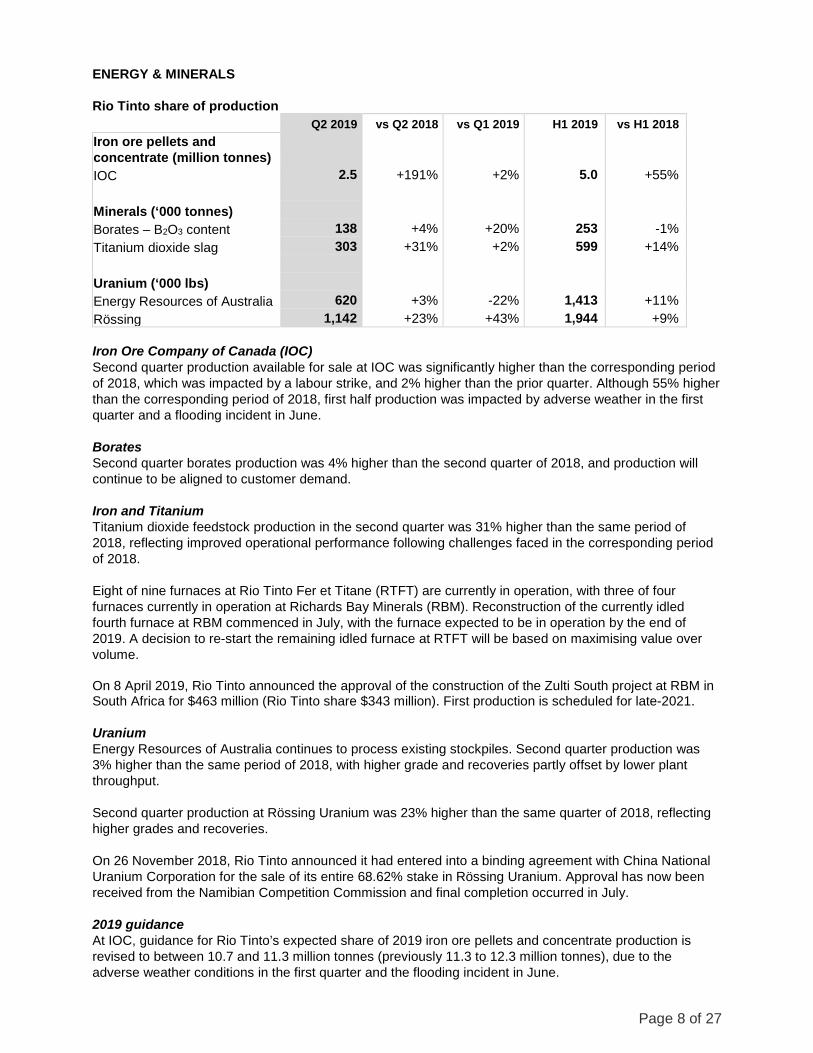
ENERGY & MINERALS Rio Tinto share of production Q2 2019 vs Q2 2018 vs Q1 2019 H1 2019 vs H1 2018 Iron ore pellets and concentrate (million tonnes)
IOC 2.5 +191% +2% 5.0 +55% Minerals (‘000 tonnes) Borates – B2O3 content 138 +4% +20% 253 -1% Titanium dioxide slag 303 +31% +2% 599 +14% Uranium (‘000 lbs) Energy Resources of Australia 620 +3% -22% 1,413 +11% Rössing 1,142 +23% +43% 1,944 +9% Iron Ore Company of Canada (IOC) Second quarter production available for sale at IOC was significantly higher than the corresponding period of 2018, which was impacted by a labour strike, and 2% higher than the prior quarter. Although 55% higher than the corresponding period of 2018, first half production was impacted by adverse weather in the first quarter and a flooding incident in June. Borates Second quarter borates production was 4% higher than the second quarter of 2018, and production will continue to be aligned to customer demand. Iron and Titanium Titanium dioxide feedstock production in the second quarter was 31% higher than the same period of 2018, reflecting improved operational performance following challenges faced in the corresponding period of 2018. Eight of nine furnaces at Rio Tinto Fer et Titane (RTFT) are currently in operation, with three of four furnaces currently in operation at Richards Bay Minerals (RBM). Reconstruction of the currently idled fourth furnace at RBM commenced in July, with the furnace expected to be in operation by the end of 2019. A decision to re-start the remaining idled furnace at RTFT will be based on maximising value over volume. On 8 April 2019, Rio Tinto announced the approval of the construction of the Zulti South project at RBM in South Africa for $463 million (Rio Tinto share $343 million). First production is scheduled for late-2021. Uranium Energy Resources of Australia continues to process existing stockpiles. Second quarter production was 3% higher than the same period of 2018, with higher grade and recoveries partly offset by lower plant throughput. Second quarter production at Rössing Uranium was 23% higher than the same quarter of 2018, reflecting higher grades and recoveries. On 26 November 2018, Rio Tinto announced it had entered into a binding agreement with China National Uranium Corporation for the sale of its entire 68.62% stake in Rössing Uranium. Approval has now been received from the Namibian Competition Commission and final completion occurred in July. 2019 guidance At IOC, guidance for Rio Tinto’s expected share of 2019 iron ore pellets and concentrate production is revised to between 10.7 and 11.3 million tonnes (previously 11.3 to 12.3 million tonnes), due to the adverse weather conditions in the first quarter and the flooding incident in June.

Page 9 of 27
Titanium dioxide slag production guidance is unchanged between 1.2 and 1.4 million tonnes, and boric oxide equivalent production guidance remains at 0.5 million tonnes.

Page 10 of 27
EXPLORATION AND EVALUATION Pre-tax and pre-divestment expenditure on exploration and evaluation charged to the profit and loss account in the first half of 2019 was $287 million, compared with $232 million in the first half of 2018, with increased spend on central exploration and at Resolution Copper. Approximately 51% of this expenditure was incurred by central exploration, 38% by Copper & Diamonds, 7% by Energy & Minerals and the remainder by Iron Ore and Aluminium. There were no significant divestments of central exploration properties in the second quarter of 2019. Exploration highlights Rio Tinto has a strong portfolio of projects with activity in 18 countries across eight commodities. The bulk of the exploration expenditure in this quarter was focused on copper targets in Australia, Canada, Chile, Kazakhstan, Mongolia, Namibia, Papua New Guinea, Peru, Serbia, United States, Zambia and diamond projects in Canada. Mine-lease exploration continued at a number of Rio Tinto managed businesses including Pilbara Iron in Australia, Oyu Tolgoi in Mongolia, Weipa in Australia, Diavik in Canada, as well as Bingham, Resolution and Boron in the US. At the Winu project in Western Australia, results continue to indicate relatively wide intersections of vein style copper mineralisation associated with gold and silver beneath relatively shallow cover which ranges from 50 to 100 metres. The mineralisation remains open at depth and to the east, north, and south. Reverse circulation (RC) and diamond drilling is continuing, with RC drilling primarily focused upon defining the extent and tenor of the supergene zone, and diamond drilling continuing to test the extents of the deposit. Drilling is ongoing with eight diamond rigs and three RC rigs drilling at Winu. A summary of activity for the quarter is as follows:

Page 11 of 27
Product Groups
Studies stage Advanced exploration projects
Greenfield/ Brownfield programmes
Aluminium Cape York, Australia Amargosa, Brazil Sanxai, Laos
Cape York, Australia
Copper & Diamonds
Copper/molybdenum: Resolution, US
Copper: Winu, Australia, La Granja, Peru Nickel: Tamarack, US Diamonds: FalCon, Canada
Copper Greenfield: Australia, Chile, China, Kazakhstan, Mongolia, Namibia, Papua New Guinea, Peru, Serbia, US, Zambia Copper Brownfield: Bingham, Resolution, US Oyu Tolgoi, Mongolia Nickel Greenfield: Canada, Finland, Uganda Diamonds Greenfield: Canada Diamonds Brownfield: Diavik, Canada
Energy & Minerals
Lithium borates: Jadar, Serbia Potash: KP405, Canada Heavy mineral sands: Mutamba, Mozambique
Uranium: Roughrider, Canada
Heavy mineral sands: Tanzania Industrial Minerals: Serbia
Iron Ore Pilbara, Australia Pilbara, Australia Pilbara, Australia

Page 12 of 27
Forward-looking statements This announcement may include "forward-looking statements" within the meaning of the US Private Securities Litigation Reform Act of 1995. All statements other than statements of historical facts included in this announcement, including, without limitation, those regarding Rio Tinto’s production forecast or guidance, financial position, business strategy, plans and objectives of management for future operations (including development plans and objectives relating to Rio Tinto’s products and reserve and resource positions), are forward-looking statements. The words “intend”, “aim”, “project”, “anticipate”, “estimate”, “plan”, “believes”, “expects”, “may”, “should”, “will”, “target”, “set to”, “assumes” or similar expressions, commonly identify such forward looking statements. Such forward-looking statements involve known and unknown risks, uncertainties and other factors which may cause the actual production, performance or results of Rio Tinto to be materially different from any future production, performance or results expressed or implied by such forward-looking statements. Such forward-looking statements could be influenced by such risk factors as identified in Rio Tinto's most recent Annual Report and Accounts in Australia and the United Kingdom and the most recent Annual Report on Form 20-F filed with the United States Securities and Exchange Commission (the "SEC") or Form 6-Ks furnished to, or filed with, the SEC. Forward-looking statements should, therefore, be construed in light of such risk factors and undue reliance should not be placed on forward-looking statements. These forward-looking statements speak only as of the date of this announcement. Rio Tinto expressly disclaims any obligation or undertaking (except as required by applicable law, the UK Listing Rules, the Disclosure and Transparency Rules of the Financial Conduct Authority and the Listing Rules of the Australian Securities Exchange) to release publicly any updates or revisions to any forward-looking statement contained herein to reflect any change in Rio Tinto’s expectations with regard thereto or any change in events, conditions or circumstances on which any such statement is based. Nothing in this announcement should be interpreted to mean that future earnings per share of Rio Tinto plc or Rio Tinto Limited will necessarily match or exceed its historical published earnings per share.

Page 13 of 27
Contacts [email protected] riotinto.com
Follow @RioTinto on Twitter
Media Relations, United Kingdom Illtud Harri M +44 7920 503 600 David Outhwaite T +44 20 7781 1623 M +44 7787 597 493 Media Relations, Americas Matthew Klar T +1 514 608 4429 Media Relations, Asia Grant Donald T +65 6679 9290 M +65 9722 6028
Media Relations, Australia Jonathan Rose T +61 3 9283 3088 M +61 447 028 913 Matt Chambers T +61 (0) 3 9283 3087 M +61 433 525 739 Jesse Riseborough T +61 8 6211 6013 M +61 436 653 412
Investor Relations, United Kingdom John Smelt T +44 20 7781 1654 M +44 7879 642 675 David Ovington T +44 20 7781 2051 M +44 7920 010 978 Nick Parkinson M +61 436 637 571
Investor Relations, Australia Natalie Worley T +61 3 9283 3063 M +61 409 210 462 Rachel Storrs T +61 3 9283 3628 M +61 417 401 018
Rio Tinto plc 6 St James’s Square London SW1Y 4AD United Kingdom T +44 20 7781 2000 Registered in England No. 719885
Rio Tinto Limited Level 7, 360 Collins Street Melbourne 3000 Australia T +61 3 9283 3333 Registered in Australia ABN 96 004 458 404
Page 14 of 27
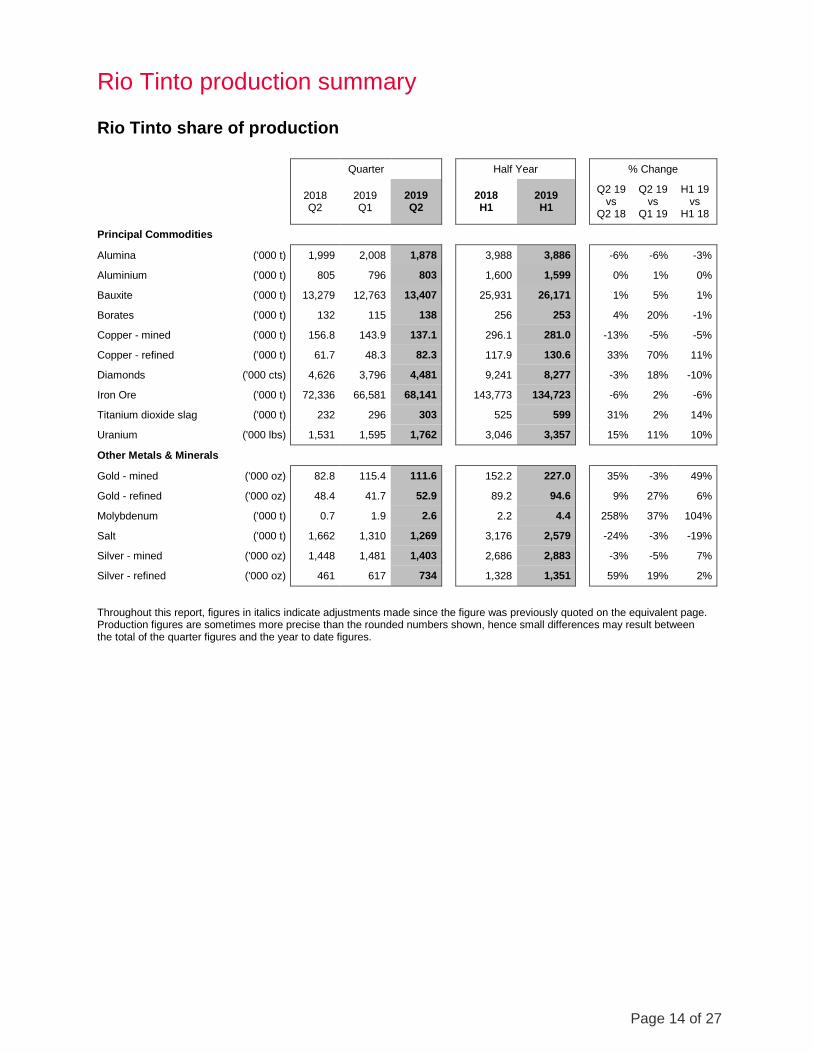
Rio Tinto production summary Rio Tinto share of production Quarter Half Year % Change
2018 Q2
2019 Q1
2019 Q2 2018
H1 2019 H1
Q2 19 vs
Q2 18
Q2 19 vs
Q1 19
H1 19 vs
H1 18
Principal Commodities
Alumina ('000 t) 1,999 2,008 1,878 3,988 3,886 -6% -6% -3%
Aluminium ('000 t) 805 796 803 1,600 1,599 0% 1% 0%
Bauxite ('000 t) 13,279 12,763 13,407 25,931 26,171 1% 5% 1%
Borates ('000 t) 132 115 138 256 253 4% 20% -1%
Copper - mined ('000 t) 156.8 143.9 137.1 296.1 281.0 -13% -5% -5%
Copper - refined ('000 t) 61.7 48.3 82.3 117.9 130.6 33% 70% 11%
Diamonds ('000 cts) 4,626 3,796 4,481 9,241 8,277 -3% 18% -10%
Iron Ore ('000 t) 72,336 66,581 68,141 143,773 134,723 -6% 2% -6%
Titanium dioxide slag ('000 t) 232 296 303 525 599 31% 2% 14%
Uranium ('000 lbs) 1,531 1,595 1,762 3,046 3,357 15% 11% 10%
Other Metals & Minerals
Gold - mined ('000 oz) 82.8 115.4 111.6 152.2 227.0 35% -3% 49%
Gold - refined ('000 oz) 48.4 41.7 52.9 89.2 94.6 9% 27% 6%
Molybdenum ('000 t) 0.7 1.9 2.6 2.2 4.4 258% 37% 104%
Salt ('000 t) 1,662 1,310 1,269 3,176 2,579 -24% -3% -19%
Silver - mined ('000 oz) 1,448 1,481 1,403 2,686 2,883 -3% -5% 7%
Silver - refined ('000 oz) 461 617 734 1,328 1,351 59% 19% 2%
Throughout this report, figures in italics indicate adjustments made since the figure was previously quoted on the equivalent page. Production figures are sometimes more precise than the rounded numbers shown, hence small differences may result between the total of the quarter figures and the year to date figures.

Page 15 of 27
Rio Tinto share of production
Rio Tinto
interest Q2
2018 Q3
2018 Q4
2018 Q1
2019 Q2
2019 H1
2018 H1
2019
ALUMINA
Production ('000 tonnes)
Jonquière (Vaudreuil) 100% 365 363 354 373 336 727 709
Jonquière (Vaudreuil) specialty Alumina plant 100% 32 31 29 25 31 64 57
Queensland Alumina 80% 752 748 742 711 668 1,469 1,378
São Luis (Alumar) 10% 87 85 92 86 86 174 172
Yarwun 100% 763 744 803 813 757 1,556 1,570
Rio Tinto total alumina production 1,999 1,972 2,020 2,008 1,878 3,988 3,886
ALUMINIUM
Production ('000 tonnes)
Australia - Bell Bay 100% 47 48 48 45 47 94 92
Australia - Boyne Island 59% 74 75 74 73 75 146 147
Australia - Tomago 52% 76 78 77 74 76 151 150
Canada - six wholly owned 100% 402 407 408 400 400 800 800
Canada - Alouette (Sept-Îles) 40% 58 59 58 58 60 116 118
Canada - Bécancour 25% 9 8 8 4 4 19 8
Iceland - ISAL (Reykjavik) 100% 53 53 54 52 52 105 105
New Zealand - Tiwai Point 79% 67 68 70 71 69 133 140
Oman - Sohar 20% 19 20 20 19 19 37 39
Rio Tinto total aluminium production
805 814 817 796 803 1,600 1,599
BAUXITE
Production ('000 tonnes) (a)
Gove 100% 3,274 2,893 3,250 3,004 2,957 6,398 5,960
Porto Trombetas 12% 393 342 489 285 287 745 572
Sangaredi (b) 1,657 1,261 1,204 1,558 1,630 3,403 3,189
Weipa 100% 7,955 8,204 6,847 7,917 8,533 15,386 16,450
Rio Tinto total bauxite production 13,279 12,700 11,790 12,763 13,407 25,931 26,171
(a) Mine production figures for metals refer to the total quantity of metal produced in concentrates, leach liquor or doré bullion irrespective of whether these products are then refined onsite, except for the data for bauxite and iron ore which represent production of marketable quantities of ore plus concentrates and pellets.
(b) Rio Tinto has a 22.95% shareholding in the Sangaredi mine but benefits from 45.0% of production.

Page 16 of 27
Rio Tinto share of production
Rio Tinto
interest Q2
2018 Q3
2018 Q4
2018 Q1
2019 Q2
2019 H1
2018 H1
2019
BORATES
Production ('000 tonnes B2O3 content)
Rio Tinto Borates - borates 100% 132 137 118 115 138 256 253
COPPER
Mine production ('000 tonnes) (a)
Bingham Canyon 100% 51.2 59.1 58.3 52.5 41.1 86.6 93.7
Escondida 30% 92.4 87.4 79.7 76.0 82.9 183.3 158.9
Oyu Tolgoi (b) 34% 13.2 13.2 13.9 15.4 13.1 26.2 28.5
Rio Tinto total mine production
156.8 159.7 151.9 143.9 137.1 296.1 281.0
Refined production ('000 tonnes)
Escondida 30% 21.0 16.6 21.6 18.7 19.0 41.9 37.7
Rio Tinto Kennecott 100% 40.7 54.2 64.6 29.6 63.3 76.0 92.8
Rio Tinto total refined production 61.7 70.8 86.1 48.3 82.3 117.9 130.6
(a) Mine production figures for metals refer to the total quantity of metal produced in concentrates, leach liquor or doré bullion irrespective of whether these products are then refined onsite, except for the data for bauxite and iron ore which represent production of marketable quantities of ore plus concentrates and pellets.
(b) Rio Tinto owns a 33.52% indirect interest in Oyu Tolgoi through its 50.79% interest in Turquoise Hill Resources Ltd.
DIAMONDS
Production ('000 carats)
Argyle 100% 3,476 3,830 3,211 2,786 3,292 7,027 6,079
Diavik 60% 1,150 1,066 1,078 1,010 1,188 2,214 2,198
Rio Tinto total diamond production 4,626 4,896 4,290 3,796 4,481 9,241 8,277
GOLD
Mine production ('000 ounces) (a)
Bingham Canyon 100% 45.6 56.6 57.1 53.0 65.1 83.0 118.0
Escondida 30% 20.5 19.1 22.1 22.2 22.4 38.5 44.6
Oyu Tolgoi (b) 34% 16.8 25.8 39.1 40.2 24.1 30.8 64.3
Rio Tinto total mine production
82.8 101.4 118.4 115.4 111.6 152.2 227.0
Refined production ('000 ounces)
Rio Tinto Kennecott 100% 48.4 50.3 58.6 41.7 52.9 89.2 94.6
(a) Mine production figures for metals refer to the total quantity of metal produced in concentrates, leach liquor or doré bullion irrespective of whether these products are then refined onsite, except for the data for bauxite and iron ore which represent production of marketable quantities of ore plus concentrates and pellets.
(b) Rio Tinto owns a 33.52% indirect interest in Oyu Tolgoi through its 50.79% interest in Turquoise Hill Resources Ltd.
Page 17 of 27
Rio Tinto share of production
Rio Tinto
interest Q2
2018 Q3
2018 Q4
2018 Q1
2019 Q2
2019 H1
2018 H1
2019
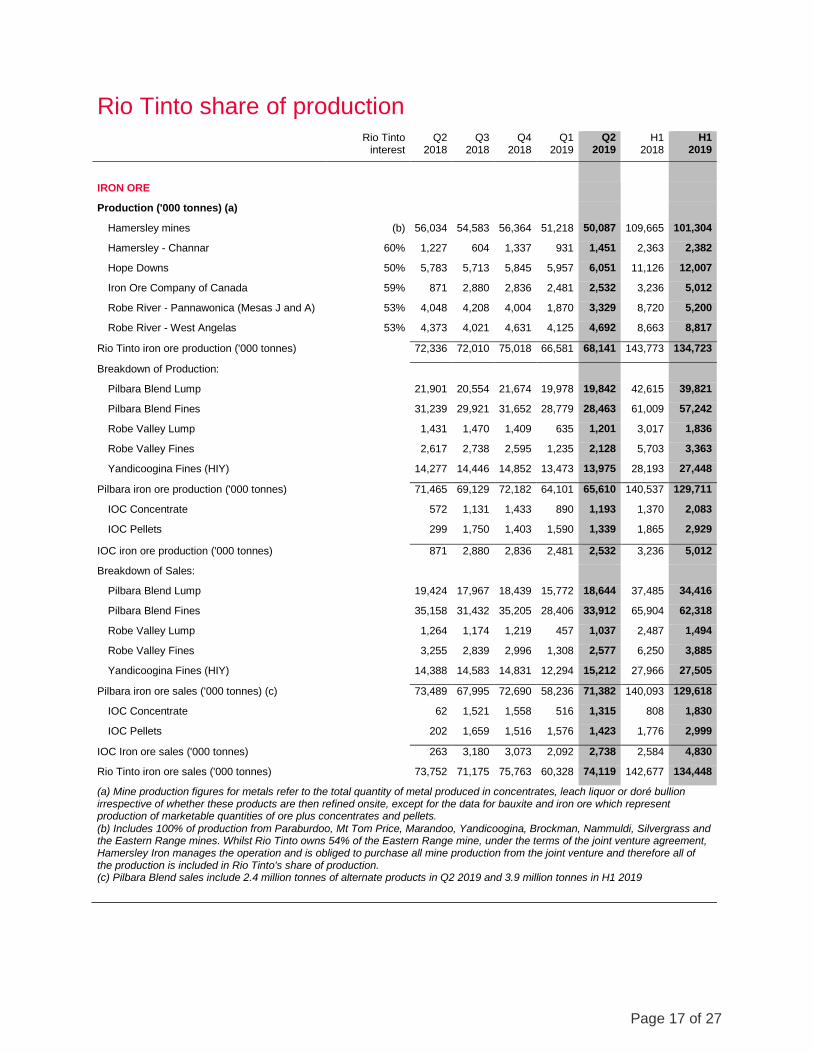
IRON ORE
Production ('000 tonnes) (a)
Hamersley mines (b) 56,034 54,583 56,364 51,218 50,087 109,665 101,304
Hamersley - Channar 60% 1,227 604 1,337 931 1,451 2,363 2,382
Hope Downs 50% 5,783 5,713 5,845 5,957 6,051 11,126 12,007
Iron Ore Company of Canada 59% 871 2,880 2,836 2,481 2,532 3,236 5,012
Robe River - Pannawonica (Mesas J and A) 53% 4,048 4,208 4,004 1,870 3,329 8,720 5,200
Robe River - West Angelas 53% 4,373 4,021 4,631 4,125 4,692 8,663 8,817
Rio Tinto iron ore production ('000 tonnes)
72,336 72,010 75,018 66,581 68,141 143,773 134,723
Breakdown of Production:
Pilbara Blend Lump
21,901 20,554 21,674 19,978 19,842 42,615 39,821
Pilbara Blend Fines
31,239 29,921 31,652 28,779 28,463 61,009 57,242
Robe Valley Lump
1,431 1,470 1,409 635 1,201 3,017 1,836
Robe Valley Fines
2,617 2,738 2,595 1,235 2,128 5,703 3,363
Yandicoogina Fines (HIY)
14,277 14,446 14,852 13,473 13,975 28,193 27,448
Pilbara iron ore production ('000 tonnes)
71,465 69,129 72,182 64,101 65,610 140,537 129,711
IOC Concentrate
572 1,131 1,433 890 1,193 1,370 2,083
IOC Pellets
299 1,750 1,403 1,590 1,339 1,865 2,929
IOC iron ore production ('000 tonnes)
871 2,880 2,836 2,481 2,532 3,236 5,012
Breakdown of Sales:
Pilbara Blend Lump
19,424 17,967 18,439 15,772 18,644 37,485 34,416
Pilbara Blend Fines
35,158 31,432 35,205 28,406 33,912 65,904 62,318
Robe Valley Lump
1,264 1,174 1,219 457 1,037 2,487 1,494
Robe Valley Fines
3,255 2,839 2,996 1,308 2,577 6,250 3,885
Yandicoogina Fines (HIY)
14,388 14,583 14,831 12,294 15,212 27,966 27,505
Pilbara iron ore sales ('000 tonnes) (c)
73,489 67,995 72,690 58,236 71,382 140,093 129,618
IOC Concentrate
62 1,521 1,558 516 1,315 808 1,830
IOC Pellets
202 1,659 1,516 1,576 1,423 1,776 2,999
IOC Iron ore sales ('000 tonnes)
263 3,180 3,073 2,092 2,738 2,584 4,830
Rio Tinto iron ore sales ('000 tonnes) 73,752 71,175 75,763 60,328 74,119 142,677 134,448
(a) Mine production figures for metals refer to the total quantity of metal produced in concentrates, leach liquor or doré bullion irrespective of whether these products are then refined onsite, except for the data for bauxite and iron ore which represent production of marketable quantities of ore plus concentrates and pellets. (b) Includes 100% of production from Paraburdoo, Mt Tom Price, Marandoo, Yandicoogina, Brockman, Nammuldi, Silvergrass and the Eastern Range mines. Whilst Rio Tinto owns 54% of the Eastern Range mine, under the terms of the joint venture agreement, Hamersley Iron manages the operation and is obliged to purchase all mine production from the joint venture and therefore all of the production is included in Rio Tinto's share of production. (c) Pilbara Blend sales include 2.4 million tonnes of alternate products in Q2 2019 and 3.9 million tonnes in H1 2019

Page 18 of 27
Rio Tinto share of production
Rio Tinto
interest Q2
2018 Q3
2018 Q4
2018 Q1
2019 Q2
2019 H1
2018 H1
2019
MOLYBDENUM
Mine production ('000 tonnes) (a)
Bingham Canyon 100% 0.7 1.4 2.2 1.9 2.6 2.2 4.4
(a) Mine production figures for metals refer to the total quantity of metal produced in concentrates, leach liquor or doré bullion irrespective of whether these products are then refined onsite, except for the data for bauxite and iron ore which represent production of marketable quantities of ore plus concentrates and pellets.
SALT
Production ('000 tonnes)
Dampier Salt 68% 1,662 1,481 1,496 1,310 1,269 3,176 2,579
SILVER
Mine production ('000 ounces) (a)
Bingham Canyon 100% 615 708 736 741 700 1,076 1,442
Escondida 30% 758 599 771 657 622 1,460 1,279
Oyu Tolgoi (b) 34% 75 77 80 83 80 149 163
Rio Tinto total mine production
1,448 1,384 1,586 1,481 1,403 2,686 2,883
Refined production ('000 ounces)
Rio Tinto Kennecott 100% 461 730 807 617 734 1,328 1,351
(a) Mine production figures for metals refer to the total quantity of metal produced in concentrates, leach liquor or doré bullion irrespective of whether these products are then refined onsite, except for the data for bauxite and iron ore which represent production of marketable quantities of ore plus concentrates and pellets. (b) Rio Tinto owns a 33.52% indirect interest in Oyu Tolgoi through its 50.79% interest in Turquoise Hill Resources Ltd.
TITANIUM DIOXIDE SLAG
Production ('000 tonnes)
Rio Tinto Iron & Titanium (a) 100% 232 297 294 296 303 525 599
(a) Quantities comprise 100% of Rio Tinto Fer et Titane and Rio Tinto's 74% interest in Richards Bay Minerals (RBM).
URANIUM
Production ('000 lbs U3O8) (a)
Energy Resources of Australia 68% 603 820 924 793 620 1,270 1,413
Rössing (b) 69% 928 994 979 802 1,142 1,776 1,944
Rio Tinto total uranium production 1,531 1,814 1,904 1,595 1,762 3,046 3,357
(a) ERA and Rössing production reported are drummed U3O8. (b) On 26 November 2018, Rio Tinto signed a binding agreement to sell its 68.62% interest in the Rossing mine in Namibia to China National Uranium Corporation Limited. Production figures are sometimes more precise than the rounded numbers shown, hence small differences may result between the total of the quarter figures and the year to date figures.
The Rio Tinto percentage shown above is at 30 June 2019.
Rio Tinto's interest in the Kestrel, Hail Creek, Dunkerque and Grasberg operations were sold in 2018. No data for these operations are included in the Share of production table.

Page 19 of 27
Rio Tinto operational data
Rio Tinto
interest Q2
2018 Q3
2018 Q4
2018 Q1
2019 Q2
2019 H1
2018 H1
2019
ALUMINA
Smelter Grade Alumina - Aluminium Group
Alumina production ('000 tonnes)
Australia
Queensland Alumina Refinery - Queensland 80.0% 940 935 927 888 834 1,836 1,723
Yarwun refinery - Queensland 100.0% 763 744 803 813 757 1,556 1,570
Brazil
São Luis (Alumar) refinery 10.0% 869 851 918 859 864 1,740 1,723
Canada
Jonquière (Vaudreuil) refinery - Quebec (a) 100.0% 365 363 354 373 336 727 709
(a) Jonquière’s (Vaudreuil’s) production shows smelter grade alumina only and excludes hydrate produced and used for specialty alumina.
Specialty Alumina - Aluminium Group
Specialty alumina production ('000 tonnes)
Canada
Jonquière (Vaudreuil) plant – Quebec 100.0% 32 31 29 25 31 64 57
Rio Tinto percentage interest shown above is at 30 June 2019. The data represent full production and sales on a 100% basis unless otherwise stated.
Page 20 of 27
Rio Tinto operational data
Rio Tinto
interest Q2
2018 Q3
2018 Q4
2018 Q1
2019 Q2
2019 H1
2018 H1
2019
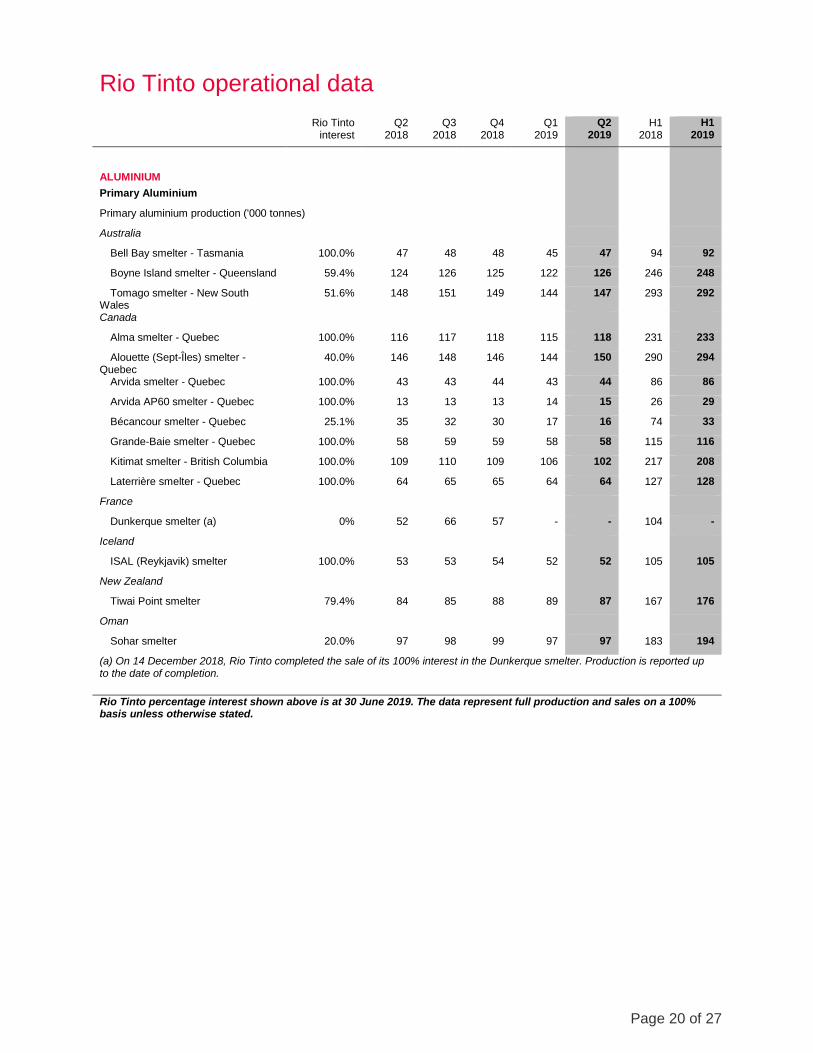
ALUMINIUM
Primary Aluminium
Primary aluminium production ('000 tonnes)
Australia
Bell Bay smelter - Tasmania 100.0% 47 48 48 45 47 94 92
Boyne Island smelter - Queensland 59.4% 124 126 125 122 126 246 248
Tomago smelter - New South Wales
51.6% 148 151 149 144 147 293 292
Canada
Alma smelter - Quebec 100.0% 116 117 118 115 118 231 233
Alouette (Sept-Îles) smelter - Quebec
40.0% 146 148 146 144 150 290 294
Arvida smelter - Quebec 100.0% 43 43 44 43 44 86 86
Arvida AP60 smelter - Quebec 100.0% 13 13 13 14 15 26 29
Bécancour smelter - Quebec 25.1% 35 32 30 17 16 74 33
Grande-Baie smelter - Quebec 100.0% 58 59 59 58 58 115 116
Kitimat smelter - British Columbia 100.0% 109 110 109 106 102 217 208
Laterrière smelter - Quebec 100.0% 64 65 65 64 64 127 128
France
Dunkerque smelter (a) 0% 52 66 57 - - 104 -
Iceland
ISAL (Reykjavik) smelter 100.0% 53 53 54 52 52 105 105
New Zealand
Tiwai Point smelter 79.4% 84 85 88 89 87 167 176
Oman
Sohar smelter 20.0% 97 98 99 97 97 183 194
(a) On 14 December 2018, Rio Tinto completed the sale of its 100% interest in the Dunkerque smelter. Production is reported up to the date of completion.
Rio Tinto percentage interest shown above is at 30 June 2019. The data represent full production and sales on a 100% basis unless otherwise stated.

Page 21 of 27
Rio Tinto operational data
Rio Tinto
interest Q2
2018 Q3
2018 Q4
2018 Q1
2019 Q2
2019 H1
2018 H1
2019
BAUXITE
Bauxite production ('000 tonnes)
Australia
Gove mine - Northern Territory 100.0% 3,274 2,893 3,250 3,004 2,957 6,398 5,960
Weipa mine - Queensland 100.0% 7,955 8,204 6,847 7,917 8,533 15,386 16,450
Brazil
Porto Trombetas (MRN) mine 12.0% 3,273 2,848 4,073 2,372 2,393 6,212 4,765
Guinea
Sangaredi mine (a) 23.0% 3,683 2,803 2,675 3,463 3,623 7,561 7,087
Rio Tinto share of bauxite shipments
Share of total bauxite shipments ('000 tonnes) 12,936 12,427 11,622 12,725 13,122 25,487 25,847
Share of third party bauxite shipments ('000 tonnes) 8,738 8,441 7,387 8,842 9,477 16,986 18,318
(a) Rio Tinto has a 22.95% shareholding in the Sangaredi mine but benefits from 45.0% of production.
Rio Tinto percentage interest shown above is at 30 June 2019. The data represent full production and sales on a 100% basis unless otherwise stated.

Page 22 of 27
Rio Tinto operational data
Rio Tinto
interest Q2
2018 Q3
2018 Q4
2018 Q1
2019 Q2
2019 H1
2018 H1
2019
BORATES
Rio Tinto Borates - borates 100.0%
US
Borates ('000 tonnes) (a)
132 137 118 115 138 256 253
(a) Production is expressed as B2O3 content.
COAL
Rio Tinto Coal Australia
Hail Creek Coal mine (a) 0.0%
Queensland
Hard coking coal ('000 tonnes)
1,380 396 - - - 2,304 -
Thermal coal ('000 tonnes)
1,018 449 - - - 2,311 -
Kestrel Coal mine (b) 0.0%
Queensland
Hard coking coal ('000 tonnes)
1,303 484 - - - 1,733 -
Thermal coal ('000 tonnes)
220 35 - - - 293 -
Total hard coking coal production ('000 tonnes) 2,683 880 - - - 4,037 -
Total thermal coal production ('000 tonnes) 1,238 485 - - - 2,605 -
Total coal production ('000 tonnes)
3,921 1,365 - - - 6,642 -
Total coal sales ('000 tonnes)
3,717 1,725 - - - 6,767 -
Rio Tinto Coal Australia share (c)
Share of hard coking coal sales ('000 tonnes) 2,228 650 - - - 3,596 -
Share of thermal coal sales ('000 tonnes) (d) 791 754 - - - 1,910 -
(a) On 1 August 2018, Rio Tinto completed the sale of its 82% interest in the Hail Creek mine. Production is reported up to the date of completion. (b) On 1 August 2018, Rio Tinto completed the sale of its 80% interest in the Kestrel mine. Production is reported up to the date of completion. (c) Kestrel and Hail Creek produce hard coking coal and thermal coal through their mining operations. Both mines may blend coal types at ports. (d) Sales relate only to coal mined by the operations and exclude traded coal. Rio Tinto percentage interest shown above is at 30 June 2019. The data represent full production and sales on a 100% basis unless otherwise stated.

Page 23 of 27
Rio Tinto operational data
Rio Tinto
interest Q2
2018 Q3
2018 Q4
2018 Q1
2019 Q2
2019 H1
2018 H1
2019
COPPER & GOLD
Escondida 30.0%
Chile
Sulphide ore to concentrator ('000 tonnes) 31,732 30,513 30,507 32,027 32,519 63,936 64,546
Average copper grade (%)
0.96 0.94 0.87 0.82 0.86 0.96 0.84
Mill production (metals in concentrates):
Contained copper ('000 tonnes)
253.6 241.9 219.9 216.9 231.7 506.2 448.6
Contained gold ('000 ounces)
68 64 74 74 75 128 149
Contained silver ('000 ounces)
2,527 1,997 2,570 2,189 2,074 4,866 4,263
Recoverable copper in ore stacked for leaching ('000 tonnes) (a) 54.4 49.4 45.7 36.5 44.5 104.8 81.0
Refined production from leach plants:
Copper cathode production ('000 tonnes)
70.1 55.4 71.9 62.4 63.5 139.5 125.8
(a) The calculation of copper in material mined for leaching is based on ore stacked at the leach pad.
Freeport-McMoRan
Grasberg mine (a) 0.0% (b)
Papua, Indonesia
Ore treated ('000 tonnes)
17,101 17,535 14,049 - - 32,725 -
Average mill head grades:
Copper (%)
1.06 1.00 0.73 - - 1.09 -
Gold (g/t)
1.77 1.77 1.08 - - 1.71 -
Silver (g/t)
5.09 4.49 2.09 - - 4.89 -
Production of metals in concentrates:
Copper in concentrates ('000 tonnes)
165.7 158.7 85.4 - - 325.6 -
Gold in concentrates ('000 ounces)
842 842 402 - - 1,535 -
Silver in concentrates ('000 ounces)
1,548 1,439 545 - - 3,061 -
Sales of payable metals in concentrates: (c)
Copper in concentrates ('000 tonnes)
145.3 170.6 82.7 - - 302.7 -
Gold in concentrates ('000 ounces)
740 903 399 - - 1,417 -
Silver in concentrates ('000 ounces)
1,098 1,221 426 - - 2,282 -
(a) Through a joint venture agreement with Freeport-McMoRan (FCX), Rio Tinto is entitled to 40% of additional material mined as a consequence of expansions and developments of the Grasberg facilities since 1998. The Q4 2018 results show the forecast from FCX's most recent five-year plan. On 21 December 2018, Rio Tinto completed the sale of its entire interest in the Grasberg mine in Indonesia to PT Indonesia Asahan Aluminium (Persero) (Inalum). Production is reported up to the date of completion. (b) Rio Tinto share of Grasberg production is 40% of the expansion. (c) Net of smelter deduction
Rio Tinto percentage interest shown above is at 30 June 2019. The data represent full production and sales on a 100% basis unless otherwise stated.

Page 24 of 27
Rio Tinto operational data
Rio Tinto
interest Q2
2018 Q3
2018 Q4
2018 Q1
2019 Q2
2019 H1
2018 H1
2019
COPPER & GOLD (continued)
Rio Tinto Kennecott
Bingham Canyon mine 100.0%
Utah, US
Ore treated ('000 tonnes)
8,974 11,173 10,853 10,685 10,123 18,234 20,808
Average ore grade:
Copper (%)
0.63 0.58 0.59 0.55 0.46 0.53 0.50
Gold (g/t)
0.26 0.26 0.26 0.25 0.33 0.25 0.29
Silver (g/t)
2.73 2.62 2.76 2.76 2.84 2.49 2.80
Molybdenum (%)
0.025 0.030 0.032 0.032 0.039 0.025 0.035
Copper concentrates produced ('000 tonnes) 194 233 222 207 161 365 368
Average concentrate grade (% Cu)
26.4 25.3 26.0 25.3 25.5 23.7 25.4
Production of metals in copper concentrates:
Copper ('000 tonnes) (a)
51.2 59.1 58.3 52.5 41.1 86.6 93.7
Gold ('000 ounces)
46 57 57 53 65 83 118
Silver ('000 ounces)
615 708 736 741 700 1,076 1,442
Molybdenum concentrates produced ('000 tonnes): 1.5 2.8 4.5 3.8 5.0 4.3 8.7
Molybdenum in concentrates ('000 tonnes)
0.7 1.4 2.2 1.9 2.6 2.2 4.4
Kennecott smelter & refinery 100.0%
Copper concentrates smelted ('000 tonnes) 224 246 262 204 207 425 411
Copper anodes produced ('000 tonnes) (b) 44.4 58.1 62.4 33.3 60.3 86.9 93.6
Production of refined metal:
Copper ('000 tonnes)
40.7 54.2 64.6 29.6 63.3 76.0 92.8
Gold ('000 ounces) (c)
48.4 50.3 58.6 41.7 52.9 89.2 94.6
Silver ('000 ounces) (c)
461 730 807 617 734 1,328 1,351
(a) Includes a small amount of copper in precipitates. (b) New metal excluding recycled material. (c) Includes gold and silver in intermediate products.
Rio Tinto percentage interest shown above is at 30 June 2019. The data represent full production and sales on a 100% basis unless otherwise stated.

Page 25 of 27
Rio Tinto operational data
Rio Tinto
interest Q2
2018 Q3
2018 Q4
2018 Q1
2019 Q2
2019 H1
2018 H1
2019
COPPER & GOLD (continued)
Turquoise Hill Resources
Oyu Tolgoi mine (a) 33.5%
Mongolia
Ore Treated ('000 tonnes)
10,164 9,652 9,361 9,255 10,394 19,725 19,649
Average mill head grades:
Copper (%)
0.48 0.51 0.55 0.57 0.46 0.50 0.51
Gold (g/t)
0.26 0.38 0.56 0.58 0.31 0.25 0.44
Silver (g/t)
1.17 1.19 1.22 1.25 1.20 1.24 1.23
Copper concentrates produced ('000 tonnes) 178.8 179.8 189.0 210.1 180.6 356.1 390.7
Average concentrate grade (% Cu)
22.0 21.9 21.9 21.8 21.7 22.0 21.8
Production of metals in concentrates:
Copper in concentrates ('000 tonnes)
39.4 39.4 41.5 45.8 39.2 78.2 85.0
Gold in concentrates ('000 ounces)
50.0 77.0 116.7 120.1 71.8 91.7 191.9
Silver in concentrates ('000 ounces)
225 230 238 247 239 446 486
Sales of metals in concentrates:
Copper in concentrates ('000 tonnes)
46.1 36.0 40.2 38.5 46.6 80.4 85.1
Gold in concentrates ('000 ounces)
51 55 111 98 116 82 213
Silver in concentrates ('000 ounces)
250 201 216 200 245 456 445
(a) Rio Tinto owns a 33.52% indirect interest in Oyu Tolgoi through its 50.79% interest in Turquoise Hill Resources.
DIAMONDS
Argyle Diamonds 100.0%
Western Australia
AK1 ore processed ('000 tonnes)
1,428 1,465 1,292 1,248 1,427 2,688 2,674
AK1 diamonds produced ('000 carats)
3,476 3,830 3,211 2,786 3,292 7,027 6,079
Diavik Diamonds 60.0%
Northwest Territories, Canada
Ore processed ('000 tonnes)
652 670 651 620 671 1,208 1,291
Diamonds recovered ('000 carats)
1,916 1,776 1,797 1,683 1,980 3,690 3,663
Rio Tinto percentage interest shown above is at 30 June 2019. The data represent full production and sales on a 100% basis unless otherwise stated.
Page 26 of 27
Rio Tinto operational data
Rio Tinto
interest Q2
2018 Q3
2018 Q4
2018 Q1
2019 Q2
2019 H1
2018 H1
2019
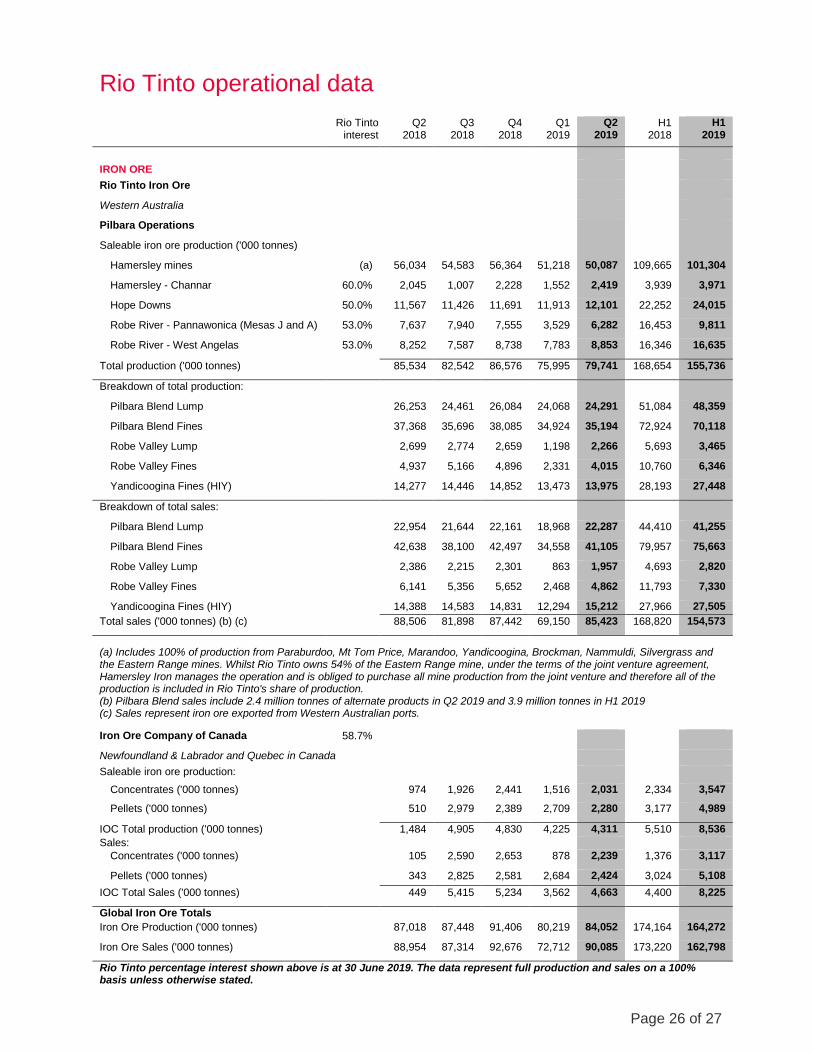
IRON ORE
Rio Tinto Iron Ore
Western Australia
Pilbara Operations
Saleable iron ore production ('000 tonnes)
Hamersley mines (a) 56,034 54,583 56,364 51,218 50,087 109,665 101,304
Hamersley - Channar 60.0% 2,045 1,007 2,228 1,552 2,419 3,939 3,971
Hope Downs 50.0% 11,567 11,426 11,691 11,913 12,101 22,252 24,015
Robe River - Pannawonica (Mesas J and A) 53.0% 7,637 7,940 7,555 3,529 6,282 16,453 9,811
Robe River - West Angelas 53.0% 8,252 7,587 8,738 7,783 8,853 16,346 16,635
Total production ('000 tonnes) 85,534 82,542 86,576 75,995 79,741 168,654 155,736
Breakdown of total production:
Pilbara Blend Lump
26,253 24,461 26,084 24,068 24,291 51,084 48,359
Pilbara Blend Fines
37,368 35,696 38,085 34,924 35,194 72,924 70,118
Robe Valley Lump
2,699 2,774 2,659 1,198 2,266 5,693 3,465
Robe Valley Fines
4,937 5,166 4,896 2,331 4,015 10,760 6,346
Yandicoogina Fines (HIY)
14,277 14,446 14,852 13,473 13,975 28,193 27,448
Breakdown of total sales:
Pilbara Blend Lump
22,954 21,644 22,161 18,968 22,287 44,410 41,255
Pilbara Blend Fines
42,638 38,100 42,497 34,558 41,105 79,957 75,663
Robe Valley Lump
2,386 2,215 2,301 863 1,957 4,693 2,820
Robe Valley Fines
6,141 5,356 5,652 2,468 4,862 11,793 7,330
Yandicoogina Fines (HIY)
14,388 14,583 14,831 12,294 15,212 27,966 27,505 Total sales ('000 tonnes) (b) (c) 88,506 81,898 87,442 69,150 85,423 168,820 154,573
(a) Includes 100% of production from Paraburdoo, Mt Tom Price, Marandoo, Yandicoogina, Brockman, Nammuldi, Silvergrass and the Eastern Range mines. Whilst Rio Tinto owns 54% of the Eastern Range mine, under the terms of the joint venture agreement, Hamersley Iron manages the operation and is obliged to purchase all mine production from the joint venture and therefore all of the production is included in Rio Tinto's share of production. (b) Pilbara Blend sales include 2.4 million tonnes of alternate products in Q2 2019 and 3.9 million tonnes in H1 2019 (c) Sales represent iron ore exported from Western Australian ports.
Iron Ore Company of Canada 58.7%
Newfoundland & Labrador and Quebec in Canada
Saleable iron ore production:
Concentrates ('000 tonnes)
974 1,926 2,441 1,516 2,031 2,334 3,547
Pellets ('000 tonnes)
510 2,979 2,389 2,709 2,280 3,177 4,989
IOC Total production ('000 tonnes)
1,484 4,905 4,830 4,225 4,311 5,510 8,536 Sales:
Concentrates ('000 tonnes)
105 2,590 2,653 878 2,239 1,376 3,117
Pellets ('000 tonnes)
343 2,825 2,581 2,684 2,424 3,024 5,108 IOC Total Sales ('000 tonnes)
449 5,415 5,234 3,562 4,663 4,400 8,225
Global Iron Ore Totals Iron Ore Production ('000 tonnes)
87,018 87,448 91,406 80,219 84,052 174,164 164,272
Iron Ore Sales ('000 tonnes)
88,954 87,314 92,676 72,712 90,085 173,220 162,798
Rio Tinto percentage interest shown above is at 30 June 2019. The data represent full production and sales on a 100% basis unless otherwise stated.

Page 27 of 27
Rio Tinto operational data
Rio Tinto
interest Q2
2018 Q3
2018 Q4
2018 Q1
2019 Q2
2019 H1
2018 H1
2019
SALT
Dampier Salt 68.4%
Western Australia
Salt production ('000 tonnes) 2,431 2,167 2,188 1,917 1,856 4,646 3,773
TITANIUM DIOXIDE SLAG
Rio Tinto Iron & Titanium 100.0%
Canada and South Africa
(Rio Tinto share) (a)
Titanium dioxide slag ('000 tonnes)
232 297 294 296 303 525 599
(a) Quantities comprise 100% of Rio Tinto Fer et Titane and Rio Tinto's 74% interest in Richards Bay Minerals' production. Ilmenite mined in Madagascar is being processed in Canada.
URANIUM
Energy Resources of Australia Ltd
Ranger mine (a) 68.4%
Northern Territory, Australia
U3O8 Production ('000 lbs)
881 1,199 1,351 1,160 906 1,856 2,066
(a) ERA production data are drummed U3O8.
Rössing Uranium Ltd (a) (b) 68.6%
Namibia
U3O8 Production ('000 lbs)
1,352 1,449 1,427 1,168 1,665 2,589 2,833
(a) Rössing production data are drummed U3O8. (b) On 26 November 2018, Rio Tinto signed a binding agreement to sell its 68.62% interest in the Rossing mine in Namibia to China National Uranium Corporation Limited.
Rio Tinto percentage interest shown above is at 30 June 2019. The data represent full production and sales on a 100% basis unless otherwise stated.