second quarter financial report - torontohydro.com · second quarter financial report , 2016....
TRANSCRIPT

SECOND QUARTER FINANCIAL REPORT
JUNE 30, 2016
TORONTO HYDRO CORPORATION
TABLE OF CONTENTS
Glossary 3
Management’s Discussion and Analysis 4
Executive Summary 5
Introduction 5
Business of Toronto Hydro Corporation 6
Corporate Strategy 7
Performance Measurement 7
Selected Consolidated Financial Data 8
Results of Operations 10
Summary of Quarterly Results of Operations 17
Financial Position 18
Liquidity and Capital Resources 19
Corporate Developments 24
Legal Proceedings 25
Controls and Procedures 25
Critical Accounting Estimates 25
Changes in Accounting Policies 25
Future Accounting Pronouncements 25
Forward-Looking Information 26
Additional Information 27
Unaudited Condensed Interim Consolidated Financial Statements 28
Notes to Unaudited Condensed Interim Consolidated Financial Statements 32

3
GLOSSARY
CDM – Conservation and demand management
CIR – Custom Incentive Rate-setting
City – City of Toronto
Copeland Station – The Clare R. Copeland
transformer station, formerly called “Bremner
Station”.
Corporation – Toronto Hydro Corporation
Electricity Act – Electricity Act, 1998 (Ontario)
ERM – Enterprise risk management
GAAP – Generally Accepted Accounting Principles
GWh – Gigawatt hour
IAS – International Accounting Standard
IASB – International Accounting Standards Board
ICM – Incremental Capital Module
IESO – Independent Electricity System Operator.
The IESO and the Ontario Power Authority were
merged under the name Independent Electricity
System Operator on January 1, 2015.
IFRS – International Financial Reporting Standards
KPIs – Key performance indicators
kW – Kilowatt
kWh – Kilowatt hour
LDC – Toronto Hydro-Electric System Limited
LRAM – Lost revenue adjustment mechanism
MD&A – Management's Discussion and Analysis
OCI – Other comprehensive income
OEB – Ontario Energy Board
OMERS – Ontario Municipal Employees Retirement
System
OPEB – Other post-employment benefits
OSC – Ontario Securities Commission
PP&E – Property, plant and equipment
TH Energy – Toronto Hydro Energy Services Inc.
WMS – Wholesale Market Service

MANAGEMENT’S DISCUSSION AND ANALYSIS
FOR THE INTERIM PERIODS ENDED
JUNE 30, 2016 AND 2015

5
Executive Summary
Net income after net movements in regulatory balances and OCI for the three months and six months ended June
30, 2016 was $31.2 million and $75.5 million compared to $15.9 million and $32.4 million for the comparable
periods in 2015;
capital expenditures were primarily related to the renewal of the electricity infrastructure of LDC and were
$133.0 million and $266.9 million for the three months and six months ended June 30, 2016 compared to $151.7
million and $260.7 million for the comparable periods in 2015;
the OEB issued its CIR decision regarding the 2015-2019 rate application on December 29, 2015 and its CIR
rate order on March 1, 2016, approving a rate base of $3,232.0 million and revenue requirement of $633.1 million
for 2015, and rates calculated on that basis;
the distribution rates for 2015 and 2016 were implemented on March 1, 2016, with effective dates of May 1,
2015 and January 1, 2016, respectively;
on June 14, 2016, the Corporation issued $200.0 million of 2.52% senior unsecured debentures due August 25,
2026; and
on July 28, 2016, the OEB approved a settlement proposal by LDC and intervenors to the ICM rate application,
providing that there would be no change to the 2015-2019 rate base previously approved.
Introduction
This MD&A should be read in conjunction with:
the Corporation’s unaudited condensed interim consolidated financial statements and accompanying notes as at
and for the three and six months ended June 30, 2016 and 2015, which were prepared in accordance with IAS 34
Interim Financial Reporting (the “Interim Financial Statements”);
the Corporation’s audited consolidated financial statements and accompanying notes as at December 31, 2015,
December 31, 2014, and January 1, 2014, and for the years ended December 31, 2015 and 2014, which were
prepared in accordance with IFRS (the annual “Consolidated Financial Statements”); and
the Corporation’s MD&A for the three months and years ended December 31, 2015 and 2014 (the “2015 Annual
MD&A”) (including the sections entitled “Electricity Distribution – Industry Overview”, “Corporate Strategy”,
“Capability to Deliver Results”, “Electricity Distribution Rates”, “CDM Activities”, “Share Capital”,
“Transactions with Related Parties”, “Future Accounting Pronouncements”, and “Risk Management and Risk
Factors”, which remain substantially unchanged as at the date hereof, except as may be noted below or as updated
by the Interim Financial Statements).
Copies of these documents are available on the System for Electronic Document Analysis and Retrieval website at
www.sedar.com.
The Interim Financial Statements are presented in Canadian dollars, the Corporation’s functional currency.
6
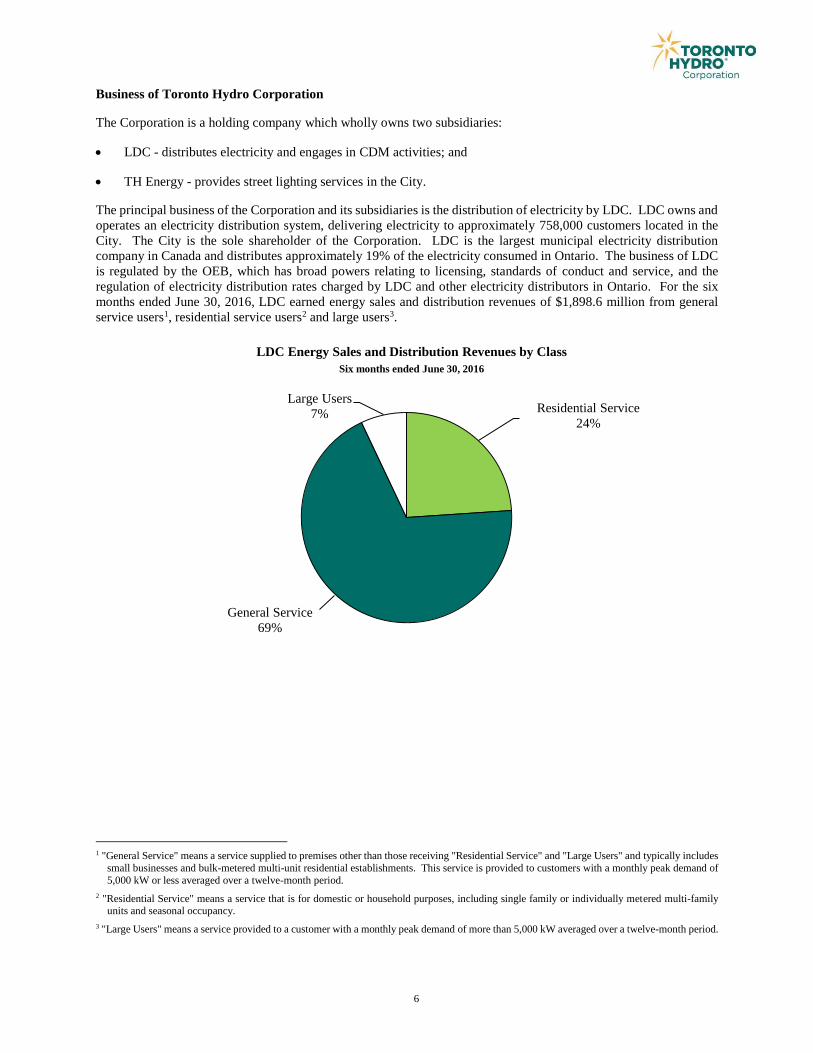
Business of Toronto Hydro Corporation
The Corporation is a holding company which wholly owns two subsidiaries:
LDC - distributes electricity and engages in CDM activities; and
TH Energy - provides street lighting services in the City.
The principal business of the Corporation and its subsidiaries is the distribution of electricity by LDC. LDC owns and
operates an electricity distribution system, delivering electricity to approximately 758,000 customers located in the
City. The City is the sole shareholder of the Corporation. LDC is the largest municipal electricity distribution
company in Canada and distributes approximately 19% of the electricity consumed in Ontario. The business of LDC
is regulated by the OEB, which has broad powers relating to licensing, standards of conduct and service, and the
regulation of electricity distribution rates charged by LDC and other electricity distributors in Ontario. For the six
months ended June 30, 2016, LDC earned energy sales and distribution revenues of $1,898.6 million from general
service users1, residential service users2 and large users3.
1 "General Service" means a service supplied to premises other than those receiving "Residential Service" and "Large Users" and typically includes
small businesses and bulk-metered multi-unit residential establishments. This service is provided to customers with a monthly peak demand of
5,000 kW or less averaged over a twelve-month period.
2 "Residential Service" means a service that is for domestic or household purposes, including single family or individually metered multi-family units and seasonal occupancy.
3 "Large Users" means a service provided to a customer with a monthly peak demand of more than 5,000 kW averaged over a twelve-month period.
Residential Service
24%
Large Users
7%
LDC Energy Sales and Distribution Revenues by Class
Six months ended June 30, 2016
General Service
69%

7
Corporate Strategy
The Corporation’s vision is to “continuously maximize customer and stakeholders’ satisfaction by being safe, reliable
and environmentally responsible at optimal costs”. The Corporation has an ERM framework that helps determine
whether the Corporation is well positioned to achieve its strategic objectives. The ERM framework provides a
consistent, disciplined methodology for controlling risk by identifying, assessing, managing, monitoring and reporting
risks for the Corporation.
The Corporation is focused on the following four strategic pillars:
People – to maintain an engaged, healthy, productive and safe workforce to meet changing business
requirements;
Financial – to meet the financial objectives of its shareholder;
Operations – to improve reliability through sustainable system management; and
Customer – to provide value to customers.
Performance Measurement
The Corporation measures its performance in relation to the achievement of its strategic objectives by using a balanced
scorecard approach. KPIs are monitored throughout the year and appropriate actions are taken as required. The
performance measures associated with the four strategic pillars are as follows:
Strategic Pillars
Performance Measure
People
Safety index
Sustainability index
Talent index
Financial Net income after net movements in regulatory balances and OCI
Operations
System average interruption duration index
System average interruption frequency index
Key account worst performing feeders
LDC regulated capital
Customer First call resolution
Enhanced online customer engagement

8
Selected Consolidated Financial Data
Condensed Interim Consolidated Statements of Income and Other Comprehensive Income
Three months ended June 30 (in millions of Canadian dollars)
2016
$
2015
$
Change
$
Revenues
Energy sales 801.1 695.2 105.9
Distribution revenue 158.8 132.7 26.1
Other 16.8 15.0 1.8
976.7 842.9 133.8
Expenses
Energy purchases 790.0 727.7 (62.3)
Operating expenses 63.4 65.2 1.8
Depreciation and amortization 53.7 43.0 (10.7)
907.1 835.9 (71.2)
Finance costs 18.5 17.6 (0.9)
Income (loss) before income taxes 51.1 (10.6) 61.7
Income tax expense 15.0 5.6 (9.4)
Net income (loss) for the period 36.1 (16.2) 52.3
Net movements in regulatory balances, net of tax (4.9) 32.1 (37.0)
Net income after net movements in regulatory balances and
OCI 31.2 15.9
15.3

9
Condensed Interim Consolidated Statements of Income and Other Comprehensive Income
Six months ended June 30 (in millions of Canadian dollars)
2016
$
2015
$
Change
$
Revenues
Energy sales 1,593.0 1,398.8 194.2
Distribution revenue 305.6 279.7 25.9
Other 32.7 28.5 4.2
1,931.3 1,707.0 224.3
Expenses
Energy purchases 1,567.4 1,414.9 (152.5)
Operating expenses 129.6 135.5 5.9
Depreciation and amortization 100.8 85.7 (15.1)
1,797.8 1,636.1 (161.7)
Finance costs 37.2 34.6 (2.6)
Gain on disposals of PP&E - 6.4 (6.4)
Income before income taxes 96.3 42.7 53.6
Income tax expense 22.6 10.9 (11.7)
Net income for the period 73.7 31.8 41.9
Net movements in regulatory balances, net of tax 1.8 0.6 1.2
Net income after net movements in regulatory balances and
OCI 75.5 32.4
43.1
Condensed Interim Consolidated Balance Sheet Data
(in millions of Canadian dollars)
As at
June 30
2016
$
As at
December 31
2015
$
Current assets 584.8 541.7
Non-current assets 4,056.6 3,903.5
Total assets 4,641.4 4,445.2
Regulatory balances 222.8 241.7
Total assets and regulatory balances 4,864.2 4,686.9
Current liabilities 824.6 875.9
Non-current liabilities 2,516.9 2,298.5
Total liabilities 3,341.5 3,174.4
Equity 1,371.8 1,340.9
Total liabilities and equity 4,713.3 4,515.3
Regulatory balances 150.9 171.6
Total liabilities, equity and regulatory balances 4,864.2 4,686.9

10
Results of Operations
Net Income after Net Movements in Regulatory Balances and OCI
Net income after net movements in regulatory balances and OCI for the three months and six months ended June 30,
2016 was $31.2 million and $75.5 million compared to $15.9 million and $32.4 million for the comparable periods in
2015.
The increase in net income after net movements in regulatory balances and OCI for the three months ended June 30,
2016 was primarily due to implementation of electricity rates per the OEB CIR decision ($26.9 million) and higher
other revenue ($1.8 million). These variances were partially offset by higher depreciation and amortization ($10.7
million), and higher income tax expense and income tax recorded in net movements in regulatory balances ($3.1
million).
The increase in net income after net movements in regulatory balances and OCI for the six months ended June 30,
2016 was primarily due to implementation of electricity rates per the OEB CIR decision and rate order ($56.3 million),
lower operating expenses ($5.9 million), and higher other revenue ($4.2 million). These variances were partially
offset by higher depreciation and amortization ($15.1 million), higher income tax expense and income tax recorded in
net movements in regulatory balances ($6.2 million), and higher finance costs ($2.6 million).
Energy Sales
LDC’s energy sales arise from charges to customers for electricity consumed, based on regulated rates. Energy sales
include amounts billed or billable to customers for commodity charges, retail transmission charges, and WMS charges
at current rates. These charges are passed through to customers over time and are considered revenue by LDC. During
the same period, energy sales should be equal to the cost of energy purchased. However, a difference between energy
sales and energy purchases arises when there is a timing difference between the amounts charged by LDC to
customers, based on regulated rates, and the electricity and non-competitive electricity service costs billed monthly
by the IESO to LDC. This difference is recorded as a settlement variance, representing future amounts to be recovered
from or refunded to customers through future billing rates approved by the OEB. In accordance with IFRS 14 –
Regulatory Deferral Accounts (“IFRS 14”), this settlement variance is presented within regulatory balances on the
condensed interim consolidated balance sheets (“Consolidated Balance Sheets”) and within net movements in
regulatory balances, net of tax on the condensed interim consolidated statements of income and OCI (“Consolidated
Statements of Income”).
684.1
82.5
34.5
596.6
65.9 32.7
-
100.0
200.0
300.0
400.0
500.0
600.0
700.0
800.0
Commodity Transmission WMS
LDC Energy SalesThree months ended June 30, 2016
(in millions of Canadian dollars)
Q2 2016 Q2 2015

11
Energy sales for the three months ended June 30, 2016 were $801.1 million compared to $695.2 million for the
comparable period in 2015. The increase was primarily due to higher commodity charges ($87.5 million) and higher
retail transmission charges ($16.6 million).
Energy Sales, Settlement Variances and Energy Purchases Three months ended June 30, 2016 (in millions of Canadian dollars)
Energy Sales
$
Settlement Variances
$
Energy Purchases
$
Commodity Charges 684.1 3.6 687.7
Retail Transmission Charges 82.5 (9.3) 73.2
WMS Charges 34.5 (5.4) 29.1
Total 801.1 (11.1) 790.0
For the three months ended June 30, 2016, LDC recognized $801.1 million in energy sales to customers and was billed
$790.0 million for energy purchases from the IESO. The difference between energy sales and energy purchases
represents a $11.1 million settlement variance for the period. As such, the settlement variance was recorded as a
decrease to the regulatory debit balance ($11.0 million including carrying charges) on the Consolidated Balance
Sheets, and presented within net movements in regulatory balances, net of tax on the Consolidated Statements of
Income.
Energy sales for the six months ended June 30, 2016 were $1,593.0 million compared to $1,398.8 million for the
comparable period in 2015. The increase was primarily due to higher commodity charges ($172.6 million) and higher
retail transmission charges ($19.7 million).
1,359.5
160.3 73.2
1,186.9
140.6 71.3
-
200.0
400.0
600.0
800.0
1,000.0
1,200.0
1,400.0
1,600.0
Commodity Transmission WMS
LDC Energy SalesSix months ended June 30, 2016
(in millions of Canadian dollars)
Q2 YTD 2016 Q2 YTD 2015
12
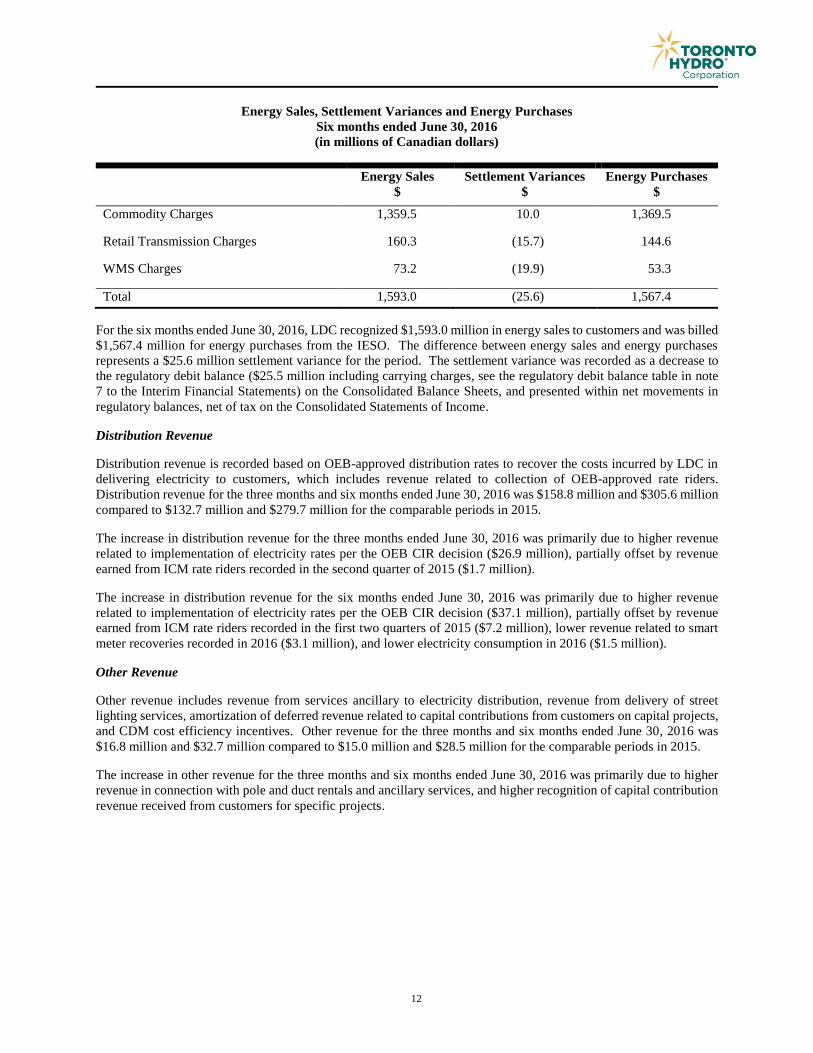
Energy Sales, Settlement Variances and Energy Purchases Six months ended June 30, 2016 (in millions of Canadian dollars)
Energy Sales
$
Settlement Variances
$
Energy Purchases
$
Commodity Charges 1,359.5 10.0 1,369.5
Retail Transmission Charges 160.3 (15.7) 144.6
WMS Charges 73.2 (19.9) 53.3
Total 1,593.0 (25.6) 1,567.4
For the six months ended June 30, 2016, LDC recognized $1,593.0 million in energy sales to customers and was billed
$1,567.4 million for energy purchases from the IESO. The difference between energy sales and energy purchases
represents a $25.6 million settlement variance for the period. The settlement variance was recorded as a decrease to
the regulatory debit balance ($25.5 million including carrying charges, see the regulatory debit balance table in note
7 to the Interim Financial Statements) on the Consolidated Balance Sheets, and presented within net movements in
regulatory balances, net of tax on the Consolidated Statements of Income.
Distribution Revenue
Distribution revenue is recorded based on OEB-approved distribution rates to recover the costs incurred by LDC in
delivering electricity to customers, which includes revenue related to collection of OEB-approved rate riders.
Distribution revenue for the three months and six months ended June 30, 2016 was $158.8 million and $305.6 million
compared to $132.7 million and $279.7 million for the comparable periods in 2015.
The increase in distribution revenue for the three months ended June 30, 2016 was primarily due to higher revenue
related to implementation of electricity rates per the OEB CIR decision ($26.9 million), partially offset by revenue
earned from ICM rate riders recorded in the second quarter of 2015 ($1.7 million).
The increase in distribution revenue for the six months ended June 30, 2016 was primarily due to higher revenue
related to implementation of electricity rates per the OEB CIR decision ($37.1 million), partially offset by revenue
earned from ICM rate riders recorded in the first two quarters of 2015 ($7.2 million), lower revenue related to smart
meter recoveries recorded in 2016 ($3.1 million), and lower electricity consumption in 2016 ($1.5 million).
Other Revenue
Other revenue includes revenue from services ancillary to electricity distribution, revenue from delivery of street
lighting services, amortization of deferred revenue related to capital contributions from customers on capital projects,
and CDM cost efficiency incentives. Other revenue for the three months and six months ended June 30, 2016 was
$16.8 million and $32.7 million compared to $15.0 million and $28.5 million for the comparable periods in 2015.
The increase in other revenue for the three months and six months ended June 30, 2016 was primarily due to higher
revenue in connection with pole and duct rentals and ancillary services, and higher recognition of capital contribution
revenue received from customers for specific projects.

13
Energy purchases
LDC’s energy purchases consist of actual charges for electricity generated by third parties, which are passed through
to customers over time in the form of energy sales. Energy purchases are billed monthly by the IESO and include
commodity charges, retail transmission charges and WMS charges.
Energy purchases for the three months ended June 30, 2016 were $790.0 million compared to $727.7 million for the
comparable period in 2015. The increase was primarily due to higher commodity charges ($48.9 million) and higher
WMS charges ($9.9 million).
Energy purchases for the six months ended June 30, 2016 were $1,567.4 million compared to $1,414.9 million for the
comparable period in 2015. The increase was primarily due to higher commodity charges ($154.3 million).
687.7
73.2 29.1
638.8
69.7 19.2
-
100.0
200.0
300.0
400.0
500.0
600.0
700.0
800.0
Commodity Transmission WMS
LDC Energy PurchasesThree months ended June 30, 2016
(in millions of Canadian dollars)
Q2 2016 Q2 2015
1,369.5
144.6 53.3
1,215.2
146.4 53.3
-
200.0
400.0
600.0
800.0
1,000.0
1,200.0
1,400.0
1,600.0
Commodity Transmission WMS
LDC Energy PurchasesSix months ended June 30, 2016
(in millions of Canadian dollars)
Q2 YTD 2016 Q2 YTD 2015

14
Operating expenses
Operating expenses for the three months and six months ended June 30, 2016 were $63.4 million and $129.6 million
compared to $65.2 million and $135.5 million for the comparable periods in 2015.
The decrease in operating expenses for the three months ended June 30, 2016 was primarily due to lower maintenance
program costs ($3.7 million), partially offset by higher ancillary service costs ($0.9 million).
The decrease in operating expenses for the six months ended June 30, 2016 was primarily due to lower maintenance
program costs ($4.3 million) and lower emergency management costs ($1.0 million).
Depreciation and amortization
Depreciation and amortization expense for the three months and six months ended June 30, 2016 was $53.7 million
and $100.8 million compared to $43.0 million and $85.7 million for the comparable periods in 2015.
The increase in depreciation and amortization expense for the three months and six months ended June 30, 2016 was
primarily due to new in-service asset additions and higher derecognition in 2016, partially offset by certain assets
being fully depreciated.
Finance Costs
Finance costs for the three months and six months ended June 30, 2016 were $18.5 million and $37.2 million compared
to $17.6 million and $34.6 million for the comparable periods in 2015.
The increase in finance costs for the three months and six months ended June 30, 2016 was primarily due to higher
average amount of long-term debt outstanding during 2016 compared with the same period in 2015 (see “Liquidity
and Capital Resources” below).
Gain on Disposals of PP&E
Gain on disposals of PP&E for the three months and six months ended June 30, 2016 was $nil compared to $nil and
$6.4 million for the comparable periods in 2015.
The variance in gain on disposals of PP&E for the six months ended June 30, 2016 was due to gains realized on
disposal of surplus properties in the first quarter of 2015. Consistent with the OEB’s CIR decision and rate order, the
pre-tax gain recorded on the disposal of a surplus property ($5.9 million) under the facilities consolidation program
was recorded as a regulatory credit balance on the Consolidated Balance Sheets, with a corresponding offset in net
movements in regulatory balances, net of tax.
Income Tax Expense and Income Tax Recorded in Net Movements in Regulatory Balances
Income tax expense and income tax recorded in net movements in regulatory balances for the three months and six
months ended June 30, 2016 were $5.5 million and $11.2 million compared to $2.4 million and $5.0 million for the
comparable periods in 2015.
The unfavourable variances in income tax expense and income tax recorded in net movements in regulatory balances
for the three months and six months ended June 30, 2016 were primarily due to higher income before taxes (including
net movements in regulatory balances), offset by higher deductions for permanent and temporary differences between
accounting and tax treatments.
Net Movements in Regulatory Balances, Net of Tax
In accordance with IFRS 14, the Corporation is required to separately present regulatory balances and related
movements on the Consolidated Balance Sheets and Consolidated Statements of Income. The changes in the
regulatory debit ($18.9 million) and credit ($20.7 million) balances for the period equal the net movements in
regulatory balances, net of tax ($1.8 million) for the six months ended June 30, 2016 (see “Financial Position” below).
Under IFRS 14, all regulatory related transactions are first recorded in accordance with other IFRS and then presented
in the net movements in regulatory balances, net of tax caption. The tables below provide a breakdown of the net
15
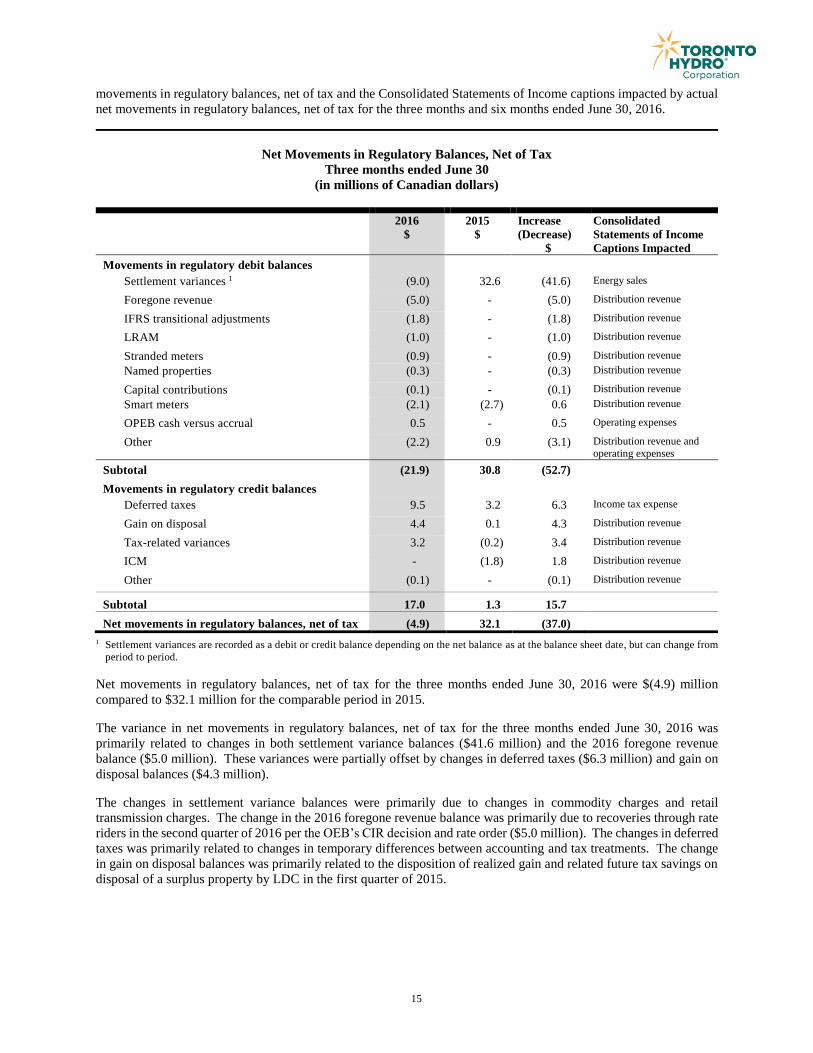
movements in regulatory balances, net of tax and the Consolidated Statements of Income captions impacted by actual
net movements in regulatory balances, net of tax for the three months and six months ended June 30, 2016.
Net Movements in Regulatory Balances, Net of Tax
Three months ended June 30
(in millions of Canadian dollars)
2016
$
2015
$
Increase
(Decrease)
$
Consolidated
Statements of Income
Captions Impacted
Movements in regulatory debit balances
Settlement variances 1 (9.0) 32.6 (41.6) Energy sales
Foregone revenue (5.0) - (5.0) Distribution revenue
IFRS transitional adjustments (1.8) - (1.8) Distribution revenue
LRAM (1.0) - (1.0) Distribution revenue
Stranded meters (0.9) - (0.9) Distribution revenue
Named properties (0.3) - (0.3) Distribution revenue
Capital contributions (0.1) - (0.1) Distribution revenue
Smart meters (2.1) (2.7) 0.6 Distribution revenue
OPEB cash versus accrual 0.5 - 0.5 Operating expenses
Other (2.2) 0.9 (3.1) Distribution revenue and
operating expenses
Subtotal (21.9) 30.8 (52.7)
Movements in regulatory credit balances
Deferred taxes 9.5 3.2 6.3 Income tax expense
Gain on disposal 4.4 0.1 4.3 Distribution revenue
Tax-related variances 3.2 (0.2) 3.4 Distribution revenue
ICM - (1.8) 1.8 Distribution revenue
Other (0.1) - (0.1) Distribution revenue
Subtotal 17.0 1.3 15.7
Net movements in regulatory balances, net of tax (4.9) 32.1 (37.0)
1 Settlement variances are recorded as a debit or credit balance depending on the net balance as at the balance sheet date, but can change from
period to period.
Net movements in regulatory balances, net of tax for the three months ended June 30, 2016 were $(4.9) million
compared to $32.1 million for the comparable period in 2015.
The variance in net movements in regulatory balances, net of tax for the three months ended June 30, 2016 was
primarily related to changes in both settlement variance balances ($41.6 million) and the 2016 foregone revenue
balance ($5.0 million). These variances were partially offset by changes in deferred taxes ($6.3 million) and gain on
disposal balances ($4.3 million).
The changes in settlement variance balances were primarily due to changes in commodity charges and retail
transmission charges. The change in the 2016 foregone revenue balance was primarily due to recoveries through rate
riders in the second quarter of 2016 per the OEB’s CIR decision and rate order ($5.0 million). The changes in deferred
taxes was primarily related to changes in temporary differences between accounting and tax treatments. The change
in gain on disposal balances was primarily related to the disposition of realized gain and related future tax savings on
disposal of a surplus property by LDC in the first quarter of 2015.

16
Net Movements in Regulatory Balances, Net of Tax
Six months ended June 30
(in millions of Canadian dollars)
2016
$
2015
$
Increase
(Decrease)
$
Consolidated
Statements of Income
Captions Impacted
Movements in regulatory debit balances
Settlement variances 1 (23.5) 16.4 (39.9) Energy sales
IFRS transitional adjustments (1.9) - (1.9) Distribution revenue
LRAM (1.0) (1.0) Distribution revenue
Stranded meters (1.0) - (1.0) Distribution revenue
Named properties (0.4) - (0.4) Distribution revenue
Capital contribution (0.1) (0.1) Distribution revenue
Foregone revenue 14.0 - 14.0 Distribution revenue
Smart meters (4.0) (7.0) 3.0 Distribution revenue
OPEB cash versus accrual 1.1 - 1.1 Operating expenses
Other (2.1) 1.6 (3.7) Distribution revenue and operating expenses
Subtotal (18.9) 11.0 (29.9)
Movements in regulatory credit balances
Gain on disposal 4.6 (8.0) 12.6 Distribution revenue and
Gain on disposals of PP&E
ICM (0.1) (7.3) 7.2 Distribution revenue
Deferred taxes 11.4 5.9 5.5 Income tax expense
Tax-related variances 3.3 (1.0) 4.3 Distribution revenue
Derecognition 1.7 - 1.7 Distribution revenue
Other (0.2) - (0.2) Distribution revenue
Subtotal 20.7 (10.4) 31.1
Net movements in regulatory balances, net of tax 1.8 0.6 1.2
Net movements in regulatory balances, net of tax for the six months ended June 30, 2016 were $1.8 million compared
to $0.6 million for the comparable period in 2015.
The variance in net movements in regulatory balances, net of tax for the six months ended June 30, 2016 was primarily
related to an increase in the 2016 foregone revenue balance ($14.0 million) and changes in gain on disposal balances
($12.6 million), ICM balances ($7.2 million), deferred tax balances ($5.5 million), and tax-related variance balances
($4.3 million). These variances were partially offset by changes in both settlement variance balances ($39.9 million)
and the 2016 IFRS transitional adjustment balance ($1.9 million).
The increase in the 2016 foregone revenue balance was primarily due to an additional amount recognized for the
period from January 1, 2016 to February 2016 ($19.2 million) offset by recoveries through rate riders in 2016 ($5.2
million) per the OEB’s CIR decision and rate order. The change in gain on disposal balances was primarily related to
the disposition of realized gain and related future tax savings on disposal of a surplus property by LDC in the first
quarter of 2015. The change in ICM balances was primarily due to revenues collected through the ICM revenue rate
rider during the first two quarters of 2015. The change in deferred taxes was primarily related to changes in temporary
differences between accounting and tax treatments. The change in tax-related variance balance was primarily due to
the disposition of the income tax variance regulatory balance. The changes in settlement variance balances were
primarily due to changes in retail transmission charges and commodity charges. The change in the 2016 IFRS
transitional adjustment balance was related to revenue recoveries in 2016 for the differences arising from accounting
policy changes for PP&E and intangible assets.

17
Summary of Quarterly Results of Operations
The table below presents a summary of the Corporation’s results of operations for eight quarters including and
immediately preceding June 30, 2016. The number of issued and outstanding shares of the Corporation during the
eight quarters noted below was 1,000.
Summary of Quarterly Results of Operations 1
(in millions of Canadian dollars)
June 30
2016
$
March 31
2016
$
December 31
2015
$
September 30
2015
$
Revenues 976.7 954.6 855.3 977.6
Net income after net movements
in regulatory balances and OCI
31.2
44.3
74.3
20.0
June 30
2015
$
March 31
2015
$
December 31
2014
$
September 30
2014
$
Revenues 842.9 864.1 864.8 808.4
Net income after net movements
in regulatory balances and OCI
15.9
16.5
23.8
35.1
1 Quarterly financial information for 2016 and 2015 has been derived from the annual Consolidated Financial Statements and interim financial
statements of the Corporation, which have been prepared in accordance with IFRS. Quarterly financial information for 2014 that was previously
reported in accordance with United States GAAP is now reported in accordance with IFRS.
The Corporation’s revenues, all other things being equal, are impacted by changes in temperature. Revenues would
tend to be higher in the first quarter as a result of higher energy consumption for winter heating, and in the third quarter
due to air conditioning/cooling.
The Corporation’s revenues are also impacted by fluctuations in electricity prices and the timing and recognition of
regulatory decisions. This resulted in variations from the trend noted above for the second quarter of 2016 due to
implementation of electricity rates per the OEB CIR decision and rate order and for the fourth quarter of 2014 due to
higher commodity charges as a result of global adjustments.

18
Financial Position
The following table outlines the significant changes in the Consolidated Balance Sheets as at June 30, 2016 as
compared to the Consolidated Balance Sheets as at December 31, 2015.
Condensed Interim Consolidated Balance Sheet Data As at June 30, 2016 compared to December 31, 2015
(in millions of Canadian dollars)
Balance Sheet Account Increase
(Decrease)
Explanation of Significant Change $
Assets
Accounts receivable and unbilled
revenue
45.5 The increase was primarily due to higher pass-
through electricity costs as a result of
implementation of electricity rates per the OEB CIR
decision and rate order and timing variances of
billing and collection activities from electricity
customers.
PP&E and intangible assets 165.1 The increase was primarily due to capital
expenditures, partially offset by depreciation and
derecognition during the period.
Deferred tax assets (11.8) The decrease was due to lower net deductible
temporary differences between tax and accounting
values of PP&E and intangible assets.
Liabilities and Equity
Working capital facility (7.5) The decrease was primarily due to timing of cash
flows (see “Liquidity and Capital Resources”
below).
Commercial paper (57.0) The decrease was primarily due to repayment using
proceeds from issuance of senior unsecured
debentures in the second quarter of 2016, offset
primarily by funds used for general corporate
purposes (see “Liquidity and Capital Resources”
below).
Accounts payable and accrued
liabilities 17.4 The increase was primarily due to higher electricity
costs payable to the IESO.
Deferred revenue 18.6 The increase was primarily due to capital
contributions received in 2016 and increased pole
and duct rentals.
Debentures 199.1 The increase was primarily due to issuance of the
$200.0 million senior unsecured debentures in the
second quarter of 2016 (see “Liquidity and Capital
Resources” below).
Retained earnings 30.9 The increase was due to net income after net
movements in regulatory balances and OCI ($75.5
million) offset by dividends paid ($ 44.6 million).

19
Condensed Interim Consolidated Balance Sheet Data As at June 30, 2016 compared to December 31, 2015
(in millions of Canadian dollars)
Balance Sheet Account Increase
(Decrease)
Explanation of Significant Change $
Regulatory Balances
Regulatory debit balances 1 (18.9) See table of net movements in regulatory balances,
net of tax under “Results of Operations” above.
Regulatory credit balances 1 (20.7) See table of net movements in regulatory balances,
net of tax under “Results of Operations” above.
1 The total of changes in the regulatory debit and credit balances reflects net movements in regulatory balances, net of tax (see “Results of
Operations” above).
Liquidity and Capital Resources
The Corporation's current assets and current liabilities amounted to $584.8 million and $824.6 million, respectively,
as at June 30, 2016, resulting in a working capital deficit of $239.8 million. The deficit is attributable to the
Corporation’s preference for utilizing its Commercial Paper Program and Working Capital Facility (both defined
below) before issuing additional debentures to fulfill the Corporation’s ongoing liquidity requirements, including
funding of significant capital spending in the current year. The Corporation seeks to maintain an optimal mix of short-
term and long-term debt in order to lower overall financing costs and to enhance borrowing flexibility.
The Corporation’s primary sources of liquidity and capital resources are cash provided by operating activities,
issuances of commercial paper, amounts available to be drawn against its credit facilities, and borrowings from debt
capital markets. The Corporation’s liquidity and capital resource requirements are mainly for capital expenditures to
maintain and improve the electricity distribution system of LDC, to purchase power, and to meet financing obligations.
Condensed Interim Consolidated Statements of Cash Flow Data
(in millions of Canadian dollars)
Three months
ended June 30
Six months
ended June 30
2016
$
2015
$
2016
$
2015
$
Cash and cash equivalents (working capital facility),
beginning of period
(12.7) 6.6 (14.2) (6.1)
Net cash provided by operating activities 145.9 29.7 236.6 163.8
Net cash used in investing activities (132.7) (142.8) (282.5) (275.0)
Net cash provided by (used in) financing activities (7.2) 92.3 53.4 103.1
Working capital facility, end of period (6.7) (14.2) (6.7) (14.2)
The Corporation is a party to a $20.0 million demand facility with a Canadian chartered bank for the purpose of
working capital management (“Working Capital Facility”). As at June 30, 2016, $6.7 million had been drawn under
the Working Capital Facility compared to $14.2 million as at December 31, 2015.

20
Operating Activities
Net cash provided by operating activities for the three months and six months ended June 30, 2016 was $145.9 million
and $236.6 million compared to $29.7 million and $163.8 million for the comparable periods in 2015.
The increase in net cash provided by operating activities for the three months ended June 30, 2016 was primarily due
to movements in both non-cash working capital balances (see note 15 to the Interim Financial Statements) and
regulatory balances (see “Net Movements in Regulatory Balances, Net of Tax” above), adjustments for non-cash
items, and higher net income after net movements in regulatory balances and OCI.
The increase in net cash provided by operating activities for the six months ended June 30, 2016 was primarily due to
higher net income after net movements in regulatory balances and OCI, and adjustments for non-cash items. These
variances were partially offset by movements in non-cash working capital balances (see note 15 to the Interim
Financial Statements).
Investing Activities
Net cash used in investing activities for the three months and six months ended June 30, 2016 was $132.7 million and
$282.5 million compared to $142.8 million and $275.0 million for the comparable periods in 2015.
The decrease in net cash used in investing activities for the three months ended June 30, 2016 was due to lower cash
spending on capital projects.
The increase in net cash used in investing activities for the six months ended June 30, 2016 was due to proceeds on
disposal of surplus properties in 2015 offset by lower cash spending on capital projects.
Electricity distribution is a capital-intensive business. As the largest municipal electricity distribution company in
Canada, LDC continues to invest in the renewal of existing aging infrastructure to address safety, reliability and
customer service requirements.
The following table summarizes the Corporation’s capital expenditures for the periods indicated.
Capital Expenditures
(in millions of Canadian dollars)
Three months
ended June 30
Six months
ended June 30
2016
$
2015
$
2016
$
2015
$
Regulated LDC
Distribution system
Planned 1 93.3 114.6 189.9 196.4
Reactive 13.6 8.2 18.1 14.8
Copeland Station 5.2 6.5 10.5 13.1
Facilities consolidation 11.0 8.7 18.9 16.3
Technology assets 7.4 6.3 24.1 10.1
Other 2 1.3 7.3 4.0 8.0
Regulated capital expenditures 131.8 151.6 265.5 258.7
Unregulated capital expenditures 3 1.2 0.1 1.4 2.0
Total capital expenditures 133.0 151.7 266.9 260.7
1 Includes, among other initiatives, the replacement of underground and overhead infrastructures, and the delivery of customer connections.
2 Includes fleet capital and buildings.
3 Primarily relates to equipment in TH Energy.
The total regulated capital expenditures for the three months and six months ended June 30, 2016 were $131.8 million
and $265.5 million compared to $151.6 million and $258.7 million for the comparable periods in 2015.

21
For the three month ended June 30, 2016, the decrease in regulated capital expenditures was primarily related to lower
spending on underground infrastructure ($18.1 million) and Copeland Station ($1.3 million).
For the six months ended June 30, 2016, the increase in regulated capital expenditures was primarily related to higher
spending on technology assets ($14.0 million) mainly for the radio project, network infrastructure ($4.6 million), and
equipment to meet increased load demand ($4.3 million). These variances were partially offset by lower spending on
underground infrastructure ($16.3 million).
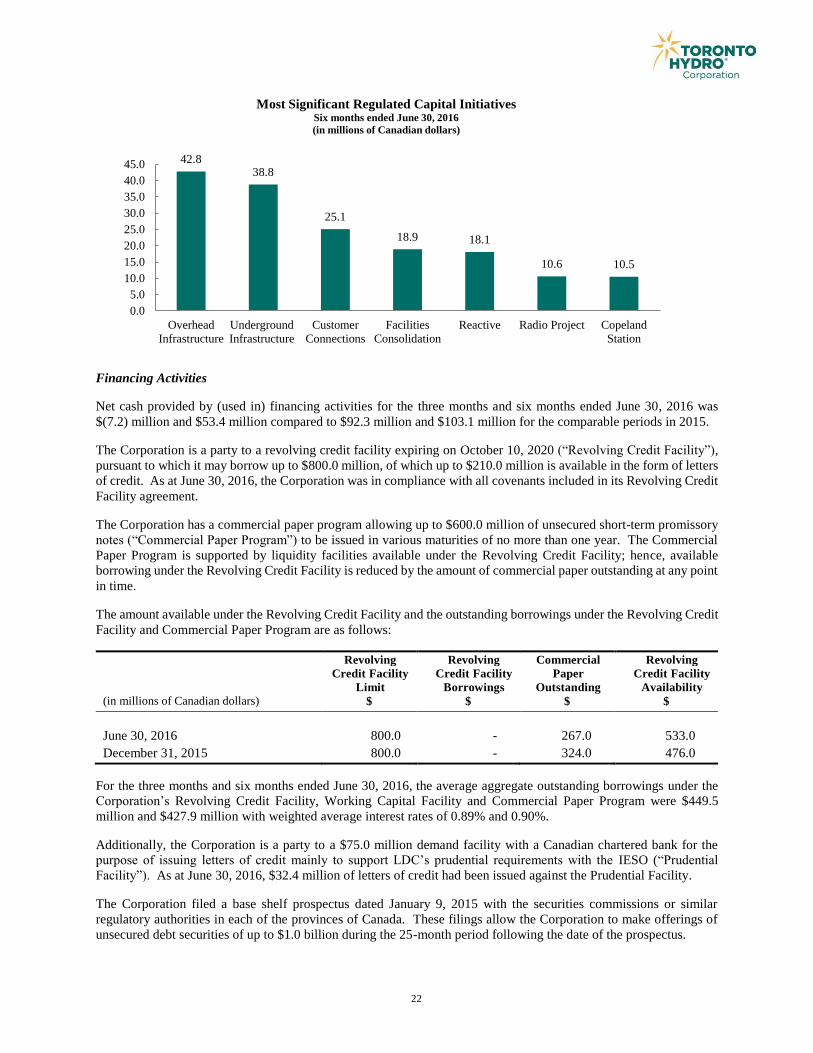
The largest capital initiatives in 2016 include the replacement of overhead and underground infrastructures, the
delivery of customer connections, the facilities consolidation program, the radio project, and the construction of
Copeland Station in response to the growing need for distribution options in the downtown core of the City.
The replacement of overhead infrastructure includes replacing poles, overhead transformers, conductors, overhead
switches and other aging overhead infrastructure and equipment. The replacement of underground infrastructure
includes replacing direct buried cables, transformer switches, handwells and other aging underground infrastructure.
Both initiatives will allow LDC to continue to provide ongoing safe and reliable service to its customers. For the six
months ended June 30, 2016, capital expenditures for the overhead and underground infrastructures were $42.8 million
and $38.8 million, respectively.
The delivery of customer connections includes spending related to new services and upgrades to existing services for
specific commercial customers. For the six months ended June 30, 2016, capital expenditures for the delivery of
customer connections were $25.1 million.
The facilities consolidation program relates to the consolidation of operating centres to lower operating centre costs
and simplify long-term planning. In 2016, the Corporation continued relocating staff, equipment and operations as
well as performing the required capital investment on specific properties and incurred costs of $18.9 million for the
six months ended June 30, 2016.
The radio project relates to the implementation of a new digital voice radio system. The Corporation provides radio
communication services to its own internal subscribers and contractors. The current analog radio technology has
reached the end of its lifecycle and manufacturer’s support. The new radio infrastructure will allow for expanded
radio coverage and enhanced dispatching capabilities. For the six months ended June 30, 2016, capital expenditures
for the radio project were $10.6 million.
Copeland Station will be the first transformer station built in downtown Toronto since the 1960’s and will be the
second underground transformer station in Canada. When in service, it will provide electricity to buildings and
neighbourhoods in the central-southwest area of Toronto. During the second quarter of 2016, the installation of major
electrical equipment was commenced and the machine shop structure work is underway. As at June 30, 2016, the
cumulative capital expenditures on the Copeland Station project amounted to $165.4 million, plus capitalized
borrowing costs. All capital expenditures related to Copeland Station are recorded to PP&E. Copeland Station is one
of the most complex projects ever undertaken by the Corporation and unforeseen delays have extended the expected
completion date from 2017 to 2018. The delays are attributable to a variety of factors, including the effect of inclement
weather, challenging site conditions and contractor performance. Despite the delays, the total capital expenditures
required to complete the project are expected to remain at approximately $195.0 million, plus capitalized borrowing
costs.
22
Financing Activities
Net cash provided by (used in) financing activities for the three months and six months ended June 30, 2016 was
$(7.2) million and $53.4 million compared to $92.3 million and $103.1 million for the comparable periods in 2015.
The Corporation is a party to a revolving credit facility expiring on October 10, 2020 (“Revolving Credit Facility”),
pursuant to which it may borrow up to $800.0 million, of which up to $210.0 million is available in the form of letters
of credit. As at June 30, 2016, the Corporation was in compliance with all covenants included in its Revolving Credit
Facility agreement.
The Corporation has a commercial paper program allowing up to $600.0 million of unsecured short-term promissory
notes (“Commercial Paper Program”) to be issued in various maturities of no more than one year. The Commercial
Paper Program is supported by liquidity facilities available under the Revolving Credit Facility; hence, available
borrowing under the Revolving Credit Facility is reduced by the amount of commercial paper outstanding at any point
in time.
The amount available under the Revolving Credit Facility and the outstanding borrowings under the Revolving Credit
Facility and Commercial Paper Program are as follows:
Revolving
Credit Facility
Limit
Revolving
Credit Facility
Borrowings
Commercial
Paper
Outstanding
Revolving
Credit Facility
Availability
(in millions of Canadian dollars) $ $ $ $
June 30, 2016 800.0 - 267.0 533.0
December 31, 2015 800.0 - 324.0 476.0
For the three months and six months ended June 30, 2016, the average aggregate outstanding borrowings under the
Corporation’s Revolving Credit Facility, Working Capital Facility and Commercial Paper Program were $449.5
million and $427.9 million with weighted average interest rates of 0.89% and 0.90%.
Additionally, the Corporation is a party to a $75.0 million demand facility with a Canadian chartered bank for the
purpose of issuing letters of credit mainly to support LDC’s prudential requirements with the IESO (“Prudential
Facility”). As at June 30, 2016, $32.4 million of letters of credit had been issued against the Prudential Facility.
The Corporation filed a base shelf prospectus dated January 9, 2015 with the securities commissions or similar
regulatory authorities in each of the provinces of Canada. These filings allow the Corporation to make offerings of
unsecured debt securities of up to $1.0 billion during the 25-month period following the date of the prospectus.
42.838.8
25.1
18.9 18.1
10.6 10.5
0.0
5.0
10.0
15.0
20.0
25.0
30.0
35.0
40.0
45.0
Overhead
Infrastructure
Underground
Infrastructure
Customer
Connections
Facilities
Consolidation
Reactive Radio Project Copeland
Station
Most Significant Regulated Capital InitiativesSix months ended June 30, 2016
(in millions of Canadian dollars)

23
On June 14, 2016, the Corporation issued $200.0 million of 2.52% senior unsecured debentures at a price of $999.84
per $1,000 principal amount due August 25, 2026 (“Series 12”). The Series 12 debentures bear interest payable semi-
annually in arrears and contain covenants which, subject to certain exceptions, restrict the ability of the Corporation
and LDC to create security interests, incur additional indebtedness or dispose of all or substantially all of their assets.
The Corporation may redeem all or part of the Series 12 debentures prior to maturity at a price equal to the greater of
the Canada Yield Price (determined in accordance with the terms of the debentures) and par, plus accrued and unpaid
interest to the date fixed for redemption. Net proceeds from the debentures were used to repay certain existing
indebtedness of the Corporation and for general corporate purposes. Debt issuance costs of $1.3 million relating to
the Series 12 debentures were recorded against the carrying amount of the debentures in the second quarter of 2016
and are amortized to finance costs using the effective interest method.
As at June 30, 2016, the Corporation had long-term debentures outstanding in the principal amount of $2.1 billion.
These debentures will mature between 2017 and 2063. The Corporation may issue up to $555.0 million of additional
debentures under its existing base shelf prospectus. As at June 30, 2016, the Corporation was in compliance with all
covenants included in its trust indenture and supplemental trust indentures.
The following table sets out the current credit ratings of the Corporation:
Credit Ratings
As at June 30, 2016
DBRS Standard & Poor’s
Credit Rating Trend Credit Rating Outlook
Issuer rating A Stable A Negative
Senior unsecured debentures A Stable A -
Commercial paper R-1 (low) Stable - -
On April 25, 2016, Standard & Poor’s announced its decision to maintain the credit rating on the Corporation as “A”
and revised their outlook from stable to negative.
On April 27, 2016, DBRS announced its decision to maintain the credit rating on the Corporation as “A” with a stable
trend.
The Corporation believes that it has sufficient available sources of liquidity and capital to satisfy working capital
requirements for the next twelve months.
On March 2, 2016, the Corporation’s Board of Directors declared dividends in the amount of $44.6 million. The
dividends consisted of $38.35 million with respect to net income after net movements in regulatory balances for the
year ended December 31, 2015, paid to the City on March 11, 2016, and $6.25 million with respect to the first quarter
of 2016, paid to the City on March 31, 2016.
On July 5, 2016, the Corporation’s Board of Directors declared a dividend in the amount of $6.25 million with respect
to the second quarter of 2016, paid to the City on July 8, 2016.
On August 18, 2016, the Corporation’s Board of Directors declared a dividend in the amount of $6.25 million with
respect to the third quarter of 2016. The dividend is payable on September 30, 2016.

24
Summary of Contractual Obligations and Other Commitments
The following table presents a summary of the Corporation’s debentures, major contractual obligations and other
commitments.
Summary of Contractual Obligations and Other Commitments As at June 30, 2016
(in millions of Canadian dollars)
Total
$
2016 1
$
2017/2018
$
2019/2020
$
After 2020
$
Working Capital Facility 6.7 6.7 - - -
Commercial paper 2 267.0 267.0 - - -
Debentures – principal repayment 2,095.0 - 250.0 250.0 1,595.0
Debentures – interest payments 1,383.3 40.0 153.3 129.2 1,060.8
Operating leases 8.5 2.9 3.2 1.3 1.1
Capital projects 3 and other 44.6 20.7 23.9 - -
Capital leases 6.2 1.6 4.6 - -
Total contractual obligations and other
commitments 3,811.3 338.9 435.0 380.5 2,656.9
1 Due over the period from July 1, 2016 to December 31, 2016.
2 The notes under the Commercial Paper Program were issued at a discount and are repaid at their principal amount.
3 Commitments for construction services and estimated capital contributions.
Subsequent to June 30, 2016, the Corporation entered into a capital commitment of approximately $9.0 million, which
is expected to be settled within 2016.
Corporate Developments
Changes to the Corporation’s Board of Directors and Audit Committee
Effective May 4, 2016, the City, as the sole shareholder of the Corporation, appointed Michael Nobrega to the Board
of Directors. The appointment is effective for a term ending on December 10, 2017, or until a successor is appointed.
Effective May 11, 2016, Michael Nobrega was appointed as Chair of the Audit Committee, replacing Heather Zordel
who will remain as an Audit Committee member. On May 11, 2016, Brian Chu resigned from the Audit Committee
but will remain as Chair of the Human Resources Committee of the Board of Directors.
Electricity Distribution Rates
On December 29, 2015, the OEB issued its CIR decision and on March 1, 2016, the OEB issued its CIR rate order,
both in relation to the 2015-2019 rate application filed on July 31, 2014. The CIR decision and rate order approved a
rate base of $3,232.0 million and revenue requirement of $633.1 million for 2015, and rates calculated on that basis.
The CIR decision and rate order also approved subsequent annual rate adjustments based on a custom index for the
period commencing on January 1, 2016 and ending on December 31, 2019. The rates for 2015 and 2016 were
implemented on March 1, 2016, with effective dates of May 1, 2015 and January 1, 2016, respectively.
The OEB’s decision and rate order on LDC’s 2012-2014 rate application directed that a reconciliation process take
place at the end of the 2012-2014 ICM period to reflect the difference between the revenue collected pursuant to the
approved ICM rate rider and the actual revenue requirement associated with actual in-service assets eligible for ICM
funding. On March 8, 2016, LDC filed a rate application to reconcile those amounts in accordance with the OEB’s
directive.
On July 28, 2016, the OEB approved a settlement proposal submitted by LDC and intervenors to the ICM rate
application, which provided that there would be no change to the 2015–2019 rate base previously approved in the CIR
decision and the 2012-2014 ICM process would be closed with no future disposition to or from ratepayers. Further
to this approval, the $9.8 million currently recorded as an ICM regulatory credit balance will be recorded as an increase
in equity through net movements in regulatory balances, net of tax in the third quarter of 2016.

25
CDM Activities
Under the energy conservation agreement with the IESO, LDC has a joint CDM plan with Oakville Hydro Electricity
Distribution Inc. for the delivery of CDM programs over the 2015-2020 period. The joint CDM plan provides
combined funding of approximately $425.0 million, including participant incentives and program administration costs,
with an energy savings target of approximately 1,668 GWh. The programs for Oakville Hydro Electricity Distribution
Inc. under the joint CDM plan started on January 1, 2016. LDC received $17.2 million as at December 31, 2015 and
$8.0 million in the six months ended June 30, 2016 from the IESO for the delivery of CDM programs. Amounts
received but not yet spent are presented on the Consolidated Balance Sheets under current liabilities as deferred
conservation credit.
Legal Proceedings
In the ordinary course of business, the Corporation is subject to various legal actions and claims from customers,
suppliers, former employees and other parties. On an ongoing basis, the Corporation assesses the likelihood of any
adverse judgments or outcomes as well as potential ranges of probable costs and losses. A determination of the
provision required, if any, for these contingencies is made after an analysis of each individual issue. The provision
may change in the future due to new developments in each matter or changes in approach, such as a change in
settlement strategy. If damages were awarded under these actions, the Corporation and its subsidiaries would make a
claim under any applicable liability insurance policies which the Corporation believes would cover any damages which
may become payable by the Corporation and its subsidiaries in connection with these actions, subject to such claim
not being disputed by the insurer. There have been no material changes in legal proceedings as disclosed in note 17
to the Interim Financial Statements.
Controls and Procedures
For purposes of certain Canadian securities regulations, the Corporation is a “Venture Issuer”. As such, it is exempt
from certain requirements of National Instrument 52-109 Certification of Disclosure in Issuers’ Annual and Interim
Filings. Accordingly, the Chief Executive Officer and Chief Financial Officer have reviewed the Interim Financial
Statements and the MD&A for the interim periods ended June 30, 2016 and 2015. Based on their knowledge and
exercise of reasonable diligence, they have concluded that these documents fairly present in all material respects the
financial condition, financial performance and cash flows of the Corporation as at the date of and for the period
presented.
Critical Accounting Estimates
The preparation of the Corporation’s Interim Financial Statements requires management to make estimates and
assumptions which affect the application of accounting policies, reported amounts of assets, liabilities and regulatory
balances, and the disclosure of contingent assets and liabilities at the date of the Interim Financial Statements, and the
reported amounts of revenues and expenses for the period. The estimates are based on historical experience, current
conditions and various other assumptions that are believed to be reasonable under the circumstances, the results of
which form the basis for making judgments about the carrying values of assets and liabilities as well as for identifying
and assessing the accounting treatment with respect to commitments and contingencies. Actual results could differ
from those estimates, including changes as a result of future decisions made by the OEB, the IESO, the Ontario
Ministry of Energy or the Ontario Ministry of Finance.
Changes in Accounting Policies
In December 2014, the IASB issued Disclosure Initiative (Amendments to IAS 1 Presentation of Financial
Statements). These amendments improve the existing presentation and disclosure requirements and encourage entities
to apply professional judgment regarding disclosure and presentation in their financial statements. These amendments
were adopted effective January 1, 2016. The adoption of these amendments has no material impact on the
Corporation’s consolidated financial statements.
Future Accounting Pronouncements
A number of new standards, amendments and interpretations are effective for annual periods beginning after
December 31, 2016, and as such, have not yet been applied in preparing the Interim Financial Statements. In addition
26
to the changes described in note 4 to the annual Consolidated Financial Statements, the Corporation has determined
that the following could have an impact on its consolidated financial statements:
In January 2016, the IASB issued IFRS 16 Leases (“IFRS 16”), which replaces IAS 17 Leases (“IAS 17”). IFRS 16
provides a single lessee accounting model, requiring the recognition of assets and liabilities for all leases, unless the
lease term is twelve months or less or the underlying asset has a low value. Lessor accounting remains largely
unchanged from IAS 17 and the distinction between operating and finance leases is retained. In addition, lessees will
recognize a front-loaded pattern of expense for most leases, even when they pay constant annual rentals. The standard
is effective for annual periods beginning on or after January 1, 2019, and will be applied retrospectively with some
exceptions. Early adoption is permitted if IFRS 15 Revenue from Contracts with Customers (“IFRS 15”) has been
adopted.
In January 2016, the IASB issued amendments to IAS 7 Statement of Cash Flows as part of the IASB’s Disclosure
Initiative. These amendments require entities to provide disclosures that enable users of financial statements to
evaluate changes in liabilities arising from financing activities, including changes from cash flows and non-cash
changes. These amendments are effective for annual periods beginning on or after January 1, 2017.
In April 2016, the IASB issued amendments to IFRS 15, which was originally issued in May 2014. These amendments
do not change the underlying principles of the standard but clarify how those principles should be applied. The
amendments clarify how to identify a performance obligation in a contract, determine whether a company is a principal
or an agent, and determine whether the revenue from granting a licence should be recognized at a point in time or over
time. The amendments also include two additional transitional reliefs. The amendments are effective for annual
periods beginning on or after January 1, 2018, consistent with the effective date of the standard.
The Corporation is currently evaluating the impact of these standards.
Forward-Looking Information
The Corporation includes forward-looking information in its MD&A within the meaning of applicable securities laws
in Canada. The purpose of the forward-looking information is to provide management’s expectations regarding the
Corporation’s future results of operations, performance, business prospects and opportunities and may not be
appropriate for other purposes. All forward-looking information is given pursuant to the “safe harbour” provisions of
applicable Canadian securities legislation. The words “anticipated”, “believes”, “can”, “could”, “estimates”,
“expected”, “focus”, “future”, “may”, “outlook”, “plan”, “seek”, “should”, “strives”, “trend”, “will”, “would” and
similar expressions are often intended to identify forward-looking information, although not all forward-looking
information contains these identifying words. The forward-looking information reflects management’s current beliefs
and is based on information currently available to the Corporation’s management.
The forward-looking information in the MD&A includes, but is not limited to, the statements regarding the settlement
variance as described in the section entitled “Results of Operations”, the effect of changes in energy consumption on
future revenue as described in the section entitled “Quarterly Results of Operations”, the Corporation’s plans to finance
the investment in LDC’s infrastructure and the Corporation’s available sources of liquidity and capital resources and
the sufficiency thereof to satisfy working capital requirements for the next twelve months as described in the section
entitled “Liquidity and Capital Resources”, the planned and proposed capital initiatives and the expected results of
such initiatives as described in the section entitled “Liquidity and Capital Resources”, the anticipated capacity to be
provided by Copeland Station, the expected capital expenditures required to complete Copeland Station, and the
anticipated completion date for Copeland Station as described in the section entitled “Liquidity and Capital
Resources”, the anticipated contractual obligations and other commitments of the Corporation over the next five years
as set out in the section entitled “Liquidity and Capital Resources”, the trend and outlook published by the credit rating
agencies as described in the section entitled “Liquidity and Capital Resources”, statements regarding the accounting
for the ICM regulatory credit balance in the third quarter of 2016 as set out in the section entitled “Corporate
Developments”, the ability to pay any damages in connection with legal actions and claims as described in the section
entitled “Legal Proceedings”, and the impact on the Corporation’s consolidated financial statements in the section
entitled “Future Accounting Pronouncements”. The statements that make up the forward-looking information are
based on assumptions that include, but are not limited to, the future course of the economy and financial markets, the
receipt of applicable regulatory approvals and requested rate orders, the receipt of favourable judgments, and the level
of interest rates and the Corporation’s ability to borrow.

27
The forward-looking information is subject to risks, uncertainties and other factors that could cause actual results to
differ materially from historical results or results anticipated by the forward-looking information. The factors which
could cause results or events to differ from current expectations include, but are not limited to, market liquidity and
the quality of the underlying assets and financial instruments, the timing and extent of changes in prevailing interest
rates, inflation levels, and legislative, judicial and regulatory developments that could affect revenues and the results
of borrowing efforts.
All forward-looking information in the MD&A is qualified in its entirety by the above cautionary statements and,
except as required by law, the Corporation undertakes no obligation to revise or update any forward-looking
information as a result of new information, future events or otherwise after the date hereof.
Additional Information
Additional information with respect to the Corporation (including its annual information form) is available on the
System for Electronic Document Analysis and Retrieval website at www.sedar.com.
Toronto, Canada
August 18, 2016

See Second Quarter Financial Report for abbreviations and defined termsused in the unaudited condensed interim consolidated financial statements.
UNAUDITED CONDENSED INTERIM CONSOLIDATED FINANCIAL STATEMENTSFOR THE THREE AND SIX MONTHS ENDED JUNE 30, 2016 AND 2015
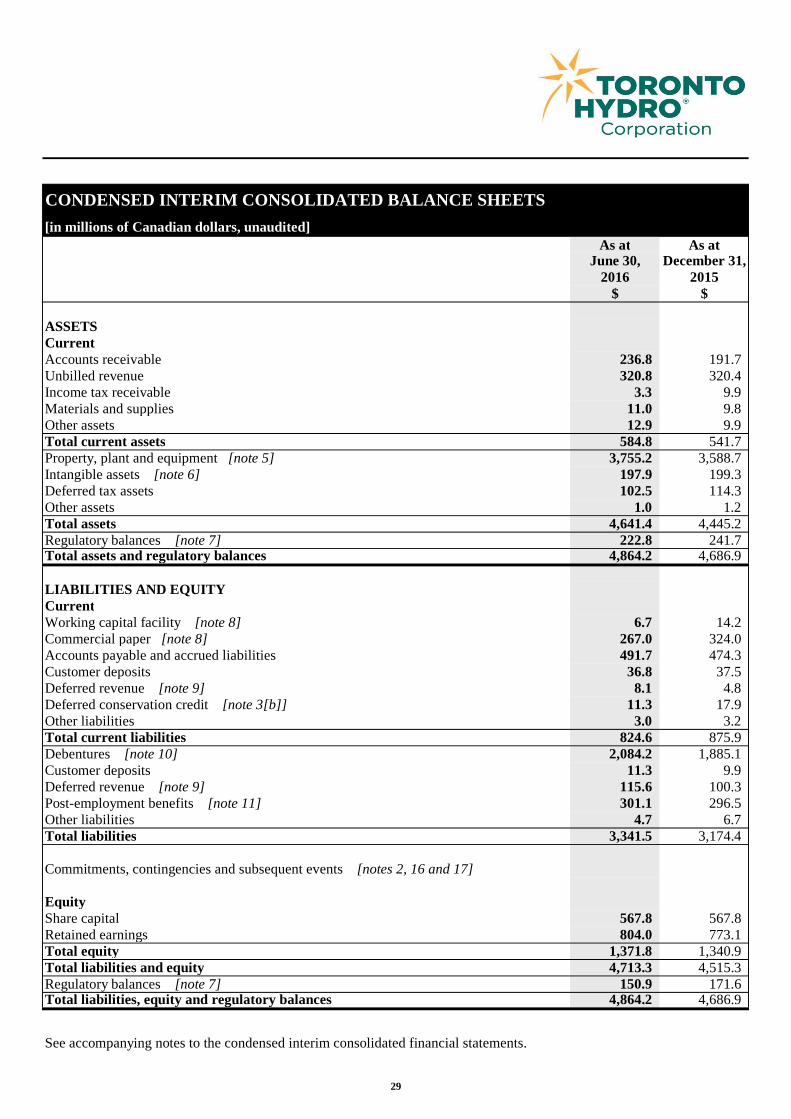
CONDENSED INTERIM CONSOLIDATED BALANCE SHEETS[in millions of Canadian dollars, unaudited]
As at As atJune 30, December 31,
2016 2015$ $
[note 26]ASSETSCurrentAccounts receivable [notes 5 and 16[b]] 236.8 191.7Unbilled revenue [note 16[b]] 320.8 320.4Income tax receivable 3.3 9.9Materials and supplies [note 5] 11.0 9.8Other assets [note 6] 12.9 9.9Total current assets 584.8 541.7Property, plant and equipment [note 5] 3,755.2 3,588.7Intangible assets [note 6] 197.9 199.3Deferred tax assets [note 21] 102.5 114.3Other assets [note 6] 1.0 1.2Total assets 4,641.4 4,445.2Regulatory balances [note 7] 222.8 241.7Total assets and regulatory balances 4,864.2 4,686.9
LIABILITIES AND EQUITYCurrentWorking capital facility [note 8] 6.7 14.2Commercial paper [note 8] 267.0 324.0Accounts payable and accrued liabilities [note 11] 491.7 474.3Customer deposits 36.8 37.5Deferred revenue [note 9] 8.1 4.8Deferred conservation credit [note 3[b]] 11.3 17.9Other liabilities [note 24] 3.0 3.2Total current liabilities 824.6 875.9Debentures [note 10] 2,084.2 1,885.1Customer deposits 11.3 9.9Deferred revenue [note 9] 115.6 100.3Post-employment benefits [note 11] 301.1 296.5Other liabilities [note 24] 4.7 6.7Total liabilities 3,341.5 3,174.4
Commitments, contingencies and subsequent events [notes 2, 16 and 17]
EquityShare capital [note 17] 567.8 567.8Retained earnings 804.0 773.1Total equity 1,371.8 1,340.9Total liabilities and equity 4,713.3 4,515.3Regulatory balances [note 7] 150.9 171.6Total liabilities, equity and regulatory balances 4,864.2 4,686.9
See accompanying notes to the condensed interim consolidated financial statements.
29
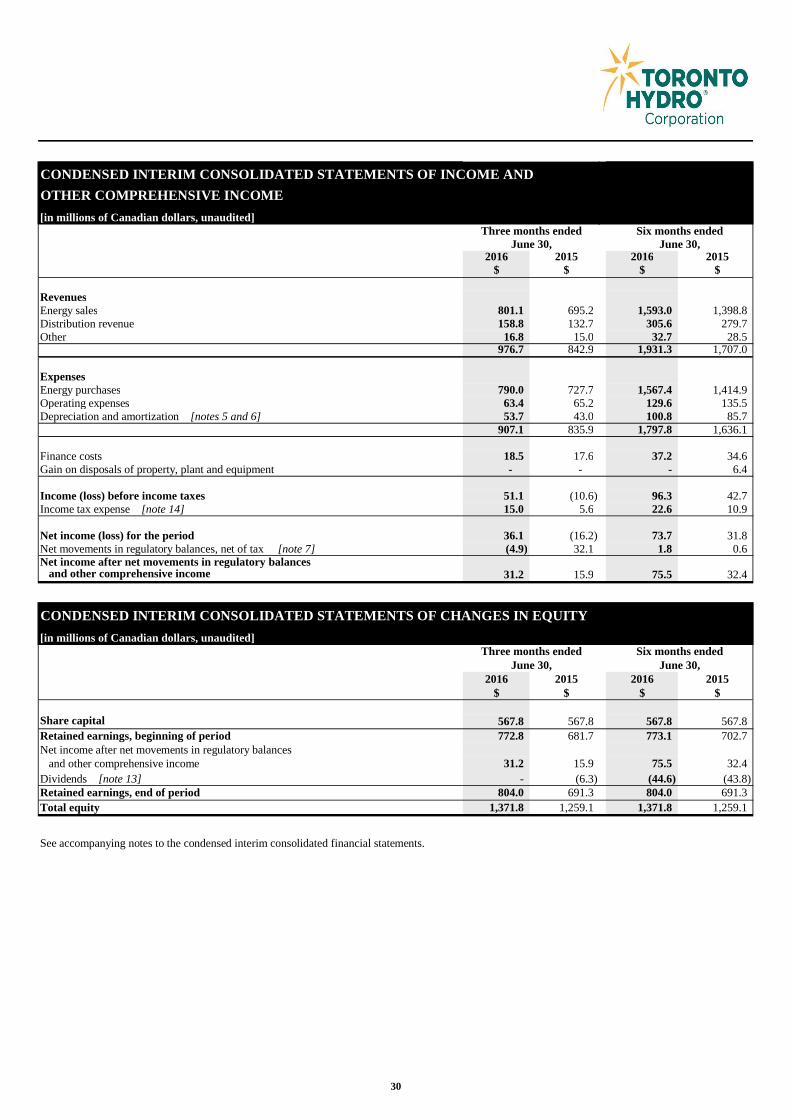
CONDENSED INTERIM CONSOLIDATED STATEMENTS OF INCOME ANDOTHER COMPREHENSIVE INCOME[in millions of Canadian dollars, unaudited]
Three months ended Six months endedJune 30, June 30,
2016 2015 2016 2015$ $ $ $
[note 23] [note 26]RevenuesEnergy sales 801.1 695.2 1,593.0 1,398.8Distribution revenue 158.8 132.7 305.6 279.7Other [note 18] 16.8 15.0 32.7 28.5
976.7 842.9 1,931.3 1,707.0
ExpensesEnergy purchases 790.0 727.7 1,567.4 1,414.9Operating expenses [note 19] 63.4 65.2 129.6 135.5Depreciation and amortization [notes 5 and 6] 53.7 43.0 100.8 85.7
907.1 835.9 1,797.8 1,636.1
Finance costs [note 20] 18.5 17.6 37.2 34.6Gain on disposals of property, plant and equipment [note 5] - - - 6.4
Income (loss) before income taxes 51.1 (10.6) 96.3 42.7Income tax expense [note 14] 15.0 5.6 22.6 10.9
Net income (loss) for the period 36.1 (16.2) 73.7 31.8Net movements in regulatory balances, net of tax [note 7] (4.9) 32.1 1.8 0.6Net income after net movements in regulatory balances and other comprehensive income 31.2 15.9 75.5 32.4
CONDENSED INTERIM CONSOLIDATED STATEMENTS OF CHANGES IN EQUITY[in millions of Canadian dollars, unaudited]
Three months ended Six months endedJune 30, June 30,
2016 2015 2016 2015$ $ $ $
[note 23] [note 26]Share capital [note 17] 567.8 567.8 567.8 567.8Retained earnings, beginning of period 772.8 681.7 773.1 702.7Net income after net movements in regulatory balances and other comprehensive income 31.2 15.9 75.5 32.4Dividends [note 13] - (6.3) (44.6) (43.8)Retained earnings, end of period 804.0 691.3 804.0 691.3Total equity 1,371.8 1,259.1 1,371.8 1,259.1
See accompanying notes to the condensed interim consolidated financial statements.
30
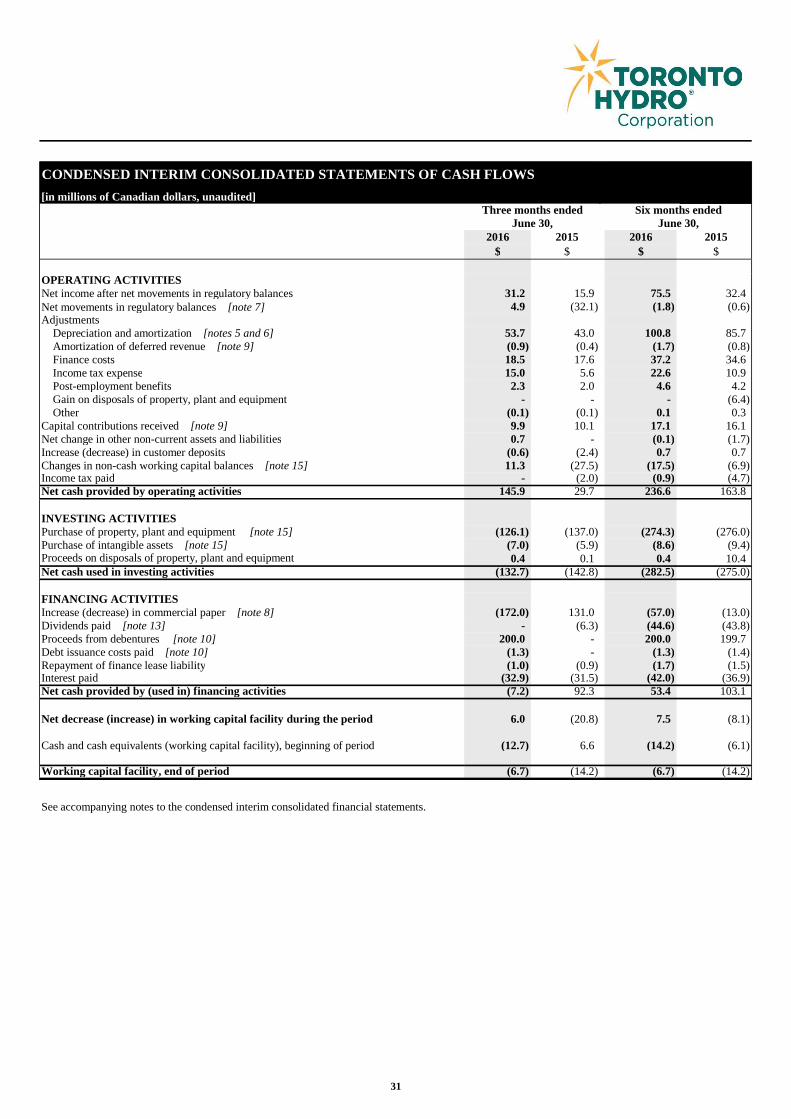
CONDENSED INTERIM CONSOLIDATED STATEMENTS OF CASH FLOWS
Three months ended Six months endedJune 30, June 30,
2016 2015 2016 2015$ $ $ $
[note 23] [note 26]OPERATING ACTIVITIESNet income after net movements in regulatory balances 31.2 15.9 75.5 32.4Net movements in regulatory balances [note 7] 4.9 (32.1) (1.8) (0.6)Adjustments Depreciation and amortization [notes 5 and 6] 53.7 43.0 100.8 85.7 Amortization of deferred revenue [note 9] (0.9) (0.4) (1.7) (0.8) Finance costs 18.5 17.6 37.2 34.6 Income tax expense 15.0 5.6 22.6 10.9 Post-employment benefits 2.3 2.0 4.6 4.2 Gain on disposals of property, plant and equipment - - - (6.4) Other (0.1) (0.1) 0.1 0.3Capital contributions received [note 9] 9.9 10.1 17.1 16.1Net change in other non-current assets and liabilities 0.7 - (0.1) (1.7)Increase (decrease) in customer deposits (0.6) (2.4) 0.7 0.7Changes in non-cash working capital balances [note 15] 11.3 (27.5) (17.5) (6.9)Income tax paid - (2.0) (0.9) (4.7)Net cash provided by operating activities 145.9 29.7 236.6 163.8
INVESTING ACTIVITIESPurchase of property, plant and equipment [note 15] (126.1) (137.0) (274.3) (276.0)Purchase of intangible assets [note 15] (7.0) (5.9) (8.6) (9.4)Proceeds on disposals of property, plant and equipment [note 5] 0.4 0.1 0.4 10.4Net cash used in investing activities (132.7) (142.8) (282.5) (275.0)
FINANCING ACTIVITIESIncrease (decrease) in commercial paper [note 8] (172.0) 131.0 (57.0) (13.0)Dividends paid [note 13] - (6.3) (44.6) (43.8)Proceeds from debentures [note 10] 200.0 - 200.0 199.7Debt issuance costs paid [note 10] (1.3) - (1.3) (1.4)Repayment of finance lease liability (1.0) (0.9) (1.7) (1.5)Interest paid (32.9) (31.5) (42.0) (36.9)Net cash provided by (used in) financing activities (7.2) 92.3 53.4 103.1
Net decrease (increase) in working capital facility during the period 6.0 (20.8) 7.5 (8.1)
Cash and cash equivalents (working capital facility), beginning of period (12.7) 6.6 (14.2) (6.1)
Working capital facility, end of period (6.7) (14.2) (6.7) (14.2)
See accompanying notes to the condensed interim consolidated financial statements.
[in millions of Canadian dollars, unaudited]
31
NOTES TO THE CONDENSED INTERIM CONSOLIDATED FINANCIAL STATEMENTSFor the three and six months ended June 30, 2016 and 2015[Unaudited; all tabular amounts in millions of Canadian dollars]
32
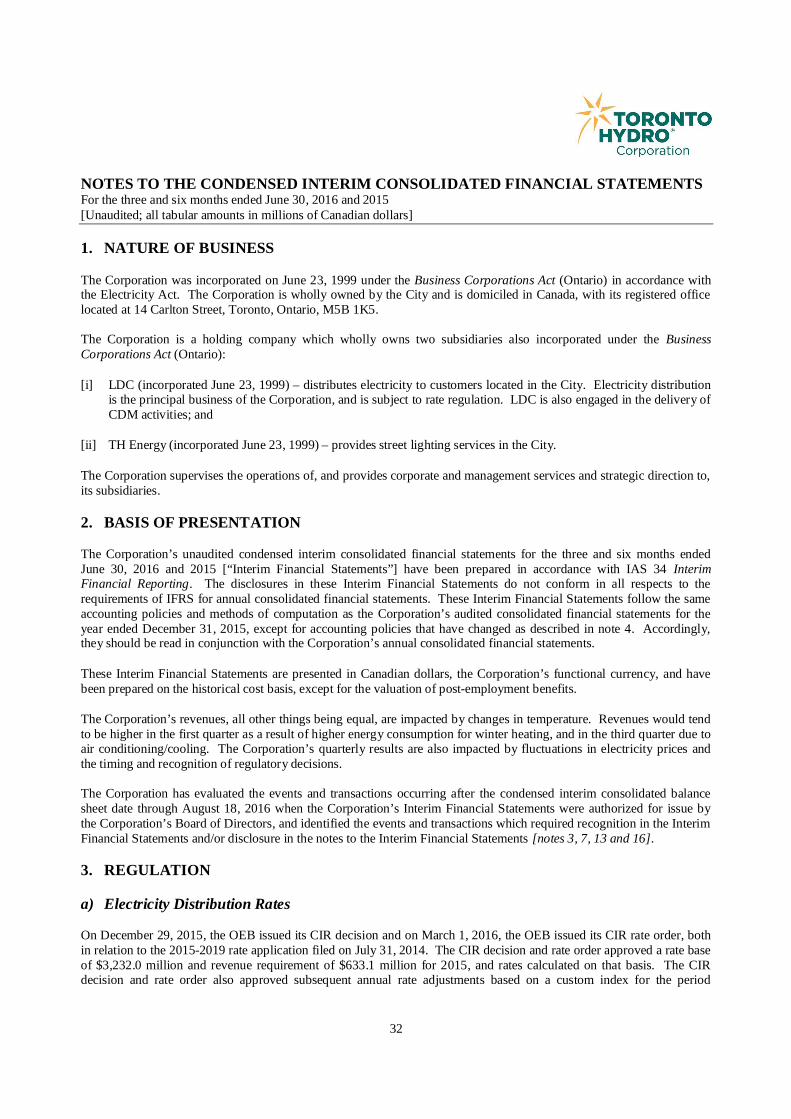
1. NATURE OF BUSINESS
The Corporation was incorporated on June 23, 1999 under the Business Corporations Act (Ontario) in accordance withthe Electricity Act. The Corporation is wholly owned by the City and is domiciled in Canada, with its registered officelocated at 14 Carlton Street, Toronto, Ontario, M5B 1K5.
The Corporation is a holding company which wholly owns two subsidiaries also incorporated under the BusinessCorporations Act (Ontario):
[i] LDC (incorporated June 23, 1999) – distributes electricity to customers located in the City. Electricity distributionis the principal business of the Corporation, and is subject to rate regulation. LDC is also engaged in the delivery ofCDM activities; and
[ii] TH Energy (incorporated June 23, 1999) – provides street lighting services in the City.
The Corporation supervises the operations of, and provides corporate and management services and strategic direction to,its subsidiaries.
2. BASIS OF PRESENTATION
The Corporation’s unaudited condensed interim consolidated financial statements for the three and six months endedJune 30, 2016 and 2015 [“Interim Financial Statements”] have been prepared in accordance with IAS 34 InterimFinancial Reporting. The disclosures in these Interim Financial Statements do not conform in all respects to therequirements of IFRS for annual consolidated financial statements. These Interim Financial Statements follow the sameaccounting policies and methods of computation as the Corporation’s audited consolidated financial statements for theyear ended December 31, 2015, except for accounting policies that have changed as described in note 4. Accordingly,they should be read in conjunction with the Corporation’s annual consolidated financial statements.
These Interim Financial Statements are presented in Canadian dollars, the Corporation’s functional currency, and havebeen prepared on the historical cost basis, except for the valuation of post-employment benefits.
The Corporation’s revenues, all other things being equal, are impacted by changes in temperature. Revenues would tendto be higher in the first quarter as a result of higher energy consumption for winter heating, and in the third quarter due toair conditioning/cooling. The Corporation’s quarterly results are also impacted by fluctuations in electricity prices andthe timing and recognition of regulatory decisions.
The Corporation has evaluated the events and transactions occurring after the condensed interim consolidated balancesheet date through August 18, 2016 when the Corporation’s Interim Financial Statements were authorized for issue bythe Corporation’s Board of Directors, and identified the events and transactions which required recognition in the InterimFinancial Statements and/or disclosure in the notes to the Interim Financial Statements [notes 3, 7, 13 and 16].
3. REGULATION
a) Electricity Distribution Rates
On December 29, 2015, the OEB issued its CIR decision and on March 1, 2016, the OEB issued its CIR rate order, bothin relation to the 2015-2019 rate application filed on July 31, 2014. The CIR decision and rate order approved a rate baseof $3,232.0 million and revenue requirement of $633.1 million for 2015, and rates calculated on that basis. The CIRdecision and rate order also approved subsequent annual rate adjustments based on a custom index for the period

NOTES TO THE CONDENSED INTERIM CONSOLIDATED FINANCIAL STATEMENTSFor the three and six months ended June 30, 2016 and 2015[Unaudited; all tabular amounts in millions of Canadian dollars]
33
commencing on January 1, 2016 and ending on December 31, 2019. The rates for 2015 and 2016 were implemented onMarch 1, 2016, with effective dates of May 1, 2015 and January 1, 2016, respectively [note 7[a]].
The OEB’s decision and rate order on LDC’s 2012-2014 rate application directed that a reconciliation process take placeat the end of the 2012-2014 ICM period to reflect the difference between the revenue collected pursuant to the approvedICM rate rider and the actual revenue requirement associated with actual in-service assets eligible for ICM funding. OnMarch 8, 2016, LDC filed a rate application to reconcile those amounts in accordance with the OEB’s directive.
On July 28, 2016, the OEB approved a settlement proposal submitted by LDC and intervenors to the ICM rateapplication, which provided that there would be no change to the 2015–2019 rate base previously approved in the CIRdecision and the 2012-2014 ICM process would be closed with no future disposition to or from ratepayers. Further tothis approval, the $9.8 million currently recorded as an ICM regulatory credit balance [note 7] will be recorded as anincrease in equity through net movements in regulatory balances, net of tax in the third quarter of 2016.
b) CDM Activities
Under the energy conservation agreement with the IESO, LDC has a joint CDM plan with Oakville Hydro ElectricityDistribution Inc. for the delivery of CDM programs over the 2015-2020 period. The joint CDM plan provides combinedfunding of approximately $425.0 million, including participant incentives and program administration costs, with anenergy savings target of approximately 1,668 GWh. The programs for Oakville Hydro Electricity Distribution Inc. underthe joint CDM plan started on January 1, 2016. LDC received $17.2 million as at December 31, 2015 and $8.0 million inthe six months ended June 30, 2016 from the IESO for the delivery of CDM programs. Amounts received but not yetspent are presented on the consolidated balance sheets under current liabilities as deferred conservation credit.
4. SUMMARY OF SIGNIFICANT ACCOUNTING POLICIES
a) Changes in accounting policies
In December 2014, the IASB issued Disclosure Initiative (Amendments to IAS 1 Presentation of Financial Statements).These amendments improve the existing presentation and disclosure requirements and encourage entities to applyprofessional judgment regarding disclosure and presentation in their financial statements. These amendments wereadopted effective January 1, 2016. The adoption of these amendments has no material impact on the Corporation’sconsolidated financial statements.
b) Use of estimates
The preparation of the Corporation’s Interim Financial Statements requires management to make estimates andassumptions which affect the application of accounting policies, reported amounts of assets, liabilities and regulatorybalances, and the disclosure of contingent assets and liabilities at the date of the Interim Financial Statements, and thereported amounts of revenues and expenses for the period. The estimates are based on historical experience, currentconditions and various other assumptions that are believed to be reasonable under the circumstances, the results of whichform the basis for making judgments about the carrying values of assets and liabilities as well as for identifying andassessing the accounting treatment with respect to commitments and contingencies. Actual results could differ fromthose estimates, including changes as a result of future decisions made by the OEB, the IESO, the Ontario Ministry ofEnergy or the Ontario Ministry of Finance. Estimates and underlying assumptions are reviewed on an ongoing basis.Revisions to estimates are recognized prospectively.

NOTES TO THE CONDENSED INTERIM CONSOLIDATED FINANCIAL STATEMENTSFor the three and six months ended June 30, 2016 and 2015[Unaudited; all tabular amounts in millions of Canadian dollars]
34
c) Future accounting pronouncements
A number of new standards, amendments and interpretations are effective for annual periods beginning after December31, 2016, and as such, have not yet been applied in preparing these Interim Financial Statements. In addition to thechanges described in note 4 to the Corporation’s audited consolidated financial statements for the year ended December31, 2015, the Corporation has determined that the following could have an impact on its consolidated financialstatements:
· In January 2016, the IASB issued IFRS 16 Leases [“IFRS 16”], which replaces IAS 17 Leases [“IAS 17”]. IFRS 16provides a single lessee accounting model, requiring the recognition of assets and liabilities for all leases, unless thelease term is twelve months or less or the underlying asset has a low value. Lessor accounting remains largelyunchanged from IAS 17 and the distinction between operating and finance leases is retained. In addition, lesseeswill recognize a front-loaded pattern of expense for most leases, even when they pay constant annual rentals. Thestandard is effective for annual periods beginning on or after January 1, 2019, and will be applied retrospectivelywith some exceptions. Early adoption is permitted if IFRS 15 Revenue from Contracts with Customers [“IFRS 15”]has been adopted.
· In January 2016, the IASB issued amendments to IAS 7 Statement of Cash Flows as part of the IASB’s DisclosureInitiative. These amendments require entities to provide disclosures that enable users of financial statements toevaluate changes in liabilities arising from financing activities, including changes from cash flows and non-cashchanges. These amendments are effective for annual periods beginning on or after January 1, 2017.
· In April 2016, the IASB issued amendments to IFRS 15, which was originally issued in May 2014. Theseamendments do not change the underlying principles of the standard but clarify how those principles should beapplied. The amendments clarify how to identify a performance obligation in a contract, determine whether acompany is a principal or an agent, and determine whether the revenue from granting a licence should berecognized at a point in time or over time. The amendments also include two additional transitional reliefs. Theamendments are effective for annual periods beginning on or after January 1, 2018, consistent with the effectivedate of the standard.
The Corporation is currently evaluating the impact of these standards.
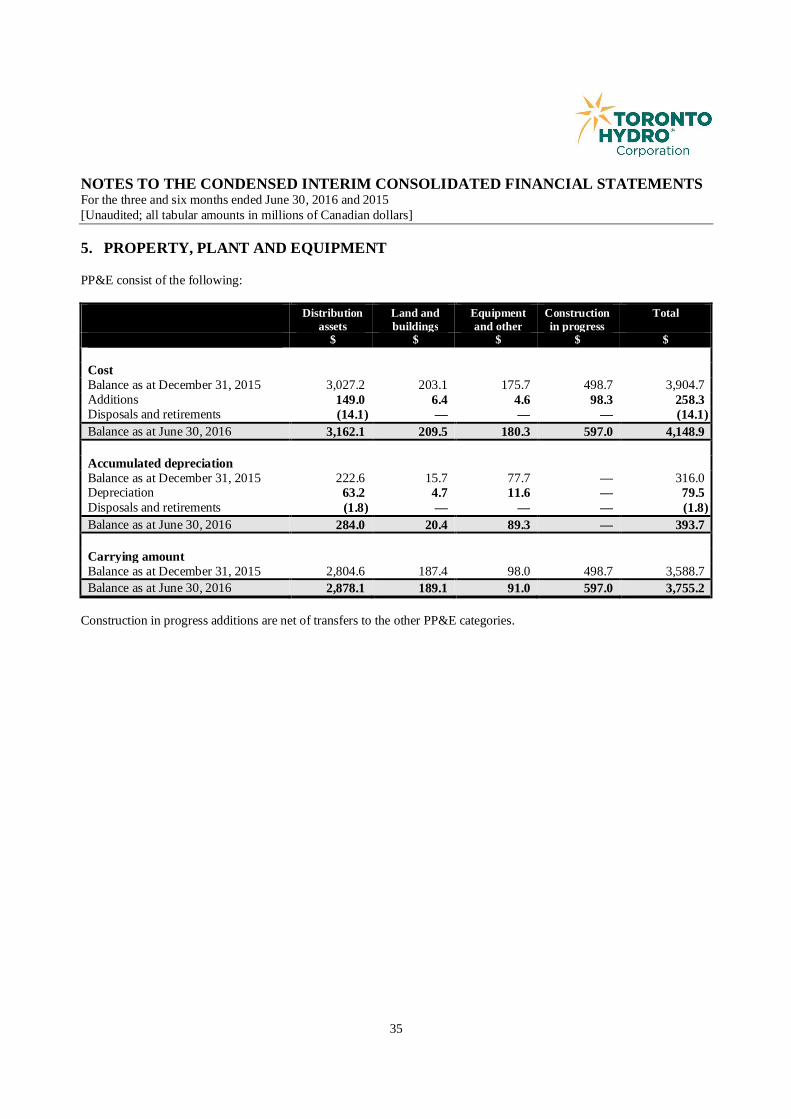
NOTES TO THE CONDENSED INTERIM CONSOLIDATED FINANCIAL STATEMENTSFor the three and six months ended June 30, 2016 and 2015[Unaudited; all tabular amounts in millions of Canadian dollars]
35
5. PROPERTY, PLANT AND EQUIPMENT
PP&E consist of the following:
Construction in progress additions are net of transfers to the other PP&E categories.
Distributionassets
Land andbuildings
Equipmentand other
Constructionin progress
Total
$ $ $ $ $
CostBalance as at December 31, 2015 3,027.2 203.1 175.7 498.7 3,904.7Additions 149.0 6.4 4.6 98.3 258.3Disposals and retirements (14.1) — — — (14.1)Balance as at June 30, 2016 3,162.1 209.5 180.3 597.0 4,148.9
Accumulated depreciationBalance as at December 31, 2015 222.6 15.7 77.7 — 316.0Depreciation 63.2 4.7 11.6 — 79.5Disposals and retirements (1.8) — — — (1.8)Balance as at June 30, 2016 284.0 20.4 89.3 — 393.7
Carrying amountBalance as at December 31, 2015 2,804.6 187.4 98.0 498.7 3,588.7Balance as at June 30, 2016 2,878.1 189.1 91.0 597.0 3,755.2

NOTES TO THE CONDENSED INTERIM CONSOLIDATED FINANCIAL STATEMENTSFor the three and six months ended June 30, 2016 and 2015[Unaudited; all tabular amounts in millions of Canadian dollars]
36
6. INTANGIBLE ASSETS
Intangible assets consist of the following:
Software in development and contributions for work in progress additions are net of transfers to the other intangible assetcategories.
Computersoftware
Contributions Software indevelopment
Contributionsfor work in
progress
Total
$ $ $ $ $
CostBalance as at December 31, 2015 101.6 21.7 11.8 104.3 239.4Additions 2.6 — 2.2 3.8 8.6Balance as at June 30, 2016 104.2 21.7 14.0 108.1 248.0
Accumulated amortizationBalance as at December 31, 2015 38.1 2.0 — — 40.1Amortization 9.5 0.5 — — 10.0Balance as at June 30, 2016 47.6 2.5 — — 50.1
Carrying amountBalance as at December 31, 2015 63.5 19.7 11.8 104.3 199.3Balance as at June 30, 2016 56.6 19.2 14.0 108.1 197.9
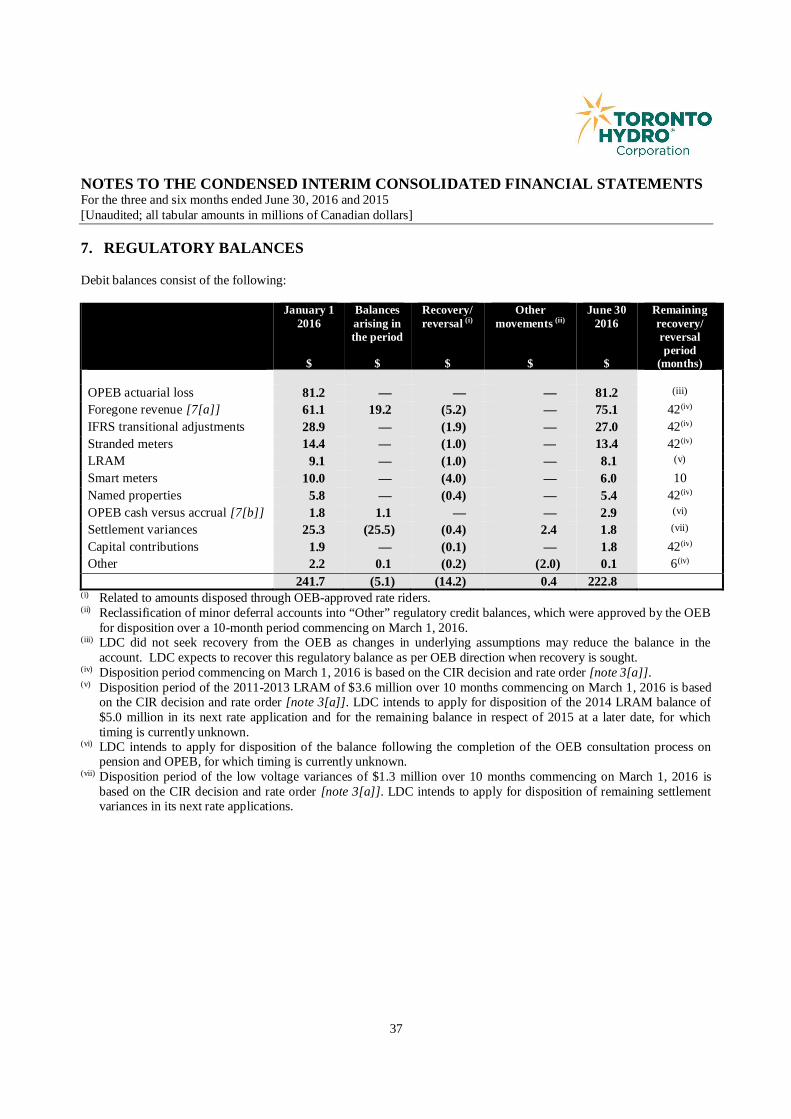
NOTES TO THE CONDENSED INTERIM CONSOLIDATED FINANCIAL STATEMENTSFor the three and six months ended June 30, 2016 and 2015[Unaudited; all tabular amounts in millions of Canadian dollars]
37
7. REGULATORY BALANCES
Debit balances consist of the following:
January 12016
$
Balancesarising inthe period
$
Recovery/reversal (i)
$
Othermovements (ii)
$
June 302016
$
Remainingrecovery/reversalperiod
(months)
OPEB actuarial loss 81.2 — — — 81.2 (iii)
Foregone revenue [7[a]] 61.1 19.2 (5.2) — 75.1 42(iv)
IFRS transitional adjustments 28.9 — (1.9) — 27.0 42(iv)
Stranded meters 14.4 — (1.0) — 13.4 42(iv)
LRAM 9.1 — (1.0) — 8.1 (v)
Smart meters 10.0 — (4.0) — 6.0 10Named properties 5.8 — (0.4) — 5.4 42(iv)
OPEB cash versus accrual [7[b]] 1.8 1.1 — — 2.9 (vi)
Settlement variances 25.3 (25.5) (0.4) 2.4 1.8 (vii)
Capital contributions 1.9 — (0.1) — 1.8 42(iv)
Other 2.2 0.1 (0.2) (2.0) 0.1 6(iv)
241.7 (5.1) (14.2) 0.4 222.8(i) Related to amounts disposed through OEB-approved rate riders.(ii) Reclassification of minor deferral accounts into “Other” regulatory credit balances, which were approved by the OEB
for disposition over a 10-month period commencing on March 1, 2016.(iii) LDC did not seek recovery from the OEB as changes in underlying assumptions may reduce the balance in the
account. LDC expects to recover this regulatory balance as per OEB direction when recovery is sought.(iv) Disposition period commencing on March 1, 2016 is based on the CIR decision and rate order [note 3[a]].(v) Disposition period of the 2011-2013 LRAM of $3.6 million over 10 months commencing on March 1, 2016 is based
on the CIR decision and rate order [note 3[a]]. LDC intends to apply for disposition of the 2014 LRAM balance of$5.0 million in its next rate application and for the remaining balance in respect of 2015 at a later date, for whichtiming is currently unknown.
(vi) LDC intends to apply for disposition of the balance following the completion of the OEB consultation process onpension and OPEB, for which timing is currently unknown.
(vii) Disposition period of the low voltage variances of $1.3 million over 10 months commencing on March 1, 2016 isbased on the CIR decision and rate order [note 3[a]]. LDC intends to apply for disposition of remaining settlementvariances in its next rate applications.

NOTES TO THE CONDENSED INTERIM CONSOLIDATED FINANCIAL STATEMENTSFor the three and six months ended June 30, 2016 and 2015[Unaudited; all tabular amounts in millions of Canadian dollars]
38
Credit balances consist of the following:
January 12016
$
Balancesarising inthe period
$
Recovery/reversal (i)
$
Othermovements (ii)
$
June 302016
$
Remainingrecovery/reversalperiod
(months)
Deferred taxes [7[c]] 114.8 (11.4) — — 103.4 (iii)
Tax-related variances 26.5 — (2.8) (0.5) 23.2 6-30(iv)
ICM 9.7 0.1 — — 9.8 (v)
Derecognition [7[d]] 9.9 (1.7) — — 8.2 (vi)
Capital-related revenuerequirement 2.8 — — — 2.8 (vi)
Gain on disposal 5.9 — (4.6) — 1.3 (vii)
Other 2.0 0.1 (0.8) 0.9 2.2 6(viii)
171.6 (12.9) (8.2) 0.4 150.9(i) Related to amounts disposed through OEB-approved rate riders.(ii) Reclassification of minor deferral accounts into “Other” regulatory credit balances, which were approved by the OEB
for disposition over a 10-month period commencing on March 1, 2016.(iii) LDC did not apply for disposition of the balance since it is being reversed through timing differences in the
recognition of deferred tax assets.(iv) Disposition period of the revision of prior year tax position account over 34 months and the income tax variance
account over 10 months commencing on March 1, 2016 is based on the CIR decision and rate order [note 3[a]].(v) Further to the OEB’s decision of July 28, 2016, the full balance will be recorded as an increase in equity through net
movements in regulatory balances, net of tax in the third quarter of 2016 [note 3[a]].(vi) LDC intends to apply for disposition of the balance at a later date, for which timing is currently unknown.(vii) Disposition period of forecasted gains is over 34 months commencing on March 1, 2016 as per the CIR decision and
rate order [note 3[a]]. The timing of balances arising from the realization of those gains is dependent on market andother conditions. LDC intends to apply for disposition of any residual balance at a later date for which timing iscurrently unknown.
(viii) Disposition period commencing on March 1, 2016 is based on the CIR decision and rate order [note 3[a]].
For a full description of the regulatory balances, refer to note 9 of the Corporation’s audited consolidated financialstatements for the year ended December 31, 2015. The significant changes for the six months ended June 30, 2016 aredescribed as follows:
a) Foregone Revenue
This regulatory balance relates to the revenue that LDC would have recovered in 2015 and 2016 if new rates wereimplemented as of May 1, 2015 and January 1, 2016, respectively. LDC recorded $19.2 million during the six monthsended June 30, 2016 to reflect the amount associated with the January 1, 2016 to February 29, 2016 period to berecovered through rates over a 46-month period commencing on March 1, 2016.
b) OPEB Cash versus Accrual
This regulatory balance relates to the difference between LDC’s forecasted OPEB costs on an accrual basis and the cashpayments made to the OPEB plans. In the CIR decision and rate order [note 3[a]], the OEB directed LDC to account forOPEB costs on a cash basis for rate-making purposes. This is a temporary arrangement, pending the OEB’s conclusionon the sector-wide policy consultation it initiated on pension and OPEB costs. LDC does not consider the OEB’s
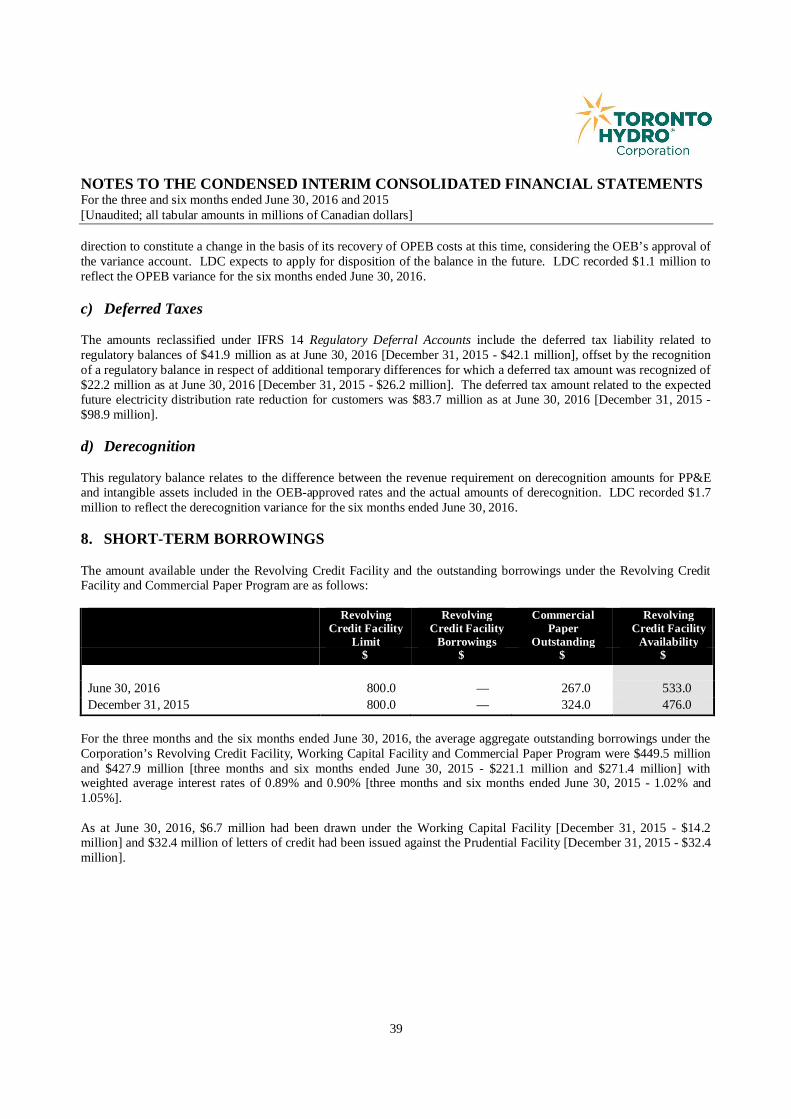
NOTES TO THE CONDENSED INTERIM CONSOLIDATED FINANCIAL STATEMENTSFor the three and six months ended June 30, 2016 and 2015[Unaudited; all tabular amounts in millions of Canadian dollars]
39
direction to constitute a change in the basis of its recovery of OPEB costs at this time, considering the OEB’s approval ofthe variance account. LDC expects to apply for disposition of the balance in the future. LDC recorded $1.1 million toreflect the OPEB variance for the six months ended June 30, 2016.
c) Deferred Taxes
The amounts reclassified under IFRS 14 Regulatory Deferral Accounts include the deferred tax liability related toregulatory balances of $41.9 million as at June 30, 2016 [December 31, 2015 - $42.1 million], offset by the recognitionof a regulatory balance in respect of additional temporary differences for which a deferred tax amount was recognized of$22.2 million as at June 30, 2016 [December 31, 2015 - $26.2 million]. The deferred tax amount related to the expectedfuture electricity distribution rate reduction for customers was $83.7 million as at June 30, 2016 [December 31, 2015 -$98.9 million].
d) Derecognition
This regulatory balance relates to the difference between the revenue requirement on derecognition amounts for PP&Eand intangible assets included in the OEB-approved rates and the actual amounts of derecognition. LDC recorded $1.7million to reflect the derecognition variance for the six months ended June 30, 2016.
8. SHORT-TERM BORROWINGS
The amount available under the Revolving Credit Facility and the outstanding borrowings under the Revolving CreditFacility and Commercial Paper Program are as follows:
RevolvingCredit Facility
Limit
RevolvingCredit Facility
Borrowings
CommercialPaper
Outstanding
RevolvingCredit Facility
Availability$ $ $ $
June 30, 2016 800.0 — 267.0 533.0December 31, 2015 800.0 — 324.0 476.0
For the three months and the six months ended June 30, 2016, the average aggregate outstanding borrowings under theCorporation’s Revolving Credit Facility, Working Capital Facility and Commercial Paper Program were $449.5 millionand $427.9 million [three months and six months ended June 30, 2015 - $221.1 million and $271.4 million] withweighted average interest rates of 0.89% and 0.90% [three months and six months ended June 30, 2015 - 1.02% and1.05%].
As at June 30, 2016, $6.7 million had been drawn under the Working Capital Facility [December 31, 2015 - $14.2million] and $32.4 million of letters of credit had been issued against the Prudential Facility [December 31, 2015 - $32.4million].
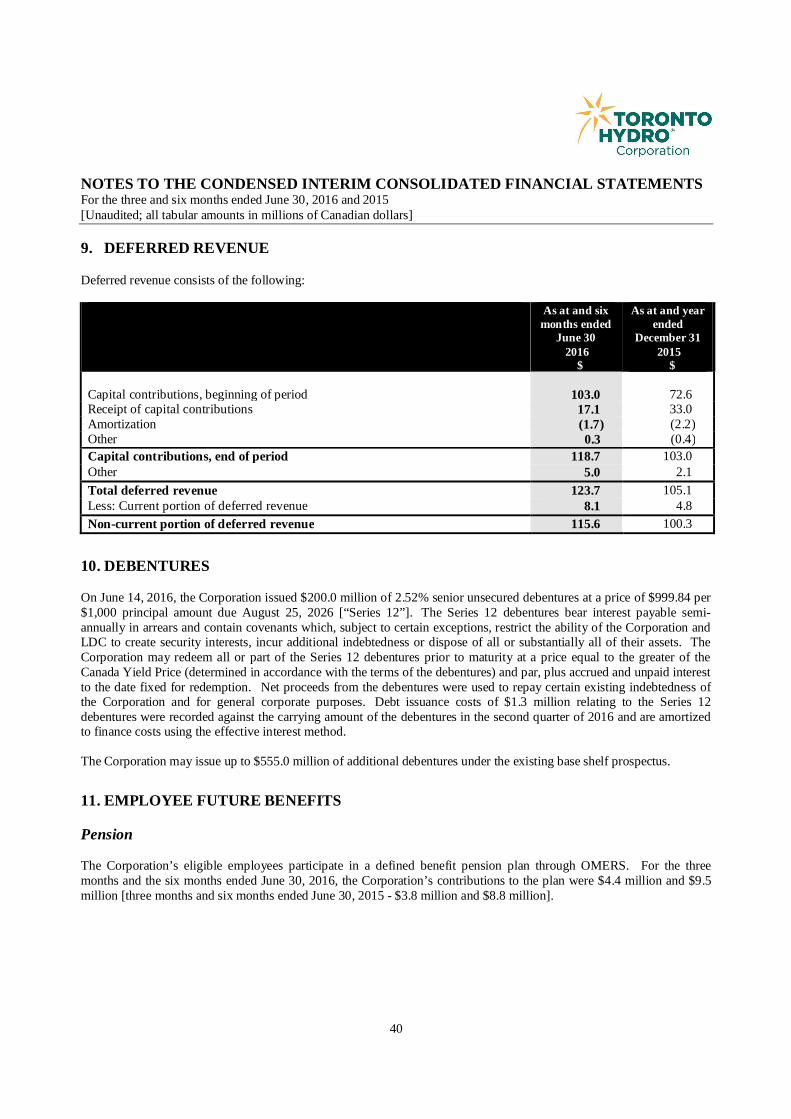
NOTES TO THE CONDENSED INTERIM CONSOLIDATED FINANCIAL STATEMENTSFor the three and six months ended June 30, 2016 and 2015[Unaudited; all tabular amounts in millions of Canadian dollars]
40
9. DEFERRED REVENUE
Deferred revenue consists of the following:
As at and sixmonths ended
June 302016
$
As at and yearended
December 312015
$
Capital contributions, beginning of period 103.0 72.6Receipt of capital contributions 17.1 33.0Amortization (1.7) (2.2)Other 0.3 (0.4)Capital contributions, end of period 118.7 103.0Other 5.0 2.1Total deferred revenue 123.7 105.1Less: Current portion of deferred revenue 8.1 4.8Non-current portion of deferred revenue 115.6 100.3
10. DEBENTURES
On June 14, 2016, the Corporation issued $200.0 million of 2.52% senior unsecured debentures at a price of $999.84 per$1,000 principal amount due August 25, 2026 [“Series 12”]. The Series 12 debentures bear interest payable semi-annually in arrears and contain covenants which, subject to certain exceptions, restrict the ability of the Corporation andLDC to create security interests, incur additional indebtedness or dispose of all or substantially all of their assets. TheCorporation may redeem all or part of the Series 12 debentures prior to maturity at a price equal to the greater of theCanada Yield Price (determined in accordance with the terms of the debentures) and par, plus accrued and unpaid interestto the date fixed for redemption. Net proceeds from the debentures were used to repay certain existing indebtedness ofthe Corporation and for general corporate purposes. Debt issuance costs of $1.3 million relating to the Series 12debentures were recorded against the carrying amount of the debentures in the second quarter of 2016 and are amortizedto finance costs using the effective interest method.
The Corporation may issue up to $555.0 million of additional debentures under the existing base shelf prospectus.
11. EMPLOYEE FUTURE BENEFITS
Pension
The Corporation’s eligible employees participate in a defined benefit pension plan through OMERS. For the threemonths and the six months ended June 30, 2016, the Corporation’s contributions to the plan were $4.4 million and $9.5million [three months and six months ended June 30, 2015 - $3.8 million and $8.8 million].
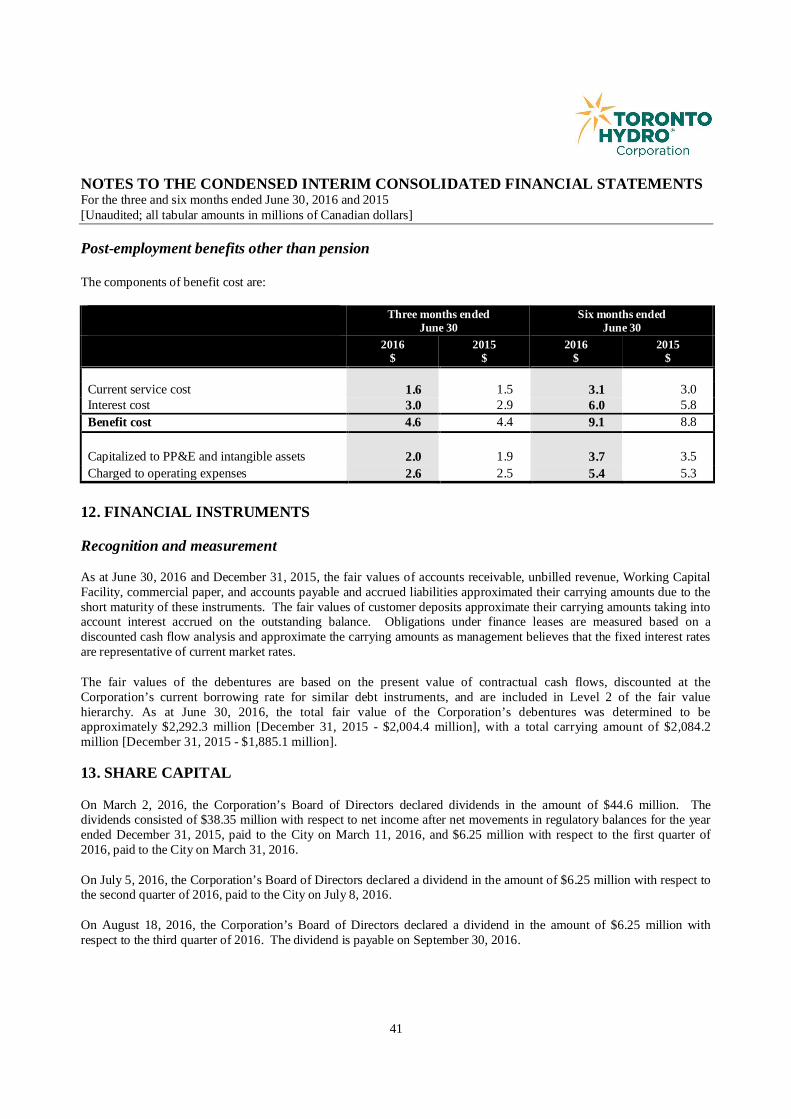
NOTES TO THE CONDENSED INTERIM CONSOLIDATED FINANCIAL STATEMENTSFor the three and six months ended June 30, 2016 and 2015[Unaudited; all tabular amounts in millions of Canadian dollars]
41
Post-employment benefits other than pension
The components of benefit cost are:
Three months endedJune 30
Six months endedJune 30
2016$
2015$
2016$
2015$
Current service cost 1.6 1.5 3.1 3.0Interest cost 3.0 2.9 6.0 5.8Benefit cost 4.6 4.4 9.1 8.8
Capitalized to PP&E and intangible assets 2.0 1.9 3.7 3.5Charged to operating expenses 2.6 2.5 5.4 5.3
12. FINANCIAL INSTRUMENTS
Recognition and measurement
As at June 30, 2016 and December 31, 2015, the fair values of accounts receivable, unbilled revenue, Working CapitalFacility, commercial paper, and accounts payable and accrued liabilities approximated their carrying amounts due to theshort maturity of these instruments. The fair values of customer deposits approximate their carrying amounts taking intoaccount interest accrued on the outstanding balance. Obligations under finance leases are measured based on adiscounted cash flow analysis and approximate the carrying amounts as management believes that the fixed interest ratesare representative of current market rates.
The fair values of the debentures are based on the present value of contractual cash flows, discounted at theCorporation’s current borrowing rate for similar debt instruments, and are included in Level 2 of the fair valuehierarchy. As at June 30, 2016, the total fair value of the Corporation’s debentures was determined to beapproximately $2,292.3 million [December 31, 2015 - $2,004.4 million], with a total carrying amount of $2,084.2million [December 31, 2015 - $1,885.1 million].
13. SHARE CAPITAL
On March 2, 2016, the Corporation’s Board of Directors declared dividends in the amount of $44.6 million. Thedividends consisted of $38.35 million with respect to net income after net movements in regulatory balances for the yearended December 31, 2015, paid to the City on March 11, 2016, and $6.25 million with respect to the first quarter of2016, paid to the City on March 31, 2016.
On July 5, 2016, the Corporation’s Board of Directors declared a dividend in the amount of $6.25 million with respect tothe second quarter of 2016, paid to the City on July 8, 2016.
On August 18, 2016, the Corporation’s Board of Directors declared a dividend in the amount of $6.25 million withrespect to the third quarter of 2016. The dividend is payable on September 30, 2016.

NOTES TO THE CONDENSED INTERIM CONSOLIDATED FINANCIAL STATEMENTSFor the three and six months ended June 30, 2016 and 2015[Unaudited; all tabular amounts in millions of Canadian dollars]
42
14. INCOME TAXES
The Corporation's effective tax rate after net movements in regulatory balances for the three months and the six monthsended June 30, 2016 was 15.2% and 12.9% [three months and six months ended June 30, 2015 - 13.4%]. The effectivetax rate for the three months ended June 30, 2016 was higher than the three months ended June 30, 2015 primarily due tochanges in permanent and temporary differences between accounting and tax treatments.
15. CONSOLIDATED STATEMENTS OF CASH FLOWS
Changes in non-cash working capital provided/(used) cash as follows:
Three months endedJune 30
Six months endedJune 30
2016$
2015$
2016$
2015$
Accounts receivable (19.3) 0.9 (45.1) (29.8)Unbilled revenue 14.3 (15.1) (0.4) 28.5Income tax receivable 2.6 (3.4) 6.6 (4.3)Materials and supplies (0.3) (0.2) (1.2) (0.7)Other current assets (0.8) (3.4) (3.0) (5.5)Accounts payable and accrued liabilities 19.8 (5.0) 29.1 1.9Deferred revenue (1.4) (1.1) 3.3 2.6Deferred conservation credit (3.8) (0.2) (6.6) 0.1Other current liabilities 0.2 — (0.2) 0.3
11.3 (27.5) (17.5) (6.9)
Reconciliation between the amount presented on the condensed interim consolidated statements of cash flows afterfactoring in the non-cash additions and total additions to PP&E and intangible assets is as follows:
Three months endedJune 30
Six months endedJune 30
2016$
2015$
2016$
2015$
Purchase of PP&E, cash basis 126.1 137.0 274.3 276.0Net change in accruals related to PP&E 2.4 8.2 (16.8) (25.9)Other 0.5 0.6 0.8 1.2Total additions to PP&E 129.0 145.8 258.3 251.3
Purchase of intangible assets, cash basisNet change in accruals related to intangibleassets
7.0
(3.0)
5.9
—
8.6
—
9.4
—Total additions to intangible assets 4.0 5.9 8.6 9.4Total additions to PP&E and intangibleassets 133.0 151.7 266.9 260.7

NOTES TO THE CONDENSED INTERIM CONSOLIDATED FINANCIAL STATEMENTSFor the three and six months ended June 30, 2016 and 2015[Unaudited; all tabular amounts in millions of Canadian dollars]
43
16. COMMITMENTS
Operating leases and capital projects
As at June 30, 2016, the future minimum payments under property operating leases, capital projects and othercommitments were as follows:
Operatingleases
Capitalprojects (4)
and other$ $
Less than one year (1) 2.9 20.7Between one and five years (2) 4.5 23.9More than five years (3) 1.1 —Total amount of future minimum payments 8.5 44.6
(1) Due over the period from July 1, 2016 to December 31, 2016.(2) Due over the period from January 1, 2017 to December 31, 2020.(3) Due from January 1, 2021 and beyond.(4) Commitments for construction services and estimated capital contributions.
Subsequent to June 30, 2016, the Corporation entered into a capital commitment of approximately $9.0 million, which isexpected to be settled within 2016.
17. CONTINGENCIES
Legal Proceedings
In the ordinary course of business, the Corporation is subject to various legal actions and claims from customers,suppliers, former employees and other parties. On an ongoing basis, the Corporation assesses the likelihood of anyadverse judgments or outcomes as well as potential ranges of probable costs and losses. A determination of the provisionrequired, if any, for these contingencies is made after an analysis of each individual issue. The provision may change inthe future due to new developments in each matter or changes in approach, such as a change in settlement strategy. Ifdamages were awarded under these actions, the Corporation and its subsidiaries would make a claim under anyapplicable liability insurance policies which the Corporation believes would cover any damages which may becomepayable by the Corporation and its subsidiaries in connection with these actions, subject to such claim not being disputedby the insurer. There have been no material changes in legal proceedings as disclosed in note 25 to the Corporation’saudited consolidated financial statements for the year ended December 31, 2015.