second quarter report canadian mint narrative discussion 26 weeks ended july 1, 2017 (unaudited)...
TRANSCRIPT

SECOND QUARTER FINANCIAL REPORT FISCAL 2017
NARRATIVE DISCUSSION..............................PAGE 2
FINANCIAL STATEMENTS AND NOTES.........PAGE 15
R O YA L C A N A D I A N M I NT NARR ATIVE DISCUSSION 26 weeks ended July 1, 2017 (Unaudited)
ROYAL CANADIAN MINT – SECOND QUARTER REPORT 2017 Page 2 of 40
NARRATIVE DISCUSSION BASIS OF PRESENTATION
The Royal Canadian Mint (the “Mint”) has prepared this report as required by section 131.1 of the Financial Administration Act1 using the standard issued by the Treasury Board of Canada Secretariat. This narrative should be read in conjunction with the unaudited condensed consolidated financial statements.
The Mint has prepared these unaudited condensed consolidated financial statements for the 13 and 26 weeks ended July 1, 2017, and July 2, 2016, in compliance with International Financial Reporting Standards (IFRS). Financial results reported in this narrative are presented in Canadian dollars and rounded to the nearest million, unless otherwise noted. The information in this narrative is current to August 15, 2017, unless otherwise noted.
FORWARD LOOKING STATEMENTS
Readers are advised to refer to the cautionary language included at the end of this narrative when reading any forward-looking statements.
OVERVIEW OF THE BUSINESS
The Royal Canadian Mint is Canada’s national mint, whose core mandate is to produce circulation coins for Canada, manage the supporting distribution system and provide advice to the Government of Canada on all matters related to coinage. It accomplishes this mandate through a world-leading coin distribution network and inventory management system, and a high-tech high-volume manufacturing, plating and coining facility in Winnipeg. It is also responsible for safeguarding the integrity of Canada’s coinage through ongoing research, development and implementation of increasingly sophisticated security features. The Mint’s activities also include the production and marketing of bullion and related refinery products and services, numismatic coins, medals and the provision of minting services to foreign countries.
Circulation Products and Solutions (CP&S) produces and supplies finished coins, coin blanks and tokens to customers around the world, including central banks, mints, monetary authorities and finance ministries. These contracts leverage the infrastructure and expertise in our
1 Financial Administration Act, R.S.C., 1985, c. F-11

R O YA L C A N A D I A N M I NT NARR ATIVE DISCUSSION 26 weeks ended July 1, 2017 (Unaudited)
ROYAL CANADIAN MINT – SECOND QUARTER REPORT 2017 Page 3 of 40
Winnipeg manufacturing facility. CP&S is also responsible for the Alloy Recovery Program (ARP) under which older-composition Canadian coins are removed from circulation and replaced by multi-ply plated steel (MPPS) coins, which are more durable and secure. This systematic replacement of old alloy coins also ensures that there is consistency in the market, which helps to streamline automated coin acceptance transactions.
The Bullion Products and Services business provides its customers with market-leading precious metal investment coin and bar products, supported by integrated precious metal refining, storage and exchange traded receipts (ETR) capabilities. The products include the Maple Leaf family of gold, silver, palladium and platinum coins, and other precious metal products and services for investment and manufacturing purposes. As a market leader in the industry with bullion coins of the highest quality and unprecedented security, the Mint is well positioned to capture a leading share of any increase in demand while sustaining volumes during soft markets. The Canadian Gold and Silver Reserves ETR products listed on the Toronto Stock Exchange allow retail and institutional investors to access precious metals stored at the Mint while reducing Mint lease costs.
The Numismatics business creates and sells collectible coins and medals to customers in Canada and around the world. Due to its world-class designs, the Mint’s global leadership in the art and science of minting is consistently recognized with prestigious international awards in large part due to innovative technology enhancements such as holograms, selective plating and stunning colour that allow the Mint to create unique and compelling products. Mint.ca continues to rank among the top destinations for online numismatic coin purchases in Canada and around the world, a direct result of the Mint’s focus on building traffic to its website in order to grow direct sales, as well as the secondary market for collector coins.
SIGNIFICANT CORPORATE EVENTS
Canada 150
In keeping with its mandate, the Mint issued My Canada, My Inspiration (MCMI) special circulation coins to mark Canada’s 150th anniversary. All of the different denominations of the coins, which were designed by Canadians for Canadians, have now been released. In June, as part of the MCMI collection, the Mint unveiled a limited-edition glow-in-the dark $2 coin, the world’s first glow-in-the-dark circulation coin.
Starting in 2017, the Mint also began to leverage the considerable appeal of the 150th anniversary of Canada’s confederation as a prime opportunity to launch new products and programs including a new suite of affordable, entry-level collector coins which will continue to grow its customer base and its Numismatics business. The Mint introduced the first of these coins in the fall of 2016 and more have followed in 2017. To date, the Canada 150 program

R O YA L C A N A D I A N M I NT NARR ATIVE DISCUSSION 26 weeks ended July 1, 2017 (Unaudited)
ROYAL CANADIAN MINT – SECOND QUARTER REPORT 2017 Page 4 of 40
continues to show stronger than expected sales especially with the newly improved targeting approaches on social media platforms, which have yielded positive returns. The launch of MosaiCanada150 during the second quarter of 2017 is expected to yield positive returns and it is on track to reach its sales targets.
Amended Requirements for the Directive on Travel, Hospitality, Conference and Event Expenditures
The Treasury Board of Canada issued amended requirements for the Directive on Travel, Hospitality, Conference and Event Expenditures effective April 1, 2017. The principal changes include additional emphasis on the Chief Financial Officer, senior departmental managers and delegated managers’ responsibilities, as well as additional reporting requirements and an increased threshold for hospitality where ministerial or deputy head approval is required.
Revision of Prior Period Financial Results
As discussed in the Mint’s 2016 Annual Report, in the course of the preparation of the quarterly condensed consolidated financial statements for the quarter ended October 1, 2016, the Mint identified adjustments to prior periods relating to the sale of numismatic Face Value products, the sale of Bullion products, and other reclassifications. Further information regarding these revisions is disclosed in Note 3 the condensed consolidated financial statements for the 13 weeks and 26 weeks ended July 1, 2017.
OPERATING HIGHLIGHTS AND ANALYSIS OF RESULTS
To achieve its objectives, the Mint strives to continually improve profitability through prudent financial management and efficient operations. The Mint measures its performance by using metrics meaningful to customers, business partners and employees. The measures below allow the Mint to monitor its capacity to improve performance and create value.
13 weeks ended 26 weeks ended
July 1,
2017 July 2,
2016 (revised)
$ Change % Change
July 1, 2017
July 2, 2016
(revised)
$ Change % Change
Revenue $ 401.6 $ 610.1 $ (208.5) (34) $ 904.4 $ 1,198.5 $ (294.1) (25) Profit before FV revaluation1 and income taxes
9.6 5.4 4.2 78 20.2 18.9 1.3 7
Profit before income taxes 4.4 14.0 (9.6) (69) 19.3 28.9 (9.6) (33) Profit after income taxes 5.3 10.5 (5.2) (50) 16.4 21.7 (5.3) (24) 1 FV revaluation is the non-cash impact of the change in the valuation of the precious metal component of the liability for Face Value redemptions and returns

R O YA L C A N A D I A N M I NT NARR ATIVE DISCUSSION 26 weeks ended July 1, 2017 (Unaudited)
ROYAL CANADIAN MINT – SECOND QUARTER REPORT 2017 Page 5 of 40
As at
July 1, 2017 December 31, 2016 $ Change % Change Cash $ 85.8 $ 114.2 $ (28.4) (25) Inventories 85.2 78.9 6.3 8 Capital assets 177.9 182.5 (4.6) (3) Total assets 415.7 444.1 (28.4) (6) Working capital 127.9 136.1 (8.2) (6)
Note: The Mint's fiscal year end is December 31.
Profit before Face Value revaluation and income taxes for the 13 and 26 weeks ended July 1, 2017 increased to $9.6 million and $20.2 million, respectively, compared to $5.4 million and $18.9 million, respectively, during the same periods in fiscal year 2016. These increases were mainly due to strong demand for Canada 150 products and the resulting positive impact on the numismatic business in 2017. In the 26 weeks ended July 1, 2017, the Corporation paid a $29 million dividend to its shareholder, the Government of Canada, resulting in a decrease in cash, total assets and working capital at July 1, 2017 when compared to the respective balances at December 31, 2016.
Revenue by Program and Business
13 weeks ended 26 weeks ended
July 1,
2017
July 2, 2016
(revised)
$ Change
% Change
July 1,
2017
July 2, 2016
(revised)
$ Change
% Change
Canadian Circulation Program $ 25.9 $ 25.6 $ 0.3 1 $ 48.7 $ 46.1 $ 2.6 6
Circulation Products and Solutions 10.8 15.2 (4.4) (29) 22.7 21.9 0.8 4
Bullion Products and Services 319.6 534.3 (214.7) (40) 740.8 1,055.9 (315.1) (30)
Numismatics 45.3 35.0 10.3 29 92.2 74.6 17.6 24
R O YA L C A N A D I A N M I NT NARR ATIVE DISCUSSION 26 weeks ended July 1, 2017 (Unaudited)
ROYAL CANADIAN MINT – SECOND QUARTER REPORT 2017 Page 6 of 40
Canadian Circulation Program
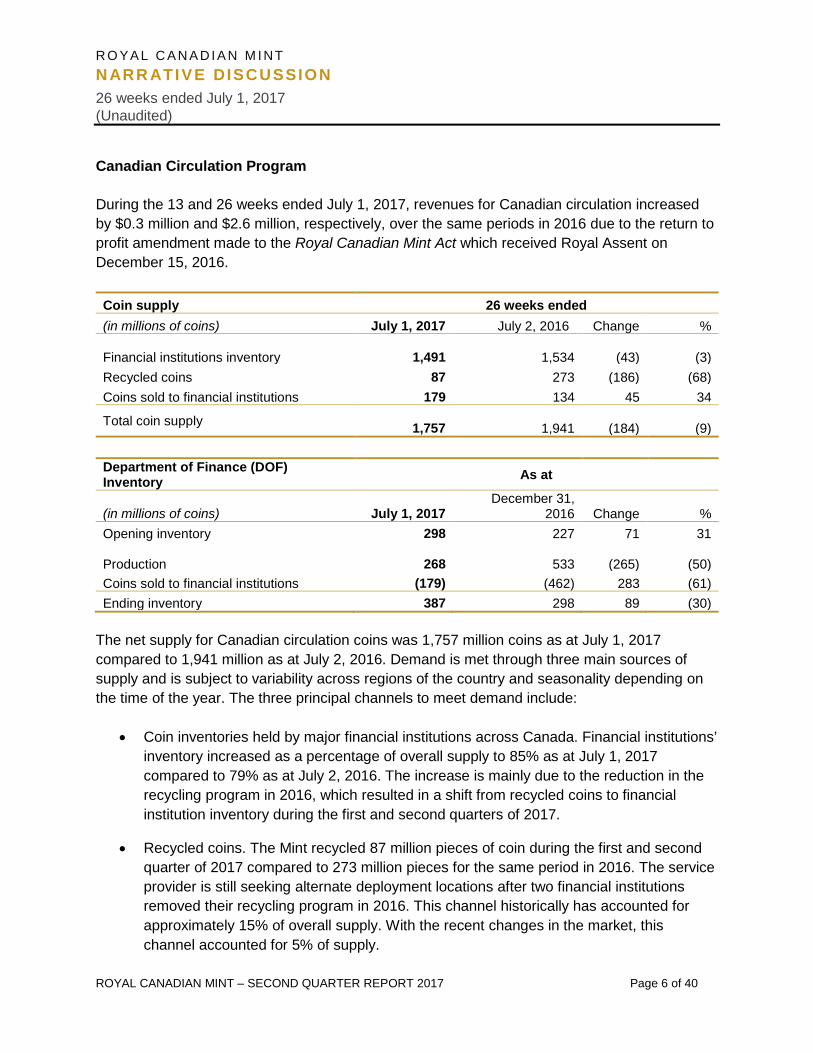
During the 13 and 26 weeks ended July 1, 2017, revenues for Canadian circulation increased by $0.3 million and $2.6 million, respectively, over the same periods in 2016 due to the return to profit amendment made to the Royal Canadian Mint Act which received Royal Assent on December 15, 2016.
Coin supply 26 weeks ended (in millions of coins) July 1, 2017 July 2, 2016 Change %
Financial institutions inventory
1,491 1,534 (43) (3) Recycled coins 87 273 (186) (68) Coins sold to financial institutions 179 134 45 34
Total coin supply 1,757 1,941 (184) (9)
Department of Finance (DOF) Inventory As at
(in millions of coins) July 1, 2017 December 31,
2016 Change % Opening inventory 298 227 71 31
Production
268 533 (265) (50) Coins sold to financial institutions (179) (462) 283 (61) Ending inventory 387 298 89 (30)
The net supply for Canadian circulation coins was 1,757 million coins as at July 1, 2017 compared to 1,941 million as at July 2, 2016. Demand is met through three main sources of supply and is subject to variability across regions of the country and seasonality depending on the time of the year. The three principal channels to meet demand include:
• Coin inventories held by major financial institutions across Canada. Financial institutions’ inventory increased as a percentage of overall supply to 85% as at July 1, 2017 compared to 79% as at July 2, 2016. The increase is mainly due to the reduction in the recycling program in 2016, which resulted in a shift from recycled coins to financial institution inventory during the first and second quarters of 2017.
• Recycled coins. The Mint recycled 87 million pieces of coin during the first and second quarter of 2017 compared to 273 million pieces for the same period in 2016. The service provider is still seeking alternate deployment locations after two financial institutions removed their recycling program in 2016. This channel historically has accounted for approximately 15% of overall supply. With the recent changes in the market, this channel accounted for 5% of supply.
R O YA L C A N A D I A N M I NT NARR ATIVE DISCUSSION 26 weeks ended July 1, 2017 (Unaudited)
ROYAL CANADIAN MINT – SECOND QUARTER REPORT 2017 Page 7 of 40
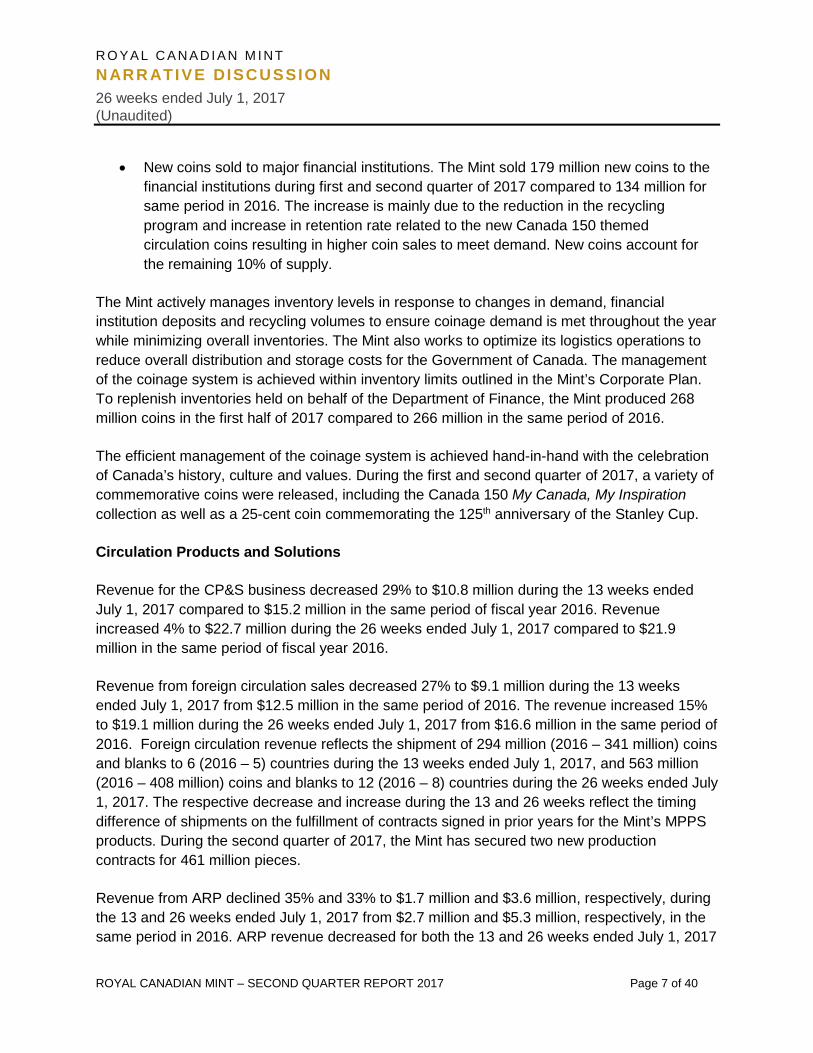
• New coins sold to major financial institutions. The Mint sold 179 million new coins to the financial institutions during first and second quarter of 2017 compared to 134 million for same period in 2016. The increase is mainly due to the reduction in the recycling program and increase in retention rate related to the new Canada 150 themed circulation coins resulting in higher coin sales to meet demand. New coins account for the remaining 10% of supply.
The Mint actively manages inventory levels in response to changes in demand, financial institution deposits and recycling volumes to ensure coinage demand is met throughout the year while minimizing overall inventories. The Mint also works to optimize its logistics operations to reduce overall distribution and storage costs for the Government of Canada. The management of the coinage system is achieved within inventory limits outlined in the Mint’s Corporate Plan. To replenish inventories held on behalf of the Department of Finance, the Mint produced 268 million coins in the first half of 2017 compared to 266 million in the same period of 2016.
The efficient management of the coinage system is achieved hand-in-hand with the celebration of Canada’s history, culture and values. During the first and second quarter of 2017, a variety of commemorative coins were released, including the Canada 150 My Canada, My Inspiration collection as well as a 25-cent coin commemorating the 125th anniversary of the Stanley Cup.
Circulation Products and Solutions
Revenue for the CP&S business decreased 29% to $10.8 million during the 13 weeks ended July 1, 2017 compared to $15.2 million in the same period of fiscal year 2016. Revenue increased 4% to $22.7 million during the 26 weeks ended July 1, 2017 compared to $21.9 million in the same period of fiscal year 2016.
Revenue from foreign circulation sales decreased 27% to $9.1 million during the 13 weeks ended July 1, 2017 from $12.5 million in the same period of 2016. The revenue increased 15% to $19.1 million during the 26 weeks ended July 1, 2017 from $16.6 million in the same period of 2016. Foreign circulation revenue reflects the shipment of 294 million (2016 – 341 million) coins and blanks to 6 (2016 – 5) countries during the 13 weeks ended July 1, 2017, and 563 million (2016 – 408 million) coins and blanks to 12 (2016 – 8) countries during the 26 weeks ended July 1, 2017. The respective decrease and increase during the 13 and 26 weeks reflect the timing difference of shipments on the fulfillment of contracts signed in prior years for the Mint’s MPPS products. During the second quarter of 2017, the Mint has secured two new production contracts for 461 million pieces.
Revenue from ARP declined 35% and 33% to $1.7 million and $3.6 million, respectively, during the 13 and 26 weeks ended July 1, 2017 from $2.7 million and $5.3 million, respectively, in the same period in 2016. ARP revenue decreased for both the 13 and 26 weeks ended July 1, 2017

R O YA L C A N A D I A N M I NT NARR ATIVE DISCUSSION 26 weeks ended July 1, 2017 (Unaudited)
ROYAL CANADIAN MINT – SECOND QUARTER REPORT 2017 Page 8 of 40
when compared to the same periods in 2016 due to the decline in recycling volumes and reduced numbers of alloy coins in the volumes that are recycled.
Bullion Products and Services
13 weeks ended 26 weeks ended
July 1,
2017 July 2, 2016 July 1,
2017 July 2, 2016 Gross revenue $ 387.0 $ 678.9 $ 938.1 $ 1,391.5 Less: Customer inventory deals (67.4) (144.6) (197.3) (335.6) Net revenue $ 319.6 $ 534.3 $ 740.8 $ 1,055.9
13 weeks ended 26 weeks ended
(thousands of ounces) July 1,
2017 July 2, 2016 July 1,
2017 July 2, 2016 Gold 238.0 477.1 674.5 917.4 Silver 8,723.4 16,123.8 18,416.6 37,998.7 Gross ounces 8,961.4 16,600.9 19,091.1 38,916.1 Less: ounces from customer inventory deals (223.1) (1,939.3) (1,308.6) (4,684.7) Net ounces 8,738.3 14,661.6 17,782.5 34,231.4
Bullion revenues for the 13 and 26 weeks ended July 1, 2017 decreased 40% and 30% to $319.6 million and $740.8 million, respectively, from revised revenue of $534.3 million and $1,055.9 million in the same periods in 2016. The decline in revenues in both periods is mainly attributed to lower demand and pricing for silver bullion products.
Numismatics
Numismatics revenue increased 29% to $45.3 million during the 13 weeks ended July 1, 2017 compared to the revised revenue of $35.0 million in the same period of 2016 and increased 24% to $92.2 million during the 26 weeks ended July 1, 2017 compared to revised revenue of $74.6 million in the same period of 2016. The increase in both periods is primarily due to the strong demand for Canada 150 products, as well as the 2017 Proudly Canadian glow in the dark silver coin and the gold and silver two-coin set celebrating the 30th anniversary of the Loonie. Sales of numismatics silver products increased 33% in the 13 weeks ended July 1, 2017 mainly due to the successful launch of new silver coins. The overall decrease in sales of gold products was primarily due to the change in product mix in 2017.
13 weeks ended 26 weeks ended
July 1, 2017 July 2, 2016 July 1, 2017 July 2, 2016 Gold $ 5.1 $ 6.4 $ 9.9 $ 20.6 Silver 33.1 24.9 68.5 47.4 Other 7.1 3.7 13.8 6.6
R O YA L C A N A D I A N M I NT NARR ATIVE DISCUSSION 26 weeks ended July 1, 2017 (Unaudited)
ROYAL CANADIAN MINT – SECOND QUARTER REPORT 2017 Page 9 of 40
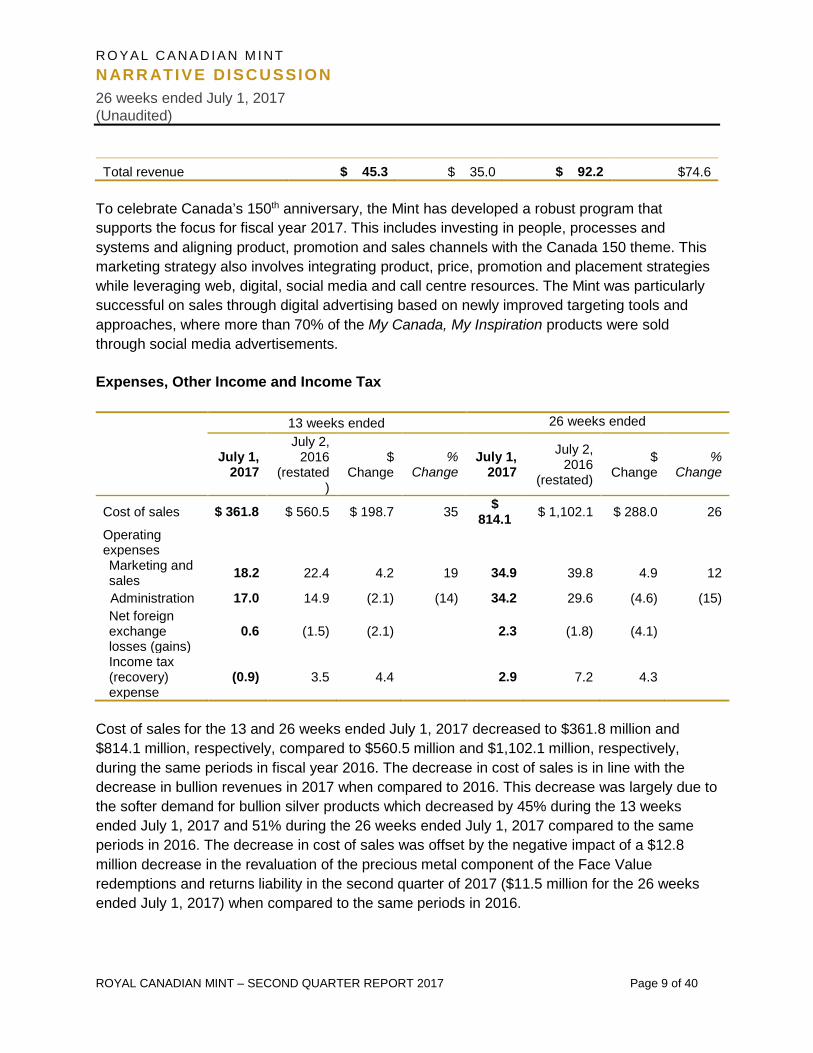
Total revenue $ 45.3 $ 35.0 $ 92.2 $74.6
To celebrate Canada’s 150th anniversary, the Mint has developed a robust program that supports the focus for fiscal year 2017. This includes investing in people, processes and systems and aligning product, promotion and sales channels with the Canada 150 theme. This marketing strategy also involves integrating product, price, promotion and placement strategies while leveraging web, digital, social media and call centre resources. The Mint was particularly successful on sales through digital advertising based on newly improved targeting tools and approaches, where more than 70% of the My Canada, My Inspiration products were sold through social media advertisements.
Expenses, Other Income and Income Tax
13 weeks ended 26 weeks ended
July 1, 2017
July 2, 2016
(restated)
$ Change
% Change
July 1, 2017
July 2, 2016
(restated)
$ Change
% Change
Cost of sales $ 361.8 $ 560.5 $ 198.7 35 $ 814.1 $ 1,102.1 $ 288.0 26
Operating expenses
Marketing and sales 18.2 22.4 4.2 19 34.9 39.8 4.9 12
Administration 17.0 14.9 (2.1) (14) 34.2 29.6 (4.6) (15) Net foreign exchange losses (gains)
0.6 (1.5) (2.1) 2.3 (1.8) (4.1)
Income tax (recovery) expense
(0.9) 3.5 4.4 2.9 7.2 4.3
Cost of sales for the 13 and 26 weeks ended July 1, 2017 decreased to $361.8 million and $814.1 million, respectively, compared to $560.5 million and $1,102.1 million, respectively, during the same periods in fiscal year 2016. The decrease in cost of sales is in line with the decrease in bullion revenues in 2017 when compared to 2016. This decrease was largely due to the softer demand for bullion silver products which decreased by 45% during the 13 weeks ended July 1, 2017 and 51% during the 26 weeks ended July 1, 2017 compared to the same periods in 2016. The decrease in cost of sales was offset by the negative impact of a $12.8 million decrease in the revaluation of the precious metal component of the Face Value redemptions and returns liability in the second quarter of 2017 ($11.5 million for the 26 weeks ended July 1, 2017) when compared to the same periods in 2016.
R O YA L C A N A D I A N M I NT NARR ATIVE DISCUSSION 26 weeks ended July 1, 2017 (Unaudited)
ROYAL CANADIAN MINT – SECOND QUARTER REPORT 2017 Page 10 of 40
Operating expenses for the 13 weeks ended July 1, 2017 decreased 6% to $35.2 million from $37.3 million for the same period in fiscal year 2016 due to lower sales and marketing expenses resulting from lower advertising and shipping expenses offset by higher administration expenses as the Mint works to complete the 2014 Office of the Auditor General special examination recommendations relating to risk and resilience while at the same time taking steps to reduce its Ottawa facility footprint. Operating expenses for the 26 weeks ended July 1, 2017 were consistent with the same period in 2016 at $69 million.
Net foreign exchange loss increased $2.1 million and $4.1 million for the 13 and 26 weeks ended July 1, 2017, respectively, when compared to the same periods in 2016. For the 26 weeks ended July 1, 2017, the losses on the settlement of derivatives were higher than the same period in 2016 partially offset by the 4% strengthening of the Canadian dollar compared to a strengthening of 7% in the same period of 2016 resulting in a positive impact on the translation of U.S. balances to Canadian dollars period over period.
There was an income tax recovery in the 13 weeks ended July 1, 2017 of $0.9 million due to the receipt of foreign tax credits relating to prior years of $1.8 million. Accordingly, the income tax expense for the 26 weeks ended July 1, 2017 is lower than would be computed by applying the Federal statutory income rate of 25% (2016 – 25%).
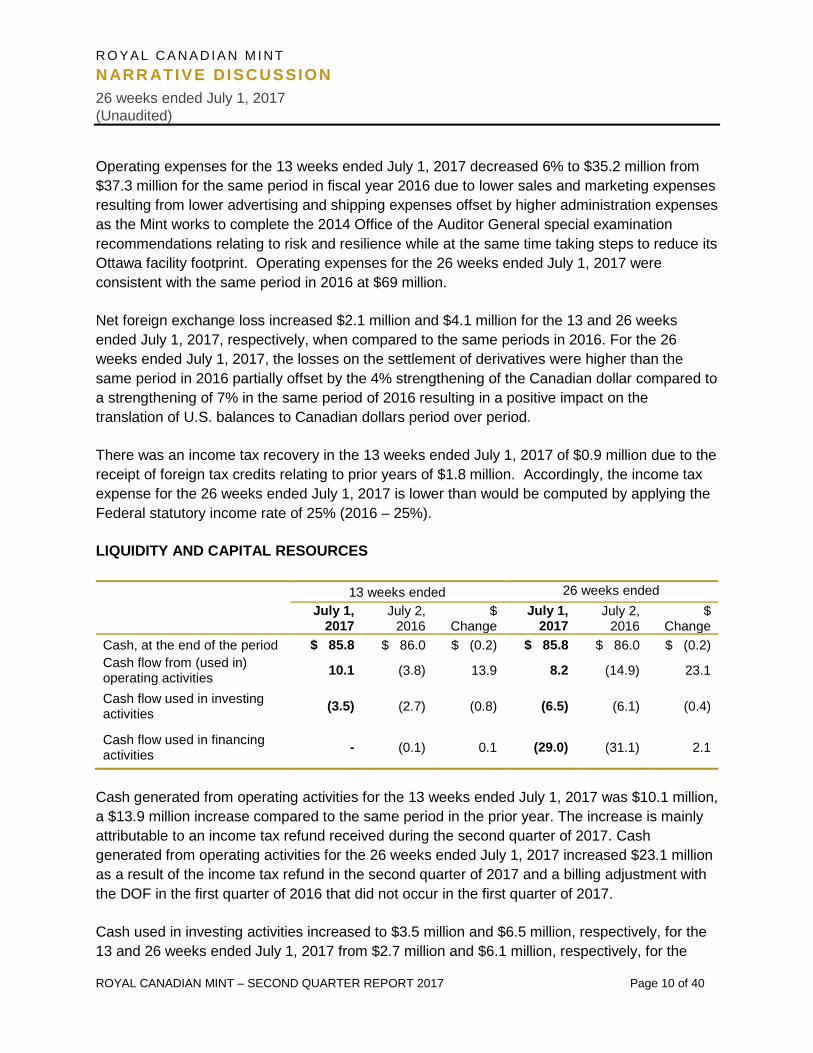
LIQUIDITY AND CAPITAL RESOURCES
13 weeks ended 26 weeks ended
July 1,
2017 July 2,
2016 $
Change July 1,
2017 July 2,
2016 $
Change Cash, at the end of the period $ 85.8 $ 86.0 $ (0.2) $ 85.8 $ 86.0 $ (0.2) Cash flow from (used in) operating activities 10.1 (3.8) 13.9 8.2 (14.9) 23.1
Cash flow used in investing activities (3.5) (2.7) (0.8) (6.5) (6.1) (0.4)
Cash flow used in financing activities - (0.1) 0.1 (29.0) (31.1) 2.1
Cash generated from operating activities for the 13 weeks ended July 1, 2017 was $10.1 million, a $13.9 million increase compared to the same period in the prior year. The increase is mainly attributable to an income tax refund received during the second quarter of 2017. Cash generated from operating activities for the 26 weeks ended July 1, 2017 increased $23.1 million as a result of the income tax refund in the second quarter of 2017 and a billing adjustment with the DOF in the first quarter of 2016 that did not occur in the first quarter of 2017.
Cash used in investing activities increased to $3.5 million and $6.5 million, respectively, for the 13 and 26 weeks ended July 1, 2017 from $2.7 million and $6.1 million, respectively, for the

R O YA L C A N A D I A N M I NT NARR ATIVE DISCUSSION 26 weeks ended July 1, 2017 (Unaudited)
ROYAL CANADIAN MINT – SECOND QUARTER REPORT 2017 Page 11 of 40
same periods in 2016. The capital expenditures in the 13 and 26 weeks ended July 1, 2017 primarily related to renovations carried out at the Mint’s headquarters in Ottawa.
The $2.1 million decrease in cash used in financing activities for the 26 weeks ended July 1, 2017 represented a lower dividend pay out to the Government of Canada during the first quarter of 2017 compared 2016.
BORROWING FACILITIES
See note 17 in the December 31, 2016 audited consolidated financial statements for details on the Mint’s borrowing facilities. The Mint entered and closed the quarter with total outstanding long term loans of $27 million. The long term ratio declined to 1:6 at July 1, 2017 from 1:7 at December 31, 2016.
RISKS TO PERFORMANCE
Management considers risks and opportunities at all levels of decision making and is continually evaluating the adequacy of the Enterprise Risk Management (ERM) program to ensure it is designed to meet shareholder requirements. During a recent assessment of the program, opportunities for improvements were identified which lead to key recommendations. Based on those recommendations, management will be advancing its ERM program to the next level of maturity and increasing the value of risk informed decision making.
As discussed in the Annual Report, the Mint’s performance is influenced by many factors, including: economic conditions, financial and commodity market volatility, and competitive pressures. Also, as a Crown Corporation solely owned by the Government of Canada and governed under a legislative framework, the Mint’s performance could be impacted by changes to shareholder objectives or to the directions given by governing bodies. There have been no material changes to these risk factors since the filing of the 2016 Annual Report.
CRITICAL ACCOUNTING ESTIMATES, ADOPTION OF NEW ACCOUNTING STANDARDS AND ACCOUNTING POLICY DEVELOPMENTS
See notes 4 and 5 in the audited consolidated financial statements for the year ended December 31, 2016 for a discussion of critical accounting estimates, adoption of new accounting standards and accounting policy developments.
OUTLOOK
The operating and financial results achieved during the 26 weeks ended July 1, 2017 indicate that the financial goals established in the 2017-2021 Corporate Plan, approved by the Mint’s Board of Directors but pending approval of Governor in Council, are on track.
R O YA L C A N A D I A N M I NT NARR ATIVE DISCUSSION 26 weeks ended July 1, 2017 (Unaudited)
ROYAL CANADIAN MINT – SECOND QUARTER REPORT 2017 Page 12 of 40
The Mint successfully launched 80 million MCMI design coins and positioned inventory in readiness for the peak summer demand period. The reduction of available recycled coins has resulted in higher demand for new coins, and production is expected to increase for the remainder of the year. Forecasted new coin demand is expected to exceed the Corporate Plan for 2017. The decline in recycling volumes is being closely monitored to assess the impact on the demand for Canadian circulation coins going forward and to explore potential responses.
Global demand for foreign circulation products, in particular blanks, is growing. Over the next 6 months Central Banks around the world are expected to issue combined tenders for over 6 billion nickel plated steel blanks. The Mint continues to expect profitable use of its Winnipeg expertise and assets.
The Mint’s Numismatic sales continue to remain strong and on track for the year, driven by the success of the Canada 150 program, which is expected to continue as new products are introduced through the remainder of the year.
Gold and Silver bullion demand remained soft in the second quarter, and the Mint is continuing to carefully manage operating costs.
FORWARD LOOKING STATEMENTS
The unaudited condensed consolidated quarterly financial statements and the narrative contain forward-looking statements that reflect management’s expectations regarding the Mint’s objectives, plans, strategies, future growth, results of operations, performance, and business prospects and opportunities. Forward-looking statements are typically identified by words or phrases such as “plans”, “anticipates”, “expects”, “believes”, “estimates”, “intends”, and other similar expressions. These forward-looking statements are not facts, but only estimates regarding expected growth, results of operations, performance, business prospects and opportunities (assumptions). While management considers these assumptions to be reasonable based on available information, they may prove to be incorrect. These estimates of future results are subject to a number of risks, uncertainties and other factors that could cause actual results to differ materially from what the Mint expects. These risks, uncertainties and other factors include, but are not limited to, those risks and uncertainties set forth above in the Risks to Performance as well as in Note 8 – Financial Instruments and Financial Risk Management to the Mint’s unaudited condensed consolidated financial statements.
To the extent the Mint provides future-oriented financial information or a financial outlook, such as future growth and financial performance, the Mint is providing this information for the purpose of describing its future expectations. Therefore, readers are cautioned that this information may not be appropriate for any other purpose. Furthermore, future-oriented financial information and
R O YA L C A N A D I A N M I NT NARR ATIVE DISCUSSION 26 weeks ended July 1, 2017 (Unaudited)
ROYAL CANADIAN MINT – SECOND QUARTER REPORT 2017 Page 13 of 40
financial outlooks, as with forward-looking information generally, are based on the assumptions and subject to the risks.
Readers are urged to consider these factors carefully when evaluating these forward-looking statements. In light of these assumptions and risks, the events predicted in these forward-looking statements may not occur. The Mint cannot assure that projected results or events will be achieved. Accordingly, readers are cautioned not to place undue reliance on the forward-looking statements.
The forward-looking statements included in the unaudited condensed consolidated quarterly financial statements and narrative are made only as of August 15, 2017, and the Mint does not undertake to publicly update these statements to reflect new information, future events or changes in circumstances or for any other reason after this date.
ROYAL CANADIAN MINT – SECOND QUARTER REPORT 2017 Page 14 of 40
Statement of Management Responsibility by Senior Officials
Management is responsible for the preparation and fair presentation of these condensed consolidated quarterly financial statements in accordance with IAS 34 Interim Financial Reporting and requirements in the Treasury Board of Canada Standard on Quarterly Financial Reports for Crown Corporations and for such internal controls as management determines are necessary to enable the preparation of condensed consolidated quarterly financial statements that are free from material misstatement. Management is also responsible for ensuring all other information in this quarterly financial report is consistent, where appropriate, with the condensed consolidated quarterly financial statements.
To the best of our knowledge, these unaudited condensed consolidated quarterly financial statements present fairly, in all material respects, the financial position, results of operations and cash flows of the Royal Canadian Mint, as at the date of and for the periods presented in the condensed consolidated quarterly financial statements.
Sandra L. Hanington Jennifer Camelon, CPA, CA
President and Chief Executive Officer Chief Financial Officer and
Vice-President, Finance and Administration
Sean Homuth, CPA, CA CPA (Illinois) Chief Accounting Officer
Ottawa, Canada
August 15, 2017
ROYAL CANADIAN MINT – SECOND QUARTER REPORT 2017 Page 15 of 40
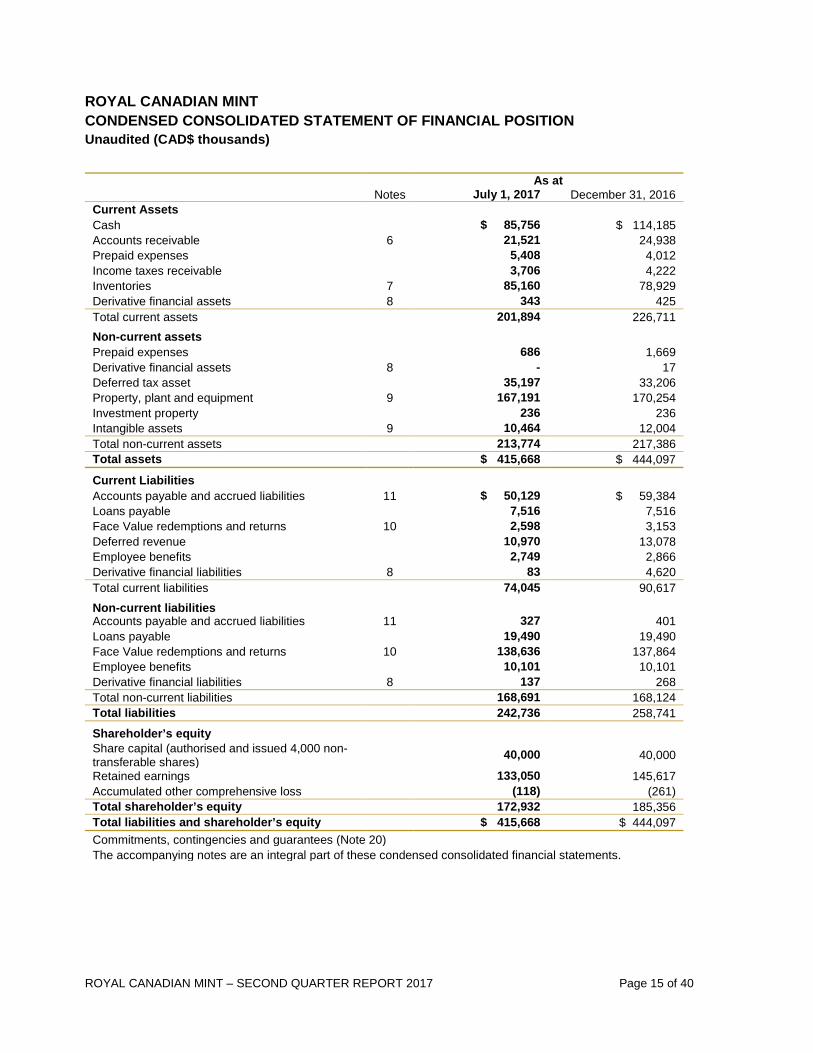
ROYAL CANADIAN MINT CONDENSED CONSOLIDATED STATEMENT OF FINANCIAL POSITION Unaudited (CAD$ thousands)
As at Notes July 1, 2017 December 31, 2016 Current Assets Cash $ 85,756 $ 114,185 Accounts receivable 6 21,521 24,938 Prepaid expenses 5,408 4,012 Income taxes receivable 3,706 4,222 Inventories 7 85,160 78,929 Derivative financial assets 8 343 425 Total current assets 201,894 226,711 Non-current assets Prepaid expenses 686 1,669 Derivative financial assets 8 - 17 Deferred tax asset 35,197 33,206 Property, plant and equipment 9 167,191 170,254 Investment property 236 236 Intangible assets 9 10,464 12,004 Total non-current assets 213,774 217,386 Total assets $ 415,668 $ 444,097 Current Liabilities Accounts payable and accrued liabilities 11 $ 50,129 $ 59,384 Loans payable 7,516 7,516 Face Value redemptions and returns 10 2,598 3,153 Deferred revenue 10,970 13,078 Employee benefits 2,749 2,866 Derivative financial liabilities 8 83 4,620 Total current liabilities 74,045 90,617 Non-current liabilities Accounts payable and accrued liabilities 11 327 401 Loans payable 19,490 19,490 Face Value redemptions and returns 10 138,636 137,864 Employee benefits 10,101 10,101 Derivative financial liabilities 8 137 268 Total non-current liabilities 168,691 168,124 Total liabilities 242,736 258,741 Shareholder’s equity Share capital (authorised and issued 4,000 non-transferable shares)
40,000 40,000
Retained earnings 133,050 145,617 Accumulated other comprehensive loss (118) (261) Total shareholder’s equity 172,932 185,356 Total liabilities and shareholder’s equity $ 415,668 $ 444,097 Commitments, contingencies and guarantees (Note 20) The accompanying notes are an integral part of these condensed consolidated financial statements.

ROYAL CANADIAN MINT – SECOND QUARTER REPORT 2017 Page 16 of 40
ROYAL CANADIAN MINT CONDENSED CONSOLIDATED STATEMENT OF COMPREHENSIVE INCOME Unaudited (CAD$ thousands)
13 weeks ended 26 weeks ended Notes July 1, 2017 July 2, 2016
Restated (Note 3)
July 1, 2017 July 2, 2016 Restated (Note 3)
Revenue 13 $ 401,621 $ 610,133 $ 904,370 $ 1,198,548 Cost of sales 14,15 361,816 560,487 814,113 1,102,103 Gross profit 39,805 49,646 90,257 96,445
Marketing and sales expenses 14,15 18,186 22,409 34,855 39,797 Administration expenses 14,15,16 17,013 14,927 34,171 29,621 Operating expenses 35,199 37,336 69,026 69,418
Net foreign exchange (losses) gains
(557) 1,533 (2,324) 1,780
Operating profit 4,049 13,843 18,907 28,807 Finance income (costs), net 164 (75) 157 (92) Other Income 223 220 223 220 Profit before income tax 4,436 13,988 19,287 28,935 Income tax recovery (expense) 17 883 (3,510) (2,854) (7,233) Profit for the period 5,319 10,478 16,433 21,702
Items that will be reclassified subsequently to profit or loss:
Net unrealized gains on cash flow hedges 126 313 143 3,276 Reclassification of net realized losses on cash flow hedges transferred from other
- (338) - (117)
Other comprehensive income (loss), net of tax 126 (25) 143 3,159 Total comprehensive income $ 5,445 $ 10,453 $ 16,576 $ 24,861 The accompanying notes are an integral part of these condensed consolidated financial statements.
ROYAL CANADIAN MINT – SECOND QUARTER REPORT 2017 Page 17 of 40
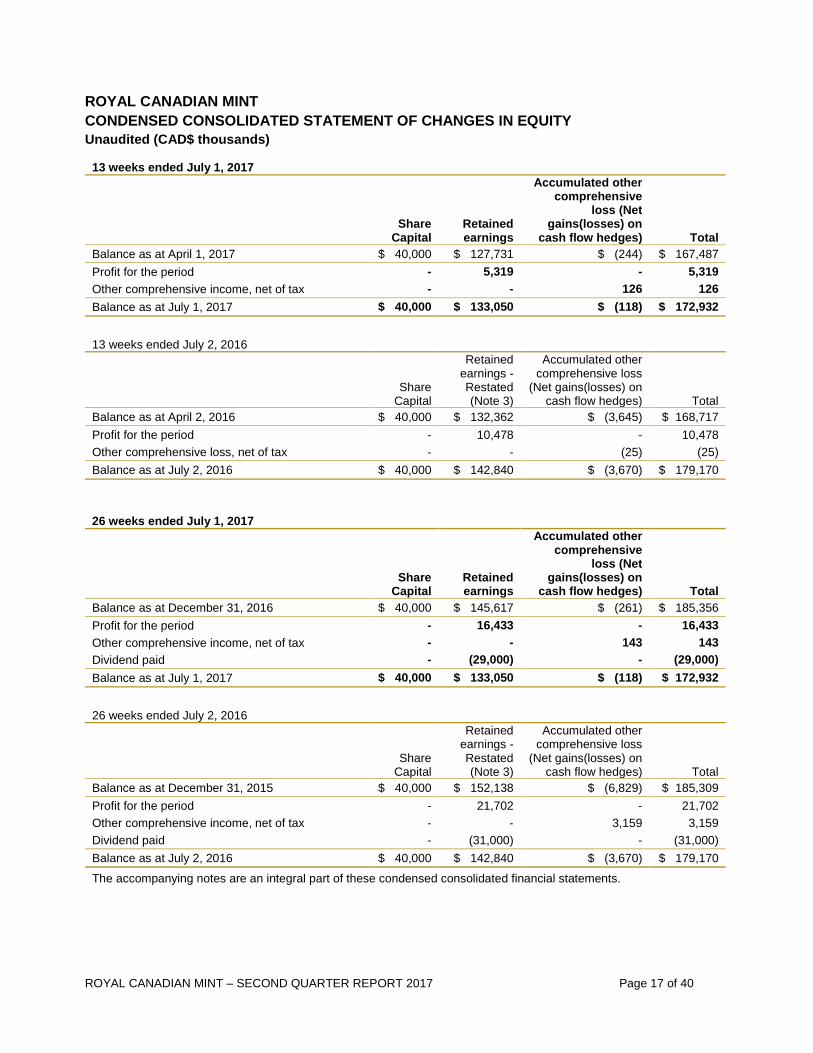
ROYAL CANADIAN MINT CONDENSED CONSOLIDATED STATEMENT OF CHANGES IN EQUITY Unaudited (CAD$ thousands)
13 weeks ended July 1, 2017
Share
Capital Retained earnings
Accumulated other comprehensive
loss (Net gains(losses) on
cash flow hedges) Total Balance as at April 1, 2017 $ 40,000 $ 127,731 $ (244) $ 167,487 Profit for the period - 5,319 - 5,319 Other comprehensive income, net of tax - - 126 126 Balance as at July 1, 2017 $ 40,000 $ 133,050 $ (118) $ 172,932
13 weeks ended July 2, 2016
Share
Capital
Retained earnings - Restated (Note 3)
Accumulated other comprehensive loss
(Net gains(losses) on cash flow hedges) Total
Balance as at April 2, 2016 $ 40,000 $ 132,362 $ (3,645) $ 168,717 Profit for the period - 10,478 - 10,478 Other comprehensive loss, net of tax - - (25) (25) Balance as at July 2, 2016 $ 40,000 $ 142,840 $ (3,670) $ 179,170
26 weeks ended July 1, 2017
Share
Capital Retained earnings
Accumulated other comprehensive
loss (Net gains(losses) on
cash flow hedges) Total Balance as at December 31, 2016 $ 40,000 $ 145,617 $ (261) $ 185,356 Profit for the period - 16,433 - 16,433 Other comprehensive income, net of tax - - 143 143 Dividend paid - (29,000) - (29,000) Balance as at July 1, 2017 $ 40,000 $ 133,050 $ (118) $ 172,932
26 weeks ended July 2, 2016
Share
Capital
Retained earnings - Restated (Note 3)
Accumulated other comprehensive loss
(Net gains(losses) on cash flow hedges) Total
Balance as at December 31, 2015 $ 40,000 $ 152,138 $ (6,829) $ 185,309 Profit for the period - 21,702 - 21,702 Other comprehensive income, net of tax - - 3,159 3,159 Dividend paid - (31,000) - (31,000) Balance as at July 2, 2016 $ 40,000 $ 142,840 $ (3,670) $ 179,170
The accompanying notes are an integral part of these condensed consolidated financial statements.
ROYAL CANADIAN MINT – SECOND QUARTER REPORT 2017 Page 18 of 40
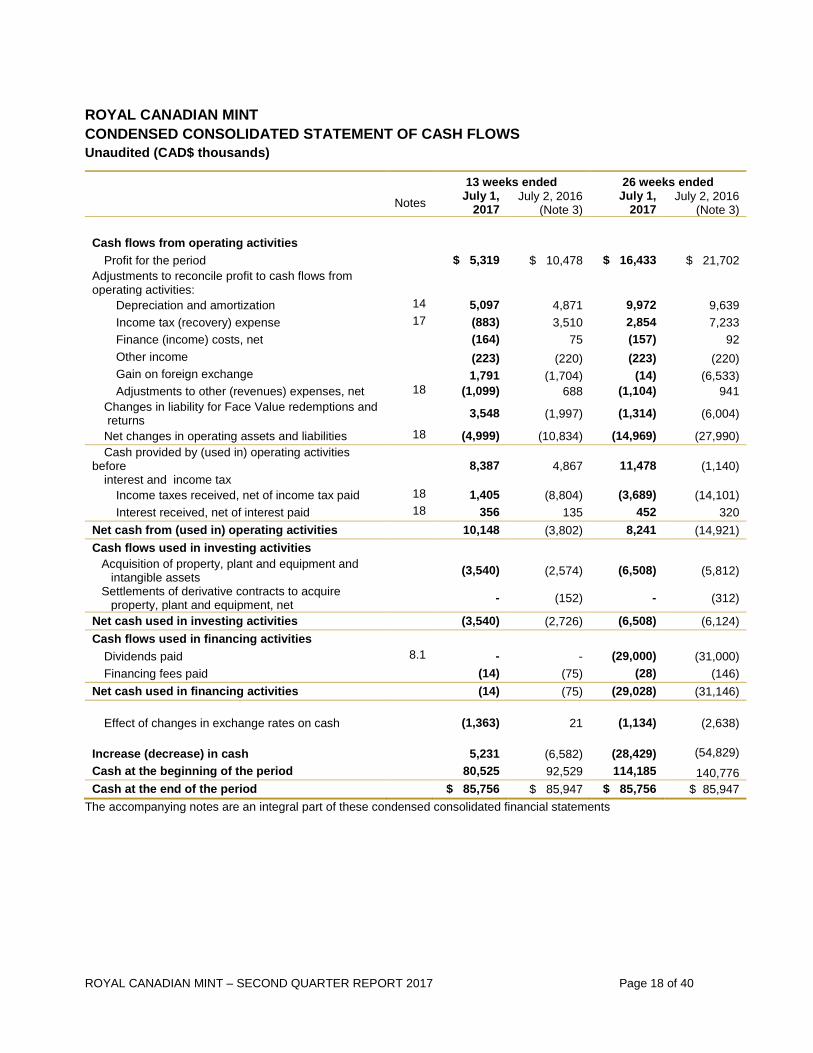
ROYAL CANADIAN MINT CONDENSED CONSOLIDATED STATEMENT OF CASH FLOWS Unaudited (CAD$ thousands)
13 weeks ended 26 weeks ended
Notes July 1, 2017
July 2, 2016 (Note 3)
July 1, 2017
July 2, 2016 (Note 3)
Cash flows from operating activities
Profit for the period $ 5,319 $ 10,478 $ 16,433 $ 21,702 Adjustments to reconcile profit to cash flows from operating activities:
Depreciation and amortization 14 5,097 4,871 9,972 9,639 Income tax (recovery) expense 17 (883) 3,510 2,854 7,233 Finance (income) costs, net (164) 75 (157) 92 Other income (223) (220) (223) (220) Gain on foreign exchange 1,791 (1,704) (14) (6,533) Adjustments to other (revenues) expenses, net 18 (1,099) 688 (1,104) 941
Changes in liability for Face Value redemptions and returns
3,548 (1,997) (1,314) (6,004)
Net changes in operating assets and liabilities 18 (4,999) (10,834) (14,969) (27,990) Cash provided by (used in) operating activities
before interest and income tax
8,387 4,867 11,478 (1,140)
Income taxes received, net of income tax paid 18 1,405 (8,804) (3,689) (14,101) Interest received, net of interest paid 18 356 135 452 320
Net cash from (used in) operating activities 10,148 (3,802) 8,241 (14,921) Cash flows used in investing activities
Acquisition of property, plant and equipment and intangible assets
(3,540) (2,574) (6,508) (5,812)
Settlements of derivative contracts to acquire property, plant and equipment, net
- (152) - (312)
Net cash used in investing activities (3,540) (2,726) (6,508) (6,124) Cash flows used in financing activities
Dividends paid 8.1 - - (29,000) (31,000) Financing fees paid (14) (75) (28) (146)
Net cash used in financing activities (14) (75) (29,028) (31,146)
Effect of changes in exchange rates on cash (1,363) 21 (1,134) (2,638) Increase (decrease) in cash 5,231 (6,582) (28,429) (54,829) Cash at the beginning of the period 80,525 92,529 114,185 140,776 Cash at the end of the period $ 85,756 $ 85,947 $ 85,756 $ 85,947
The accompanying notes are an integral part of these condensed consolidated financial statements
R O YA L C A N A D I A N M I NT N OT E S T O T H E C O ND E N S E D C O N S O L I DA T E D F I N A N C I A L ST A T E M E NT S 2 6 W E E K S E N D E D JU L Y 1 , 2 0 1 7 (Unaudited) (In thousands of Canadian dollars, unless otherwise indicated)
ROYAL CANADIAN MINT – SECOND QUARTER REPORT 2017 Page 19 of 40
1. NATURE AND DESCRIPTION OF THE CORPORATION
The Royal Canadian Mint (the “Mint” or the “Corporation”) was incorporated in 1969 by the Royal Canadian Mint Act to mint coins and carry out other related activities. The Corporation is an agent corporation of Her Majesty named in Part II of Schedule III to the Financial Administration Act. It produces all of the circulation coins used in Canada and manages the support distribution system for the Government of Canada.
On December 15, 2016, Bill C-29, Budget Implementation Act 2016, no. 2, A Second Act to implement certain provisions of the budget tabled in Parliament on March 22, 2016 and other measures, received Royal assent. In particular, this Act amends the Royal Canadian Mint Act to clarify the Corporation’s powers, and to enable the Corporation to anticipate profit with respect to the provision of all goods or services, and removes the restriction that the Corporation shall not anticipate profit with respect to the provision of any goods or services to Her Majesty in right of Canada.
The Corporation also produces circulation, collector and bullion investment coins for the domestic and international marketplace, and it is also a gold refiner. The addresses of its registered office and principal place of business are 320 Sussex Drive, Ottawa, Ontario, Canada, K1A 0G8 and 520 Lagimodière Blvd, Winnipeg, Manitoba, Canada, R2J 3E7.
In 2002, the Corporation incorporated RCMH-MRCF Inc., a wholly-owned subsidiary. RCMH-MRCF Inc. has been operationally inactive since December 31, 2008.
The Corporation is a prescribed federal Crown corporation for tax purposes and is subject to federal income taxes under the Income Tax Act.
While not subject to United States of America federal income taxes, the Corporation is subject in some states to state income taxes.
2. BASIS OF PRESENTATION
2.1 Statement of Compliance
These quarterly condensed consolidated financial statements have been prepared in accordance with IAS 34 Interim Financial Reporting (“IAS 34”) of the International Financial Reporting Standards (“IFRS”) and the Standard on Quarterly Financial Reports for Crown Corporations issued by the Treasury Board of Canada. As permitted under these standards, these quarterly condensed consolidated financial statements do not include all of the disclosure requirements for annual consolidated financial statements, and should be read in conjunction with the Corporation’s audited consolidated financial statements for its fiscal year ended December 31, 2016.
R O YA L C A N A D I A N M I NT N OT E S T O T H E C O ND E N S E D C O N S O L I DA T E D F I N A N C I A L ST A T E M E NT S 2 6 W E E K S E N D E D JU L Y 1 , 2 0 1 7 (Unaudited) (In thousands of Canadian dollars, unless otherwise indicated)
ROYAL CANADIAN MINT – SECOND QUARTER REPORT 2017 Page 20 of 40
These quarterly condensed consolidated financial statements have not been audited or reviewed by an external auditor.
These quarterly condensed consolidated financial statements have been approved for public release by the Board of Directors of the Corporation on August 15, 2017.
2.2 Basis of presentation
The quarterly condensed consolidated financial statements were prepared in accordance with IFRS.
Although the Corporation’s year end of December 31 matches the calendar year end, the Corporation’s quarter end dates do not necessarily coincide with calendar year quarters; instead, each of the Corporation’s quarters contains 13 weeks.
2.3 Consolidation
The quarterly condensed consolidated financial statements incorporate the quarterly financial statements of the Corporation and its wholly-owned subsidiary. The subsidiary’s accounting policies are in line with those used by the Corporation. All intercompany transactions, balances, income and expenses are eliminated in full on consolidation.
2.4 Foreign currency translation
Unless otherwise stated, all figures reported in the quarterly condensed consolidated financial statements and disclosures are reflected in thousands of Canadian dollars (CAD$), which is the functional currency of the Corporation.
2.5 Significant accounting policies
Significant accounting policies applied in these quarterly condensed consolidated financial statements are disclosed in Note 2 of the Corporation’s annual consolidated financial statements for the year ended December 31, 2016. The accounting policies have been applied consistently in the current and comparative periods.
3. RESTATEMENT AND RECLASSIFICATION OF PRIOR PERIODS
Restatement of prior periods relating to numismatic Face Value products
In the course of the preparation of the quarterly condensed consolidated financial statements for the quarter ended October 1, 2016 (Q3 2016), the Corporation identified an adjustment relating to prior periods requiring restatement, relating to the sale of numismatic Face Value products.

R O YA L C A N A D I A N M I NT N OT E S T O T H E C O ND E N S E D C O N S O L I DA T E D F I N A N C I A L ST A T E M E NT S 2 6 W E E K S E N D E D JU L Y 1 , 2 0 1 7 (Unaudited) (In thousands of Canadian dollars, unless otherwise indicated)
ROYAL CANADIAN MINT – SECOND QUARTER REPORT 2017 Page 21 of 40
In the past, sales of numismatic Face Value products were recorded as revenue, along with a liability for expected redemptions and returns which was based on historical redemption and return patterns for other numismatic products. In 2016, the Corporation conducted an extensive review of the Face Value program and redemptions and returns to date. Face Value products have different characteristics than other numismatic products as they have a Face Value equal to their purchase price, which combined with the unlimited redemption and return period permitted by the Corporation’s current redemption and return policies and practices, make Face Value products significantly more likely to be redeemed or returned than other numismatic products. Consequently, in the Corporation’s view, the historical redemption and return patterns for other numismatic products cannot be used to estimate the redemptions and returns for Face Value products and no reasonable, reliable alternative method exists.
As a result of this review, it was determined that revenue should not be recognized until a reasonable estimate of redemptions and returns can be made. A liability representing the cumulative value of unredeemed/unreturned Face Value products and the costs of redemptions and returns, net of the value of the corresponding silver content, has been recorded with retrospective adjustment to the inception of the Face Value program.
The condensed consolidated financial statements for the 13 weeks and 26 weeks ended July 2, 2016 have been restated to reflect this change in accounting. For more information on the measurement of the liability for Face Value redemptions and returns refer to Notes 3 and 4 of the Corporation’s audited consolidated financial statements for the year ended December 31, 2016.
Reclassification of prior periods
Presentation of revenue and cost of sales relating to bullion products
Historically, all of the revenue associated with bullion product sales was recorded on a gross basis; however there are several different sales streams for bullion products. In Q3 2016, the Corporation initiated a review of the different bullion sales transaction types during which it was determined that it was more appropriate to present revenue from bullion sales on a net basis when the transaction involves inventory that a customer has on deposit with the Corporation to create a product for them of a different format, for instance, a Gold Maple Leaf. As a result, the revenue and cost of precious metals from Bullion sale transactions involving customer inventory on deposit with the Corporation (“Customer inventory deals”) are now presented on a net basis, with only the commission and incremental value-added manufacturing services continuing to be recognized as revenue. This change in presentation has no impact on profit (loss).
The condensed consolidated statement of comprehensive income (loss) for the 13 weeks and 26 weeks ended on July 2, 2016 has been adjusted to reflect this change in the presentation of revenue and cost of sales.

R O YA L C A N A D I A N M I NT N OT E S T O T H E C O ND E N S E D C O N S O L I DA T E D F I N A N C I A L ST A T E M E NT S 2 6 W E E K S E N D E D JU L Y 1 , 2 0 1 7 (Unaudited) (In thousands of Canadian dollars, unless otherwise indicated)
ROYAL CANADIAN MINT – SECOND QUARTER REPORT 2017 Page 22 of 40
Other reclassifications
During the second quarter of 2017, the Corporation modified the condensed consolidated statement of comprehensive income classification for certain amounts between revenue and net foreign exchange gain or losses to more appropriately reflect their nature.
The following tables show the combined impact of the restatement and reclassifications on the 13 weeks and 26 weeks ended July 2, 2016:
13 weeks ended July 2, 2016
As previously
reported Face Value restatement
Customer inventory deals reclassification
Other reclassifications As revised
Revenue $ 761,978 $ (7,318) $ (144,583) $ 56 $ 610,133
Cost of sales
714,384
(9,314)
(144,583) -
560,487
Net foreign exchange gains (losses)
1,665
(76)
- (56)
1,533
Income tax expense
(3,031)
(479)
- -
(3,510)
Profit for the period
9,037
1,441
- -
10,478 26 weeks ended July 2, 2016
As previously
reported Face Value restatement
Customer inventory deals reclassification
Other reclassifications As revised
Revenue $ 1,542,900 $ (9,152) $ (335,593) $ 393 $ 1,198,548
Cost of sales
1,452,852
(15,156)
(335,593) -
1,102,103
Net foreign exchange gains (losses)
4,508
(2,335)
-
(393)
1,780
Income tax expense
(6,316)
(917)
- -
(7,233)
Profit for the period
18,949
2,753
- -
21,702
Presentation of the Statement of Cash Flows
For the year ended December 31, 2016, the Corporation changed the presentation of its consolidated statement of cash flows to present the cash flows from operating activities using the indirect method available under IAS 7 – Statement of Cash Flows. Details of this change in

R O YA L C A N A D I A N M I NT N OT E S T O T H E C O ND E N S E D C O N S O L I DA T E D F I N A N C I A L ST A T E M E NT S 2 6 W E E K S E N D E D JU L Y 1 , 2 0 1 7 (Unaudited) (In thousands of Canadian dollars, unless otherwise indicated)
ROYAL CANADIAN MINT – SECOND QUARTER REPORT 2017 Page 23 of 40
presentation are disclosed in Note 3 of the Corporation’s audited consolidated financial statements for the year ended December 31, 2016.
4. KEY SOURCES OF ESTIMATION UNCERTAINTY AND CRITICAL JUDGEMENTS
The preparation of these quarterly condensed consolidated financial statements requires management to make critical judgements, estimates and assumptions that affect the reported amounts of assets and liabilities, disclosure of contingent assets and liabilities and the reported amounts of revenue and expenses during the reporting period.
Actual results may differ significantly from the estimates and assumptions. The estimates and underlying assumptions are reviewed on an ongoing basis. Revisions to accounting estimates are recognized in the period in which the estimate is revised if the revision affects only that period or in the period of the revision and future periods if the revision affects both current and future periods. Significant judgements and estimates as at July 1, 2017 were consistent with those disclosed in Note 4 of the Corporation’s audited consolidated financial statements for the year ended December 31, 2016.
5. APPLICATION OF NEW AND REVISED IFRS
5.1 New and revised IFRS affecting amounts reported and/or disclosed in the consolidated financial statements
There were no new or revised IFRS issued by the International Accounting Standards Board (IASB) that became effective during the 26 weeks ended July 1, 2017 that affected amounts reported or disclosed in the quarterly condensed consolidated financial statements.
5.2 New and revised IFRS pronouncements issued but not yet effective
The Corporation has reviewed the revised accounting pronouncements that have been issued, but are not yet effective.
a) The following amendments are applicable to the Corporation, but their adoption is not expected to have a material impact on the Corporation's consolidated financial statements.
IAS 40 Transfers of Investment Property (“IAS 40”)
An amendment was released in December 2016 to IAS 40 Transfers of Investment Property which states that an entity shall transfer a property to, or from, investment property when, and only when, there is evidence of a change in use. A change of use occurs if the property meets, or ceases to meet, the definition of investment property. A change in management’s intentions for the use of a property by itself does not constitute evidence of a change in use.
R O YA L C A N A D I A N M I NT N OT E S T O T H E C O ND E N S E D C O N S O L I DA T E D F I N A N C I A L ST A T E M E NT S 2 6 W E E K S E N D E D JU L Y 1 , 2 0 1 7 (Unaudited) (In thousands of Canadian dollars, unless otherwise indicated)
ROYAL CANADIAN MINT – SECOND QUARTER REPORT 2017 Page 24 of 40
The list of examples of evidence is now presented as a non-exhaustive list of examples instead of the previous exhaustive list. The amendment is effective for annual periods beginning on or after January 1, 2018.
Annual improvements to IFRSs 2014-2016
In December 2016, the International Accounting Standards Board (IASB) issued annual improvements during the 2014-2016 cycle. The standards covered by the amendments are: IFRS 1 – First adoption of IFRS which deletes the short-term exemptions in paragraphs E3-E7 because they have now served their intended purpose; IAS 28 – Investments in Associates which clarifies the election to measure at fair value through profit or loss an investment in an associate or a joint venture that is held by an entity that is a venture capital organization, or other qualifying entity, is available for each investment in an associate or joint-venture on an investment-by-investment basis, upon initial recognition. The annual improvements for IFRS 1 and IAS 28 are to be applied for annual periods beginning on or after January 1, 2018.
IFRIC 22 – Foreign Currency Transactions and Advance Consideration
The interpretation addresses foreign currency transactions or parts of transactions where: there is consideration that is denominated or priced in a foreign currency; the entity recognizes a prepayment asset or a deferred income liability in respect of that consideration, in advance of the recognition of the related asset, expense or income; and the prepayment asset or deferred income liability is non-monetary. The committee concluded the date of the transaction for the purpose of determining the exchange rate, is the date of initial recognition of the non-monetary prepayment asset or deferred income liability. If there are multiple payments or receipts in advance, a date of transaction is established for each payment or receipt. This interpretation is to be applied to annual reporting periods beginning on or after January 1, 2018.
b) The following new IFRS pronouncements have been assessed as having a possible impact on the Corporation’s consolidated financial statements in the future. The Corporation is currently assessing these new pronouncements and therefore the extent of the impact of their adoption is unknown.
IFRS 15 Revenue from Contracts with Customers (“IFRS 15”)
IFRS 15 was issued in May 2014 and specifies how and when an IFRS reporter will recognize revenue, as well as requiring such entities to provide users of financial statements with more informative, relevant disclosures. The standard supersedes IAS 18 “Revenue’', IAS 11 “Construction Contracts” and a number of revenue-related interpretations. Application of the standard is mandatory for all IFRS reporters and it applies to nearly all contracts with
R O YA L C A N A D I A N M I NT N OT E S T O T H E C O ND E N S E D C O N S O L I DA T E D F I N A N C I A L ST A T E M E NT S 2 6 W E E K S E N D E D JU L Y 1 , 2 0 1 7 (Unaudited) (In thousands of Canadian dollars, unless otherwise indicated)
ROYAL CANADIAN MINT – SECOND QUARTER REPORT 2017 Page 25 of 40
customers: the main exceptions are leases, financial instruments and insurance contracts. IFRS 15 is effective for annual periods beginning on or after January 1, 2018. Entities can elect to use either a full or modified retrospective approach when adopting this standard. The Corporation is currently evaluating the impact of IFRS 15 on its consolidated financial statements.
IFRS 16 Leases (“IFRS 16”)
IFRS 16 was issued in January 2016 to replace IAS 17 Leases. The new standard requires that leases be brought onto companies’ balance sheets, increasing the visibility of their assets and liabilities. IFRS 16 removes the classification of leases for lessees as either operating leases or finance leases, treating all leases as finance leases. Short-term leases (less than 12 months) and leases of low-value assets (such as personal computers) will have an optional exemption from the requirements. For lessors, IFRS 16 substantially carries forward the requirements of IAS 17 Leases. The new standard is effective for annual periods beginning on or after January 1, 2019. Early adoption is permitted (as long as the recently issued revenue Standard, IFRS 15 Revenue from Contracts with Customers is also adopted). Entities can elect to use either a retrospective approach with a restatement of comparative information or a retrospective approach with the cumulative effect of initial application shown in retained earnings instead of the restatement of the comparative information. The Corporation is currently evaluating the impact of IFRS 16 on its consolidated financial statements.
IFRS 7 Financial Instruments: Disclosures (“IFRS 7”)
An amendment was released in December 2011 to IFRS 7 regarding requiring disclosures about the initial application of IFRS 9 which has an effective date of January 1, 2018. The amendments are to be applied retrospectively.
An additional amendment was released in November 2013 to IFRS 7 regarding additional hedge accounting disclosures resulting from the introduction of the hedge accounting section of IFRS 9 which has an effective date of January 1, 2018. The amendments are to be applied retrospectively. The Corporation is currently evaluating the impact of IFRS 7 on its consolidated financial statements.
IFRS 9 Financial Instruments (“IFRS 9”)
In July 2014, the IASB issued the final version of IFRS 9, which incorporates the classification and measurement, impairment and hedge accounting phases of the project to replace the existing standards under IAS 39 “Financial Instruments: Recognition and Measurement”. The new IFRS 9 standard is effective for annual periods beginning on or after January 1, 2018
R O YA L C A N A D I A N M I NT N OT E S T O T H E C O ND E N S E D C O N S O L I DA T E D F I N A N C I A L ST A T E M E NT S 2 6 W E E K S E N D E D JU L Y 1 , 2 0 1 7 (Unaudited) (In thousands of Canadian dollars, unless otherwise indicated)
ROYAL CANADIAN MINT – SECOND QUARTER REPORT 2017 Page 26 of 40
and is to be applied retrospectively. The Corporation is currently evaluating the impact of IFRS 9 on its consolidated financial statements.
6. ACCOUNTS RECEIVABLE
As at July 1, 2017 December 31, 2016 Trade receivables and accruals $ 14,792 $ 20,029 Trade receivables due from related parties (Note 19) 6,100 3,167 Allowance for doubtful accounts (33) (47) Net trade receivables 20,859 23,149 Other current financial receivables 109 851 Other receivables 553 938 Total accounts receivable $ 21,521 $ 24,938
The Corporation does not hold any collateral in respect of trade and other receivables.
7. INVENTORIES As at July 1, 2017 December 31, 2016 Total inventories $ 85,160 $ 78,929
The Corporation recognized for the 26 weeks ended July 1, 2017 $2.6 million (26 weeks ended July 2, 2016 - $2.9 million) of write-downs of inventory to net realizable value.
8. FINANCIAL INSTRUMENTS AND FINANCIAL RISK MANAGEMENT
8.1 Capital Risk management
The Corporation may borrow money from the Consolidated Revenue Fund or any other source, subject to the approval of the Minister of Finance with respect to the time and terms and conditions. Since March 1999, following the enactment of changes to the Royal Canadian Mint Act, the aggregate of the amounts loaned to the Corporation and outstanding at any time shall not exceed $75 million. For the 26 weeks ended July 1, 2017, approved short-term borrowings for specified working capital needs within this limit, were not to exceed $25.0 million (26 weeks ended July 2, 2016 - $25.0 million) or its US Dollar equivalent.
To support such short-term borrowings, as may be required from time to time, the Corporation has various commercial borrowing lines of credit made available to it by Canadian financial institutions. These lines are unsecured and provide for borrowings up to 364 days in term based on negotiated rates. No amounts were borrowed under these lines of credit as at July 1, 2017 or July 2, 2016.
R O YA L C A N A D I A N M I NT N OT E S T O T H E C O ND E N S E D C O N S O L I DA T E D F I N A N C I A L ST A T E M E NT S 2 6 W E E K S E N D E D JU L Y 1 , 2 0 1 7 (Unaudited) (In thousands of Canadian dollars, unless otherwise indicated)
ROYAL CANADIAN MINT – SECOND QUARTER REPORT 2017 Page 27 of 40
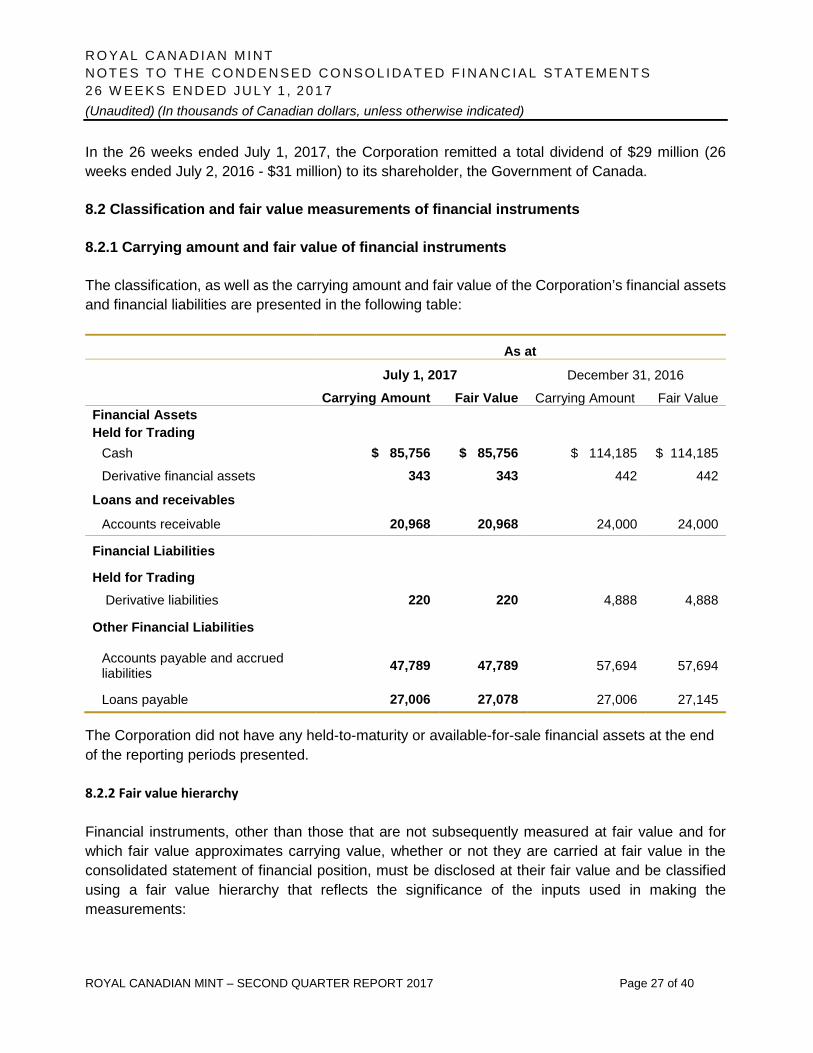
In the 26 weeks ended July 1, 2017, the Corporation remitted a total dividend of $29 million (26 weeks ended July 2, 2016 - $31 million) to its shareholder, the Government of Canada.
8.2 Classification and fair value measurements of financial instruments
8.2.1 Carrying amount and fair value of financial instruments
The classification, as well as the carrying amount and fair value of the Corporation’s financial assets and financial liabilities are presented in the following table:
As at
July 1, 2017 December 31, 2016
Carrying Amount Fair Value Carrying Amount Fair Value Financial Assets Held for Trading
Cash $ 85,756 $ 85,756 $ 114,185 $ 114,185
Derivative financial assets 343 343 442 442
Loans and receivables
Accounts receivable 20,968 20,968 24,000 24,000
Financial Liabilities
Held for Trading
Derivative liabilities 220 220 4,888 4,888
Other Financial Liabilities
Accounts payable and accrued liabilities 47,789 47,789 57,694 57,694
Loans payable 27,006 27,078 27,006 27,145
The Corporation did not have any held-to-maturity or available-for-sale financial assets at the end of the reporting periods presented.
8.2.2 Fair value hierarchy
Financial instruments, other than those that are not subsequently measured at fair value and for which fair value approximates carrying value, whether or not they are carried at fair value in the consolidated statement of financial position, must be disclosed at their fair value and be classified using a fair value hierarchy that reflects the significance of the inputs used in making the measurements:
R O YA L C A N A D I A N M I NT N OT E S T O T H E C O ND E N S E D C O N S O L I DA T E D F I N A N C I A L ST A T E M E NT S 2 6 W E E K S E N D E D JU L Y 1 , 2 0 1 7 (Unaudited) (In thousands of Canadian dollars, unless otherwise indicated)
ROYAL CANADIAN MINT – SECOND QUARTER REPORT 2017 Page 28 of 40
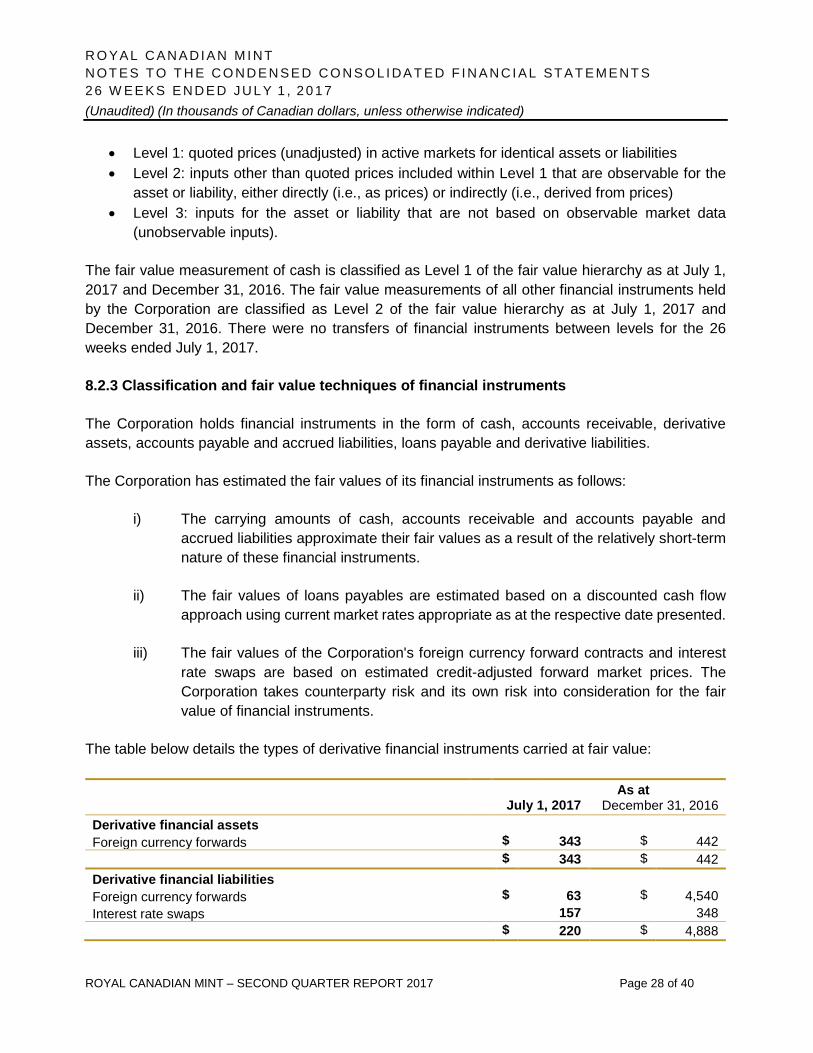
• Level 1: quoted prices (unadjusted) in active markets for identical assets or liabilities • Level 2: inputs other than quoted prices included within Level 1 that are observable for the
asset or liability, either directly (i.e., as prices) or indirectly (i.e., derived from prices) • Level 3: inputs for the asset or liability that are not based on observable market data
(unobservable inputs).
The fair value measurement of cash is classified as Level 1 of the fair value hierarchy as at July 1, 2017 and December 31, 2016. The fair value measurements of all other financial instruments held by the Corporation are classified as Level 2 of the fair value hierarchy as at July 1, 2017 and December 31, 2016. There were no transfers of financial instruments between levels for the 26 weeks ended July 1, 2017.
8.2.3 Classification and fair value techniques of financial instruments
The Corporation holds financial instruments in the form of cash, accounts receivable, derivative assets, accounts payable and accrued liabilities, loans payable and derivative liabilities.
The Corporation has estimated the fair values of its financial instruments as follows:
i) The carrying amounts of cash, accounts receivable and accounts payable and accrued liabilities approximate their fair values as a result of the relatively short-term nature of these financial instruments.
ii) The fair values of loans payables are estimated based on a discounted cash flow approach using current market rates appropriate as at the respective date presented.
iii) The fair values of the Corporation's foreign currency forward contracts and interest rate swaps are based on estimated credit-adjusted forward market prices. The Corporation takes counterparty risk and its own risk into consideration for the fair value of financial instruments.
The table below details the types of derivative financial instruments carried at fair value:
As at July 1, 2017 December 31, 2016 Derivative financial assets Foreign currency forwards $ 343 $ 442 $ 343 $ 442 Derivative financial liabilities
Foreign currency forwards $ 63 $ 4,540 Interest rate swaps 157 348 $ 220 $ 4,888

R O YA L C A N A D I A N M I NT N OT E S T O T H E C O ND E N S E D C O N S O L I DA T E D F I N A N C I A L ST A T E M E NT S 2 6 W E E K S E N D E D JU L Y 1 , 2 0 1 7 (Unaudited) (In thousands of Canadian dollars, unless otherwise indicated)
ROYAL CANADIAN MINT – SECOND QUARTER REPORT 2017 Page 29 of 40
8.3 Financial risk management objectives and framework
The Corporation is exposed to credit risk, liquidity risk and market risk from its use of financial instruments.
The Board of Directors has overall responsibility for the establishment and oversight of the Corporation’s risk management framework. The Audit Committee assists the Board of Directors and is responsible for the review, approval and monitoring of the Corporation’s financial risk management policies. The Audit Committee reports regularly to the Board of Directors on its activities.
8.3.1 Credit risk management
Credit risk is the risk of financial loss to the Corporation if a customer or counterparty to a financial instrument fails to meet its contractual obligations, and arises principally from the Corporation’s receivables from customers, cash and derivative instruments. The Corporation has adopted a policy of only dealing with creditworthy counterparties as a means of mitigating the risk of financial loss from defaults. The Corporation’s exposure and the credit ratings of its counterparties are continuously monitored.
The carrying amount of financial assets recorded in the quarterly condensed consolidated financial statements as at July 1, 2017 and December 31, 2016 represents the maximum credit exposure.
8.3.2 Liquidity risk
Liquidity risk is the risk that the Corporation will not be able to meet its financial obligations as they fall due. The Corporation manages liquidity risk by continuously monitoring actual and forecasted cash flows to ensure, as far as possible, that it will always have sufficient liquidity to meet its liabilities when due, under both normal and stressed conditions, without incurring unacceptable losses or risking damage to the Corporation’s reputation.
8.3.3 Market risk
Market risk is the risk that changes in market prices, such as foreign exchange rates, interest rates or commodity price changes will affect the Corporation's income or the fair value of its financial instruments.
The Corporation uses, from time to time, derivative instruments, such as foreign currency forward contracts, interest rate exchange agreements and commodity swap and forward contracts to manage the Corporation’s exposure to fluctuations in cash flows resulting from foreign exchange risk, interest rate risk and commodity price risk. The Corporation buys and sells derivatives in the ordinary course of business and all such transactions are carried out within the guidelines set out in

R O YA L C A N A D I A N M I NT N OT E S T O T H E C O ND E N S E D C O N S O L I DA T E D F I N A N C I A L ST A T E M E NT S 2 6 W E E K S E N D E D JU L Y 1 , 2 0 1 7 (Unaudited) (In thousands of Canadian dollars, unless otherwise indicated)
ROYAL CANADIAN MINT – SECOND QUARTER REPORT 2017 Page 30 of 40
established policies. The Corporation’s policy is not to enter into derivative instruments for trading or speculative purposes.
Foreign exchange risk
The Corporation is exposed to foreign exchange risk on sales and purchase transactions that are denominated in foreign currencies, primarily including US dollars and Euros. The Corporation manages its exposure to exchange rate fluctuations between the foreign currency and the Canadian dollar by entering into foreign currency forward contracts and by applying hedge accounting to certain qualifying contracts to minimize the volatility to profit or loss. As of December 31, 2016, the Corporation is no longer applying hedge accounting to foreign currency forward contracts. The Corporation also uses such contracts in the process of managing its overall cash requirements.
Interest rate risk
Financial assets and financial liabilities with variable interest rates expose the Corporation to cash flow interest rate risk. There is no interest rate risk related to cash as there are no short-term investments as at the dates presented. The Corporation’s Bankers Acceptance interest rate swap loan instruments expose the Corporation to cash flow interest rate risk. The Corporation has fully hedged the exposure to fluctuations in interest rates related to these instruments by entering into corresponding interest rate swaps, where the Corporation pays a fixed interest rate in exchange for receiving a floating interest rate. The interest rate swaps are designated as hedging instruments under the cash flow hedge accounting model.
Financial assets and financial liabilities that bear interest at fixed rates are subject to fair value interest rate risk. The Corporation does not account for its fixed rate debt instruments as held for trading; therefore, a change in interest rates at the reporting date would not affect profit or loss with respect to these fixed rate instruments. The Corporation’s interest rate swaps expose the Corporation to fair value interest rate risk.
Commodity price risk
The Corporation purchases precious metals for use in bullion and numismatic coins, as well as base metals and alloys in the production of domestic and foreign circulation coins. Exposure to volatility in metal prices is mitigated by matching the timing of purchase and sales, contractually transferring price risk to suppliers, hedging strategies and/or natural hedges inherent in business activities. The impact of commodity price risk fluctuation on the condensed consolidated financial statements is not material.

R O YA L C A N A D I A N M I NT N OT E S T O T H E C O ND E N S E D C O N S O L I DA T E D F I N A N C I A L ST A T E M E NT S 2 6 W E E K S E N D E D JU L Y 1 , 2 0 1 7 (Unaudited) (In thousands of Canadian dollars, unless otherwise indicated)
ROYAL CANADIAN MINT – SECOND QUARTER REPORT 2017 Page 31 of 40
9. CAPITAL ASSETS
Property, plant and equipment
The composition of the net book value of the Corporation’s property, plant and equipment, is presented in the following tables:
As at July 1, 2017 December 31, 2016 Cost $ 422,432 $ 417,266 Accumulated depreciation (255,241) (247,012) Net book value $ 167,191 $ 170,254
Net book value by asset class
Land and land improvements $ 3,074 $ 3,075 Buildings and improvements 91,789 91,109 Equipment 69,419 73,775 Capital projects in process 2,909 2,295
Net book value $ 167,191 $ 170,254
During the 26 weeks ended July 1, 2017, the Corporation acquired $5.2 million (26 weeks ended July 2, 2016 - $3.8 million) worth of capital improvement/equipment. No capital assets have been transferred to different categories within Property, plant and equipment.
Included in capital additions for the 26 weeks ended July 1, 2017 is a total accrual of $0.2 million (26 weeks ended July 2, 2016 - $0.6 million).
Property, plant and equipment are carried at cost less accumulated depreciation and accumulated impairment losses.
No asset is pledged as security for borrowings as at July 1, 2017.
Intangible assets
As at
July 1, 2017 December 31, 2016 Cost $ 30,875 $ 30,678 Accumulated depreciation (20,411) (18,674) Net book value $ 10,464 $ 12,004
During the 26 weeks ended July 1, 2017, the Corporation acquired $0.2 million (26 weeks ended July 2, 2016 - $0.9 million) worth of software. No capital assets have been transferred to different categories within Intangible assets.
R O YA L C A N A D I A N M I NT N OT E S T O T H E C O ND E N S E D C O N S O L I DA T E D F I N A N C I A L ST A T E M E NT S 2 6 W E E K S E N D E D JU L Y 1 , 2 0 1 7 (Unaudited) (In thousands of Canadian dollars, unless otherwise indicated)
ROYAL CANADIAN MINT – SECOND QUARTER REPORT 2017 Page 32 of 40
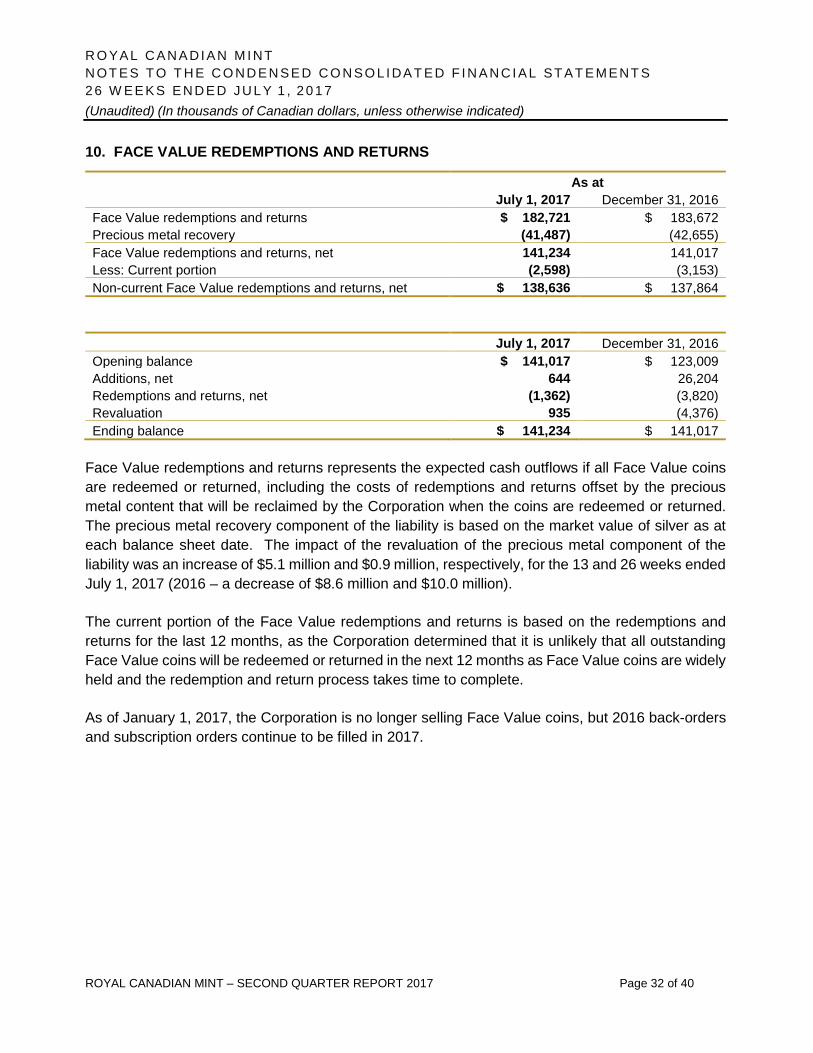
10. FACE VALUE REDEMPTIONS AND RETURNS
As at July 1, 2017 December 31, 2016 Face Value redemptions and returns $ 182,721 $ 183,672 Precious metal recovery (41,487) (42,655) Face Value redemptions and returns, net 141,234 141,017 Less: Current portion (2,598) (3,153) Non-current Face Value redemptions and returns, net $ 138,636 $ 137,864 July 1, 2017 December 31, 2016 Opening balance $ 141,017 $ 123,009 Additions, net 644 26,204 Redemptions and returns, net (1,362) (3,820) Revaluation 935 (4,376) Ending balance $ 141,234 $ 141,017
Face Value redemptions and returns represents the expected cash outflows if all Face Value coins are redeemed or returned, including the costs of redemptions and returns offset by the precious metal content that will be reclaimed by the Corporation when the coins are redeemed or returned. The precious metal recovery component of the liability is based on the market value of silver as at each balance sheet date. The impact of the revaluation of the precious metal component of the liability was an increase of $5.1 million and $0.9 million, respectively, for the 13 and 26 weeks ended July 1, 2017 (2016 – a decrease of $8.6 million and $10.0 million).
The current portion of the Face Value redemptions and returns is based on the redemptions and returns for the last 12 months, as the Corporation determined that it is unlikely that all outstanding Face Value coins will be redeemed or returned in the next 12 months as Face Value coins are widely held and the redemption and return process takes time to complete.
As of January 1, 2017, the Corporation is no longer selling Face Value coins, but 2016 back-orders and subscription orders continue to be filled in 2017.
R O YA L C A N A D I A N M I NT N OT E S T O T H E C O ND E N S E D C O N S O L I DA T E D F I N A N C I A L ST A T E M E NT S 2 6 W E E K S E N D E D JU L Y 1 , 2 0 1 7 (Unaudited) (In thousands of Canadian dollars, unless otherwise indicated)
ROYAL CANADIAN MINT – SECOND QUARTER REPORT 2017 Page 33 of 40
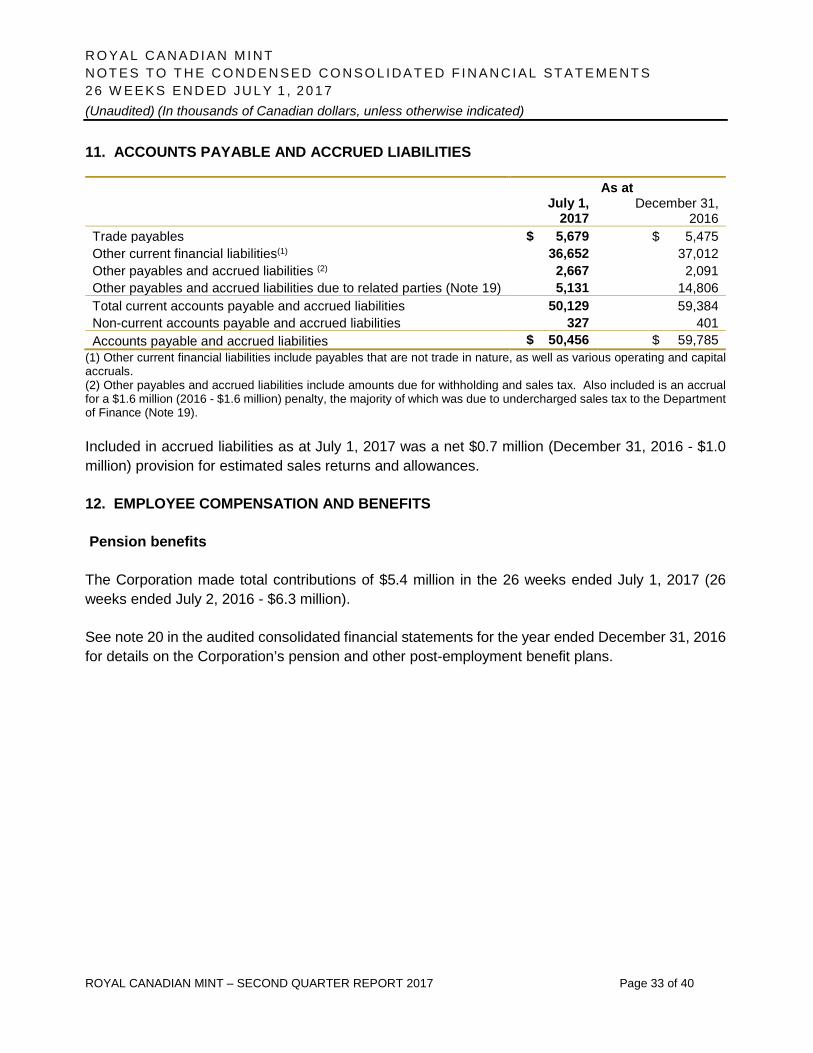
11. ACCOUNTS PAYABLE AND ACCRUED LIABILITIES
As at
July 1,
2017 December 31,
2016 Trade payables $ 5,679 $ 5,475 Other current financial liabilities(1) 36,652 37,012 Other payables and accrued liabilities (2) 2,667 2,091 Other payables and accrued liabilities due to related parties (Note 19) 5,131 14,806 Total current accounts payable and accrued liabilities 50,129 59,384 Non-current accounts payable and accrued liabilities 327 401 Accounts payable and accrued liabilities $ 50,456 $ 59,785
(1) Other current financial liabilities include payables that are not trade in nature, as well as various operating and capital accruals. (2) Other payables and accrued liabilities include amounts due for withholding and sales tax. Also included is an accrual for a $1.6 million (2016 - $1.6 million) penalty, the majority of which was due to undercharged sales tax to the Department of Finance (Note 19).
Included in accrued liabilities as at July 1, 2017 was a net $0.7 million (December 31, 2016 - $1.0 million) provision for estimated sales returns and allowances.
12. EMPLOYEE COMPENSATION AND BENEFITS
Pension benefits
The Corporation made total contributions of $5.4 million in the 26 weeks ended July 1, 2017 (26 weeks ended July 2, 2016 - $6.3 million).
See note 20 in the audited consolidated financial statements for the year ended December 31, 2016 for details on the Corporation’s pension and other post-employment benefit plans.

R O YA L C A N A D I A N M I NT N OT E S T O T H E C O ND E N S E D C O N S O L I DA T E D F I N A N C I A L ST A T E M E NT S 2 6 W E E K S E N D E D JU L Y 1 , 2 0 1 7 (Unaudited) (In thousands of Canadian dollars, unless otherwise indicated)
ROYAL CANADIAN MINT – SECOND QUARTER REPORT 2017 Page 34 of 40
13. REVENUE
13 weeks ended 26 weeks ended
July 1, 2017
July 2, 2016 restated (Note 3) July 1, 2017
July 2, 2016 restated (Note 3)
Revenue from the sale of goods $ 395,254 $ 600,483 $ 889,852 $ 1,177,518 Revenue from the rendering of services 6,367 9,650 14,518 21,030 Total revenue $ 401,621 $ 610,133 $ 904,370 $ 1,198,548
Revenue from the sale of goods is presented net of cost of sales in cases where the Corporation is not the principal in the transaction (“Customer inventory deals”). The following is a reconciliation of the gross revenue from the sale of goods and the net revenue presented:
13 weeks ended 26 weeks ended July 1, 2017 July 2, 2016 July 1, 2017 July 2, 2016 Gross revenue from the sale of goods $ 462,608 $ 745,066 $ 1,087,139 $ 1,513,111 Less: Customer inventory deals (67,354) (144,583) (197,287) (335,593) Net revenue from the sale of goods $ 395,254 $ 600,483 $ 889,852 $ 1,177,518
14. DEPRECIATION AND AMORTIZATION EXPENSE
13 weeks ended 26 weeks ended July 1, 2017 July 2, 2016 July 1, 2017 July 2, 2016 Depreciation of property, plant and equipment $ 4,280 $ 3,360 $ 8,235 $ 7,267 Amortization of intangible assets 817 1,511 1,737 2,372 Total depreciation and amortization expense $ 5,097 $ 4,871 $ 9,972 $ 9,639
Depreciation and amortization expense were reclassified to operating expense as follows: 13 weeks ended 26 weeks ended
July 1, 2017 July 2,
2016 July 1, 2017 July 2, 2016 Cost of sales $ 2,509 $ 2,433 $ 5,067 $ 5,348 Marketing and sales expenses 1,035 878 1,939 1,526 Administration expenses 1,553 1,560 2,966 2,765 Total depreciation and amortization expense $ 5,097 $ 4,871 $ 9,972 $ 9,639
R O YA L C A N A D I A N M I NT N OT E S T O T H E C O ND E N S E D C O N S O L I DA T E D F I N A N C I A L ST A T E M E NT S 2 6 W E E K S E N D E D JU L Y 1 , 2 0 1 7 (Unaudited) (In thousands of Canadian dollars, unless otherwise indicated)
ROYAL CANADIAN MINT – SECOND QUARTER REPORT 2017 Page 35 of 40
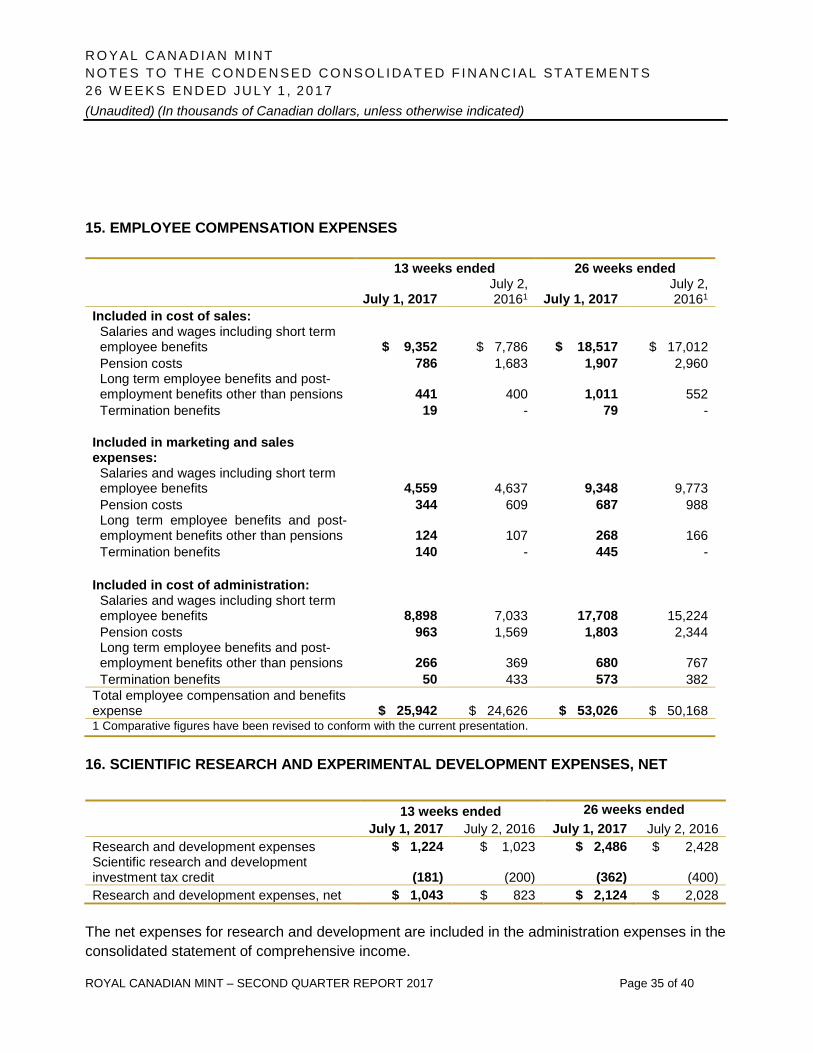
15. EMPLOYEE COMPENSATION EXPENSES
13 weeks ended 26 weeks ended
July 1, 2017 July 2, 20161 July 1, 2017
July 2, 20161
Included in cost of sales: Salaries and wages including short term employee benefits $ 9,352 $ 7,786 $ 18,517 $ 17,012 Pension costs 786 1,683 1,907 2,960 Long term employee benefits and post-employment benefits other than pensions 441 400 1,011 552 Termination benefits 19 - 79 -
Included in marketing and sales expenses:
Salaries and wages including short term employee benefits 4,559 4,637 9,348 9,773 Pension costs 344 609 687 988 Long term employee benefits and post-employment benefits other than pensions 124 107 268 166 Termination benefits 140 - 445 -
Included in cost of administration:
Salaries and wages including short term employee benefits 8,898 7,033 17,708 15,224 Pension costs 963 1,569 1,803 2,344 Long term employee benefits and post- employment benefits other than pensions 266 369 680 767 Termination benefits 50 433 573 382
Total employee compensation and benefits expense $ 25,942 $ 24,626 $ 53,026 $ 50,168 1 Comparative figures have been revised to conform with the current presentation.
16. SCIENTIFIC RESEARCH AND EXPERIMENTAL DEVELOPMENT EXPENSES, NET
13 weeks ended 26 weeks ended July 1, 2017 July 2, 2016 July 1, 2017 July 2, 2016 Research and development expenses $ 1,224 $ 1,023 $ 2,486 $ 2,428 Scientific research and development investment tax credit (181) (200) (362) (400) Research and development expenses, net $ 1,043 $ 823 $ 2,124 $ 2,028
The net expenses for research and development are included in the administration expenses in the consolidated statement of comprehensive income.
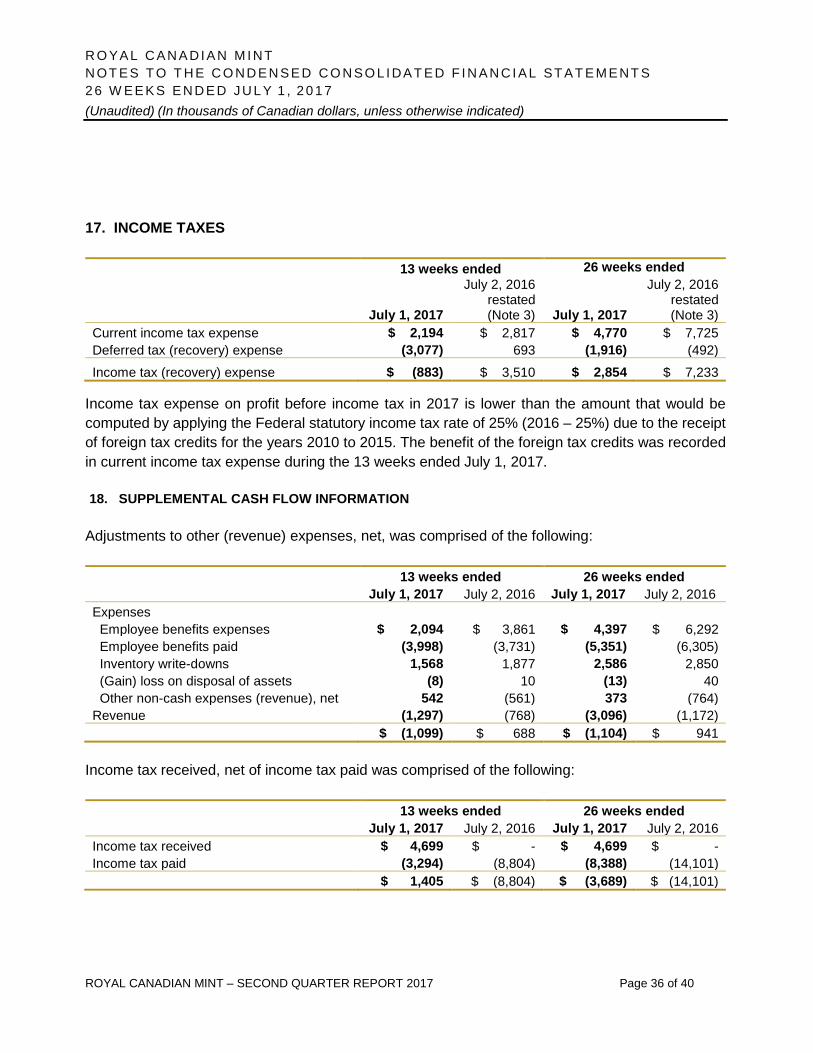
R O YA L C A N A D I A N M I NT N OT E S T O T H E C O ND E N S E D C O N S O L I DA T E D F I N A N C I A L ST A T E M E NT S 2 6 W E E K S E N D E D JU L Y 1 , 2 0 1 7 (Unaudited) (In thousands of Canadian dollars, unless otherwise indicated)
ROYAL CANADIAN MINT – SECOND QUARTER REPORT 2017 Page 36 of 40
17. INCOME TAXES
13 weeks ended 26 weeks ended
July 1, 2017
July 2, 2016 restated (Note 3) July 1, 2017
July 2, 2016 restated (Note 3)
Current income tax expense $ 2,194 $ 2,817 $ 4,770 $ 7,725 Deferred tax (recovery) expense (3,077) 693 (1,916) (492)
Income tax (recovery) expense $ (883) $ 3,510 $ 2,854 $ 7,233
Income tax expense on profit before income tax in 2017 is lower than the amount that would be computed by applying the Federal statutory income tax rate of 25% (2016 – 25%) due to the receipt of foreign tax credits for the years 2010 to 2015. The benefit of the foreign tax credits was recorded in current income tax expense during the 13 weeks ended July 1, 2017.
18. SUPPLEMENTAL CASH FLOW INFORMATION
Adjustments to other (revenue) expenses, net, was comprised of the following:
13 weeks ended 26 weeks ended July 1, 2017 July 2, 2016 July 1, 2017 July 2, 2016 Expenses Employee benefits expenses $ 2,094 $ 3,861 $ 4,397 $ 6,292 Employee benefits paid (3,998) (3,731) (5,351) (6,305) Inventory write-downs 1,568 1,877 2,586 2,850 (Gain) loss on disposal of assets (8) 10 (13) 40 Other non-cash expenses (revenue), net 542 (561) 373 (764) Revenue (1,297) (768) (3,096) (1,172) $ (1,099) $ 688 $ (1,104) $ 941
Income tax received, net of income tax paid was comprised of the following:
13 weeks ended 26 weeks ended July 1, 2017 July 2, 2016 July 1, 2017 July 2, 2016 Income tax received $ 4,699 $ - $ 4,699 $ - Income tax paid (3,294) (8,804) (8,388) (14,101) $ 1,405 $ (8,804) $ (3,689) $ (14,101)
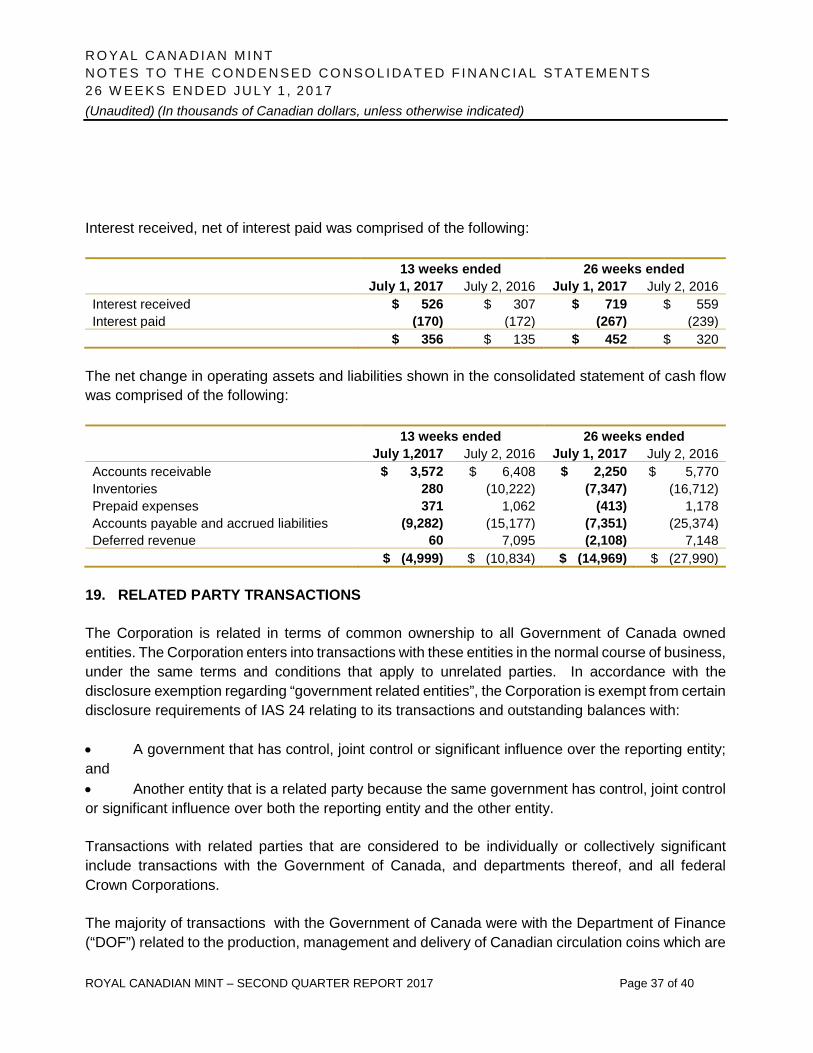
R O YA L C A N A D I A N M I NT N OT E S T O T H E C O ND E N S E D C O N S O L I DA T E D F I N A N C I A L ST A T E M E NT S 2 6 W E E K S E N D E D JU L Y 1 , 2 0 1 7 (Unaudited) (In thousands of Canadian dollars, unless otherwise indicated)
ROYAL CANADIAN MINT – SECOND QUARTER REPORT 2017 Page 37 of 40
Interest received, net of interest paid was comprised of the following:
13 weeks ended 26 weeks ended July 1, 2017 July 2, 2016 July 1, 2017 July 2, 2016 Interest received $ 526 $ 307 $ 719 $ 559 Interest paid (170) (172) (267) (239) $ 356 $ 135 $ 452 $ 320
The net change in operating assets and liabilities shown in the consolidated statement of cash flow was comprised of the following:
13 weeks ended 26 weeks ended July 1,2017 July 2, 2016 July 1, 2017 July 2, 2016 Accounts receivable $ 3,572 $ 6,408 $ 2,250 $ 5,770 Inventories 280 (10,222) (7,347) (16,712) Prepaid expenses 371 1,062 (413) 1,178 Accounts payable and accrued liabilities (9,282) (15,177) (7,351) (25,374) Deferred revenue 60 7,095 (2,108) 7,148 $ (4,999) $ (10,834) $ (14,969) $ (27,990)
19. RELATED PARTY TRANSACTIONS
The Corporation is related in terms of common ownership to all Government of Canada owned entities. The Corporation enters into transactions with these entities in the normal course of business, under the same terms and conditions that apply to unrelated parties. In accordance with the disclosure exemption regarding “government related entities”, the Corporation is exempt from certain disclosure requirements of IAS 24 relating to its transactions and outstanding balances with:
• A government that has control, joint control or significant influence over the reporting entity; and • Another entity that is a related party because the same government has control, joint control or significant influence over both the reporting entity and the other entity.
Transactions with related parties that are considered to be individually or collectively significant include transactions with the Government of Canada, and departments thereof, and all federal Crown Corporations.
The majority of transactions with the Government of Canada were with the Department of Finance (“DOF”) related to the production, management and delivery of Canadian circulation coins which are

R O YA L C A N A D I A N M I NT N OT E S T O T H E C O ND E N S E D C O N S O L I DA T E D F I N A N C I A L ST A T E M E NT S 2 6 W E E K S E N D E D JU L Y 1 , 2 0 1 7 (Unaudited) (In thousands of Canadian dollars, unless otherwise indicated)
ROYAL CANADIAN MINT – SECOND QUARTER REPORT 2017 Page 38 of 40
negotiated and measured at fair value under a three year Memorandum of Understanding, where pricing is agreed to annually in the normal course of operations.
The transactions with Department of Finance are as follows:
13 weeks ended 26 weeks ended July 1, 2017 July 2, 2016 July 1, 2017 July 2, 2016 Revenue from DOF $ 25,919 $ 25,625 $ 48,711 $ 46,133
As at July 1, 2017 December 31, 2016 Receivable from DOF $ 6,100 $ 3,167 Payable to DOF $ 5,131 $ 14,806
The majority of transactions with Crown corporations were for the sales of numismatic product.
Included in accounts payable and accrued liabilities on the consolidated statement of financial position is an accrual for a $1.6 million (2016 - $1.6 million) penalty, the majority of which is due to undercharged sales tax to the Department of Finance. The Corporation is awaiting the final assessment of the sales tax owed and will bill the Department of Finance for the undercharged sales tax of $32 million which the Corporation will in turn remit to the Canada Revenue Agency. This amount is not included in the consolidated statement of financial position.
Due to the retrospective application of IAS 16 at the date of transition to IFRS on January 1, 2010, depreciation expenses that have been charged under Canadian GAAP to the Department of Finance at a rate in excess of actual depreciation expenses incurred under IAS 16 have been adjusted by the amount of $8.2 million at that time. This amount was included in accounts payable and accrued liabilities on the consolidated statement of financial position since it was payable on demand by DOF. Starting in 2011, the Corporation began reducing its billing to the DOF by $0.5 million annually and the remainder of $5.2 million as at July 1, 2017 (December 31, 2016 - $5.2 million) will be deducted in future billings over the next 10 years.
20. COMMITMENTS, CONTINGENCIES AND GUARANTEES
20.1 Precious metal leases
In order to facilitate the production of precious metal coins and manage the risks associated with changes in metal prices, the Corporation may enter into firm fixed price purchase commitments, as well as precious metals leases. As at July 1, 2017, the Corporation had $25.2 million in outstanding precious metal purchase commitments (December 31, 2016 – $51.2 million).
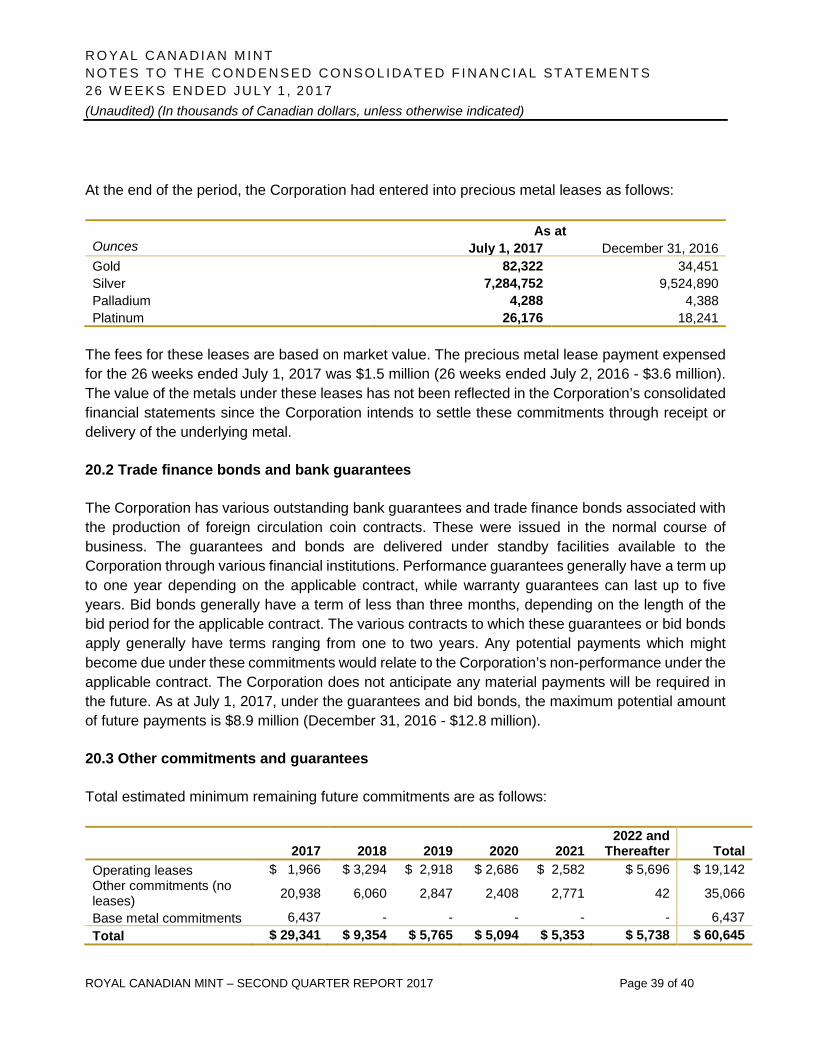
R O YA L C A N A D I A N M I NT N OT E S T O T H E C O ND E N S E D C O N S O L I DA T E D F I N A N C I A L ST A T E M E NT S 2 6 W E E K S E N D E D JU L Y 1 , 2 0 1 7 (Unaudited) (In thousands of Canadian dollars, unless otherwise indicated)
ROYAL CANADIAN MINT – SECOND QUARTER REPORT 2017 Page 39 of 40
At the end of the period, the Corporation had entered into precious metal leases as follows:
As at Ounces July 1, 2017 December 31, 2016 Gold 82,322 34,451 Silver 7,284,752 9,524,890 Palladium 4,288 4,388 Platinum 26,176 18,241
The fees for these leases are based on market value. The precious metal lease payment expensed for the 26 weeks ended July 1, 2017 was $1.5 million (26 weeks ended July 2, 2016 - $3.6 million). The value of the metals under these leases has not been reflected in the Corporation’s consolidated financial statements since the Corporation intends to settle these commitments through receipt or delivery of the underlying metal.
20.2 Trade finance bonds and bank guarantees
The Corporation has various outstanding bank guarantees and trade finance bonds associated with the production of foreign circulation coin contracts. These were issued in the normal course of business. The guarantees and bonds are delivered under standby facilities available to the Corporation through various financial institutions. Performance guarantees generally have a term up to one year depending on the applicable contract, while warranty guarantees can last up to five years. Bid bonds generally have a term of less than three months, depending on the length of the bid period for the applicable contract. The various contracts to which these guarantees or bid bonds apply generally have terms ranging from one to two years. Any potential payments which might become due under these commitments would relate to the Corporation’s non-performance under the applicable contract. The Corporation does not anticipate any material payments will be required in the future. As at July 1, 2017, under the guarantees and bid bonds, the maximum potential amount of future payments is $8.9 million (December 31, 2016 - $12.8 million).
20.3 Other commitments and guarantees
Total estimated minimum remaining future commitments are as follows:
2017 2018 2019 2020 2021 2022 and
Thereafter Total Operating leases $ 1,966 $ 3,294 $ 2,918 $ 2,686 $ 2,582 $ 5,696 $ 19,142 Other commitments (no leases) 20,938 6,060 2,847 2,408 2,771 42 35,066
Base metal commitments 6,437 - - - - - 6,437 Total $ 29,341 $ 9,354 $ 5,765 $ 5,094 $ 5,353 $ 5,738 $ 60,645

R O YA L C A N A D I A N M I NT N OT E S T O T H E C O ND E N S E D C O N S O L I DA T E D F I N A N C I A L ST A T E M E NT S 2 6 W E E K S E N D E D JU L Y 1 , 2 0 1 7 (Unaudited) (In thousands of Canadian dollars, unless otherwise indicated)
ROYAL CANADIAN MINT – SECOND QUARTER REPORT 2017 Page 40 of 40
The Corporation has committed as at July 1, 2017 to spend approximately $3.8 million in the second half of 2017 (December 31, 2016 - $4.0 million) on capital projects.
There are various legal claims against the Corporation. Claims that are uncertain in terms of the outcome or potential outflow or that are not measurable are considered to be a contingency and are not recorded in the Corporation’s consolidated financial statements. A provision of $0.7 million for a potential legal obligation was included in accounts payable and accrued liabilities as at July 1, 2017 (December 31, 2016 - $0.7 million). The amount and timing of the settlement of the provision is uncertain.