second quarter and half year ended 30 june 2017 … · its directors and executive officers (in the...
TRANSCRIPT

SEMBCORP MARINE LTD Registration Number: 196300098Z
SECOND QUARTER AND HALF YEAR & RELATED ANNOUNCEMENT
TABLE OF CONTENTS
Item No Description
Financial Statements & Related Announcement
1 Consolidated Income Statement
2 Notes to Consolidated Income Statement
3 Consolidated Statement of Comprehensive Income
4 Balance Sheets
5 Consolidated Statement of Cash Flows
6 Statements of Changes in Equity
7 Audit
8 Auditors’ Report
9 Accounting Policies
10 Changes in Accounting Policies
11 Review of Group Performance
12 Variance from Prospect Statement
13 Prospects
14 Dividend
15 Segmental Reporting
16 Interested Person Transactions
17 Confirmation that the Issuer has procured Undertakings from all its Directors And Executive Officers (in the format set out in Appendix 7.7) under Rule 720(1)
18 Confirmation Pursuant to the Rule 705(5) of the Listing
AND HALF YEAR ENDED 30 JUNE 2017 FINANCIAL STATEMENTS
Page
Financial Statements & Related Announcement 1 – 22
Consolidated Income Statement 1
Notes to Consolidated Income Statement 2 – 4
Consolidated Statement of Comprehensive Income 5
6 – 8
Consolidated Statement of Cash Flows 9 – 11
Statements of Changes in Equity 12 –
17
17
17
Changes in Accounting Policies 17
Review of Group Performance 17
Variance from Prospect Statement 18
18
18
19 –
Person Transactions 22
Confirmation that the Issuer has procured Undertakings from all its Directors And Executive Officers (in the format set out in Appendix 7.7) under Rule 720(1)
22
Confirmation Pursuant to the Rule 705(5) of the Listing Manual 22
2017 FINANCIAL STATEMENTS
Page
22
4
8
11
16
21

Company Registration Number: 196300098Z
SEMBCORP MARINE LTD
UNAUDITED RESULTS FOR THE SECOND QUARTER AND HALF YEAR ENDED 30 JUNE 2017
The Board of Directors of Sembcorp Marine Ltd wishes to announce the following unaudited results of the Group for the second quarter and half year ended 30 June 2017. 1. CONSOLIDATED INCOME STATEMENT
Turnover
Cost of sales
Gross profit
Other operating income
Other operating expenses
General and administrative expenses
Operating profit
Finance income
Finance costs
Non-operating income
Non-operating expenses
Share of results of associates and joint ventures, net of tax
Profit before tax
Tax credit/(expense)
Profit for the period
Profit attributable to:
Owners of the Company
Non-controlling interests
Profit for the period
Earnings per ordinary share (cents
Basic
Diluted
n.m.: not meaningful
1
UNAUDITED RESULTS FOR THE SECOND QUARTER AND HALF YEAR ENDED 30 JUNE 2017
Marine Ltd wishes to announce the following unaudited results of the Group for the second quarter and half year ended 30 June 2017.
CONSOLIDATED INCOME STATEMENT
Group
2Q 2017 2Q 2016 + / (-) 1H 2017
Note $'000 $'000 % $'000
2a 655,474 908,485 (27.8) 1,415,525
2a (579,185) (802,013) (27.8) (1,319,295)
2a 76,289 106,472 (28.3) 96,230
2b 7,260 8,304 (12.6) 24,883
2b (32,175) (35,382) (9.1) (32,364)
General and administrative expenses 2c (22,883) (25,834) (11.4) (46,672)
28,491 53,560 (46.8) 42,077
2d 5,174 1,267 n.m. 6,194
2e (24,999) (22,510) 11.1 (48,909)
2f 866 - n.m. 47,682
2f (5,500) (8,355) (34.2) (5,500)
2g (517) (4,718) (89.0) (1,226)
3,515 19,244 (81.7) 40,318
2h 187 (8,507) n.m. 2,959
3,702 10,737 (65.5) 43,277
5,594 11,452 (51.2) 45,140
(1,892) (715) n.m. (1,863)
3,702 10,737 (65.5) 43,277
Earnings per ordinary share (cents) 2i
0.27 0.55 (50.9) 2.16
0.27 0.55 (50.9) 2.16
UNAUDITED RESULTS FOR THE SECOND QUARTER AND HALF YEAR ENDED 30 JUNE 2017
Marine Ltd wishes to announce the following unaudited results of the Group
Group
1H 2017 1H 2016 + / (-)
$'000 $'000 %
1,415,525 1,826,917 (22.5)
(1,319,295) (1,639,839) (19.5)
96,230 187,078 (48.6)
24,883 42,572 (41.6)
(32,364) (52,722) (38.6)
(46,672) (51,634) (9.6)
42,077 125,294 (66.4)
6,194 3,576 73.2
(48,909) (40,373) 21.1
47,682 9,502 n.m.
(5,500) (8,355) (34.2)
(1,226) (2,106)
(41.8)
40,318 87,538 (53.9)
2,959 (21,196) n.m.
43,277 66,342 (34.8)
45,140 66,278 (31.9)
(1,863) 64 n.m.
43,277 66,342 (34.8)
2.16 3.17 (31.9)
2.16 3.17 (31.9)

2
2. NOTES TO CONSOLIDATED INCOME STATEMENT 2a. Turnover, Cost of Sales
Group Group
2Q 2017 2Q 2016 + / (-) 1H 2017 1H 2016 + / (-)
$’000 $’000 % $’000 $’000 %
Turnover (i) 655,474 908,485 (27.8) 1,415,525 1,826,917 (22.5)
Cost of sales (579,185) (802,013) (27.8) (1,319,295) (1,639,839) (19.5)
Gross profit (ii) 76,289 106,472 (28.3) 96,230 187,078 (48.6)
Included in cost of sales:
Depreciation and amortisation (iii) (47,229) (33,528) 40.9 (93,259) (66,270) 40.7
Inventories written back 52 818 (93.6) 128 783 (83.7)
(i) Turnover for 2Q 2017 and 1H 2017 decreased mainly due to the lower revenue recognition for rig building and
offshore platforms projects. (ii) Gross profit for 2Q 2017 decreased mainly due to lower contribution from rig building and offshore platform
projects. Gross profit for 1H 2017 decreased mainly due to lower contribution from rig building and offshore platform projects, and costs incurred for a floater project which is pending finalisation with the customer.
(iii) Depreciation and amortisation for 2Q 2017 and 1H 2017 increased mainly due to depreciation charge for Tuas
Boulevard yard and amortisation of intangible property rights of Gravifloat AS and LMG Marin AS.
2b. Other operating income/(expenses)
Group Group 2Q 2017 2Q 2016 + / (-) 1H 2017 1H 2016 + / (-) $’000 $’000 % $’000 $’000 % Other operating income 7,260 8,304 (12.6) 24,883 42,572 (41.6) Other operating expenses (32,175) (35,382) (9.1) (32,364) (52,722) (38.6) (24,915) (27,078) (8.0) (7,481) (10,150) (26.3)
Included in other operating income/(expenses): Foreign exchange loss (i) (34,394) (35,042) (1.8) (30,470) (52,245) (41.7) Fair value adjustment on hedging instruments
(ii) (2,620) 2,756 n.m. (1,658) 26,825 n.m.
Gain on disposal of property, plant and equipment, net
10 9 11.1 24 41 (41.5)
Rental income 4,274 2,790 53.2 9,768 6,504 50.2 Other income (iii) 7,862 2,749 n.m. 15,091 9,202 64.0 Other expenses (47) (340) (86.2) (236) (477) (50.5)
(24,915) (27,078) (8.0) (7,481) (10,150) (26.3)
(i) Foreign exchange loss in 2Q 2017 and 1H 2017 mainly arose from the revaluation of liabilities denominated in
United States dollar to Brazilian Real and the revaluation of assets and liabilities denominated in United States dollar to Singapore dollar.
(ii) Fair value adjustment on hedging instruments was due to mark-to-market adjustments of foreign currency forward contracts.
(iii) Higher other income in 2Q 2017 and 1H 2017 was mainly due to sales of scrap.

3
2. NOTES TO CONSOLIDATED INCOME STATEMENT (Cont’d) 2c. General and administrative expenses
Group Group
2Q 2017 2Q 2016 + / (-) 1H 2017 1H 2016 + / (-)
$’000 $’000 % $’000 $’000 %
General and administrative expenses (i) (22,883) (25,834) (11.4) (46,672) (51,634) (9.6) Included in general and administrative expenses:
Depreciation and amortisation (1,010) (2,101) (51.9) (1,955) (4,070) (52.0)
Allowance for doubtful debts and bad debts (104) (204) (49.0) (26) (268) (90.3)
(i) Lower general and administrative expenses in 2Q 2017 were mainly due to lower personnel related costs and
depreciation charge. In 1H 2017, general and administrative expenses decreased mainly due to lower professional fees and depreciation charge.
2d. Finance income
Higher finance income in 2Q 2017 and 1H 2017 was mainly due to higher interest income as compared to the corresponding periods in 2016.
2e. Finance costs
Group Group
2Q 2017 2Q 2016 + / (-) 1H 2017 1H 2016 + / (-)
$’000 $’000 % $’000 $’000 %
Finance costs (24,999) (22,510) 11.1 (48,909) (40,373) 21.1
Included in finance costs: Interest expense (i) (24,339) (22,068) 10.3 (47,561) (39,359) 20.8 Commitment and facility fees (660) (442) 49.3 (1,348) (1,014) 32.9 (24,999) (22,510) 11.1 (48,909) (40,373) 21.1
(i) Higher interest expense in 2Q 2017 and 1H 2017 was mainly due to higher bank borrowings as compared to the
corresponding periods in 2016.
2f. Non-operating income/(expenses)
Group Group 2Q 2017 2Q 2016 + / (-) 1H 2017 1H 2016 + / (-)
$’000 $’000 % $’000 $’000 %
Non-operating income 866 - n.m. 47,682 9,502 n.m. Non-operating expenses (5,500) (8,355) (34.2) (5,500) (8,355) (34.2) (4,634) (8,355) (44.5) 42,182 1,147 n.m.
Included in non-operating income/(expenses): Gain on disposal of assets held for sale (i) - - - 46,816 - n.m. Gain on disposal of a subsidiary 866 - n.m. 866 - n.m. Gain on disposal of a joint venture - - - - 186 n.m. Gain on deemed disposal of available-for-sale financial asset
(ii) - - - - 9,316 n.m.
Impairment losses on available-for-sale financial assets
- (8,355) n.m - (8,355) n.m.
Provision in relation to a joint venture (5,500) - n.m. (5,500) - n.m. (4,634) (8,355) (44.5) 42,182 1,147 n.m.
(i) The gain on disposal of assets held for sale in 1H 2017 arose from the Group’s divestment of its 30% equity
interest in Cosco Shipyard Group Co., Ltd, which was completed in January 2017.
(ii) The gain on deemed disposal of available-for-sale financial asset in 1H 2016 arose from the Group’s step-up acquisition of Gravifloat AS from 12% to 56% in March 2016, recognised on a provisional basis.
4
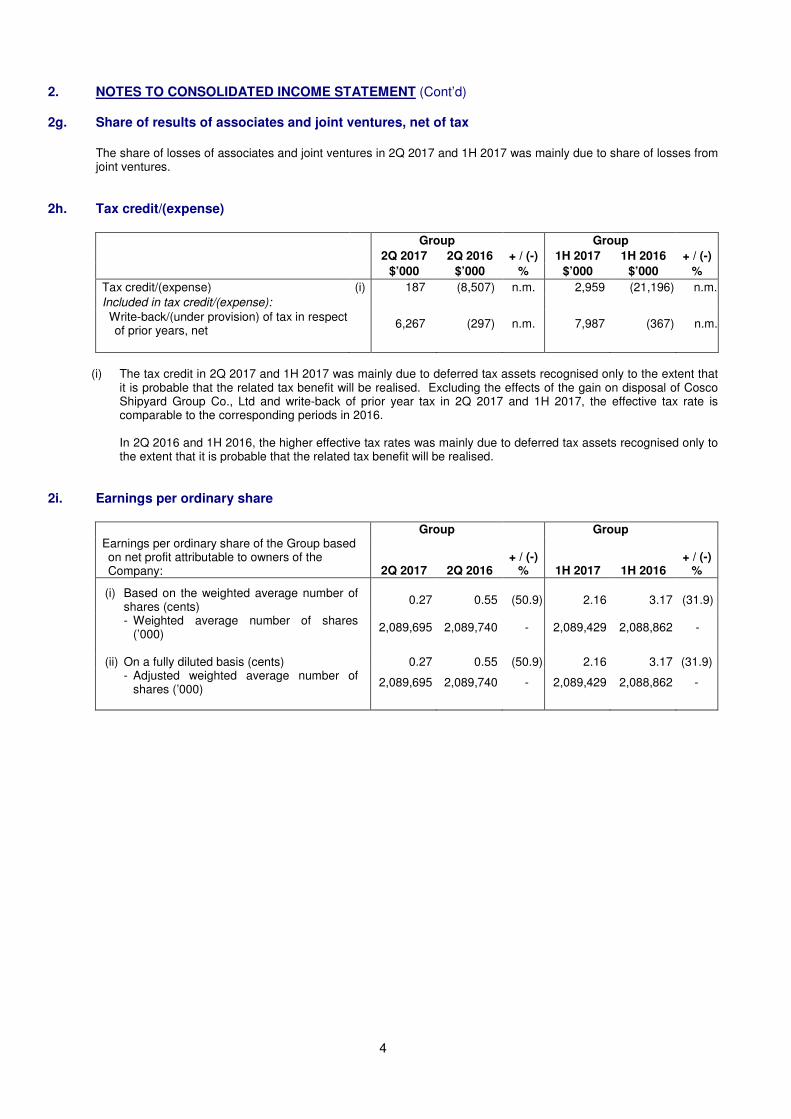
2. NOTES TO CONSOLIDATED INCOME STATEMENT (Cont’d) 2g. Share of results of associates and joint ventures, net of tax
The share of losses of associates and joint ventures in 2Q 2017 and 1H 2017 was mainly due to share of losses from joint ventures.
2h. Tax credit/(expense)
Group Group
2Q 2017 2Q 2016 + / (-) 1H 2017 1H 2016 + / (-)
$’000 $’000 % $’000 $’000 %
Tax credit/(expense) (i) 187 (8,507) n.m. 2,959 (21,196) n.m.
Included in tax credit/(expense): Write-back/(under provision) of tax in respect of prior years, net
6,267 (297) n.m. 7,987 (367) n.m.
(i) The tax credit in 2Q 2017 and 1H 2017 was mainly due to deferred tax assets recognised only to the extent that
it is probable that the related tax benefit will be realised. Excluding the effects of the gain on disposal of Cosco Shipyard Group Co., Ltd and write-back of prior year tax in 2Q 2017 and 1H 2017, the effective tax rate is comparable to the corresponding periods in 2016. In 2Q 2016 and 1H 2016, the higher effective tax rates was mainly due to deferred tax assets recognised only to the extent that it is probable that the related tax benefit will be realised.
2i. Earnings per ordinary share
Group Group Earnings per ordinary share of the Group based on net profit attributable to owners of the Company: 2Q 2017 2Q 2016
+ / (-) % 1H 2017 1H 2016
+ / (-) %
(i) Based on the weighted average number of shares (cents)
0.27 0.55 (50.9) 2.16 3.17 (31.9)
- Weighted average number of shares (’000)
2,089,695 2,089,740 - 2,089,429 2,088,862 -
(ii) On a fully diluted basis (cents) 0.27 0.55 (50.9) 2.16 3.17 (31.9)
- Adjusted weighted average number of shares (’000)
2,089,695 2,089,740 - 2,089,429 2,088,862 -

3. CONSOLIDATED STATEMENT OF COMPREHENSIVE INCOME
Profit for the period
Other comprehensive income
Items that may be reclassified subsequently to profit or loss:
Foreign currency translation differences for foreign operations
Net change in fair value of cash flow hedges
Net change in fair value of available-for-sale financial assets
Change in fair value of available-for sale financial assets transferred to profit or loss
Other comprehensive income for the period, net of tax
Total comprehensive income for the period
Total comprehensive income attributable to:
Owners of the Company
Non-controlling interests
Total comprehensive income for the period
3a. Explanatory notes to Consolidated Statement of Comprehensive Income
(i) The movement in foreign currency translation reserves in 1H 2017 arose primarily due to the depreciation of United States dollar against Singapore dollar relativreserve upon disposal of Cosco Shipyard Group Co., Ltd
(ii) Fair value changes were due to the mark
interest rate swaps. (iii) Fair value changes were mainly attributable to the mark
sale assets. (iv) Reclassification to profit or loss on impairment of available
5
CONSOLIDATED STATEMENT OF COMPREHENSIVE INCOME
Group 2Q 2017 2Q 2016 + / (-) 1H 2017
Note $'000 $'000 % $'000
3,702 10,737 (65.5) 43,277
3a(i) (13,099) (30,641) (57.3) (36,298)
value of cash flow 3a(ii) (18,621) 14,122 n.m. 10,220
-3a(iii) (6,174) (7,742) (20.3) 1,771
for assets transferred to 3a(iv) - 8,355 n.m.
Other comprehensive income for the (37,894) (15,906) n.m. (24,307)
(34,192) (5,169) n.m. 18,970
(32,318) (1,342) n.m. 20,827
(1,874) (3,827) (51.0) (1,857)
(34,192) (5,169) n.m. 18,970
Explanatory notes to Consolidated Statement of Comprehensive Income
The movement in foreign currency translation reserves in 1H 2017 arose primarily due to the depreciation of United States dollar against Singapore dollar relative to the rate as at end of previous year and realisation of
Cosco Shipyard Group Co., Ltd.
Fair value changes were due to the mark-to-market adjustments of foreign currency forward contracts and
value changes were mainly attributable to the mark-to-market adjustments of quoted prices of available
Reclassification to profit or loss on impairment of available-for-sale financial assets.
Group 1H 2017 1H 2016 + / (-)
$'000 $'000 %
43,277 66,342 (34.8)
(36,298) (52,904) (31.4)
10,220 41,563 (75.4)
1,771 (27,321) n.m.
- 8,355 n.m.
(24,307) (30,307) (19.8)
18,970 36,035 (47.4)
20,827 40,951 (49.1)
(1,857) (4,916) (62.2)
18,970 36,035 (47.4)
The movement in foreign currency translation reserves in 1H 2017 arose primarily due to the depreciation of e to the rate as at end of previous year and realisation of
market adjustments of foreign currency forward contracts and
market adjustments of quoted prices of available-for-

4. BALANCE SHEETS
Non-current assets
Property, plant and equipment
Investment properties
Investments in subsidiaries
Interests in associates and joint ventures
Other financial assets
Trade and other receivables
Intangible assets
Deferred tax assets
Current assets
Inventories and work-in-progress
Trade and other receivables
Tax recoverable
Assets held for sale
Other financial assets
Cash and cash equivalents
Total assets
Current liabilities
Trade and other payables
Excess of progress billings over work
Provisions
Other financial liabilities
Current tax payable
Interest-bearing borrowings
Net current assets
Non-current liabilities
Deferred tax liabilities
Provisions
Other financial liabilities
Interest-bearing borrowings
Other long-term payables
Total liabilities
Net assets
Equity attributable to owners of the Company
Share capital
Other reserves
Revenue reserve
Non-controlling interests
Total equity
6
Group
30-Jun-2017 31-Dec-2016 30
$'000 $'000
3,979,350 3,986,667
- -
- -
Interests in associates and joint ventures 71,580 74,816
73,890 67,783
52,502 53,095
190,635 202,125
2,091 12,042
4,370,048 4,396,528
3,279,265 3,066,884
662,033 491,968
8,432 8,530
- 182,215
52,543 51,737
1,015,545 1,216,971
5,017,818 5,018,305
9,387,866 9,414,833
1,765,469 2,120,447
Excess of progress billings over work-in-progress 340,840 193,403
15,306 15,337
2,418 18,317
37,721 36,817
1,466,509 1,363,961
3,628,263 3,748,282
1,389,555 1,270,023
71,995 85,673
70,182 65,279
14,730 26,397
2,923,732 2,791,014
93,796 90,567
3,174,435 3,058,930
6,802,698 6,807,212
2,585,168 2,607,621
Equity attributable to owners of the Company
484,288 484,288
(14,311) 54,905
2,071,570 2,022,796
2,541,547 2,561,989
43,621 45,632
2,585,168 2,607,621
Company
30-Jun-2017 31-Dec-2016
$'000 $'000
83,967 90,497
18,099 19,006
966,168 964,886
- -
42,590 40,612
36,605 36,605
184 184
- -
1,147,613 1,151,790
- -
305,681 61,099
5,536 5,536
- 107,369
- -
15,744 24,482
326,961 198,486
1,474,574 1,350,276
24,294 23,890
- -
6,771 6,771
- -
- -
- -
31,065 30,661
295,896 167,825
13,154 12,963
18,036 18,036
- -
- -
6,324 6,324
37,514 37,323
68,579 67,984
1,405,995 1,282,292
484,288 484,288
(19,309) (21,459)
941,016 819,463
1,405,995 1,282,292
- -
1,405,995 1,282,292
7
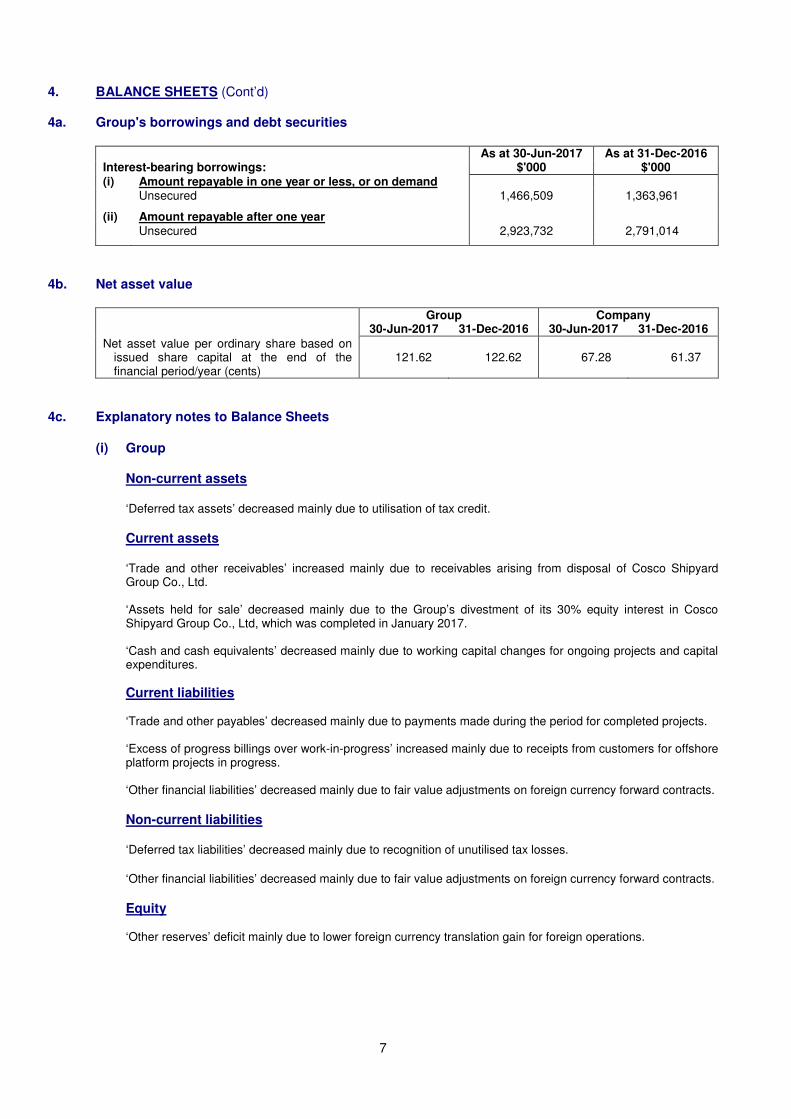
4. BALANCE SHEETS (Cont’d) 4a. Group's borrowings and debt securities
As at 30-Jun-2017 As at 31-Dec-2016 Interest-bearing borrowings: $'000 $'000 (i) Amount repayable in one year or less, or on demand Unsecured 1,466,509 1,363,961
(ii) Amount repayable after one year Unsecured 2,923,732 2,791,014
4b. Net asset value
Group Company 30-Jun-2017 31-Dec-2016 30-Jun-2017 31-Dec-2016 Net asset value per ordinary share based on
issued share capital at the end of the financial period/year (cents)
121.62 122.62 67.28 61.37
4c. Explanatory notes to Balance Sheets
(i) Group
Non-current assets ‘Deferred tax assets’ decreased mainly due to utilisation of tax credit.
Current assets ‘Trade and other receivables’ increased mainly due to receivables arising from disposal of Cosco Shipyard Group Co., Ltd. ‘Assets held for sale’ decreased mainly due to the Group’s divestment of its 30% equity interest in Cosco Shipyard Group Co., Ltd, which was completed in January 2017. ‘Cash and cash equivalents’ decreased mainly due to working capital changes for ongoing projects and capital expenditures. Current liabilities ‘Trade and other payables’ decreased mainly due to payments made during the period for completed projects. ‘Excess of progress billings over work-in-progress’ increased mainly due to receipts from customers for offshore platform projects in progress. ‘Other financial liabilities’ decreased mainly due to fair value adjustments on foreign currency forward contracts.
Non-current liabilities ‘Deferred tax liabilities’ decreased mainly due to recognition of unutilised tax losses. ‘Other financial liabilities’ decreased mainly due to fair value adjustments on foreign currency forward contracts.
Equity ‘Other reserves’ deficit mainly due to lower foreign currency translation gain for foreign operations.
8
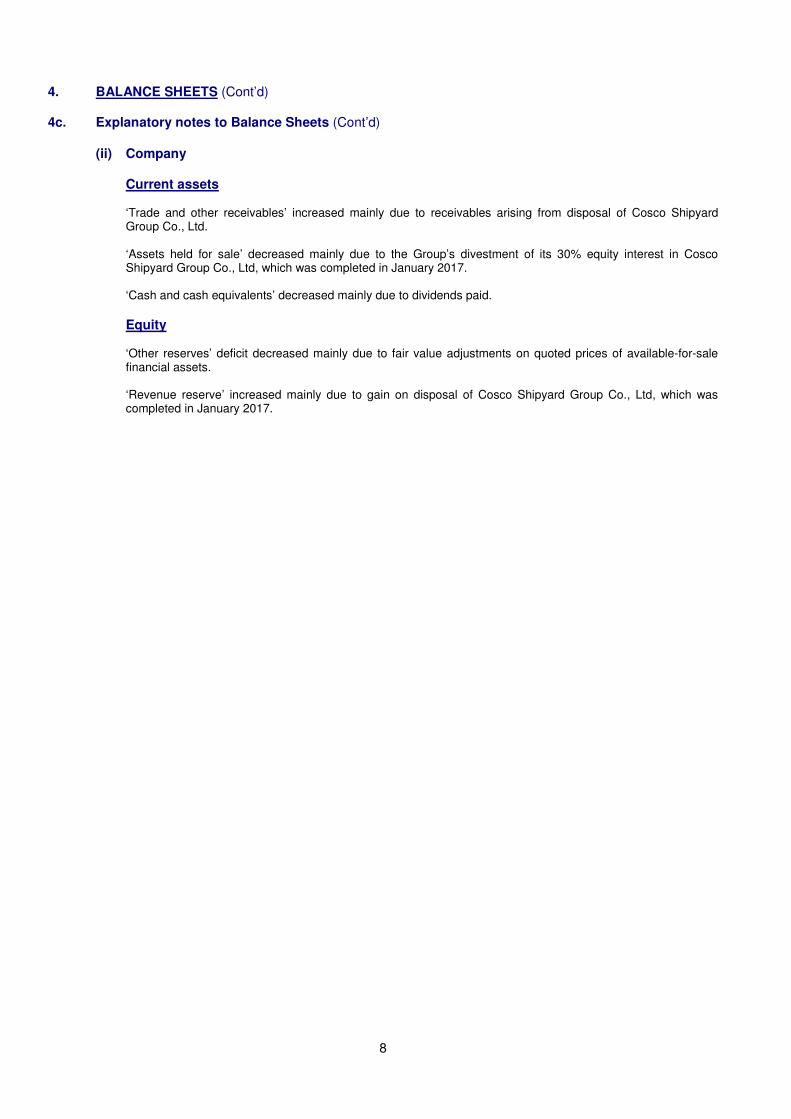
4. BALANCE SHEETS (Cont’d) 4c. Explanatory notes to Balance Sheets (Cont’d)
(ii) Company
Current assets ‘Trade and other receivables’ increased mainly due to receivables arising from disposal of Cosco Shipyard Group Co., Ltd. ‘Assets held for sale’ decreased mainly due to the Group’s divestment of its 30% equity interest in Cosco Shipyard Group Co., Ltd, which was completed in January 2017. ‘Cash and cash equivalents’ decreased mainly due to dividends paid.
Equity ‘Other reserves’ deficit decreased mainly due to fair value adjustments on quoted prices of available-for-sale financial assets. ‘Revenue reserve’ increased mainly due to gain on disposal of Cosco Shipyard Group Co., Ltd, which was completed in January 2017.
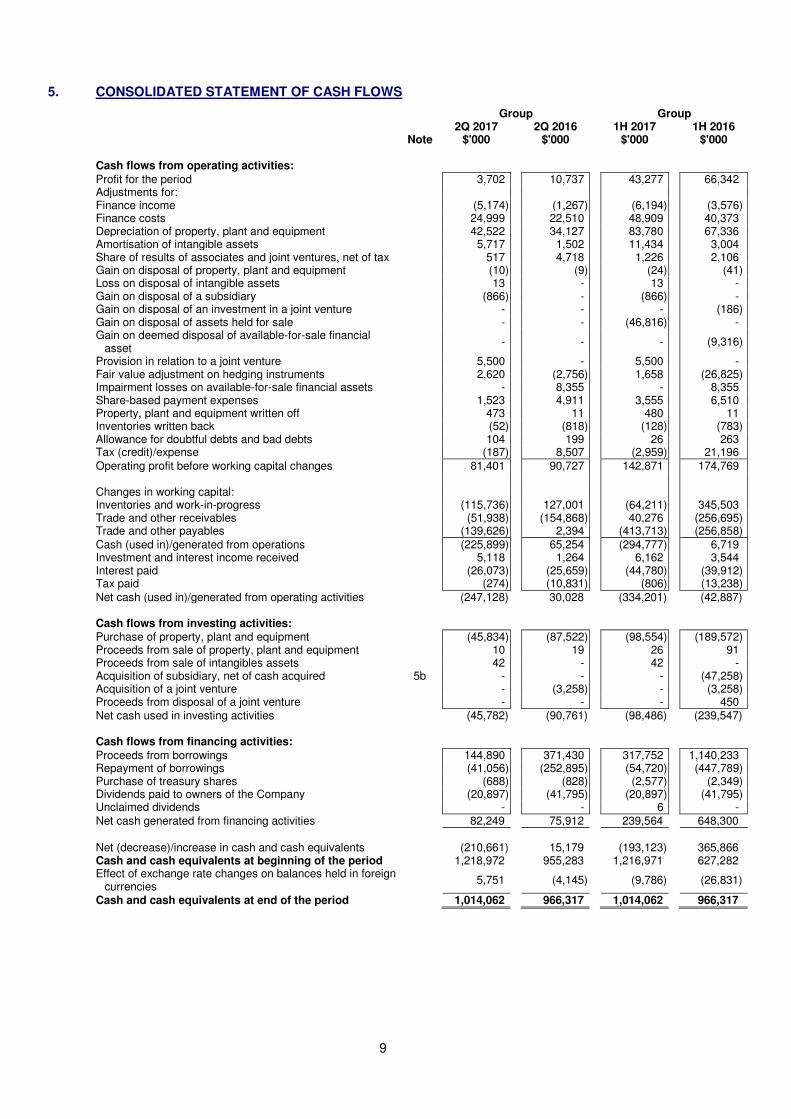
5. CONSOLIDATED STATEMENT OF CASH FLOWS
Cash flows from operating activities:Profit for the period Adjustments for: Finance income Finance costs Depreciation of property, plant and equipment Amortisation of intangible assets Share of results of associates and joint ventures, net of taxGain on disposal of property, plant and equipment Loss on disposal of intangible assets Gain on disposal of a subsidiary Gain on disposal of an investment in a joint ventureGain on disposal of assets held for saleGain on deemed disposal of available-
asset Provision in relation to a joint venture Fair value adjustment on hedging instrumentsImpairment losses on available-for-sale financial assetsShare-based payment expenses Property, plant and equipment written off Inventories written back Allowance for doubtful debts and bad debtsTax (credit)/expense Operating profit before working capital changes Changes in working capital: Inventories and work-in-progress Trade and other receivables Trade and other payables Cash (used in)/generated from operationsInvestment and interest income receivedInterest paid Tax paid Net cash (used in)/generated from operating activities Cash flows from investing activities:Purchase of property, plant and equipmentProceeds from sale of property, plant and equipmentProceeds from sale of intangibles assetsAcquisition of subsidiary, net of cash acquiredAcquisition of a joint venture Proceeds from disposal of a joint venture Net cash used in investing activities Cash flows from financing activities:Proceeds from borrowings Repayment of borrowings Purchase of treasury shares Dividends paid to owners of the CompanyUnclaimed dividends Net cash generated from financing activities Net (decrease)/increase in cash and cash equivalentsCash and cash equivalents at beginning of the periodEffect of exchange rate changes on balances held in foreign
currencies Cash and cash equivalents at end of the period
9
CONSOLIDATED STATEMENT OF CASH FLOWS
Group 2Q 2017 2Q 2016
Note $'000 $'000
Cash flows from operating activities: 3,702 10,737
(5,174) (1,267)24,999 22,510
Depreciation of property, plant and equipment 42,522 34,1275,717 1,502
Share of results of associates and joint ventures, net of tax 517 4,718Gain on disposal of property, plant and equipment (10)
13 (866)
Gain on disposal of an investment in a joint venture - Gain on disposal of assets held for sale -
-for-sale financial -
5,500 Fair value adjustment on hedging instruments 2,620 (2,756)
sale financial assets - 8,3551,523 4,911
Property, plant and equipment written off 473 11(52) (818)
Allowance for doubtful debts and bad debts 104 199(187) 8,507
Operating profit before working capital changes 81,401 90,727
(115,736) 127,001(51,938) (154,868)
(139,626) 2,394Cash (used in)/generated from operations (225,899) 65,254Investment and interest income received 5,118 1,264
(26,073) (25,659)(274) (10,831)
Net cash (used in)/generated from operating activities (247,128) 30,028
Cash flows from investing activities: Purchase of property, plant and equipment (45,834) (87,522)Proceeds from sale of property, plant and equipment 10 19Proceeds from sale of intangibles assets 42 Acquisition of subsidiary, net of cash acquired 5b -
- (3,258)Proceeds from disposal of a joint venture -
(45,782) (90,761)
Cash flows from financing activities: 144,890 371,430(41,056) (252,895)
(688) (828)Dividends paid to owners of the Company (20,897) (41,795)
- Net cash generated from financing activities 82,249 75,912
Net (decrease)/increase in cash and cash equivalents (210,661) 15,179Cash and cash equivalents at beginning of the period 1,218,972 955,283Effect of exchange rate changes on balances held in foreign
5,751 (4,145)
Cash and cash equivalents at end of the period 1,014,062 966,317
Group 2Q 2016 1H 2017 1H 2016
$'000 $'000
10,737 43,277 66,342
(1,267) (6,194) (3,576) 22,510 48,909 40,373 34,127 83,780 67,336
1,502 11,434 3,004 4,718 1,226 2,106
(9) (24) (41) - 13 - - (866) - - - (186) - (46,816) -
- - (9,316)
- 5,500 - (2,756) 1,658 (26,825) 8,355 - 8,355 4,911 3,555 6,510
11 480 11 (818) (128) (783) 199 26 263
8,507 (2,959) 21,196 90,727 142,871 174,769
127,001 (64,211) 345,503 (154,868) 40,276 (256,695)
2,394 (413,713) (256,858) 65,254 (294,777) 6,719
1,264 6,162 3,544 (25,659) (44,780) (39,912) (10,831) (806) (13,238) 30,028 (334,201) (42,887)
(87,522) (98,554) (189,572) 19 26 91
- 42 - - - (47,258)
(3,258) - (3,258) - - 450
(90,761) (98,486) (239,547)
371,430 317,752 1,140,233 (252,895) (54,720) (447,789)
(828) (2,577) (2,349) (41,795) (20,897) (41,795)
- 6 - 75,912 239,564 648,300
15,179 (193,123) 365,866
955,283 1,216,971 627,282
(4,145) (9,786) (26,831)
966,317 1,014,062 966,317

5. CONSOLIDATED STATEMENT OF 5a. Cash and cash equivalents
Cash and cash equivalents in the consolidated statement of cash flows comprise the following balance sheet amounts:
Fixed deposits Cash and bank balances Cash and cash equivalents in balance sheetsBank overdrafts Cash and cash equivalents in consolidated statement of cash flows
5b. Cash flow on acquisition of subsidiary, net of cash acquired
(i) Effect on cash flows of the Group Cash paid
Cash outflow on acquisition
(ii) Identifiable assets acquired and liabilities assumed Intangible assets*
Total assets
Net identifiable assets
Less: Non-controlling interests
Less: Amount previously accounted for as available
Less: Gain on deemed disposal of available
Consideration transferred for the business
Amount reflected as other payables
Cash paid
1
Step-up acquisition of Gravifloat AS, previously available* Fair value is measured on a provisional basis.
10
CONSOLIDATED STATEMENT OF CASH FLOWS (Cont’d)
Cash and cash equivalents in the consolidated statement of cash flows comprise the following balance sheet
30-Jun$’000
Cash and cash equivalents in balance sheets 1,015,545
Cash and cash equivalents in consolidated statement of cash flows 1,014,062
acquisition of subsidiary, net of cash acquired
Effect on cash flows of the Group
and liabilities assumed
Less: Amount previously accounted for as available-for-sale financial asset
Gain on deemed disposal of available-for-sale financial asset
Consideration transferred for the business
Amount reflected as other payables
up acquisition of Gravifloat AS, previously available-for-sale financial asset in 1Q 2016.* Fair value is measured on a provisional basis.
Cash and cash equivalents in the consolidated statement of cash flows comprise the following balance sheet
Jun-2017 30-Jun-2016 $’000 $’000
70,927 38,724 944,618 929,268
1,015,545 967,992 (1,483) (1,675)
1,014,062 966,317
1H 2017 1H 20161
$'000 $'000
- 47,258
- 47,258
- 119,336
- 119,336
- 119,336
- (52,508)
- (5,004)
- (9,316)
- 52,508
- (5,250)
- 47,258
sale financial asset in 1Q 2016.

11
5c. Explanatory notes to Consolidated Statement of Cash Flows
Second quarter
Cash flows from operating activities before changes in working capital were $81.4 million in 2Q 2017. Net cash used in operating activities for 2Q 2017 at $247.1 million was mainly due to working capital for ongoing projects. Net cash used in investing activities for 2Q 2017 was $45.8 million. The Group spent $45.8 million on expansion and operational capital expenditures, mainly for Phase II of Sembcorp Marine Tuas Boulevard yard and Estaleiro Jurong Aracruz (Brazil) yard. Net cash generated from financing activities for 2Q 2017 was $82.2 million. It relates mainly to net proceeds from borrowings, offset by dividends paid.
Half year
Cash flows from operating activities before changes in working capital were $142.9 million in 1H 2017. Net cash used in operating activities for 1H 2017 at $334.2 million was mainly due to working capital for ongoing projects. Net cash used in investing activities for 1H 2017 was $98.5 million. The Group spent $98.6 million on expansion and operational capital expenditures, mainly for Phase II of Sembcorp Marine Tuas Boulevard yard and Estaleiro Jurong Aracruz (Brazil) yard. Net cash generated from financing activities for 1H 2017 was $239.6 million. It relates mainly to net proceeds from borrowings, offset by dividends paid.

12
6. STATEMENTS OF CHANGES IN EQUITY 6a. Statements of Changes in Equity of the Group
Attributable to owners of the Company
Share capital
Reserve for own shares
Capital reserves
Currency translation reserve
Other reserves
Revenue reserve
Total
Non-
controlling interests
Total Equity
$’000 $’000 $’000 $’000 $’000 $’000 $’000 $’000 $’000 1Q 2017 At 1 January 2017 484,288 (566) 11,514 65,394 (21,437) 2,022,796 2,561,989 45,632 2,607,621 Total comprehensive income Profit for the period - - - - - 39,546 39,546 29 39,575 Other comprehensive income Foreign currency translation
differences for foreign operations - - - (23,187) - - (23,187) (12) (23,199)
Net change in fair value of cash flow hedges
- - - - 28,841 - 28,841 - 28,841
Net change in fair value of available-for-sale financial assets
- - - - 7,945 - 7,945 - 7,945
Total other comprehensive income - - - (23,187) 36,786 - 13,599 (12) 13,587
Total comprehensive income - - - (23,187) 36,786 39,546 53,145 17 53,162 Transactions with owners of the
Company, recognised directly in equity
Purchase of treasury shares - (1,889) - - - - (1,889) - (1,889) Issue of treasury shares - 2,343 - - (2,343) - - - - Share-based payments - - - - 1,031 - 1,031 - 1,031 Realisation of reserve upon
disposal of assets held for sale - - - (20,484) - - (20,484) - (20,484)
Transfer of reserves - - (24,525) - - 24,525 - - - Unclaimed dividends - - - - - 6 6 - 6
Total transactions with owners - 454 (24,525) (20,484) (1,312) 24,531 (21,336) - (21,336)
At 31 March 2017 484,288 (112) (13,011) 21,723 14,037 2,086,873 2,593,798 45,649 2,639,447
2Q 2017 Total comprehensive income Profit for the period - - - - - 5,594 5,594 (1,892) 3,702 Other comprehensive income Foreign currency translation
differences for foreign operations - - - (13,117) - - (13,117) 18 (13,099)
Net change in fair value of cash flow hedges
- - - - (18,621) - (18,621) - (18,621)
Net change in fair value of available-for-sale financial assets
- - - - (6,174) - (6,174) - (6,174)
Total other comprehensive income - - - (13,117) (24,795) - (37,912) 18 (37,894)
Total comprehensive income - - - (13,117) (24,795) 5,594 (32,318) (1,874) (34,192) Transactions with owners of the
Company, recognised directly in equity
Purchase of treasury shares - (688) - - - - (688) - (688) Issue of treasury shares - 689 - - (2) - 687 - 687 Dividends paid - - - - - (20,897) (20,897) - (20,897) Share-based payments - - - - 1,028 - 1,028 - 1,028 Disposal of a subsidiary - - - (63) - - (63) (154) (217)
Total transactions with owners - 1 - (63) 1,026 (20,897) (19,933) (154) (20,087)
At 30 June 2017 484,288 (111) (13,011) 8,543 (9,732) 2,071,570 2,541,547 43,621 2,585,168

13
6. STATEMENTS OF CHANGES IN EQUITY (Cont’d) 6a. Statements of Changes in Equity of the Group (Cont’d)
Attributable to owners of the Company
Share capital
Reserve for own shares
Capital reserves
Currency translation reserve
Other reserves
Revenue reserve
Total
Non-
controlling interests
Total Equity
$’000 $’000 $’000 $’000 $’000 $’000 $’000 $’000 $’000 1Q 2016 At 1 January 2016 484,288 (3,149) 25,574 50,903 (63,558) 2,017,147 2,511,205 153,074 2,664,279 Total comprehensive income Profit for the period - - - - - 54,826 54,826 779 55,605 Other comprehensive income Foreign currency translation
differences for foreign operations - - - (20,395) - - (20,395) (1,868) (22,263)
Net change in fair value of cash flow hedges
- - - - 27,441 - 27,441 - 27,441
Net change in fair value of available-for-sale financial assets
- - - - (19,579) - (19,579) - (19,579)
Total other comprehensive income - - - (20,395) 7,862 - (12,533) (1,868) (14,401)
Total comprehensive income - - - (20,395) 7,862 54,826 42,293 (1,089) 41,204 Transactions with owners of the
Company, recognised directly in equity
Purchase of treasury shares - (1,521) - - - - (1,521) - (1,521) Issue of treasury shares - 4,626 - - (4,626) - - - - Share-based payments - - - - 1,369 - 1,369 - 1,369 Acquisition of subsidiary with non-
controlling interests - - - - - - - 52,508 52,508
Total transactions with owners - 3,105 - - (3,257) - (152) 52,508 52,356
At 31 March 2016 484,288 (44) 25,574 30,508 (58,953) 2,071,973 2,553,346 204,493 2,757,839
2Q 2016 Total comprehensive income Profit for the period - - - - - 11,452 11,452 (715) 10,737 Other comprehensive income Foreign currency translation
differences for foreign operations - - - (27,529) - - (27,529) (3,112) (30,641)
Net change in fair value of cash flow hedges
- - - - 14,122 - 14,122 - 14,122
Net change in fair value of available-for-sale financial assets
- - - - (7,742) - (7,742) - (7,742)
Change in fair value of available-for-sale financial assets transferred to profit or loss
- - - - 8,355 - 8,355 - 8,355
Total other comprehensive income - - - (27,529) 14,735 - (12,794) (3,112) (15,906)
Total comprehensive income - - - (27,529) 14,735 11,452 (1,342) (3,827) (5,169) Transactions with owners of the
Company, recognised directly in equity
Purchase of treasury shares - (828) - - - - (828) - (828) Issue of treasury shares - 840 - - (4) - 836 - 836 Dividends paid - - - - - (41,795) (41,795) - (41,795) Share-based payments - - - - 3,555 - 3,555 - 3,555
Total transactions with owners - 12 - - 3,551 (41,795) (38,232) - (38,232)
At 30 June 2016 484,288 (32) 25,574 2,979 (40,667) 2,041,630 2,513,772 200,666 2,714,438

14
6. STATEMENTS OF CHANGES IN EQUITY (Cont’d) 6b. Statements of Changes in Equity of the Company
Share capital
Reserve for own shares
Capital
reserves
Other
reserves
Revenue reserve
Total
Equity $’000 $’000 $’000 $’000 $’000 $’000 1Q 2017
At 1 January 2017 484,288 (566) 960 (21,853) 819,463 1,282,292 Total comprehensive income Profit for the period - - - - 112,769 112,769 Other comprehensive income
Net change in fair value of available-for-sale financial assets - - - 6,703 - 6,703
Total other comprehensive income - - - 6,703 - 6,703
Total comprehensive income - - - 6,703 112,769 119,472 Transactions with owners of the Company, recognised
directly in equity Purchase of treasury shares - (1,889) - - - (1,889) Issue of treasury shares - 2,343 - (2,343) - - Share-based payments - - - 390 - 390 Cost of share-based payment issued to employees of
subsidiaries - - - 641 - 641
Unclaimed dividends - - - - 6 6
Total transactions with owners - 454 - (1,312) 6 (852)
At 31 March 2017 484,288 (112) 960 (16,462) 932,238 1,400,912
2Q 2017 Total comprehensive income Profit for the period - - - - 29,675 29,675 Other comprehensive income
Net change in fair value of available-for-sale financial assets - - - (4,725) - (4,725)
Total other comprehensive income - - - (4,725) - (4,725)
Total comprehensive income - - - (4,725) 29,675 24,950 Transactions with owners of the Company, recognised
directly in equity Purchase of treasury shares - (688) - - - (688) Issue of treasury shares - 689 - (2) - 687 Dividends paid - - - - (20,897) (20,897) Share-based payments - - - 390 - 390 Cost of share-based payment issued to employees of
subsidiaries - - - 641 - 641
Total transactions with owners - 1 - 1,029 (20,897) (19,867)
At 30 June 2017 484,288 (111) 960 (20,158) 941,016 1,405,995

15
6. STATEMENTS OF CHANGES IN EQUITY (Cont’d) 6b. Statements of Changes in Equity of the Company (Cont’d)
Share capital
Reserve for own shares
Capital
reserves
Other
reserves
Revenue reserve
Total
Equity $’000 $’000 $’000 $’000 $’000 $’000 1Q 2016
At 1 January 2016 484,288 (3,149) 960 (5,799) 371,860 848,160 Total comprehensive income Profit for the period - - - - 80,089 80,089 Other comprehensive income
Net change in fair value of available-for-sale financial assets - - - (15,439) - (15,439)
Total other comprehensive income - - - (15,439) - (15,439)
Total comprehensive income - - - (15,439) 80,089 64,650 Transactions with owners of the Company, recognised
directly in equity Purchase of treasury shares - (1,521) - - - (1,521) Issue of treasury shares - 4,626 - (4,626) - - Share-based payments - - - 308 - 308 Cost of share-based payment issued to employees of
subsidiaries - - - 1,061 - 1,061
Total transactions with owners - 3,105 - (3,257) - (152)
At 31 March 2016 484,288 (44) 960 (24,495) 451,949 912,658
2Q 2016 Total comprehensive income Profit for the period - - - - 5,997 5,997 Other comprehensive income
Net change in fair value of available-for-sale financial assets - - - (5,258) - (5,258)
Total other comprehensive income - - - (5,258) - (5,258)
Total comprehensive income - - - (5,258) 5,997 739 Transactions with owners of the Company, recognised
directly in equity Purchase of treasury shares - (828) - - - (828) Issue of treasury shares - 840 - - - 840 Dividends paid - - - - (41,795) (41,795) Share-based payments - - - 913 - 913 Cost of share-based payment issued to employees of
subsidiaries - - - 2,553 - 2,553
Total transactions with owners - 12 - 3,466 (41,795) (38,317)
At 30 June 2016 484,288 (32) 960 (26,287) 416,151 875,080

16
6. STATEMENTS OF CHANGES IN EQUITY (Cont’d) 6c. Changes in the Company's share capital
(i) Issued and Paid Up Capital As at 30 June 2017, the Company’s issued and paid up capital, excluding treasury shares, comprises 2,089,695,746 (31 December 2016: 2,089,323,078) ordinary shares.
(ii) Share Options
As at 30 June 2017, there were no (30 June 2016: 973,312) unissued ordinary shares under options granted to eligible employees and directors under the Company’s Share Option Plan (“SOP”).
(iii) Performance Shares During 2Q 2017, there were 1,600,000 (2Q 2016: 1,918,000) performance shares awarded under the Company’s Performance Share Plan (“PSP”) and nil (2Q 2016: nil) performance shares released. The total number of performance shares in awards granted conditionally and representing 100% of targets to be achieved, but not released as at 30 June 2017 was 4,733,000 (30 June 2016: 4,513,000). Based on the multiplying factor, the actual release of the awards could range from zero to a maximum of 7,099,500 (30 June 2016: 6,769,500) performance shares.
(iv) Restricted Shares
During 2Q 2017, there were 8,176,450 (2Q 2016: 8,232,700) restricted shares awarded under the Company’s Restricted Share Plan (“RSP”), 401,260 (2Q 2016: 516,300) restricted shares released and 137,415 (2Q 2016: nil) restricted shares that lapsed. The restricted shares released were settled by way of issuance of treasury shares. The total number of restricted shares outstanding, including awards achieved but not released, as at 30 June 2017 was 15,966,604 (30 June 2016: 14,127,414). Of this, the total number of restricted shares in awards granted conditionally and representing 100% of targets to be achieved, but not released as at 30 June 2017 was 15,221,050 (30 June 2016: 12,550,201). Based on the multiplying factor, the actual release of the conditional awards could range from zero to a maximum of 22,831,575 (30 June 2016: 18,825,302) restricted shares.
(v) Treasury Shares
During 2Q 2017, the Company acquired 400,100 (2Q 2016: 516,300) ordinary shares in the Company by way of on-market purchases. In 2Q 2017, 401,260 (2Q 2016: 516,300) treasury shares were issued pursuant to the RSP. As at 30 June 2017, 64,361 treasury shares were held that may be issued upon the vesting of performance shares and restricted shares under the PSP and RSP respectively (30 June 2016: 19,814 treasury shares were held that may be issued upon the exercise of the options under the SOP and upon the vesting of performance shares and restricted shares under the PSP and RSP respectively).

17
7. AUDIT
The figures have not been audited or reviewed by the Company’s auditors. However, our auditors have performed certain procedures under the requirements of Singapore Standard on Related Services (SSRS) 4400 – Engagements to Perform Agreed-upon Procedures Regarding Financial Information. These procedures do not constitute either an audit or a review made in accordance with Singapore Standards on Auditing or Singapore Standards on Review Engagements.
8. AUDITORS’ REPORT
Not applicable.
9. ACCOUNTING POLICIES
Except as disclosed in paragraph 10 below, the Group has applied the same accounting policies and methods of computation in the preparation of the financial statements for the current reporting period compared with the audited financial statements as at 31 December 2016.
10. CHANGES IN ACCOUNTING POLICIES
The following amended FRSs have become effective from 1 January 2017:
Amendments to FRSs - FRS 7 Statement of Cash Flows – Disclosure initiative - FRS 12 Income Tax – Recognition of deferred tax assets for unrealised losses
The adoption of the above FRSs (including consequential amendments) does not have any significant impact on the financial statements.
11. REVIEW OF GROUP PERFORMANCE
(i) Turnover
2Q 2017 2Q 2016 + / (-) + / (-) 1H 2017 1H 2016 + / (-) + / (-) $’m $’m $’m % $’m $’m $’m %
Rigs & Floaters 322.3 415.7 (93.4) (22.5) 669.0 955.6 (286.6) (30.0) Repairs & Upgrades 137.5 145.7 (8.2) (5.6) 227.5 244.9 (17.4) (7.1) Offshore Platforms 171.5 328.3 (156.8) (47.8) 473.4 589.4 (116.0) (19.7) Other Activities 24.2 18.8 5.4 28.7 45.6 37.0 8.6 23.2 655.5 908.5 (253.0) (27.8) 1,415.5 1,826.9 (411.4) (22.5)
Turnover for 2Q 2017 and 1H 2017 decreased mainly due to the lower revenue recognition for rig building and
offshore platform projects.
(ii) Profit attributable to Owners of the Company (“Net profit”)
Net profit for 2Q 2017 decreased mainly due to lower contribution from rig building and offshore platform
projects, and foreign exchange translation loss on the USD borrowings for the Brazil yard. Net profit for 1H 2017 decreased mainly due to lower contribution from rig building and offshore platform
projects, and costs incurred for a floater project which is pending finalisation with the customer. These are offset by the gain on disposal of Cosco Shipyard Group Co., Ltd.

18
12. VARIANCE FROM PROSPECT STATEMENT
There is no material change from the previous prospect statement.
13. PROSPECTS Global exploration and production spending is expected to increase. Offshore day rates appear to have stabilised and utilisation levels have begun to improve. However, a more robust recovery will take longer. Enquiries for non-drilling solutions continue to be encouraging. We have been actively involved with our potential customers in developing engineering solutions for the production segment. We remain cautiously optimistic of new orders for production facilities in the next few years. We continue to make steady progress in the development and commercialisation of our Gravifloat technology for near-shore gas infrastructure solutions. However, it will take time for such efforts to translate into orders. Niche markets in LNG carrier and cruise ship repairs and upgrades have held up well and have relatively outperformed other segments. We expect this trend to continue. Sembcorp Marine’s strategy and focus remain anchored on strengthening and optimising our talent pool; pursuing operational excellence in executing our projects; investing in new capabilities, products and technological innovation to help grow our order book; and prudently managing our financial resources to preserve financial flexibility and ensure overall sustainability of our business. This release may contain forward-looking statements that involve risks and uncertainties. Actual future performance, outcomes and results may differ materially from those expressed in forward-looking statements as a result of a number of risks, uncertainties and assumptions. Representative examples of these factors include (without limitation) general industry and economic conditions, interest rate trends, exchange rate movement, cost of capital and capital availability, competition from other companies and venues for the sale and distribution of goods and services, shifts in customer demands, customers and partners, changes in operating expenses, including employee wages, benefits and training, governmental and public policy changes. You are cautioned not to place undue reliance on these forward-looking statements, which are based on current view of management on future events.
14. DIVIDEND
(i) Current Financial Period Reported On
Name of Dividend Interim Ordinary One-tier tax exempt
Dividend Type Cash
Dividend Amount (cents per share) 1.0
(ii) Corresponding Period of the Immediately Preceding Financial Year
Name of Dividend Interim Ordinary One-tier tax exempt
Dividend Type Cash
Dividend Amount (cents per share) 1.5
(iii) Date payable
The interim dividend will be paid on 29 August 2017.
(iv) Books closure date
Notice is hereby given that the Transfer Book and Register of Member of the Company will be closed on 16 August 2017 for the preparation of dividend warrants. Duly completed transfers received by the Registrar, KCK Corpserve Pte Ltd, 333 North Bridge Road, #08-00 KH Kea building, Singapore 188721, up to 5 p.m. on 15 August 2017 will be registered before entitlements to dividend are determined.
19
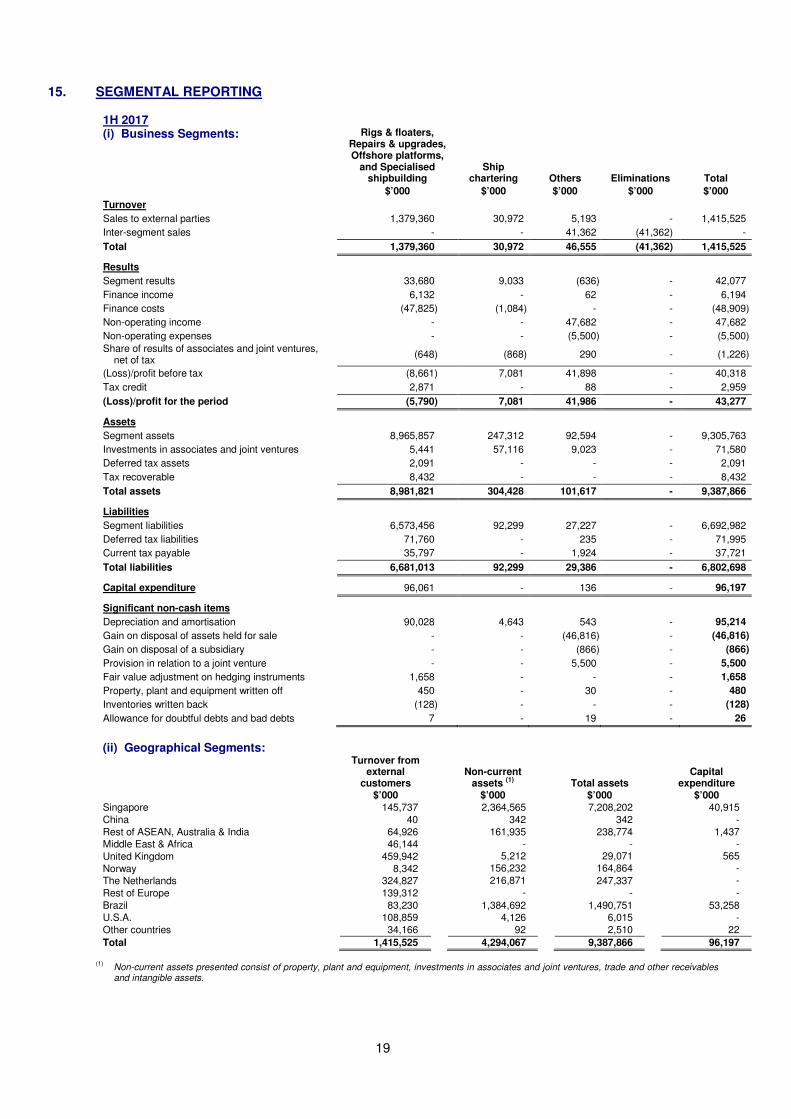
15. SEGMENTAL REPORTING
1H 2017 (i) Business Segments: Rigs & floaters,
Repairs & upgrades, Offshore platforms,
and Specialised shipbuilding
Ship chartering
Others
Eliminations
Total
$’000 $’000 $’000 $’000 $’000
Turnover
Sales to external parties 1,379,360 30,972 5,193 - 1,415,525
Inter-segment sales - - 41,362 (41,362) -
Total 1,379,360 30,972 46,555 (41,362) 1,415,525
Results
Segment results 33,680 9,033 (636) - 42,077
Finance income 6,132 - 62 - 6,194
Finance costs (47,825) (1,084) - - (48,909)
Non-operating income - - 47,682 - 47,682
Non-operating expenses - - (5,500) - (5,500)
Share of results of associates and joint ventures, net of tax
(648) (868) 290 - (1,226)
(Loss)/profit before tax (8,661) 7,081 41,898 - 40,318
Tax credit 2,871 - 88 - 2,959
(Loss)/profit for the period (5,790) 7,081 41,986 - 43,277
Assets
Segment assets 8,965,857 247,312 92,594 - 9,305,763
Investments in associates and joint ventures 5,441 57,116 9,023 - 71,580
Deferred tax assets 2,091 - - - 2,091
Tax recoverable 8,432 - - - 8,432
Total assets 8,981,821 304,428 101,617 - 9,387,866
Liabilities
Segment liabilities 6,573,456 92,299 27,227 - 6,692,982
Deferred tax liabilities 71,760 - 235 - 71,995
Current tax payable 35,797 - 1,924 - 37,721
Total liabilities 6,681,013 92,299 29,386 - 6,802,698
Capital expenditure 96,061 - 136 - 96,197
Significant non-cash items
Depreciation and amortisation 90,028 4,643 543 - 95,214
Gain on disposal of assets held for sale - - (46,816) - (46,816)
Gain on disposal of a subsidiary - - (866) - (866)
Provision in relation to a joint venture - - 5,500 - 5,500
Fair value adjustment on hedging instruments 1,658 - - - 1,658
Property, plant and equipment written off 450 - 30 - 480
Inventories written back (128) - - - (128)
Allowance for doubtful debts and bad debts 7 - 19 - 26
(ii) Geographical Segments: Turnover from
external customers
Non-current assets (1) Total assets
Capital expenditure
$’000 $’000 $’000 $’000
Singapore 145,737 2,364,565 7,208,202 40,915
China 40 342 342 -
Rest of ASEAN, Australia & India 64,926 161,935 238,774 1,437
Middle East & Africa 46,144 - - -
United Kingdom 459,942 5,212 29,071 565
Norway 8,342 156,232 164,864 -
The Netherlands 324,827 216,871 247,337 -
Rest of Europe 139,312 - - -
Brazil 83,230 1,384,692 1,490,751 53,258
U.S.A. 108,859 4,126 6,015 -
Other countries 34,166 92 2,510 22
Total 1,415,525 4,294,067 9,387,866 96,197
(1)
Non-current assets presented consist of property, plant and equipment, investments in associates and joint ventures, trade and other receivables and intangible assets.

20
15. SEGMENTAL REPORTING (Cont’d)
1H 2016 (i) Business Segments: Rigs & floaters,
Repairs & upgrades, Offshore platforms,
and Specialised shipbuilding
Ship chartering
Others
Eliminations
Total
$’000 $’000 $’000 $’000 $’000
Turnover
Sales to external parties 1,792,176 28,739 6,002 - 1,826,917
Inter-segment sales - - 90,941 (90,941) -
Total 1,792,176 28,739 96,943 (90,941) 1,826,917
Results
Segment results 118,341 4,828 2,125 - 125,294
Finance income 3,491 - 85 - 3,576
Finance costs (39,139) (1,234) - - (40,373)
Non-operating income 9,316 - 186 - 9,502
Non-operating expenses - - (8,355) - (8,355)
Share of results of associates and joint ventures, net of tax
(2,984) 278 600 - (2,106)
Profit before tax 89,025 3,872 (5,359) - 87,538
Tax expense (20,813) - (383) - (21,196)
Profit for the period 68,212 3,872 (5,742) - 66,342
Assets
Segment assets 9,247,360 252,932 93,936 - 9,594,228
Investments in associates and joint ventures 227,667 60,252 8,158 - 296,077
Deferred tax assets 21,816 - - - 21,816
Tax recoverable 4,156 - - - 4,156
Total assets 9,500,999 313,184 102,094 - 9,916,277
Liabilities
Segment liabilities 6,935,129 103,928 57,847 - 7,096,904
Deferred tax liabilities 52,033 - 350 - 52,383
Current tax payable 50,438 - 2,114 - 52,552
Total liabilities 7,037,600 103,928 60,311 - 7,201,839
Capital expenditure 185,796 - 344 - 186,140
Significant non-cash items
Depreciation and amortisation 65,167 4,574 599 - 70,340
Fair value adjustment on hedging instruments (26,825) - - - (26,825)
Property, plant and equipment written off 11 - - - 11
Inventories written back (783) - - - (783)
Allowance for doubtful debts and bad debts 263 - - - 263
(ii) Geographical Segments: Turnover from
external customers
Non-current assets (1) Total assets
Capital expenditure
$’000 $’000 $’000 $’000
Singapore 142,443 2,315,610 7,834,304 80,567
China - 219,730 219,765 -
Rest of ASEAN, Australia & India 158,682 166,379 286,381 8,390
Middle East & Africa 3,727 - - -
United Kingdom 220,043 5,836 10,251 278
Norway 218,069 122,594 122,594 -
The Netherlands 242,293 220,876 254,578 -
Austria 231,958 - - -
Rest of Europe 155,159 - - -
Brazil 41,738 1,162,103 1,182,591 96,898
U.S.A. 412,805 4,076 5,813 7
Total 1,826,917 4,217,204 9,916,277 186,140
(1)
Non-current assets presented consist of property, plant and equipment, investments in associates and joint ventures, trade and other receivables and intangible assets.

21
15. SEGMENTAL REPORTING (Cont’d) 15a. Explanatory notes to Segmental Reporting
(i) Business segments
The Group has two reportable segments, which are the Group’s strategic business units. The strategic business units are managed separately because of their different business activities. The two reportable segments are (i) rigs & floaters, repairs & upgrades, offshore platforms and specialised shipbuilding (ii) ship chartering. Inter-segment sales and transfers are carried out on an arm’s length basis. Segment assets consist primarily of property, plant and equipment, current assets and exclude inter-segment balances. Segment liabilities comprise mainly operating liabilities and exclude inter-segment balances. Performance is measured based on segment profit before income tax, as included in the internal management reports that are reviewed by the Group’s CEO. Segment profit is used to measure performance as management believes that such information is the most relevant in evaluating the results of certain segments relative to other entities that operate within these industries. Other operations include bulk trading in marine engineering related products; provision of harbour tug services to port users; collection and treatment of used copper slag, and the processing and distribution of copper slag for blast cleaning purposes.
(ii) Geographical segments
The Group operates principally in the Republic of Singapore. In presenting information on the basis of geographical segments, segment revenue is based on the geographical location of customers. Segment assets and total assets are based on the geographical location of the assets.
(iii) Review of segment performance
Please refer to paragraph 11.

22
16. INTERESTED PERSON TRANSACTIONS
Aggregate value of all interested person transactions conducted under shareholders’ mandate
pursuant to Rule 920 of the SGX-ST Listing Manual (excluding
transactions less than $100,000) 1H 2017 1H 2016 $’000 $’000 Transaction for the Sales of Goods and Services PSA International Pte Ltd and its associates 2,148 1,299 Transaction for the Purchase of Goods and Services Sembcorp Industries Limited and its associates - 111 Management and Support Services Sembcorp Industries Limited 125 125 Total Interested Person Transactions 2,273 1,535
17. CONFIRMATION THAT THE ISSUER HAS PROCURED UNDERTAKINGS FROM ALL ITS
DIRECTORS AND EXECUTIVE OFFICERS (IN THE FORMAT SET OUT IN APPENDIX 7.7) UNDER RULE 720(1)
The Company confirms that it has procured undertakings from all its directors and executive officers in the format set out in Appendix 7.7 under Rule 720(1) of the Listing Manual.
18. CONFIRMATION PURSUANT TO THE RULE 705(5) OF THE LISTING MANUAL
The Board of Directors hereby confirms that, to the best of its knowledge, nothing has come to its attention which may render the second quarter and half year ended 30 June 2017 unaudited financial results to be false or misleading.
BY ORDER OF THE BOARD TAN YAH SZE / CHAY SUET YEE JOINT COMPANY SECRETARIES 27 July 2017