second quarter 2019 results - exela technologies inc
TRANSCRIPT
NASDAQ: XELA
August 8, 2019
Second Quarter
2019 Results
© 2019 Exela Technologies, Inc.
http://investors.exelatech.com/
Ron Cogburn, CEO
Jim Reynolds, CFO
Proprietary & Confidential

2
Disclaimer
Forward-Looking Statements
Certain statements included in this presentation are not historical facts but are forward-looking statements for purposes of the safe harbor provisions under The Private Securities Litigation Reform Act of 1995. Forward-looking statementsgenerally are accompanied by words such as “may”, “should”, “would”, “plan”, “intend”, “anticipate”, “believe”, “estimate”, “predict”, “potential”, “seem”, “seek”, “continue”, “future”, “will”, “expect”, “outlook” or other similar words, phrases orexpressions. These forward-looking statements include statements regarding our industry, future events, the estimated or anticipated future results and benefits of the business combination of Quinpario Acquisition Corp. 2, SourceHOVHoldings, Inc., (“SourceHOV”) and Novitex Holdings, Inc. (“Novitex”), which formed Exela Technologies, Inc. (“Exela”), and closed on July 12, 2017 (including the related transactions, the “Business Combination”), future opportunities forthe combined company, and other statements that are not historical facts. These statements are based on the current expectations of Exela management and are not predictions of actual performance. These statements are subject to anumber of risks and uncertainties regarding Exela’s business, and actual results may differ materially. These risks and uncertainties include, but are not limited to, changes in the business environment in which Exela operates and generalfinancial, economic, regulatory and political conditions affecting the industries in which Exela operates; changes in taxes, laws and regulations; competitive product and pricing activity; failure to realize the anticipated benefits of theBusiness Combination, or the Company’s backlog including as a result of a delay or difficulty in integrating the businesses of SourceHOV and Novitex or the inability to realize the expected amount and timing of cost savings and operatingsynergies of the Business Combination; and those factors discussed under the heading “Risk Factors” in Exela’s most recent Annual Report on Form 10-K filed with the Securities and Exchange Commission (“SEC”). In addition, forward-looking statements provide Exela’s expectations, plans or forecasts of future events and views as of the date of this communication. Exela anticipates that subsequent events and developments may cause Exela’s assessments to change.These forward-looking statements should not be relied upon as representing Exela’s assessments as of any date subsequent to the date of this presentation.
Pro Forma Financial Information
This presentation includes unaudited pro forma financial information for the full-year 2017 as if the Business Combination had been consummated on January 1, 2017, based on certain estimates and assumptions that Exela managementdeems to be reasonable. This pro forma financial information may be revised as additional information becomes available. Therefore, it is possible that the actual adjustments will differ from the pro forma adjustments and it is possible thatthe difference may be material. The unaudited pro forma condensed combined financial statements are not necessarily indicative of what the actual results of operations would have been had the Business Combination taken place on thedate indicated, nor are they indicative of the future consolidated results of operations of Exela.
Non-GAAP Financial Measures and Related Information
This presentation includes constant currency, EBITDA and Adjusted EBITDA, each of which is a financial measure that is not prepared in accordance with U.S. generally accepted accounting principles (“GAAP”). Exela believes that thepresentation of these non-GAAP financial measures will provide useful information to investors in assessing our financial performance, results of operations and liquidity and allows investors to better understand the trends in our businessand to better understand and compare our results. Exela’s board of directors and management use constant currency, EBITDA and Adjusted EBITDA to assess Exela’s financial performance, because it allows them to compare Exela’soperating performance on a consistent basis across periods by removing the effects of Exela’s capital structure such as varying levels of debt and interest expense, as well as transaction costs resulting from the Business Combination andother such capital markets based activities. Adjusted EBITDA seeks to remove the effects of integration and related costs to achieve savings, any expected reduction in operating expenses due to the Business Combination, asset base(such as depreciation and amortization) and other similar non-routine items outside the control of our management team. Estimates of future financial results are inherently unreliable. Optimization and restructuring expenses and mergeradjustments are primarily related to the implementation of strategic actions and initiatives related to the Business Combination. All of these costs are variable and dependent upon the nature of the actions being implemented and can varysignificantly driven by business needs. Accordingly, due to that significant variability, we exclude these charges since we do not believe they truly reflect our past, current or future operating performance. The Company evaluates results ofoperations on both an as reported and a constant currency basis. The constant currency presentation, which is a non-GAAP measure, excludes the impact of fluctuations in foreign currency exchange rates. The Company believesproviding constant currency information provides valuable supplemental information regarding results of operations, consistent with how Exela evaluates performance. We calculate constant currency revenue and adjusted EBITDA byconverting our current-period local currency financial results using the exchange rates from the corresponding prior-period and compare these adjusted amounts to our corresponding prior period reported results. Exela does not considerthese non-GAAP measures in isolation or as an alternative to liquidity or financial measures determined in accordance with GAAP. A limitation of these non-GAAP financial measures is that they exclude significant expenses and incomethat are required by GAAP to be recorded in Exela’s financial statements. In addition, they are subject to inherent limitations as they reflect the exercise of judgments by management about which expenses and income are excluded orincluded in determining these non-GAAP financial measures and therefore the basis of presentation for these measures may not be comparable to similarly-titled measures used by other companies. These non-GAAP financial measuresare not required to be uniformly applied, are not audited and should not be considered in isolation or as substitutes for results prepared in accordance with GAAP. Net loss is the GAAP measure most directly comparable to the non-GAAPfinancial measures presented here. For reconciliation of the comparable GAAP measures to these non-GAAP financial measures, see the Appendix to this presentation.
Combined Financial Information
This presentation includes unaudited historical financial information for 2017 for Novitex and SourceHOV on a combined basis. This combined unaudited historical financial information does not include Quinpario Acquisition Corp. 2 as itwas a special purpose acquisition company. Interest (impacting net loss), debt and addbacks to EBITDA are based on credit agreements in place before the Business Combination. No adjustment has been made to restate or reflectExela's new capital structure. This combined unaudited historical financial information is not necessarily indicative of what the actual results of operations would have been had the Business Combination taken place on January 1, 2017,nor are they indicative of the future consolidated financial condition, results of operations or cash flows of Exela.
Rounding
Due to rounding, numbers presented throughout this document may not add up precisely to the totals provided and percentages may not precisely reflect absolute figures.
Proprietary & Confidential
Exela Technologies, Inc. is a global business process
automation leader combining industry-specific and
industry-agnostic enterprise software and solutions with
decades of experience. Our BPA suite of solutions are
deployed in banking, healthcare, insurance and other
industries to support mission critical environments.
Exela is a leader in work flow automation, attended and
un-attended cognitive automation, digital mail rooms,
print communications, and payment processing with
deployments across the globe.
Embracing complexity.
Delivering simplicity.SM
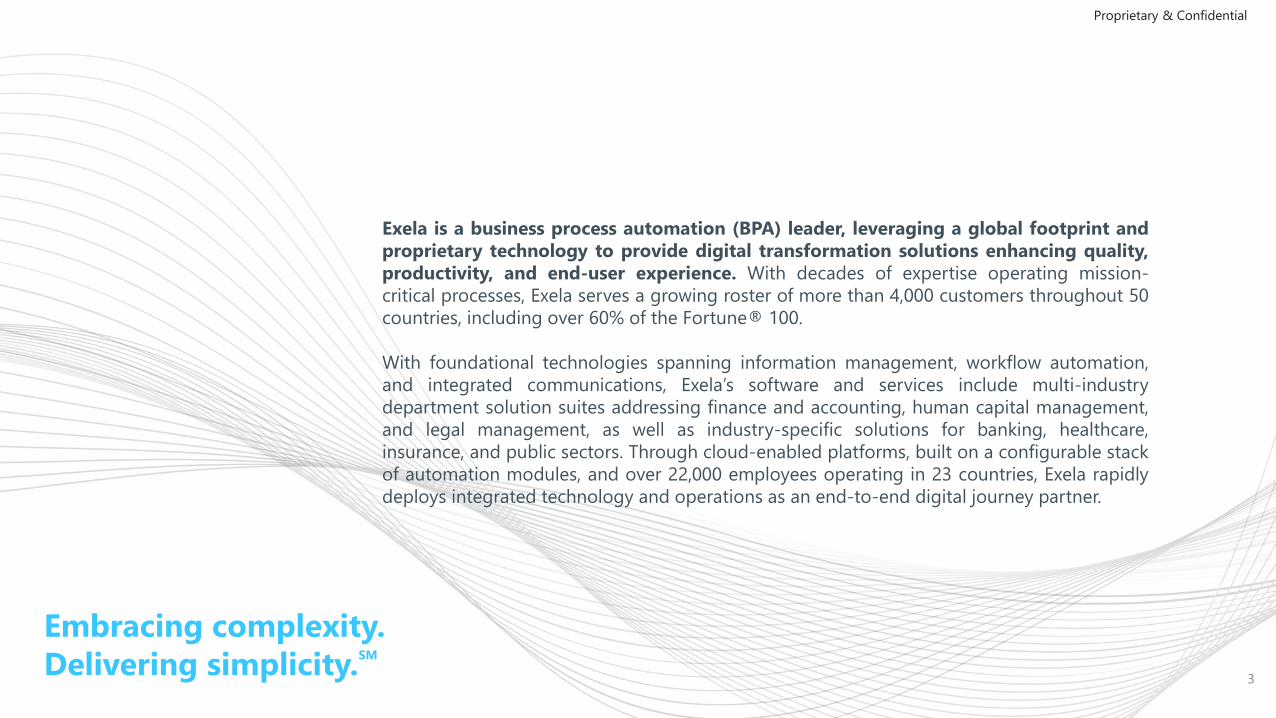
Exela is a business process automation (BPA) leader, leveraging a global footprint and
proprietary technology to provide digital transformation solutions enhancing quality,
productivity, and end-user experience. With decades of expertise operating mission-
critical processes, Exela serves a growing roster of more than 4,000 customers throughout 50
countries, including over 60% of the Fortune® 100.
With foundational technologies spanning information management, workflow automation,
and integrated communications, Exela’s software and services include multi-industry
department solution suites addressing finance and accounting, human capital management,
and legal management, as well as industry-specific solutions for banking, healthcare,
insurance, and public sectors. Through cloud-enabled platforms, built on a configurable stack
of automation modules, and over 22,000 employees operating in 23 countries, Exela rapidly
deploys integrated technology and operations as an end-to-end digital journey partner.
Embracing complexity.
Delivering simplicity.SM
3
Proprietary & Confidential
4
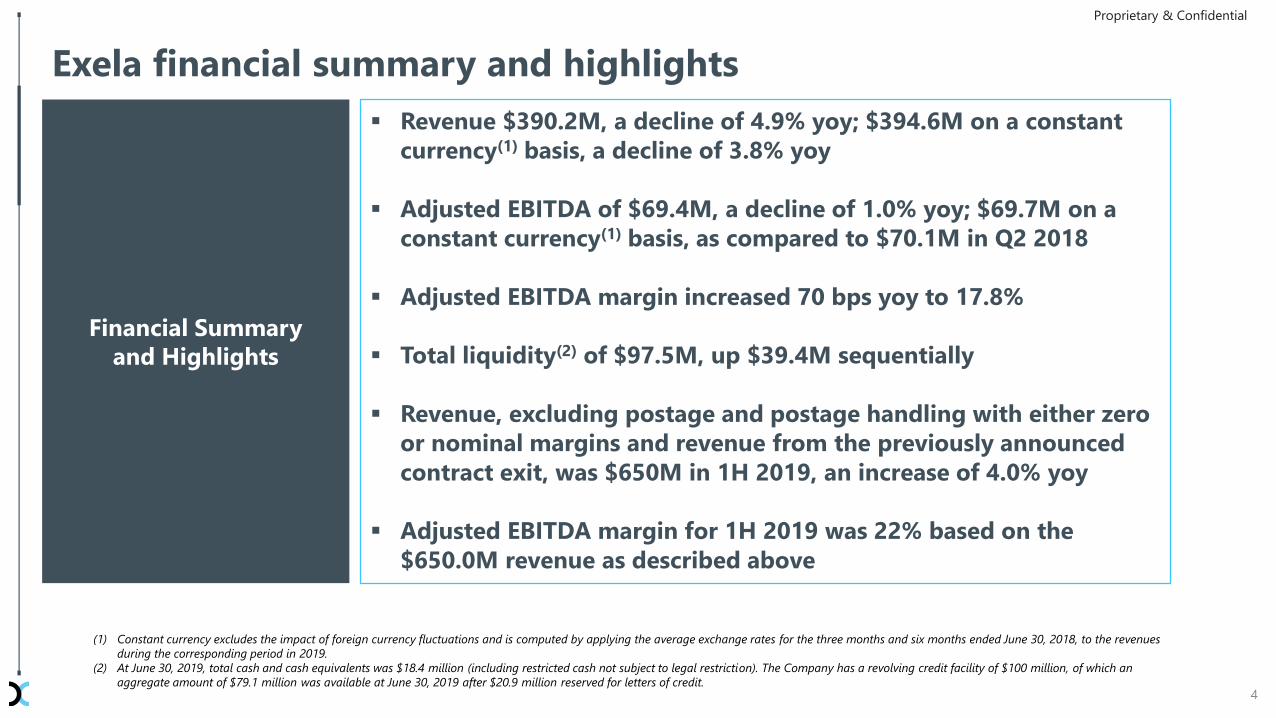
Exela financial summary and highlights
Revenue $390.2M, a decline of 4.9% yoy; $394.6M on a constant
currency(1) basis, a decline of 3.8% yoy
Adjusted EBITDA of $69.4M, a decline of 1.0% yoy; $69.7M on a
constant currency(1) basis, as compared to $70.1M in Q2 2018
Adjusted EBITDA margin increased 70 bps yoy to 17.8%
Total liquidity(2) of $97.5M, up $39.4M sequentially
Revenue, excluding postage and postage handling with either zero
or nominal margins and revenue from the previously announced
contract exit, was $650M in 1H 2019, an increase of 4.0% yoy
Adjusted EBITDA margin for 1H 2019 was 22% based on the
$650.0M revenue as described above
Financial Summary
and Highlights
(1) Constant currency excludes the impact of foreign currency fluctuations and is computed by applying the average exchange rates for the three months and six months ended June 30, 2018, to the revenues
during the corresponding period in 2019.
(2) At June 30, 2019, total cash and cash equivalents was $18.4 million (including restricted cash not subject to legal restriction). The Company has a revolving credit facility of $100 million, of which an
aggregate amount of $79.1 million was available at June 30, 2019 after $20.9 million reserved for letters of credit.
Proprietary & Confidential

5
Exela business transformation Q2 2019
Proprietary & Confidential
Q2 2019
People Facilities Vendors Total
M&A $0.7 $0.4 $0.1 $1.1
Process Transformation 15.0 0.7 1.8 17.6
Customer Transformation 0.0 0.0 0.0 0.0
Total $15.8 $1.1 $1.8 $18.7
P&L Impact
COGS SG&A Total
M&A $0.8 $0.3 $1.1
Process Transformation 13.4 4.2 17.6
Customer Transformation 0.0 0.0 0.0
Total $14.2 $4.5 $18.7
($ in millions)
Optimization & restructuring (O&R) charges summary:
• O&R charges primarily related to headcount within COGS are $14.2 million
• SG&A related O&R charges are $4.5 million primarily due to headcount
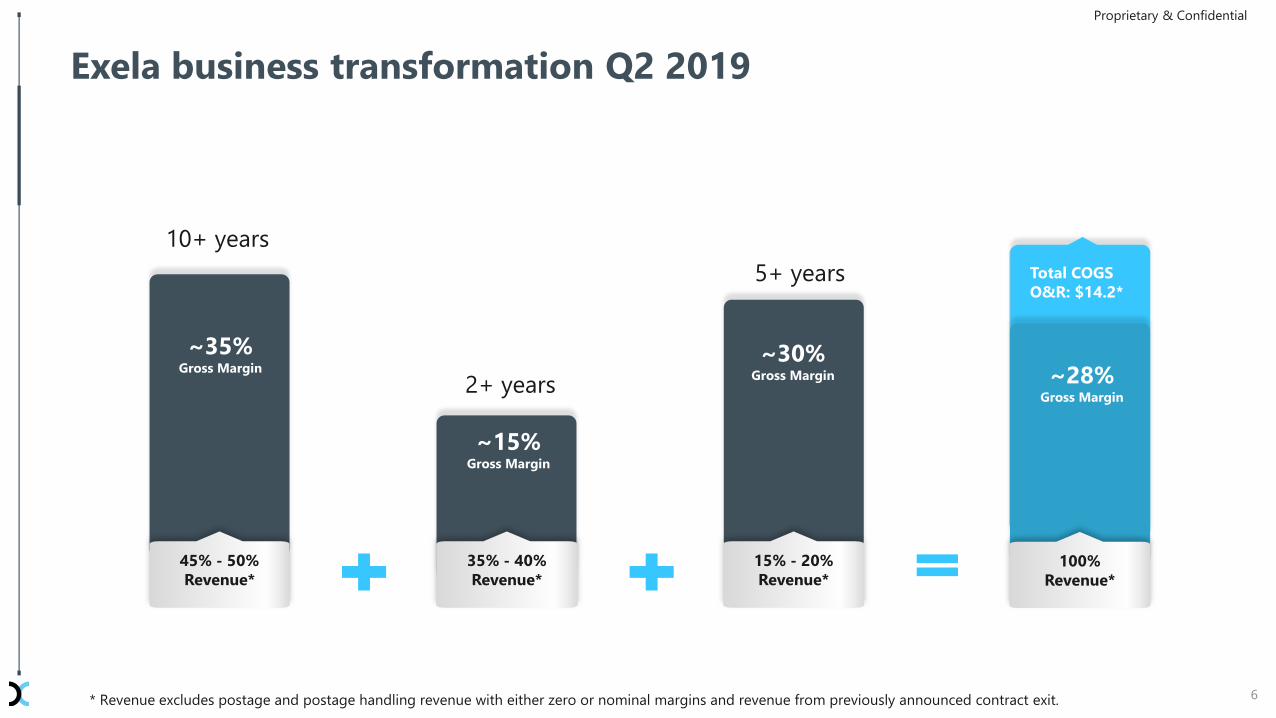
~28%Gross Margin
~30%Gross Margin
~15%Gross Margin
Exela business transformation Q2 2019
6
45% - 50%
Revenue*
35% - 40%
Revenue*
15% - 20%
Revenue*100%
Revenue*
~35%Gross Margin
Total COGS
O&R: $14.2*
Proprietary & Confidential
* Revenue excludes postage and postage handling revenue with either zero or nominal margins and revenue from previously announced contract exit.
2+ years
5+ years
10+ years
7
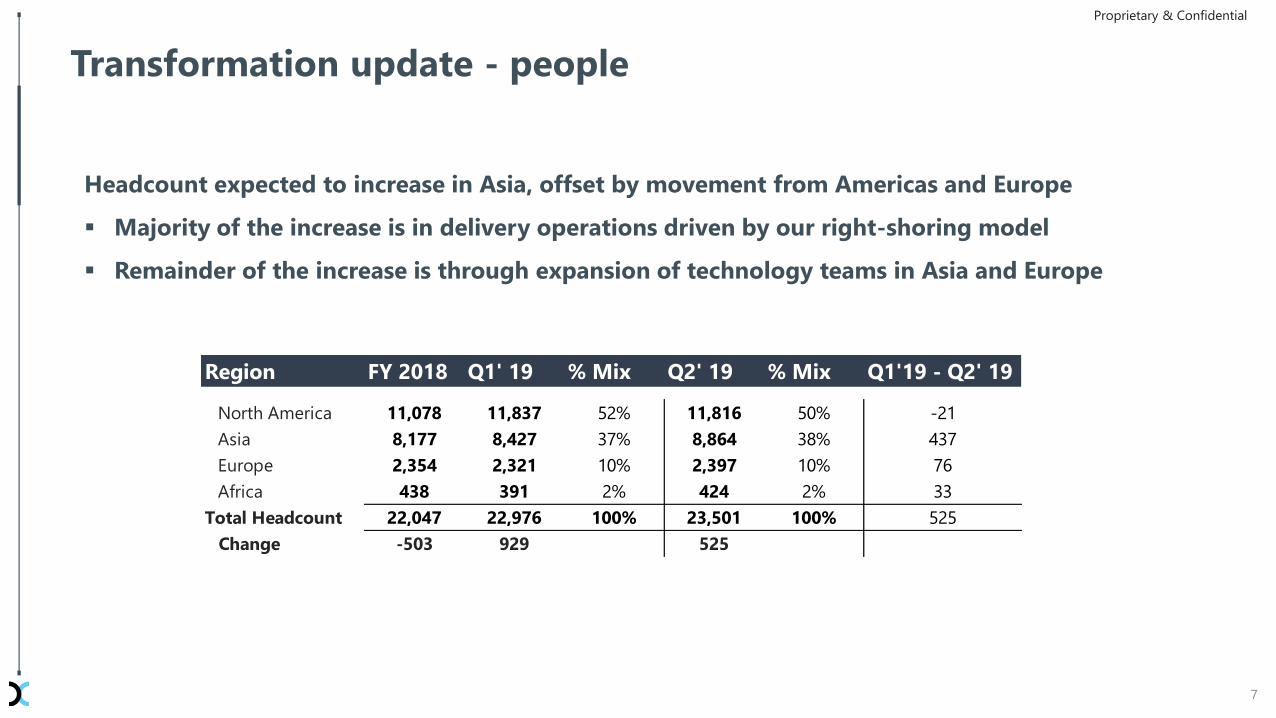
Transformation update - people
Region FY 2018 Q1' 19 % Mix Q2' 19 % Mix Q1'19 - Q2' 19
North America 11,078 11,837 52% 11,816 50% -21
Asia 8,177 8,427 37% 8,864 38% 437
Europe 2,354 2,321 10% 2,397 10% 76
Africa 438 391 2% 424 2% 33
Total Headcount 22,047 22,976 100% 23,501 100% 525
Change -503 929 525
Proprietary & Confidential
Headcount expected to increase in Asia, offset by movement from Americas and Europe
Majority of the increase is in delivery operations driven by our right-shoring model
Remainder of the increase is through expansion of technology teams in Asia and Europe
8
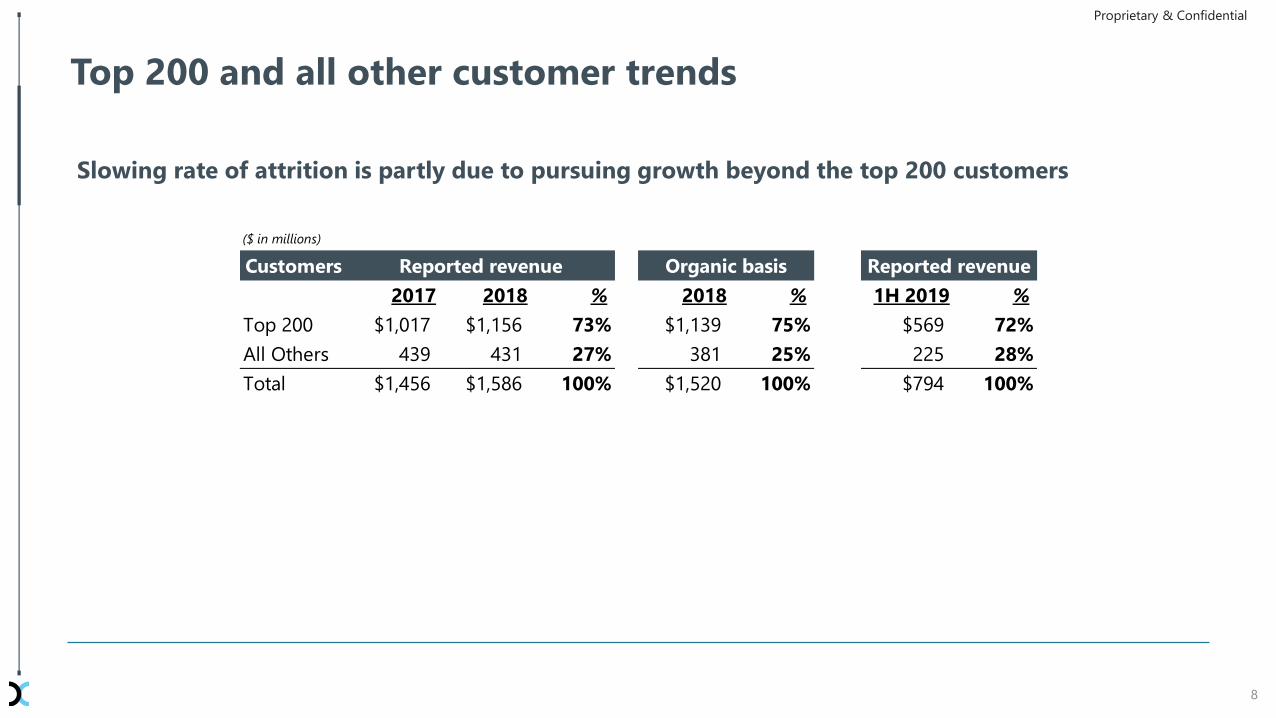
Top 200 and all other customer trends
Slowing rate of attrition is partly due to pursuing growth beyond the top 200 customers
($ in millions)
Customers
2017 2018 % 2018 % 1H 2019 %
Top 200 $1,017 $1,156 73% $1,139 75% $569 72%
All Others 439 431 27% 381 25% 225 28%
Total $1,456 $1,586 100% $1,520 100% $794 100%
Reported revenue Organic basis Reported revenue
Proprietary & Confidential
9
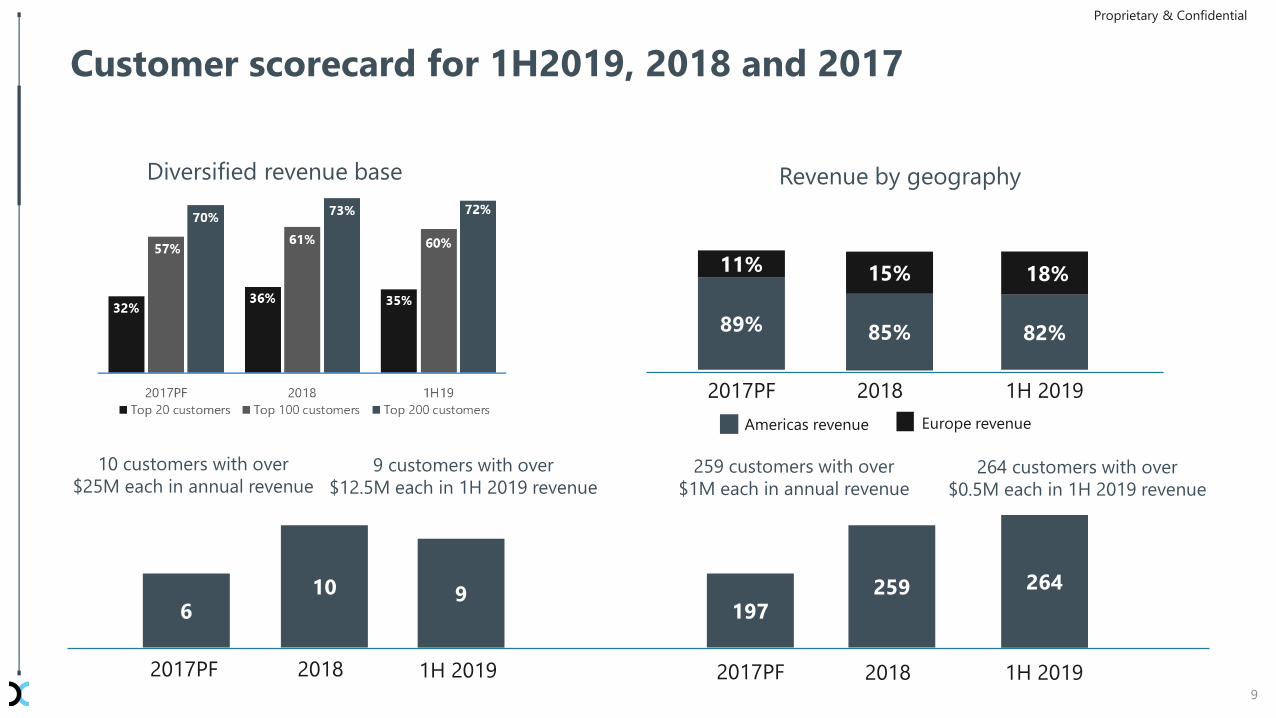
Customer scorecard for 1H2019, 2018 and 2017
610
197259
10 customers with over
$25M each in annual revenue259 customers with over
$1M each in annual revenue
2017PF 2018 2017PF 2018
9
9 customers with over
$12.5M each in 1H 2019 revenue
264
264 customers with over
$0.5M each in 1H 2019 revenue
1H 2019 1H 2019
89%
2017PF 2018 1H 2019
11%
85%
15%
82%
18%
Revenue by geography
Americas revenue Europe revenue
Diversified revenue base
Proprietary & Confidential

NASDAQ: XELA
Financial
Performance
© 2019 Exela Technologies, Inc.
Proprietary & Confidential
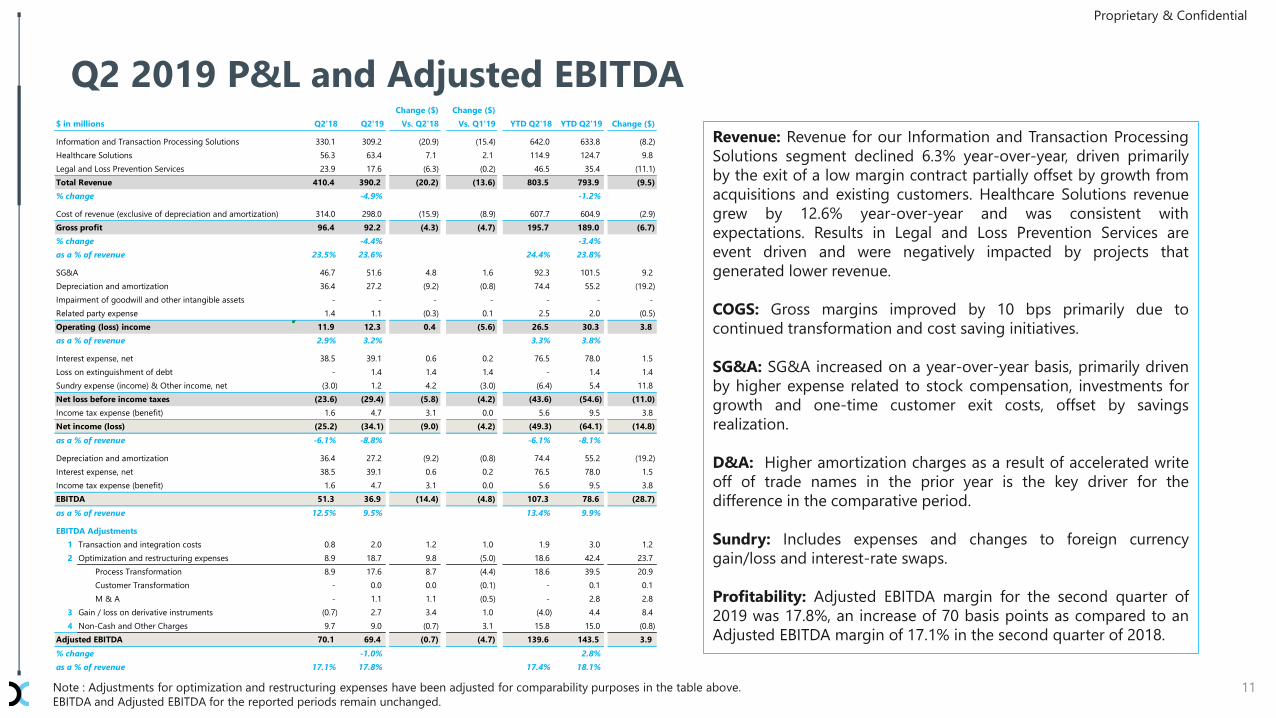
Revenue: Revenue for our Information and Transaction Processing
Solutions segment declined 6.3% year-over-year, driven primarily
by the exit of a low margin contract partially offset by growth from
acquisitions and existing customers. Healthcare Solutions revenue
grew by 12.6% year-over-year and was consistent with
expectations. Results in Legal and Loss Prevention Services are
event driven and were negatively impacted by projects that
generated lower revenue.
COGS: Gross margins improved by 10 bps primarily due to
continued transformation and cost saving initiatives.
SG&A: SG&A increased on a year-over-year basis, primarily driven
by higher expense related to stock compensation, investments for
growth and one-time customer exit costs, offset by savings
realization.
D&A: Higher amortization charges as a result of accelerated write
off of trade names in the prior year is the key driver for the
difference in the comparative period.
Sundry: Includes expenses and changes to foreign currency
gain/loss and interest-rate swaps.
Profitability: Adjusted EBITDA margin for the second quarter of
2019 was 17.8%, an increase of 70 basis points as compared to an
Adjusted EBITDA margin of 17.1% in the second quarter of 2018.
Q2 2019 P&L and Adjusted EBITDA
11
Proprietary & Confidential
$ in millions Q2'18 Q2'19
Change ($)
Vs. Q2'18
Change ($)
Vs. Q1'19 YTD Q2'18 YTD Q2'19 Change ($)
Information and Transaction Processing Solutions 330.1 309.2 (20.9) (15.4) 642.0 633.8 (8.2)
Healthcare Solutions 56.3 63.4 7.1 2.1 114.9 124.7 9.8
Legal and Loss Prevention Services 23.9 17.6 (6.3) (0.2) 46.5 35.4 (11.1)
Total Revenue 410.4 390.2 (20.2) (13.6) 803.5 793.9 (9.5)
% change -4.9% -1.2%
Cost of revenue (exclusive of depreciation and amortization) 314.0 298.0 (15.9) (8.9) 607.7 604.9 (2.9)
Gross profit 96.4 92.2 (4.3) (4.7) 195.7 189.0 (6.7)
% change -4.4% -3.4%
as a % of revenue 23.5% 23.6% 24.4% 23.8%
SG&A 46.7 51.6 4.8 1.6 92.3 101.5 9.2
Depreciation and amortization 36.4 27.2 (9.2) (0.8) 74.4 55.2 (19.2)
Impairment of goodwill and other intangible assets - - - - - - -
Related party expense 1.4 1.1 (0.3) 0.1 2.5 2.0 (0.5)
Operating (loss) income 11.9 12.3 0.4 (5.6) 26.5 30.3 3.8
as a % of revenue 2.9% 3.2% 3.3% 3.8%
Interest expense, net 38.5 39.1 0.6 0.2 76.5 78.0 1.5
Loss on extinguishment of debt - 1.4 1.4 1.4 - 1.4 1.4
Sundry expense (income) & Other income, net (3.0) 1.2 4.2 (3.0) (6.4) 5.4 11.8
Net loss before income taxes (23.6) (29.4) (5.8) (4.2) (43.6) (54.6) (11.0)
Income tax expense (benefit) 1.6 4.7 3.1 0.0 5.6 9.5 3.8
Net income (loss) (25.2) (34.1) (9.0) (4.2) (49.3) (64.1) (14.8)
as a % of revenue -6.1% -8.8% -6.1% -8.1%
Depreciation and amortization 36.4 27.2 (9.2) (0.8) 74.4 55.2 (19.2)
Interest expense, net 38.5 39.1 0.6 0.2 76.5 78.0 1.5
Income tax expense (benefit) 1.6 4.7 3.1 0.0 5.6 9.5 3.8
EBITDA 51.3 36.9 (14.4) (4.8) 107.3 78.6 (28.7)
as a % of revenue 12.5% 9.5% 13.4% 9.9%
EBITDA Adjustments
1 Transaction and integration costs 0.8 2.0 1.2 1.0 1.9 3.0 1.2
2 Optimization and restructuring expenses 8.9 18.7 9.8 (5.0) 18.6 42.4 23.7
Process Transformation 8.9 17.6 8.7 (4.4) 18.6 39.5 20.9
Customer Transformation - 0.0 0.0 (0.1) - 0.1 0.1
M & A - 1.1 1.1 (0.5) - 2.8 2.8
3 Gain / loss on derivative instruments (0.7) 2.7 3.4 1.0 (4.0) 4.4 8.4
4 Non-Cash and Other Charges 9.7 9.0 (0.7) 3.1 15.8 15.0 (0.8)
Adjusted EBITDA 70.1 69.4 (0.7) (4.7) 139.6 143.5 3.9
% change -1.0% 2.8%
as a % of revenue 17.1% 17.8% 17.4% 18.1%
Note : Adjustments for optimization and restructuring expenses have been adjusted for comparability purposes in the table above.
EBITDA and Adjusted EBITDA for the reported periods remain unchanged.
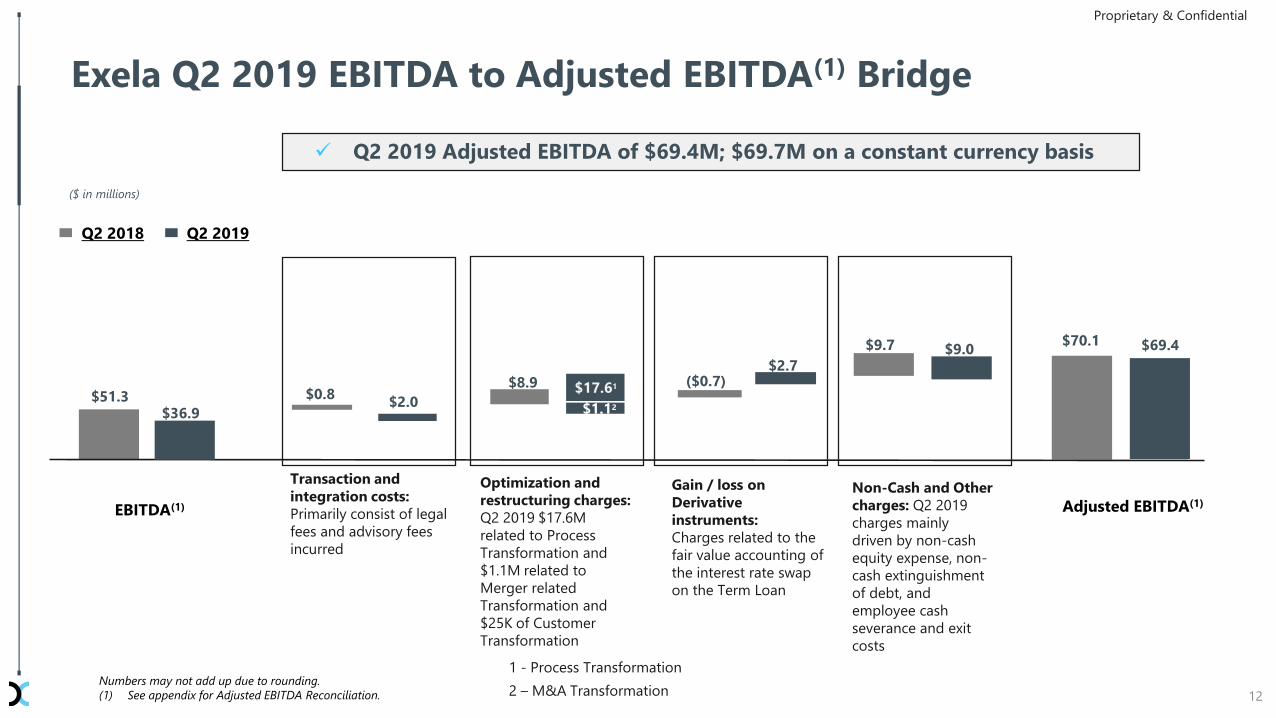
Exela Q2 2019 EBITDA to Adjusted EBITDA(1) Bridge
Numbers may not add up due to rounding.
(1) See appendix for Adjusted EBITDA Reconciliation.
Q2 2019 Adjusted EBITDA of $69.4M; $69.7M on a constant currency basis
($ in millions)
$51.3
$69.4
$0.8
$70.1
Q2 2018 Q2 2019
$9.7 $9.0
($0.7)$2.7
Gain / loss on
Derivative
instruments:
Charges related to the
fair value accounting of
the interest rate swap
on the Term Loan
Optimization and
restructuring charges:
Q2 2019 $17.6M
related to Process
Transformation and
$1.1M related to
Merger related
Transformation and
$25K of Customer
Transformation
Non-Cash and Other
charges: Q2 2019
charges mainly
driven by non-cash
equity expense, non-
cash extinguishment
of debt, and
employee cash
severance and exit
costs
EBITDA(1) Adjusted EBITDA(1)
12
$36.9
Transaction and
integration costs:
Primarily consist of legal
fees and advisory fees
incurred
$8.9
$2.0
1 - Process Transformation
2 – M&A Transformation
Proprietary & Confidential
$1.12
$17.61
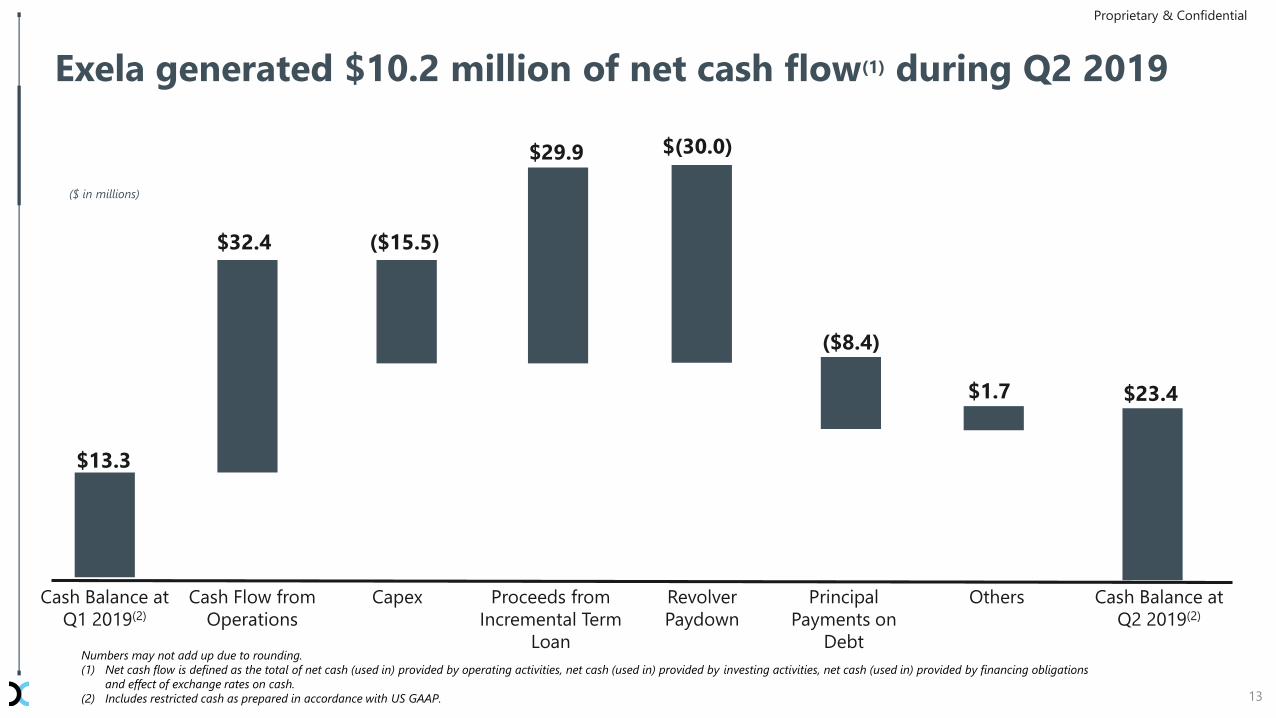
Exela generated $10.2 million of net cash flow(1) during Q2 2019
Cash Balance at
Q1 2019(2)
$13.3
Cash Flow from
Operations
Capex
($15.5)
Principal
Payments on
Debt
$29.9 $(30.0)
Cash Balance at
Q2 2019(2)
$23.4
Numbers may not add up due to rounding.
(1) Net cash flow is defined as the total of net cash (used in) provided by operating activities, net cash (used in) provided by investing activities, net cash (used in) provided by financing obligations
and effect of exchange rates on cash.
(2) Includes restricted cash as prepared in accordance with US GAAP.
Revolver
Paydown
($8.4)
Others
$1.7
Proceeds from
Incremental Term
Loan
13
Proprietary & Confidential
$32.4
($ in millions)
14
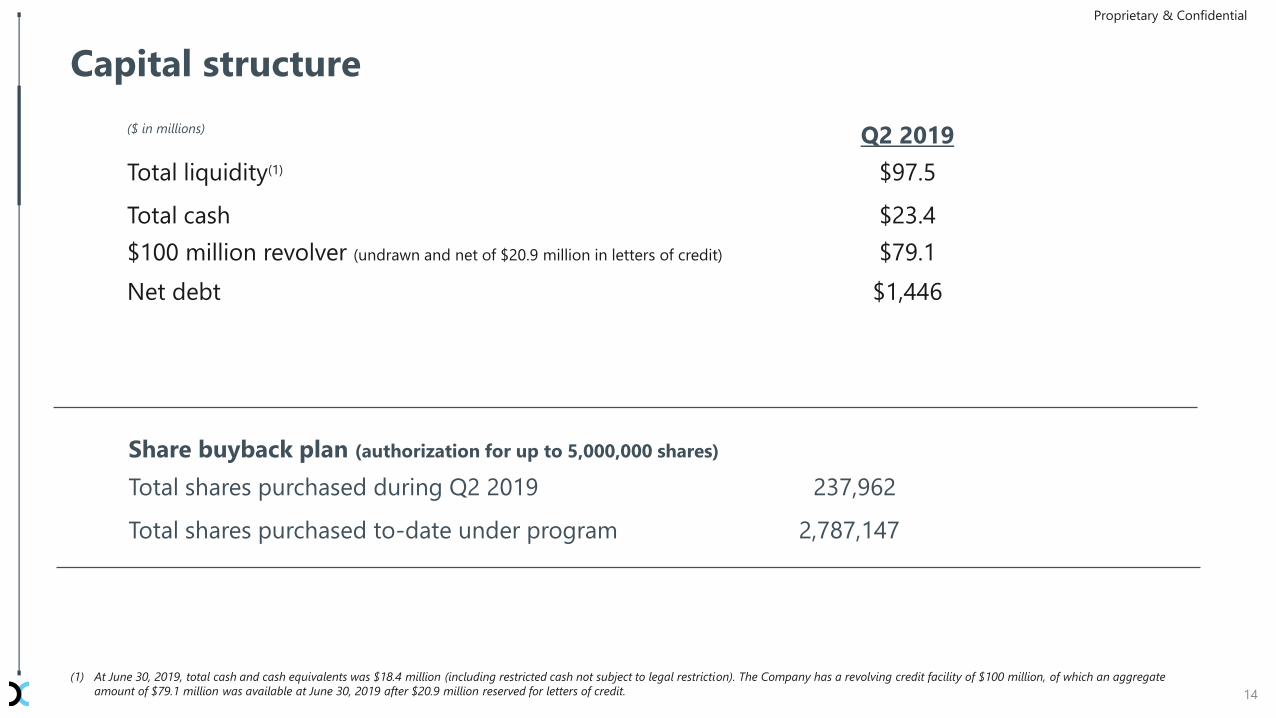
(1) At June 30, 2019, total cash and cash equivalents was $18.4 million (including restricted cash not subject to legal restriction). The Company has a revolving credit facility of $100 million, of which an aggregate
amount of $79.1 million was available at June 30, 2019 after $20.9 million reserved for letters of credit.
Capital structure
($ in millions) Q2 2019
Total liquidity(1) $97.5
Total cash $23.4
$100 million revolver (undrawn and net of $20.9 million in letters of credit) $79.1
Net debt $1,446
Share buyback plan (authorization for up to 5,000,000 shares)
Total shares purchased during Q2 2019 237,962
Total shares purchased to-date under program 2,787,147
Proprietary & Confidential
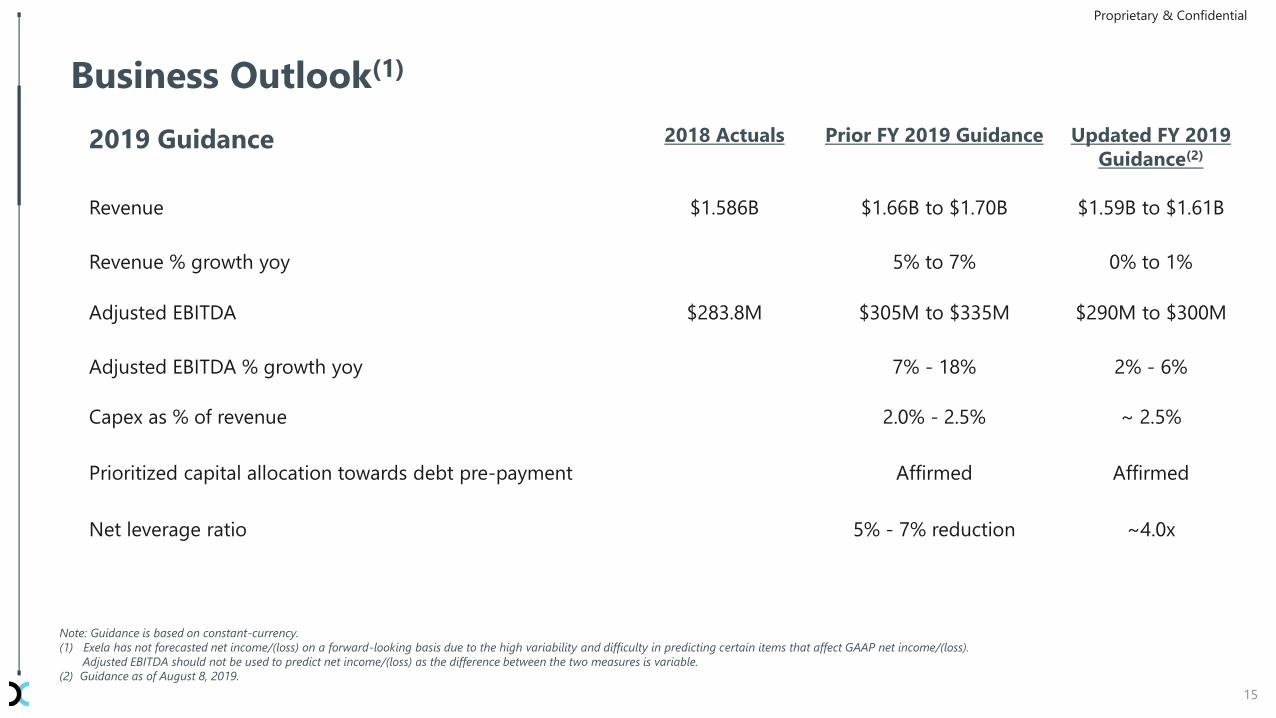
Note: Guidance is based on constant-currency.
(1) Exela has not forecasted net income/(loss) on a forward-looking basis due to the high variability and difficulty in predicting certain items that affect GAAP net income/(loss).
Adjusted EBITDA should not be used to predict net income/(loss) as the difference between the two measures is variable.
(2) Guidance as of August 8, 2019.
Business Outlook(1)
15
2019 Guidance 2018 Actuals Prior FY 2019 Guidance Updated FY 2019
Guidance(2)
Revenue $1.586B $1.66B to $1.70B $1.59B to $1.61B
Revenue % growth yoy 5% to 7% 0% to 1%
Adjusted EBITDA $283.8M $305M to $335M $290M to $300M
Adjusted EBITDA % growth yoy 7% - 18% 2% - 6%
Capex as % of revenue 2.0% - 2.5% ~ 2.5%
Prioritized capital allocation towards debt pre-payment Affirmed Affirmed
Net leverage ratio 5% - 7% reduction ~4.0x
Proprietary & Confidential

NASDAQ: XELA
Appendix
© 2019 Exela Technologies, Inc.
Proprietary & Confidential
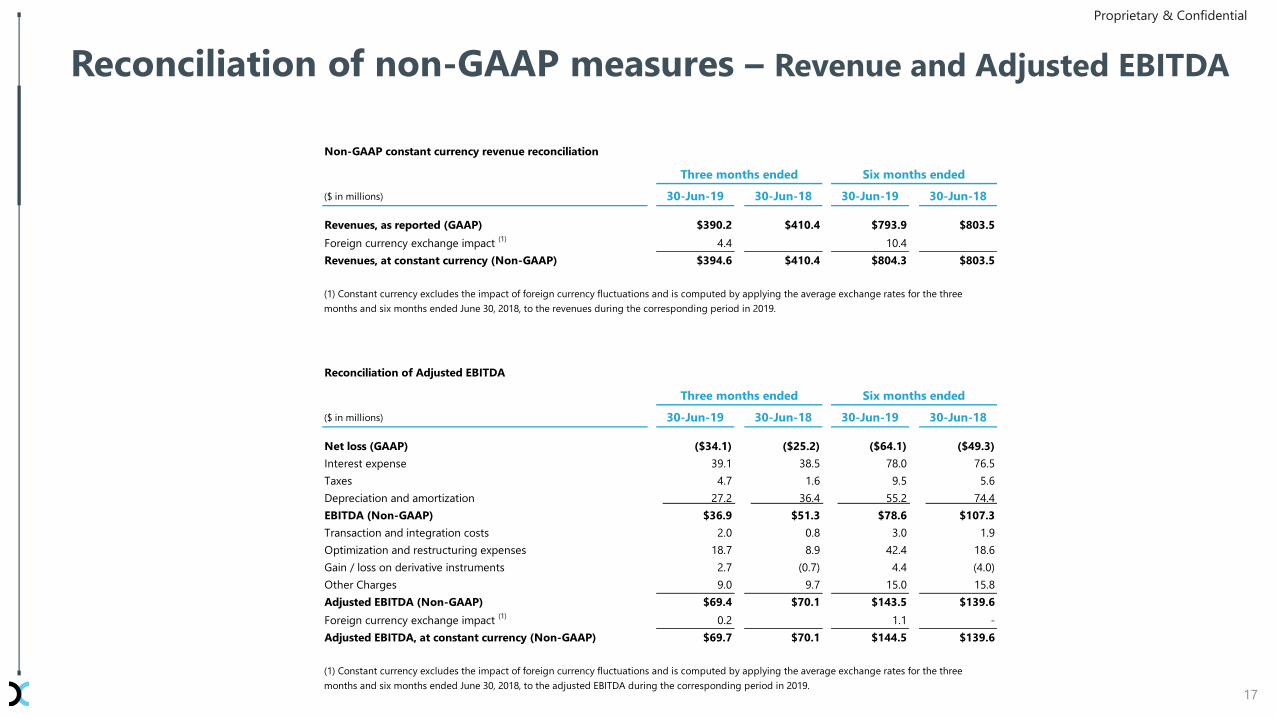
Reconciliation of non-GAAP measures – Revenue and Adjusted EBITDA
17
Proprietary & Confidential
Non-GAAP constant currency revenue reconciliation
30-Jun-19 30-Jun-18 30-Jun-19 30-Jun-18
Revenues, as reported (GAAP) $390.2 $410.4 $793.9 $803.5
Foreign currency exchange impact (1)
4.4 10.4
Revenues, at constant currency (Non-GAAP) $394.6 $410.4 $804.3 $803.5
Reconciliation of Adjusted EBITDA
30-Jun-19 30-Jun-18 30-Jun-19 30-Jun-18
Net loss (GAAP) ($34.1) ($25.2) ($64.1) ($49.3)
Interest expense 39.1 38.5 78.0 76.5
Taxes 4.7 1.6 9.5 5.6
Depreciation and amortization 27.2 36.4 55.2 74.4
EBITDA (Non-GAAP) $36.9 $51.3 $78.6 $107.3
Transaction and integration costs 2.0 0.8 3.0 1.9
Optimization and restructuring expenses 18.7 8.9 42.4 18.6
Gain / loss on derivative instruments 2.7 (0.7) 4.4 (4.0)
Other Charges 9.0 9.7 15.0 15.8
Adjusted EBITDA (Non-GAAP) $69.4 $70.1 $143.5 $139.6
Foreign currency exchange impact (1)
0.2 1.1 -
Adjusted EBITDA, at constant currency (Non-GAAP) $69.7 $70.1 $144.5 $139.6
(1) Constant currency excludes the impact of foreign currency fluctuations and is computed by applying the average exchange rates for the three
months and six months ended June 30, 2018, to the adjusted EBITDA during the corresponding period in 2019.
($ in millions)
Three months ended Six months ended
(1) Constant currency excludes the impact of foreign currency fluctuations and is computed by applying the average exchange rates for the three
months and six months ended June 30, 2018, to the revenues during the corresponding period in 2019.
($ in millions)
Three months ended Six months ended