second quarter 2014 release slides
TRANSCRIPT

Q2 2014 Financial Results
August 8, 2014
Michael Ansley President, CEO & Board Chairman
David G. Burke Chief Financial Officer & Treasurer
NASDAQ: BAGR © 2014 by Diversified Restaurant Holdings, Inc. 1

Safe Harbor Statement
© 2014 by Diversified Restaurant Holdings, Inc. 2
The information made available in this presentation contains forward-looking statements which reflect the Company’s current view of future events, results of operations, cash flows, performance, business prospects and opportunities. Wherever used, the words "anticipate," "believe," "expect," "intend," "plan," "project," "will continue," "will likely result," "may," and similar expressions identify forward-looking statements as such term is defined in the Securities Exchange Act of 1934. Any such forward-looking statements are subject to risks and uncertainties and the Company's actual growth, results of operations, financial condition, cash flows, performance, business prospects and opportunities could differ materially from historical results or current expectations. Some of these risks include, without limitation, the impact of economic and industry conditions, competition, food and drug safety issues, store expansion and remodeling, labor relations issues, costs of providing employee benefits, regulatory matters, legal and administrative proceedings, information technology, security, severe weather, natural disasters, accounting matters, other risk factors relating to our business or industry and other risks detailed from time to time in the Securities and Exchange Commission filings of DRH. Forward-looking statements contained herein speak only as of the date made and, thus, DRH undertakes no obligation to update or publicly announce the revision of any of the forward-looking statements contained herein to reflect new information, future events, developments or changed circumstances or for any other reason.
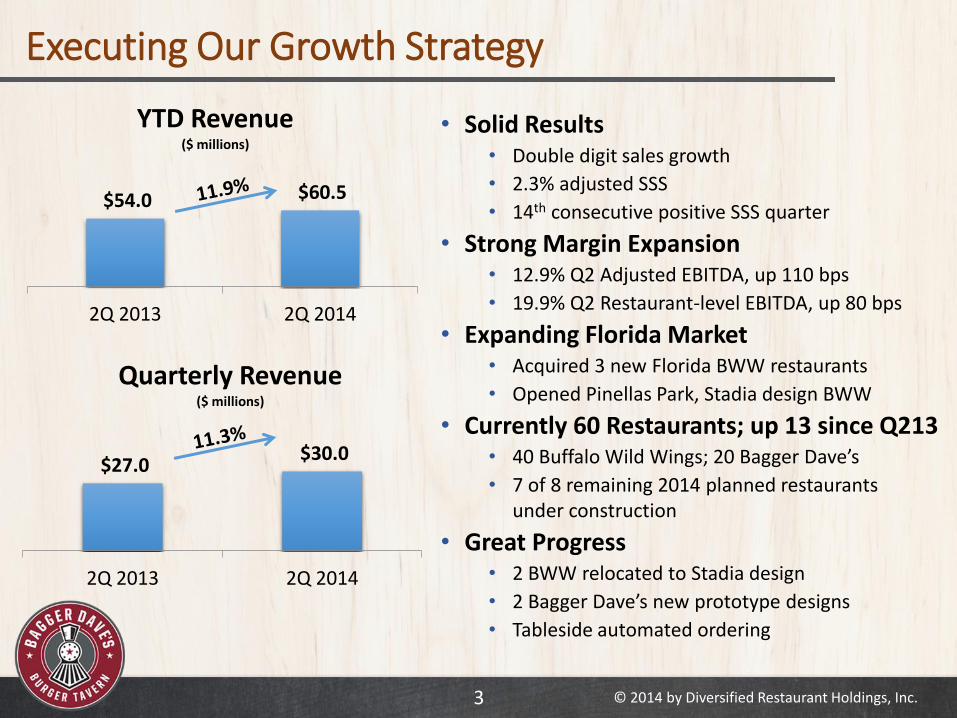
Executing Our Growth Strategy
© 2014 by Diversified Restaurant Holdings, Inc. 3
$27.0 $30.0
2Q 2013 2Q 2014
Quarterly Revenue ($ millions)
• Solid Results • Double digit sales growth
• 2.3% adjusted SSS
• 14th consecutive positive SSS quarter
• Strong Margin Expansion • 12.9% Q2 Adjusted EBITDA, up 110 bps
• 19.9% Q2 Restaurant-level EBITDA, up 80 bps
• Expanding Florida Market • Acquired 3 new Florida BWW restaurants
• Opened Pinellas Park, Stadia design BWW
• Currently 60 Restaurants; up 13 since Q213 • 40 Buffalo Wild Wings; 20 Bagger Dave’s
• 7 of 8 remaining 2014 planned restaurants under construction
• Great Progress • 2 BWW relocated to Stadia design
• 2 Bagger Dave’s new prototype designs
• Tableside automated ordering
$54.0 $60.5
2Q 2013 2Q 2014
YTD Revenue ($ millions)

• Chicken wing costs $1.40/lb; down $0.21
• Seeing wing cost creep
Best-In-Class Cost Discipline
© 2014 by Diversified Restaurant Holdings, Inc. 4
$8.0
$8.6
2Q 2013 2Q 2014
Food, Beverage, and Packaging Costs
($ Millions)
$6.9 $7.8
2Q 2013 2Q 2014
Compensation Costs ($ Millions)
25.5% 25.9% 29.7% 28.7%
• Retaining top talent as we continue our growth
• Investment in enhanced training programs for our team members

Managing Operating Expenses
© 2014 by Diversified Restaurant Holdings, Inc. 5
$0.8 $0.9
2Q 2013 2Q 2014
Pre-Opening Costs ($ Millions)
$2.0 $2.1
2Q 2013 2Q 2014
General & Admin. ($ Millions)
• Average pre-opening cost per restaurant is down from 2Q 2013
7.3% 7.0% 3.0% 3.0%
• Gaining leverage on increased volume

EBITDA Margin Expansion Q2 2014
© 2014 by Diversified Restaurant Holdings, Inc. 6
$5.2 $6.0
2Q 2013 2Q 2014
Restaurant-Level EBITDA ($ Millions)
$3.2 $3.9
2Q 2013 2Q 2014
Adjusted EBITDA
($ Millions)
• Restaurant-level EBITDA was up 15.8%
• 80 basis point improvement in Restaurant-level EBITDA margin
19.1% 19.9%
• Adjusted EBITDA increased 21.7%
• Adjusted EBITDA margin expanded 110 basis points
12.9% 11.8%

EBITDA Margin Expansion 1H 2014
© 2014 by Diversified Restaurant Holdings, Inc. 7
$9.8
$11.8
1H 2013 1H 2014
Restaurant-Level EBITDA ($ Millions)
$6.3 $7.6
1H 2013 1H 2014
Adjusted EBITDA
($ Millions)
• Restaurant-level EBITDA up 20.9%
• 140 basis point margin improvement
18.1% 19.5%
• Adjusted EBITDA up 21.2%
• 100 basis point margin expansion
12.6% 11.6%

Financial Strength
© 2014 by Diversified Restaurant Holdings, Inc. 8
$18.1 $17.3
1Q 2014 2Q 2014
Cash, Cash Equivalents & Investments
($ Millions)
$6.5 $8.7
2Q 2013 2Q 2014
Capital Expenditures ($ Millions)
$1.30
$1.32
2013 Q2 2014
Book Value Per Share

2014 Guidance & Outlook
© 2014 by Diversified Restaurant Holdings, Inc. 9
* Guidance provided on 8/8/2014
Fiscal 2014 Guidance*
Revenue $128.0 million to $133.0 million
Restaurant-Level EBITDA $22.6 million to $24.1 million
Adjusted EBITDA $14.0 million to $15.0 million
Capital Expenditures $33.0 million to $36.0 million

Enhancing Customer Experience
© 2014 by Diversified Restaurant Holdings, Inc. 10
Driving Brand Evolution
• New interior and exterior design drives customer excitement
• Opened three Buffalo Wild Wings Stadia restaurants in 2014
• Opened two new Bagger Dave’s prototype restaurants in 2014
• All Bagger Dave’s using table-side handheld ordering
• 22 Buffalo Wild Wings restaurants offer online ordering
Buffalo Wild Wings Stadia Design Bagger Dave’s Prototype Interior

Bagger Dave’s Menu Media Coverage
© 2014 by Diversified Restaurant Holdings, Inc. 11
• Fresh, diverse menu offerings continue to generate customer and media excitement
• Featured on several local news broadcasts
• Menu offerings generating buzz:
• 8oz Prime Rib Recipe Burger
• Farm-Raised Grilled Chicken Breast
• Turkey Burger
• Custom Made Sauces
• Chopped Salads
• Fresh-made Mac & Cheese
• Fresh Hand-cut Fries
• Hand-cut Sweet Potato Chips
• Local Craft Beers
• Own-brand soda & specialty flavors

Solid Progress
• Higher effectiveness with marketing spend
• Productivity is a constant priority: Automated, table side ordering
• Florida acquisition provides excellent market position in strong area
• Bagger Dave’s concept is gaining increased momentum as unit growth continues
12
Supplemental Information
NASDAQ: BAGR © 2014 by Diversified Restaurant Holdings, Inc. 13

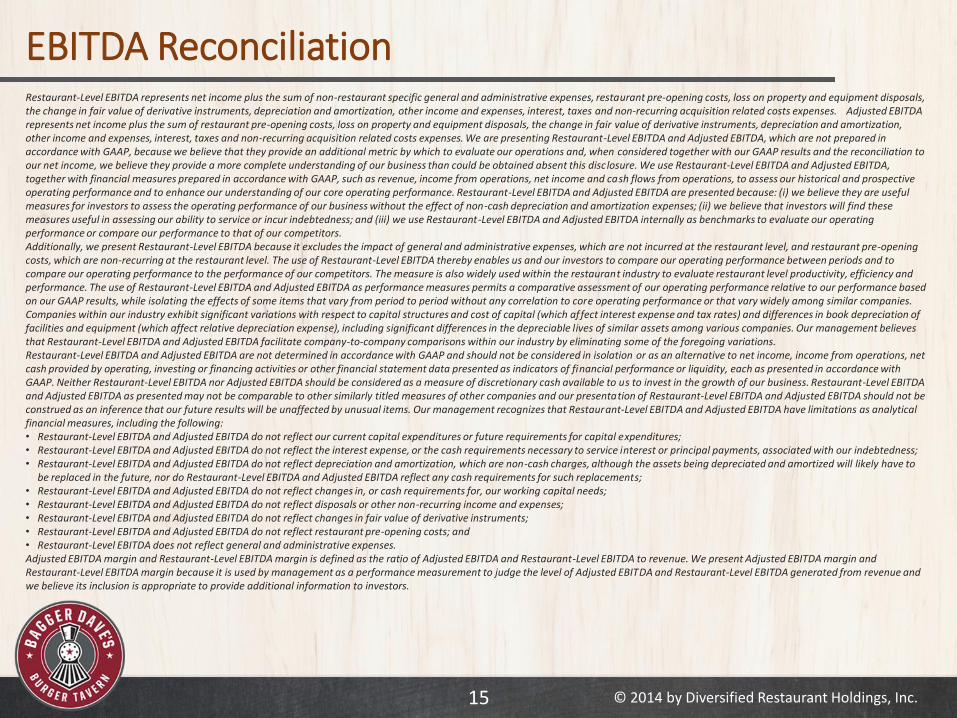
EBITDA Reconciliation
© 2014 by Diversified Restaurant Holdings, Inc.
Three Months Ended Six Months Ended
June 29 June 30 June 29 June 30
2014 2013 2014 2013
Net income (loss) attributable to DRH $ (100,496) $ 3,637 $ 267,361 $ 242,037
+ Income tax provision (78,872) (35,190) (131,930) 66,630
+ Interest expense 476,634 585,637 953,035 1,054,848
+ Other income, net (5,607) (22,224) (18,637) (24,543) + Loss on disposal of property and equipment 164,255 25,667 320,320 60,741
+ Depreciation and amortization 2,498,871 1,813,549 4,746,331 3,469,033
EBITDA $ 2,954,785 $ 2,371,076 $ 6,136,480 $ 4,868,746
+ Pre-opening costs 910,115 803,798 1,454,136 1,396,524
Adjusted EBITDA $ 3,864,900 $ 3,174,874 $ 7,590,616 $ 6,265,270
Adjusted EBITDA margin (%) 12.9% 11.8% 12.6% 11.6%
+ General and administrative 2,099,684 1,975,825 4,212,246 3,499,955
Restaurant–Level EBITDA $ 5,964,584 $ 5,150,699 $ 11,802,862 $ 9,765,225
Restaurant–Level EBITDA margin (%) 19.9% 19.1% 19.5% 18.1%
14
EBITDA Reconciliation
© 2014 by Diversified Restaurant Holdings, Inc.
Restaurant-Level EBITDA represents net income plus the sum of non-restaurant specific general and administrative expenses, restaurant pre-opening costs, loss on property and equipment disposals, the change in fair value of derivative instruments, depreciation and amortization, other income and expenses, interest, taxes and non-recurring acquisition related costs expenses. Adjusted EBITDA represents net income plus the sum of restaurant pre-opening costs, loss on property and equipment disposals, the change in fair value of derivative instruments, depreciation and amortization, other income and expenses, interest, taxes and non-recurring acquisition related costs expenses. We are presenting Restaurant-Level EBITDA and Adjusted EBITDA, which are not prepared in accordance with GAAP, because we believe that they provide an additional metric by which to evaluate our operations and, when considered together with our GAAP results and the reconciliation to our net income, we believe they provide a more complete understanding of our business than could be obtained absent this disclosure. We use Restaurant-Level EBITDA and Adjusted EBITDA, together with financial measures prepared in accordance with GAAP, such as revenue, income from operations, net income and cash flows from operations, to assess our historical and prospective operating performance and to enhance our understanding of our core operating performance. Restaurant-Level EBITDA and Adjusted EBITDA are presented because: (i) we believe they are useful measures for investors to assess the operating performance of our business without the effect of non-cash depreciation and amortization expenses; (ii) we believe that investors will find these measures useful in assessing our ability to service or incur indebtedness; and (iii) we use Restaurant-Level EBITDA and Adjusted EBITDA internally as benchmarks to evaluate our operating performance or compare our performance to that of our competitors. Additionally, we present Restaurant-Level EBITDA because it excludes the impact of general and administrative expenses, which are not incurred at the restaurant level, and restaurant pre-opening costs, which are non-recurring at the restaurant level. The use of Restaurant-Level EBITDA thereby enables us and our investors to compare our operating performance between periods and to compare our operating performance to the performance of our competitors. The measure is also widely used within the restaurant industry to evaluate restaurant level productivity, efficiency and performance. The use of Restaurant-Level EBITDA and Adjusted EBITDA as performance measures permits a comparative assessment of our operating performance relative to our performance based on our GAAP results, while isolating the effects of some items that vary from period to period without any correlation to core operating performance or that vary widely among similar companies. Companies within our industry exhibit significant variations with respect to capital structures and cost of capital (which affect interest expense and tax rates) and differences in book depreciation of facilities and equipment (which affect relative depreciation expense), including significant differences in the depreciable lives of similar assets among various companies. Our management believes that Restaurant-Level EBITDA and Adjusted EBITDA facilitate company-to-company comparisons within our industry by eliminating some of the foregoing variations. Restaurant-Level EBITDA and Adjusted EBITDA are not determined in accordance with GAAP and should not be considered in isolation or as an alternative to net income, income from operations, net cash provided by operating, investing or financing activities or other financial statement data presented as indicators of financial performance or liquidity, each as presented in accordance with GAAP. Neither Restaurant-Level EBITDA nor Adjusted EBITDA should be considered as a measure of discretionary cash available to us to invest in the growth of our business. Restaurant-Level EBITDA and Adjusted EBITDA as presented may not be comparable to other similarly titled measures of other companies and our presentation of Restaurant-Level EBITDA and Adjusted EBITDA should not be construed as an inference that our future results will be unaffected by unusual items. Our management recognizes that Restaurant-Level EBITDA and Adjusted EBITDA have limitations as analytical financial measures, including the following: • Restaurant-Level EBITDA and Adjusted EBITDA do not reflect our current capital expenditures or future requirements for capital expenditures; • Restaurant-Level EBITDA and Adjusted EBITDA do not reflect the interest expense, or the cash requirements necessary to service interest or principal payments, associated with our indebtedness; • Restaurant-Level EBITDA and Adjusted EBITDA do not reflect depreciation and amortization, which are non-cash charges, although the assets being depreciated and amortized will likely have to
be replaced in the future, nor do Restaurant-Level EBITDA and Adjusted EBITDA reflect any cash requirements for such replacements; • Restaurant-Level EBITDA and Adjusted EBITDA do not reflect changes in, or cash requirements for, our working capital needs; • Restaurant-Level EBITDA and Adjusted EBITDA do not reflect disposals or other non-recurring income and expenses; • Restaurant-Level EBITDA and Adjusted EBITDA do not reflect changes in fair value of derivative instruments; • Restaurant-Level EBITDA and Adjusted EBITDA do not reflect restaurant pre-opening costs; and • Restaurant-Level EBITDA does not reflect general and administrative expenses. Adjusted EBITDA margin and Restaurant-Level EBITDA margin is defined as the ratio of Adjusted EBITDA and Restaurant-Level EBITDA to revenue. We present Adjusted EBITDA margin and Restaurant-Level EBITDA margin because it is used by management as a performance measurement to judge the level of Adjusted EBITDA and Restaurant-Level EBITDA generated from revenue and we believe its inclusion is appropriate to provide additional information to investors.
15