second part of d9.4
TRANSCRIPT
GA MOVE/FP7/265499/Green eMotion WP 9: Deliverable 9.4. Part 2 Page 1 of 70
Deliverable 9.4 Part 2
Envisaged EU mobility models, role of involvedentities, and Cost Benefit Analysis in thecontext of the European Clearing House
mechanism
Prepared by:
Carlos Madina, [email protected]
Date: February 27th 2015
Version: 1.2

GA MOVE/FP7/265499/Green eMotion WP 9: Deliverable 9.4. Part 2 Page 2 of 70
Document InformationAuthors
Name CompanyKey authors Carlos Madina TECNALIA
Eduardo Zabala TECNALIAInés Gómez TECNALIA
Further authors Heike Barlag SIEMENSThomas Gereke SIEMENSSven Jundel RWEHilke Rösler ECNOmar Usmani ECNMichael Hajesch BMWGiovanni Coppola ENELMiguel Cruz IRECMargaret O’Mahony TCD
DistributionDissemination levelPU Public XPP Restricted to other programme participants (including the Commission Services)RE Restricted to a group specified by the consortium (including the Commission Services)CO Confidential, only for members of the consortium (including the Commission Services)
Revision historyVersion Date Author Description1.0 February 6, 2015 TECNALIA Initial version1.1 February 13, 2015 TECNALIA Executive summary and section 6.2 added1.2 February 27, 2015 TECNALIA Comments by WPL and External reviewer
StatusFor InformationDraft VersionFinal Version (Internal document)Submission for Approval (deliverable) XFinal Version (deliverable, approved on)

GA MOVE/FP7/265499/Green eMotion WP 9: Deliverable 9.4. Part 2 Page 3 of 70
Table of Contents
1 Executive summary ........................................................................................................................ 6
2 Introduction .................................................................................................................................... 7
2.1 Business models analysis in Green eMotion ................................................................................... 7
2.2 Electric mobility and regulatory and commercial frameworks ........................................................... 7
2.3 Scope and results in the first part of D9.4 ........................................................................................ 9
2.4 Scope of the document ................................................................................................................. 10
2.5 Methodology ................................................................................................................................. 11
3 Traffic hotspot charging service .................................................................................................... 23
3.1 Base case .................................................................................................................................... 23
3.2 Sensitivity analysis ....................................................................................................................... 26
4 Highway charging service ............................................................................................................. 32
4.1 Base case .................................................................................................................................... 32
4.2 Sensitivity analysis ....................................................................................................................... 36
5 Private home charging service ...................................................................................................... 45
5.1 Base case .................................................................................................................................... 45
5.2 Sensitivity analysis ....................................................................................................................... 47
6 Public charging spot for street side parking ................................................................................... 55
6.1 Base case .................................................................................................................................... 57
6.2 Sensitivity analysis ....................................................................................................................... 60
7 Summary and discussion .............................................................................................................. 65
8 References ................................................................................................................................... 68
GA MOVE/FP7/265499/Green eMotion WP 9: Deliverable 9.4. Part 2 Page 4 of 70
List of Figures
Figure 1: Green eMotion Building Blocks ................................................................................................. 8Figure 2: Bilateral versus multi-lateral contracting .................................................................................... 9Figure 3: Process to obtain the required public charging spot for street side parking usage rate............. 56Figure 4: Required EVSE usage rate for EV mileage cost to compete against diesel vehicles ................ 67
List of Tables
Table 1: Target values for Quality of Service KPIs ................................................................................. 12Table 2: Target values for Time KPIs..................................................................................................... 12Table 3: Estimates of marketplace and Clearing House costs for future demand scenarios .................... 13Table 4: Battery sizes and ranges of the EVs sold by OEMs in Green eMotion ...................................... 23Table 5: Values for the parameters in the Traffic Hotspot charging service (base case) ......................... 24Table 6: Values for the parameters in the Traffic Hotspot charging service (Germany) ........................... 29Table 7: Values for the parameters in the Traffic Hotspot charging service (The Netherlands) ............... 30Table 8: Values for the parameters in the Highway charging service (base case) .................................. 33Table 9: Highway EVSE usage requirements for different co-financing alternatives (bigger battery size) 37Table 10: Values for the parameters in the Highway charging service (Germany) .................................. 38Table 11: Values for the parameters in the Highway charging service (The Netherlands) ....................... 40Table 12: Number of filling stations per owner in Spain (December 2013) .............................................. 42Table 13: Values for the parameters in the Private Home charging service (base case) ......................... 45Table 14: Values for the parameters in the Private Home charging service (Germany) .......................... 49Table 15: Values for the parameters in the Private Home charging service (The Netherlands) ............... 50Table 16: Values for the parameters in the Public charging spot for street side parking service (base
case) .............................................................................................................................................. 57Table 17: Values for the parameters in the Public charging spot for street side parking service (The
Netherlands) .................................................................................................................................. 63

GA MOVE/FP7/265499/Green eMotion WP 9: Deliverable 9.4. Part 2 Page 5 of 70
List of Abbreviations
BM Business ModelDSO Distribution System OperatorEC European CommissionEMO Electricity Market OperatorEU European UnionEV Electric VehicleEVSE Electric Vehicle Supply Equipment (charger)EVSP Electric Vehicle Service ProviderICE Internal Combustion EngineKPI Key Performance IndicatorsNPE German National Platform for Electric MobilityOEM Original Equipment ManufacturerO&M Operation and MaintenancePI Performance IndicatorsRFID Radio-Frequency IdentificationSOC State of ChargeTCO Total Cost of OwnershipTOU Time of UseTSO Transmission System OperatorVAT Value-Added TaxWP Work Package
For more information on roles, actors and their definition please refer to the GeM glossary1.
1 The electromobility glossary available at http://www.greenemotion-project.eu/

GA MOVE/FP7/265499/Green eMotion WP 9: Deliverable 9.4. Part 2 Page 6 of 70
1 Executive summaryThe business models (BM) analysis performed in Green eMotion seeks to identify the BMs most suited tofacilitate large-scale electric vehicles (EV) roll-out in terms of social acceptance, commercial viability andsystem/environmental impact. After the first part of this deliverable [D9.4] made a detailed economicimpact of the deployment of publicly accessible slow charging infrastructure in the whole ecosystem ofactors, this second part assesses the impact on the main actors (EVSE Operators and EV customers) infour different charging services, to account for the different charging alternatives that EV customers mayhave for charging their EVs:
1. Traffic hotspot charging: Charging at a publicly accessible EVSE on private domain. The chargingspeed is assumed to be semi-fast (22 kW). EV customers pay for EV charging and for parkingtheir EV, so it is assumed that they pay directly to the operator of the traffic hotspot who, hence,acts both as EVSP and EVSE Operator (no roaming required and, thus, no marketplace).
2. Highway charging: Charging at a publicly accessible EVSE on private or public domain. Thecharging speed is assumed to be fast (50 kW). EV customers pay for EV charging, so it isassumed that they use the roaming agreement of their EVSP with the EVSE Operator (through aroaming agreement) to be able to charge their EVs.
3. Private home charging: Charging at a private EVSE. The charging speed is assumed to be slow(3.7 kW). EV customers themselves buy the EVSE required for charging their EVs (they act asEVSE Operator) and buy electricity directly from the Electricity retailer (which performs the EVSProle in this case), so there is no need for a roaming agreement.
4. Public charging spot for street side parking: Charging is made at a publicly accessible EVSE onpublic domain. The charging speed is assumed to be semi-fast (22 kW). Roaming of EVcustomers is made through a roaming agreement, where both the EVSP and the EVSE Operatorare subscribed.
The analysis presented in this second part of the deliverable looks further into the future (medium term),where the assumed number of EVs on the road is sufficient to support the development of public charginginfrastructure.
In order to assess whether there is room for developing a positive business model for all the actorsinvolved in the ecosystem, the analysis assumes that each EVSE Operator, as well as the EVSP, use apricing strategy which allows them to recover their costs. Then, the effect on EV customers is comparedwith a similar situation for an Internal Combustion Engine (ICE) vehicle driver.
Private home charging is expected to be the preferred charging alternative by those EV customers whocan charge their EVs at home, while public charging spot for street side parking is likely to be the mostused option for those EV customers without access to private home charging. As a result, the total cost ofownership (TCO) for EV customers is compared with the cost of owning an ICE vehicle with an equivalentusage rate. On the contrary, traffic hotspot charging and highway charging are expected to be used quiteseldom by EV customers (almost only when they require extending their range and cannot use the othertwo services) and, hence, they are not likely to have a big impact on their TCO. Therefore, the relativecost of a single, equivalent trip for EV customers and for drivers of ICE vehicles is compared.
The analysis presented in this report shows that EV customers with private home charging availability arelikely to be the early adopters of electric mobility, as long as they need to use their EVs regularly andsubsidies for EV purchase exist. Then, as EV market grows, publicly accessible EVSE with semi-fastcharging capabilities are likely to appear in cities and traffic hotspots. In the meantime, technologydevelopment is expected to increase driving ranges while reducing costs, so that highway charging canalso be profitable in the medium term. Until these technological developments materialise, electricmobility should be supported by a favourable regulatory framework, both for EV customers and for thedeployment of the charging infrastructure.

GA MOVE/FP7/265499/Green eMotion WP 9: Deliverable 9.4. Part 2 Page 7 of 70
2 Introduction2.1 Business models analysis in Green eMotionThe business models (BM) analysis performed in Green eMotion seeks to identify the BMs most suited tofacilitate large-scale electric vehicles (EV) roll-out in terms of social acceptance, commercial viability andsystem/environmental impact.
The economic assessment presented in this report is based on the outcome of several workshops,meetings and phone conferences devoted to the BMs topic in Green eMotion. Among others, partnerscontributing to such discussions include vehicle manufacturers (BMW, Nissan, Daimler), electric utilities(RWE, Enel), equipment manufacturers (Siemens, Bosch) and ICT companies (IBM), which ensures therelevance of the data and assumptions considered in the analysis2.
This document contains an evaluation of the economic performance of the BMs related to electric mobilitywithin Green eMotion project3, as part of Task 9.3. This evaluation is an extension of the analysisperformed in the first part of this deliverable D9.4 [D9.4]. The reader is strongly encouraged to read thefirst part of the report before going into the details of this second part.
2.2 Electric mobility and regulatory and commercial frameworksEV-related BMs are networked business models, in which several actors interrelate with each other andall call for a positive business case. Therefore, the BM analysis does not only focus on the actors whowant to launch the business (e.g. Electric Vehicle Supply Equipment (EVSE) Operator or Electric VehicleService Provider (EVSP)), but also on all the players that must or can be involved across the value chain,including some regulated companies (such as Transmission System Operator (TSO), Distribution SystemOperator (DSO) or Electricity Market Operator (EMO)) and liberalized stakeholders (such as electricityretailers or producers).
The different connections between the different actors are presented in Figure 1.
2 In addition to the meetings stated in the first part of this report, regular monthly teleconferences wereheld between core contributors to the document and with Task 9.5 participants throughout 2014. Theseteleconferences were further complemented with a final workshop in Munich (October 2014), where thefinal data assumptions were agreed between all participants. The conclusions were then presented to therest of the consortium for their feedback and, where required, adapted accordingly.3 http://www.greenemotion-project.eu/ [access in February 2015].

GA MOVE/FP7/265499/Green eMotion WP 9: Deliverable 9.4. Part 2 Page 8 of 70
Figure 1: Green eMotion Building Blocks
The actors in this network may have different roles and responsibilities, and the relationships betweenthem may also be different, i.e. different market models may exist [EURELECTRIC 2013]. Each marketmodel creates different options for contractual arrangements between actors:
· Roaming may be necessary (when there is a complete unbundling of roles for the EVSP, EVSEOperator and DSO) or optional (if the EVSP is also the EVSE Operator, when EV customers usean EVSE operated by their EVSP would not need roaming, but they would if they charge in anEVSE operated by another EVSP).
· Charging service may include electricity or not, i.e. EV customers may receive an all-inclusiveservice from a single supplier (their EVSP provides access to charging infrastructure andelectricity for charging the EV) or they may need to pay for access to the EVSE (either from theEVSP or from the EVSE operator) and for the electricity (e.g. by selecting their electricity retaileron the EVSE) separately.
Moreover there is a number of alternatives for the characteristics of the EV charging process, including:
· The place where charging takes place: publicly accessible EVSE in public domain (curb side),publicly accessible EVSE in private domain (malls, airports…), restricted-access EVSE in privatedomain (workplaces for charging employees’ private cars or EV fleets) or private EVSE (home).
· The type of charging technology: conductive or inductive charging, battery swapping…
· The speed of charging: slow (e.g. 3.7 kW), semi-fast (11 kW or 22 kW) or fast (50 kW or more).
The contractual relationships between the different parties (in particular, between EVSPs and EVSEOperators) may also be of bilateral nature, or they may subscribe to a marketplace for selling and buyingelectric mobility services, including the clearing of the charging sessions. In the first case, EV customerswill only be able to charge their EVs if their EVSP has a direct contract with the EVSE Operator of theEVSE in which they want to charge. In the second one, their EVSP has a contract with a third party (themarketplace operator) and they are able to charge in any EVSE operated by an EVSE Operator having acontract with the same third party. Figure 2 below presents the difference between both approaches.

GA MOVE/FP7/265499/Green eMotion WP 9: Deliverable 9.4. Part 2 Page 9 of 70
Figure 2: Bilateral versus multi-lateral contracting
Conducting a detailed analysis of all the alternatives would have been impossible, so certain choiceswere required to be made at the very early stage of the analysis. In order to adopt the most generic case,the unbundled market model is considered4 in general. In the unbundled business model for the service“basic charging” the DSO, the electricity retailer, the EVSP and the EVSE operator are different legalentities. The outcomes presented here are therefore related to an unbundled business model where allactors are independent from each other.
Under this market model, roaming is required, so that the different actors have contracts in place thatfinally allow the EVSP to offer charging services to the EV customer (EV driver) using the EVSEs of theEVSE operator. As a result the EVSE operator has the possibility to bill the EVSP for the charging event.In this case, the most natural approach is to consider that electricity is included in the charging[EURELECTRIC 2013].
2.3 Scope and results in the first part of D9.4In the first part of the deliverable [D9.4], the scope of the analysis was further narrowed by onlyconsidering slow (3.7 kW) publicly accessible charging infrastructure (either in public or private domain)and that both the EVSP and the EVSE Operator have a subscription to the marketplace.
In order to derive concrete numbers for the analysis of the business model, a mid-term basic businessscenario was created. Therein it was assumed that the EVSP has 50 000 EV customers and the EVSEoperator runs 10 000 EVSEs. The EV customers were assumed to charge once per day at public EVSEs.The average energy charged was 3 kWh, which was in line with the data collected in Green eMotiondemo regions [Brady 2013]. The latter assumption means that the EV customer would charge publicly foran equivalent of 9100 km/year (calculated with an average value of 120 Wh/km), which is close to theannual average for European Union (EU) cars [EC 2013, 2].
The number of EV customers in the analysis was always expressed relative to one EVSP, meaning thatwe considered a market segment that was covered by one EVSP. If for example one country had severalEVSPs, the number of EV customers in that country would be the sum of the EV customers of all EVSPsin that country. Likewise, the outcome was calculated for only one EVSE operator as an increase of theirnumber would have increased the complexity of the business case analysis significantly.
4 It is easier to make the analysis for the completely unbundled market model and, then, assess any othermarket model by adding the results of the required roles (also taking into account the cost synergies) thananalysing any other market model and trying to estimate the results components for the different rolesperformed by a single actor.

GA MOVE/FP7/265499/Green eMotion WP 9: Deliverable 9.4. Part 2 Page 10 of 70
These results in the first part of the deliverable led to the conclusion that the business case of slow, publiccharging as a stand-alone business (not linked to any other activity) can only be profitable within suchmid-term business scenario that features highly frequented EVSEs located at points of interest or fastcharging at highways, so that people are willing to pay for the usage and usage time is short enough toallow for several charging events per day. Outside of this niche, there does not appear to be a positivebusiness case for developing the EV charging infrastructure.
In addition to the BM analysis discussed above, the first part of D9.4 also elaborated a structured set ofkey performance indicators (KPIs) and performance indicators (PIs), which can be used by the users ofthe Green eMotion marketplace to assess the quality and effectiveness of electric mobility servicesprovided through the system. The defined performance indicators were grouped into four categories(cost, time, quality of service and service performance) that address varying operational and businessaspects that may be of interest. A detailed description of the methodology used for the selection,description and specification of the PIs and KPIs for each use case was included.
2.4 Scope of the documentThe analysis in the first part complied with the two conditions required at that time. On the one hand, itanalysed a situation which was possible and important for the European Commission (EC), because theDirective for Alternative Fuels [OJ L307/1] was still under discussion. On the other hand, the scope wasnarrow enough so that results could be obtained, despite the complexity of the environment for theanalysis.
Nevertheless, the large-scale roll-out of EVs will not only depend on publicly accessible (slow) charginginfrastructure, but it also requires the existence of private charging and fast (between 22 kW and 50 kW,or even more in the future) and semi-fast (11 or 22 kW) charging on highways or traffic hotspots.
Therefore, this deliverable analyses other charging alternatives. In order to cover as broad a scope aspossible, while being efficient from the point of view of effort invested into the analysis, four EV chargingservices are considered, to represent different alternatives EV customers may have for charging their EVsin the future (more details can be found in chapters 3 to 6, one per charging service):
1. Traffic hotspot charging: Charging at a publicly accessible EVSE on private domain. The chargingspeed is assumed to be semi-fast (22 kW). EV customers pay for EV charging and for parkingtheir EV, so it is assumed that they pay directly to the operator of the traffic hotspot who, hence,acts as EVSP and EVSE Operator at the same time (no roaming required and, thus, nomarketplace).
2. Highway charging: Charging at a publicly accessible EVSE on private or public domain. Thecharging speed is assumed to be fast (50 kW). EV customers pay for EV charging, so it isassumed that they use the roaming agreement of their EVSP with the EVSE Operator (through aroaming agreement) to be able to charge their EVs.
3. Private home charging: Charging at a private EVSE. The charging speed is assumed to be slow(3.7 kW). EV customers themselves buy the EVSE required for charging their EVs (they act asEVSE Operator) and buy electricity directly from the Electricity retailer (which performs the EVSProle in this case), so there is no need for a roaming agreement.
4. Public charging spot for street side parking: Charging is made at a publicly accessible EVSE onpublic domain. The charging speed is assumed to be semi-fast (22 kW). Roaming of EVcustomers is made through a roaming agreement, where both the EVSP and the EVSE Operatorare subscribed.
In all the cases, conductive charging is considered, as it is the one expected to meet most of the chargingevents, at least in the short- to medium-term.

GA MOVE/FP7/265499/Green eMotion WP 9: Deliverable 9.4. Part 2 Page 11 of 70
It is assumed that each charging service corresponds to one individual EVSE Operator5. In this way themain actors for the analysis are EV customers (who are the EVSE Operators of the private homecharging service), the EVSP (who offers electric mobility services to EV customers in all chargingalternatives and roaming services too in the highway and in the public charging spot for street sideparking charging services), the traffic hotspot operator (who is the EVSP and the EVSE Operator in thetraffic hotspot charging service), the highway charging EVSE Operator and the public charging spotoperator.
Although the pace of electric mobility adoption is not as fast as expected at the beginning of the decade,the strong commitment by public bodies, electric utilities and original equipment manufacturers (OEMs) isslowly setting the conditions for a more massive adoption of EVs. In order to be able to have profitableBMs related to electric mobility, it is of paramount importance that there is an EV market behind them.The usage patterns considered in this report are, as stated in footnote 2, the result of expert opinions ofGreen eMotion partners for the medium term future perspective, when there is expected to be a criticalmass of EVs necessary to allow for a visible demand of EV charging in publicly accessible EVSE.
2.5 MethodologyIn order to assess whether there is room for developing a positive business model for all the actorsinvolved in the ecosystem, the analysis assumes that both the EVSE Operator and the EVSP use apricing strategy which allows them recover their costs. Then, the effect on EV customers is comparedwith a similar situation for an Internal Combustion engine (ICE) vehicle driver. The main cost componentsfor the different actors are presented in the subsections below.
2.5.1 Marketplace OperatorStarting from the KPI analysis in the first part of this deliverable, target values for the different KPIs wereestablished in discussion with WP3 partners. This was done by defining target values for the quality ofservice and time related KPIs, and for three usage levels linked to three future horizon levels consideredin the first part (service performance).
Table 1 and Table 2 present quality of service and time KPIs, respectively.
5 Although more than one charging service could be offered by a single EVSE Operator, the only costwhich does not depend on the number of EVSE (and, hence, can be reduced if more than one type ofcharging service is provided) is the cost of accessing the marketplace (see section 2.5.1). This cost canbe relevant in the highway charging service, whose impact is assessed in sections 4.2.6, and in the publiccharging spot for street side parking, where several EVSE are already considered.

GA MOVE/FP7/265499/Green eMotion WP 9: Deliverable 9.4. Part 2 Page 12 of 70
PI Description Value
PI- 61 Percentage of search results that cannot be fulfilled 2%
PI- 8 Percentage not sent roaming authorization 2%
PI-36 Percentage not granted charging reduction service requests 2%
PI-44 Successful logging of valid charging data to marketplace as a percentageof total events 95%
PI-46 No of requests for consumption data completed as a percentage of allrequests received 95%
PI-101 Percentage of unsuccessful roaming charging process events 2%
PI-116 Percentage of failed attempts of EV car sharing user to make reservationto use an EV 10%
PI-81 Percentage of requested services not fulfilled due to a technical error 2%
PI-80 No of service transactions per day As high as possible
PI-2 Time for identification and authorization 5 s
PI-35 Time to fulfil a charging reduction service request 2 s
Table 1: Target values for Quality of Service KPIs
PI Description Value (s)
PI- 2 Average time it takes to identify and authenticate a user 5
PI- 35 Response time for charging reduction services 2
PI-150 Elapsed time between EVSE operator request to marketplace response 1
PI-151 Elapsed time between marketplace operator request to Clearing House response 1
PI-152 Elapsed time between Clearing House request to marketplace response 1
PI-153 Elapsed time between marketplace request to EVSE operator response 1
PI-154 Elapsed time between EVSE operator request to EVSP response 1
PI-155 Elapsed time between EVSP operator request to Clearing House response 1
PI-156 Elapsed time between Clearing House operator request to EVSP response 1
PI-157 Elapsed time between EVSP operator request to EVSE response 1
Table 2: Target values for Time KPIs
Once these target values were established, cost estimates were made related to the marketplace and theClearing House, as Table 3 shows. All the cost estimates (last four rows) depend on the number oftransactions or on the number of users per EVSP using the marketplace or the Clearing House.

GA MOVE/FP7/265499/Green eMotion WP 9: Deliverable 9.4. Part 2 Page 13 of 70
PI Description Short-term Medium term Long-term
PI-140 Number of EVs 5000 50 000 250 000
PI-124 Number of charging stations 1000 10 000 50 000
PI-141 Number of roaming sessions per day 5000 50 000 250 000
PI-127 Marketplace staff cost and EBIT (€/month) 20 000 40 000 60 000
PI-128 Clearing house staff cost and EBIT (€/month) 10 000 25 000 30 000
PI-132 Market place access cost (€/month) 20 000 80 000 160 000
PI-7 Roaming charges (€/month) 10 000 40 000 80 000
Table 3: Estimates of marketplace and Clearing House costs for future demand scenarios
As stated in section 2.4, this second part of the deliverable is looking a bit ahead in the future (mediumterm), when there will be the critical EV mass necessary to allow for a visible demand of EV charging inpublicly accessible EVSE. Hence, the conditions in second column in Table 3 are considered, so the totalcosts for the marketplace (addition of PI-127 and PI-132) are 120 000 €/month, i.e. 1 440 000 €/year.
In order to define the business model for the Green eMotion marketplace, interviews with representativesof existing marketplaces in Europe6 were held. The costs of accessing them include a one-timesubscription fee of about 5000 € and an annual fee of about 1600 €/year, for both EVSE Operators andEVSPs. On top of that, EVSPs must pay 25 €/customer and per year (up to 25 000 €/year maximum).
One of the marketplaces in commercial operation states that it has already more than 120 partners[HUBJECT 2014]. In order to cover the costs estimated in Table 3, each of them would need to pay about12 000 €/year or, to see it in another way, if there are 50 EVSPs (with 1000 EV customers each) and 70EVSE Operators, the incomes for the marketplace are enough to pay for the costs:
(50 ∗ 25 ∗ 1000) + (50 ∗ 1600) + (70 ∗ 1600) = 1442000€
The number of participants in the marketplace is likely to increase and, hence, lower prices can beexpected in the future. However, to be on the safe side, the prices already in place are considered in theanalysis. If the one-time subscription fee is assumed to be amortised in the long-term (e.g. 20 years) andwith a 5% discount rate, the annual marketplace access costs are calculated as follows:
=5000
(1 + 5%) − 17% ∗ (1 + 5%)
+ 1600 = 2000€/
2.5.2 EVSE OperatorThe EVSE Operator has the role of managing the physical equipment (EVSE) to supply the chargingprocess of the EV. Moreover, it also has the duty to monitor the charging session and monitor, maintainand control a certain EVSE. The EVSE Operator offers charging services (access to charginginfrastructure, including energy) to the EVSP based on a B2B relationship, either directly or through anagreement with a third party (the marketplace operator, see Figure 2). It is the owner of all EVSE-relateddata.
6 www.hubject.com, http://www.e-clearing.net/ [access in February 2015].

GA MOVE/FP7/265499/Green eMotion WP 9: Deliverable 9.4. Part 2 Page 14 of 70
2.5.2.1 CostsAccording to [D9.4], the costs for the EVSE Operator in the most general case, are costs related to thecharging infrastructure, i.e. EVSE amortisation and operation and maintenance (O&M) costs, electricitybill costs (including metering), communications costs and costs for accessing the marketplace, as well asstaff costs and overheads. New assumptions are considered for these costs in this second part:
· All the issues related to the operation of the EVSE are outsourced to a third party (as RWE offersin Germany7) and the EVSE Operator is not a start-up, but an already existing company, so thatstaff and overhead costs are assumed to be negligible.
· The data related to EVSE investment and O&M costs are based on the reports prepared by theGerman National Platform for Electric Mobility (NPE). In these reports, e.g. [NPE 2014],communication costs are included in the annual O&M costs.
· Marketplace access cost is 2000 €/year (see section 2.5.1).
Therefore, the EVSE Operator has some fixed costs which do not depend on the number of EVSE(marketplace access cost), some other fixed costs which do depend on the number of EVSE, i.e. fixedcosts per EVSE (amortisation, O&M, communications and the fixed part of the electricity bill) and somevariable costs per charging session (variable part of the electricity bill).
The fixed costs per EVSE, excluding the fixed part of the electricity bill, include the following items:
· EVSE investment cost (including grid connection): In general, the EVSE lifetime can be assumedto be 7.5 years [NPE 2014] and a 7% discount rate8 can also be assumed. In this case, theannual amortisation of an investment EVSEInv results in:
= (1 + 7%) . − 17% ∗ (1 + 7%) .
· Annual EVSE O&M costs (EVSEO&M) including communications (EVSE-EVSE backend andEVSE backend upstream).
The rest of the fixed costs, as well as the variable costs, are part of the electricity bill, which is calculatedin different ways in the different countries. In order to see the differences that may arise due to electricitybill structure differences across EU Member States, Spain (base case), Germany and the Netherlandsare considered in this report.
In general, the annual costs for an EVSE Operator with N EVSE are calculated according to the followingformula:
= + (1 + 7%) . − 17% ∗ (1 + 7%) .
+ & ∗ +
The electricity bill in Spain consists of the following components in the most general case9:
7 https://www.rwe-mobility.com/web/cms/en/1241156/products-services/emobility-services/rwe-eoperate/[access in February 2015].8 Almost the average value of the high (10%) and low (5%) values proposed in [D9.6].9 Price structures (tariffs) depend on the contracted power (connection size) [BOE-A-2001-20850].

GA MOVE/FP7/265499/Green eMotion WP 9: Deliverable 9.4. Part 2 Page 15 of 70
· Power or capacity component: It depends on the maximum power to be demanded from the grid.Different prices (Tp, in €/kW.month) apply, depending on the connection size (P, in kW):
= ∗ ∗ 12 ℎ/
· Energy component: It depends on the consumed amount of electricity. Both the price and thenumber of periods depend on the connection size. For LV connections, a three-period time of use(ToU) tariff applies in general, i.e. there are three different prices within a day. Based on the datacollected in the demo region Barcelona and Malaga [DR-ES1], 23% of charges are assumed tohappen in peak times (summer peak times are 11:00-15:00, where 31% of the charges occur,and winter peak times are 18:00-22:00, where 15.5% of charges occur), 11% of charges in superoff-peak times (0:00-8:00 both in summer and in winter) and the remaining 66% in regular off-peak times. Therefore, it can be calculated as:
= (23% ∗ + 66% ∗ + 11% ∗ ) ∗ ∗
Where Tei corresponds to the prices in the three different ToU periods, E is the average energydemand per charging session and C is the total number of charging session within a year.
· Electricity tax: It is calculated by applying 5.1127% to the addition of power and energycomponents.
· Meter renting: The prices for meter renting are different for single-phase and three-phase meters.In general, electricity supplies of more than 15 kW must be supplied at three-phase voltage[Schneider 2008] and lower connection capacities are supplied in single-phase. Meter cost (M) isusually provided in €/month.
· VAT: In Spain, VAT is 21% and it is applied to all the rest of components of the electricity bill.However, as the EVSE Operator is not the final customer, its costs can be claimed, so VAT is notincluded in EVSE Operator’s calculations (except for private home charging service).
Therefore, the annual EVSE Operator costs are:
= ⟨{( ∗ ∗ 12) + [(23% ∗ + 66% ∗ + 11% ∗ ) ∗ ∗ ]} ∗ (1 + 5.1127%)⟩
+ ( ∗ 12) ∗ (1 + ) + (1 + 7%) . − 17% ∗ (1 + 7%) .
+ & ∗ +
(1)
In Germany, the electricity bill is made up of the following components:
· Connection cost: it is a one-time payment, which depends on the connection size. It is assumedto be included in the EVSE installation cost.
· Metering price: It consists of an initial payment (also included in EVSE installation cost) and amonthly payment (M).
· Energy term: It is a cost for the consumed electricity. The same price (Te) applies to all the hours.
· VAT: It is 19% in Germany.
And the annual costs of the EVSE Operator become:

GA MOVE/FP7/265499/Green eMotion WP 9: Deliverable 9.4. Part 2 Page 16 of 70
= ( ∗ ∗ ) + ( ∗ 12) ∗ (1 + ) + (1 + 7%) . − 17% ∗ (1 + 7%) .
+ & ∗
+
(2)
In the Netherlands, the electricity bill includes the following components:
· Fixed cost (F): It is a cost for being connected to the electricity grid. It depends on the type ofconsumer (private or business) and on the connection size.
· Capacity payment (P): It is a price cost for the size of the connection to the grid. It depends onthe type of consumer (private or business) and on the connection size.
· Energy payment: It is a cost for the energy consumed. Prices depend on the type of consumer(private or business) and on the connection size. A single-price ToU is the most common one (E).
· Reduction (R): It is a discount on the electricity bill. It depends on the type of consumer (private orbusiness) and on whether it is for living or working function or not. As of 1 January 2015, there isno reduction for non-living or working function in the Netherlands10.
· VAT: It is 21%, as in Spain.
Hence, annual costs for the EVSE Operator in the Netherlands are:
ℎ ℎ
= [( + + ( ∗ ∗ )− ) ∗ (1 + )] + (1 + 7%) . − 17% ∗ (1 + 7%) .
+ & ∗
+
(3)
2.5.2.2 IncomesOn the other hand, EVSE Operator’s income mainly relies on the EV charging sessions made by EVcustomers, but some other sources of revenue (OS) might also be envisaged, like advertising orattracting EV customers to an existing shop or restaurant:
= ( ∗ ∗ ) +
(4)
The parameters in the formulas above take different values in the different charging services. Based onthem, the charging service price to be requested by the EVSE Operator (CP) in each of them can becalculated.
10 http://www.nuon.nl/mkb/tarieven/energiebelasting/ [access in February 2015]. The list of uses withliving or working function can be found in http://www.nuon.nl/Images/voorbeeldlijst-objecten-met-en-zonder-verblijfsfunctie8-28384.pdf [access in February 2015].

GA MOVE/FP7/265499/Green eMotion WP 9: Deliverable 9.4. Part 2 Page 17 of 70
2.5.3 EVSPThe EVSP offers electric mobility services to the end customers, which may include charging, search &find, routing and other services. It is the legal entity that the end-customer has a contract (B2Crelationship) with for all services related to the EV. This provision of services, including the EV chargingservices (either at home, at work or at any other location), is the feature that characterises the EVSP. TheEVSP is owner of the data of the EV customers in its portfolio. It is the B2B customer for the chargingservices sold by the EVSE operator.
The EVSP has some fixed costs and some variable costs.
Fixed costs are assumed to be recovered by means of an annual subscription fee to be charged to EVcustomers (which gives them the right to charge in the highway charging and in the public charging spotfor street side parking charging services). Fixed costs include the following ones:
· Costs for accessing the marketplace: One-time subscription fee of 5000 € and an annual fee of1600 €/year. As in the EVSE Operator case (see section 2.5.2), total annual cost of 2000 €/yearcan be assumed. On top of that, the EVSP must pay 25 €/customer and per year (up to amaximum payment of 25 000 €/year).
· Communications costs: they are assumed to be included in EVSP’s regular Internet bill11, so theyare neglected.
· Staff and overhead costs: These costs strongly depend on the number of EV customersmanaged. The assumptions in the first part of this deliverable [D9.4] are used for the threecountries, so, for an EV customer portfolio of about 5000 customers, these costs are in the rangeof 427 500 €/year, i.e. about 85.5 €/EV customer.
· Amortisation of radio-frequency identification (RFID) card: RFID card costs are about 20 €/card(including handling and delivery) [D9.4] and, although, card lifetime might be about 20 years, ashorter replacement period can be envisaged (about 5 years). Considering a 5% discount rate,the annual amortisation costs are calculated as follows:
=20
(1 + 5%) − 15% ∗ (1 + 5%)
= 4.62€/
Therefore, annual costs for an EVSP with 5000 customers can be calculated as:
= ℎ + ℎ ℎ + ℎ + = 2000€ + 25000€ + 427500€ + 4.62€ ∗ 5000 = 477600€
This amount results in 95.52 €/EV customer which, adding 21% VAT, leads to a subscription price of115.58 €/year. As a result, the subscription price is assumed to be 120 €/year (10 €/month).
On the other hand, variable costs are passed through directly to EV customers, who must, however, paythe value added tax (VAT) and therefore the EV charging price they pay is slightly higher than chargingservice price requested by the EVSE Operator.
11 Internet costs for small and medium enterprises are in the range of 25-50 €/month,http://www.movistar.es/empresas/ [access in February 2015]. For 5000 EV customers, this is less than0.12 €/year per EV customer.

GA MOVE/FP7/265499/Green eMotion WP 9: Deliverable 9.4. Part 2 Page 18 of 70
2.5.4 EV customersEV customers also have some fixed and some variable costs, which depend on vehicle usage. In order tocompare the total cost of ownership (TCO) for an EV and for an equivalent ICE vehicle, the same usage(annual mileage) and investment decisions (expected vehicle lifetime and discount rate) are considered.In the most general case, fixed costs include the following ones12:
· Vehicle amortisation cost: This cost depends, among others, on the type (T) of vehicle to beconsidered (EVs and gasoline and diesel ICE vehicles). Assuming a lifetime of 12 years and adiscount rate of 7%, annual amortisation costs can be calculated as:
ℎ =ℎ
(1 + 7%) − 17% ∗ (1 + 7%)
· EVSP subscription price (S): As calculated in section 2.5.3 above, S=120 €/year.
· EVSE amortisation cost: This cost is only relevant in the case of private home charging service.Following the same assumptions as for the rest of EVSE Operators (see section 2.5.3 above), theannual amortisation of an investment EVSEInv results in:
= (1 + 7%) . − 17% ∗ (1 + 7%) .
· Annual EVSE O&M costs (EVSEO&M) including communications (EVSE-EVSE backend andEVSE backend upstream): This cost is only relevant in the case of private home charging..
On the other hand, variable costs in the more general case for EV customers are the following ones:
· Fuel cost: This cost depends on the type of vehicle (T) and can be obtained by multiplying thetarget fuel consumption (FCT) and the fuel prices (FPT) by the annual mileage to be considered(K):
= ∗ ∗
· O&M cost: This cost also depends on the type of vehicle (T) and which are calculated bymultiplying the O&M costs per kilometre (OMT) by the annual mileage:
& = ∗
· EV charging cost: EV customers may use different types of charging services, so their annual EVcharging cost depends on the EV charging cost in each service i, which is calculated bymultiplying the number of times that EV customers use each service per year (Ui) by the EVcharging price. As discussed in section 2.5.3, EV charging price is obtained by adding VAT to thecharging service price requested by the EVSE Operator (CPi). Therefore, EV charging cost iscalculated as:
12 Some other costs, like insurance, car vehicle tax… depend on many other parameters (e.g. insurancecost may depend on the coverage, age, gender, number of accidents in previous years…; car vehicle taxmay depend on either engine size or fuel type and CO2 emissions, age, location…). It is not the aim ofthis analysis to enter into such details, so they are not included in this assessment.

GA MOVE/FP7/265499/Green eMotion WP 9: Deliverable 9.4. Part 2 Page 19 of 70
ℎ = ∗ ∗ (1 + )
By adding up the different cost components, the TCO for each type of vehicle can be calculated:
=ℎ
(1 + 7%) − 17% ∗ (1 + 7%)
+ + (1 + 7%) . − 17% ∗ (1 + 7%) .
+ & + ( ∗ ∗ ) + ( ∗ )
+ ∗ ∗ (1 + )
Subscription price and costs related to private home EVSE (amortisation and O&M) only apply to EVs.Likewise, EV charging cost is only related to EVs, but ICE vehicles have the fuel cost. By taking the targetfuel consumptions (FCT) established by the EU legislation13 and the O&M costs in [D9.6], the differentTCOs become:
=ℎ
(1 + 7%) − 17% ∗ (1 + 7%)
+ + (1 + 7%) . − 17% ∗ (1 + 7%) .
+ & + (0.011€/ ∗ )
+ ∗ ∗ (1 + )
=ℎ (1 + 7%) − 1
7% ∗ (1 + 7%)
+5.6100 / ∗ ∗ + (0.033€/ ∗ )
=ℎ
(1 + 7%) − 17% ∗ (1 + 7%)
+4.9100 / ∗ ∗ + (0.036€/ ∗ )
(5)
Private home charging is expected to be the preferred charging option by those EV customers who cancharge their EVs at home [Nissan 2015, 1], while public charging spot for street side parking is likely to bethe most used alternative for those EV customers without access to private home charging. As a result,the impact of these charging services in EV customers’ TCO is higher and, thus, both fixed and variablecosts must be included in the analysis.
On the contrary, traffic hotspot charging and highway charging are expected to be used quite seldom byEV customers and, hence, they are not likely to have a big impact on their TCO. Therefore, instead oflooking at the whole TCO, the relative costs of an equivalent trip for EV customers and for drivers of ICEvehicles are compared. EV cost is lower when the following condition is met:
( ∗ ) + ∗ (1 + ) ≤ ( ∗ ∗ ) + ( ∗ )
The distance that EV customers are able to drive after they charge their EV depends on the amount ofenergy charged (Ei) and on the efficiency of the trip (EFi):
=
13 http://ec.europa.eu/clima/policies/transport/vehicles/cars/ [access in February 2015].

GA MOVE/FP7/265499/Green eMotion WP 9: Deliverable 9.4. Part 2 Page 20 of 70
Therefore, EVs are competitive with gasoline and/or diesel vehicles if the following conditions are met:
: 0.011€/ ∗ + ∗ (1 + ) ≤5.6
100 ∗ ∗ + 0.033€/ ∗
: 0.011€/ ∗ + ∗ (1 + ) ≤4.9
100 ∗ ∗ + 0.036€/ ∗
Then, the maximum charging service price that EVSE Operators can request and which makes EVscompetitive against ICE vehicles is calculated as:
: ≤5.6 ∗
100 + 0.022 ∗ ∗ (1 + )
: ≤4.9 ∗
100 + 0.025 ∗ ∗ (1 + )
(6)
As in the case of the electricity bill structure (see section 2.5.2.1), the prices for vehicle purchase and forfossil fuels are different across Europe. Again, the prices for Spain (base case), Germany and theNetherlands are considered.
2.5.4.1 SpainVehicle purchase cost strongly depends on the type of vehicle, brand and model. The best-seller EVs inSpain are Nissan Leaf, BMW i3 and Renault Zoe [Baeza 2014], which fall into three different carcategories (C-segment medium cars, A-segment mini cars and B-segment small cars). If B-segment istaken as a typical EV category, best-sellers in this category are Seat Ibiza, Volkswagen Polo and OpelCorsa [Aniacam 2015]. Despite the difficulties in comparing different models, the average price for thegasoline version (5 doors, 75 CV) is about 12 000 €14 and the diesel version is about 13 800 €, which is inline with the 1900 € difference assumed in [D9.6]. Both prices include a PIVE-6 plan subsidy of 2000 €15.Regarding EVs, the main price difference between EVs and gasoline ICE vehicles is battery cost, which isabout 11 000 € (optimistic scenario forecast for 2015 in [D9.6]). EVs have an additional MOVELE plansubsidy of 6500 €16, which leaves an extra cost for the EV of about 4500 €, i.e. about 16 500 €.
On the other hand, gasoline fuel costs are 1.438 €/l and diesel fuel cost 1.331 €/l [MINETUR 2014].Therefore, equations (5) become:
=12000€
(1 + 7%) − 17% ∗ (1 + 7%)
+5.6100 / ∗ 1.438€/ ∗ + 0.033€/ ∗ ~1511 + 0.113528 ∗
=13800€
(1 + 7%) − 17% ∗ (1 + 7%)
+4.9100 / ∗ 1.331€/ ∗ + 0.036€/ ∗ ~1738 + 0.101219 ∗
14 http://www.seat.es/, http://www.volkswagen.es, http://www.opel.es/ [access in January 2015].15 In 2014, all efficient passenger cars (EVs and ICE cars) could ask for a 2000 € discount in Spain([BOE-A-2014-6684]).16 The 6500 € subsidy in Plan MOVELE [BOE-A-2014-6176] can be combined with the 2000 € subsidy inPlan PIVE-6 (see footnote 15). The budget for Plan MOVELE was completely requested in 2014 for thefirst time since 2009. The conditions for 2015 are still unknown.

GA MOVE/FP7/265499/Green eMotion WP 9: Deliverable 9.4. Part 2 Page 21 of 70
=16500€
(1 + 7%) − 17% ∗ (1 + 7%)
+ 120€ + (1 + 7%) . − 17% ∗ (1 + 7%) .
+ & + (0.011€/ ∗ )
+ ∗ ∗ (1 + ) ~2198 + 0.011 ∗ + (1 + 7%) . − 17% ∗ (1 + 7%) .
+ &
+ ∗ ∗ (1 + )
(7)
When the relative cost for EV customers of the charging event is compared with refuelling cost of anequivalent trip with an ICE vehicle (traffic hotspot and highway charging services), equations (6) result:
: ≤ ∗ 0.084733€/
: ≤ ∗ 0.074561€/
(8)
2.5.4.2 GermanyPerforming the same market survey as in Spain, the average price for the gasoline version of the modelsconsidered (Seat Ibiza, Volkswagen Polo and Opel Corsa) is about 13 150 €, and the diesel version isabout 2400 € more expensive on average (15 550 €). There are no direct subsidies for EV purchase inGermany, so, assuming the same difference as in Spain (11 000 €), EVs would cost 24 150 €.
Fuel costs in Germany are 1.586 €/l and 1.384 €/l for gasoline and diesel, respectively [MINETUR 2014],which make equations (5) and (6):
=13150€
(1 + 7%) − 17% ∗ (1 + 7%)
+5.6100 / ∗ 1.586€/ ∗ + 0.033€/ ∗ ~1656 + 0.121816 ∗
=15550€
(1 + 7%) − 17% ∗ (1 + 7%)
+4.9100 / ∗ 1.384€/ ∗ + 0.036€/ ∗ ~1958 + 0.103816 ∗
=24150€
(1 + 7%) − 17% ∗ (1 + 7%)
+ 120€ + (1 + 7%) . − 17% ∗ (1 + 7%) .
+ & + (0.011€/ ∗ )
+ ∗ ∗ (1 + ) ~3161 + 0.011 ∗ + (1 + 7%) . − 17% ∗ (1 + 7%) .
+ &
+ ∗ ∗ (1 + )
(9)

GA MOVE/FP7/265499/Green eMotion WP 9: Deliverable 9.4. Part 2 Page 22 of 70
: ≤ ∗ 0.093123€/
: ≤ ∗ 0.077997€/
(10)
2.5.4.3 The NetherlandsBy looking at the prices of the models considered in the other two countries, ICE car prices (both gasolineand diesel) in the Netherlands are about 3000 € more expensive than in Germany. Again, there are nodirect subsidies for EV purchase in the Netherlands, so, EVs are assumed to be 11 000 € moreexpensive than gasoline ICE vehicles.
Fuel costs in the Netherlands are 1.753 €/l and 1.433 €/l for gasoline and diesel, respectively [MINETUR2014], which make equations (5) and (6):
=16150€
(1 + 7%) − 17% ∗ (1 + 7%)
+5.6100 / ∗ 1.753€/ ∗ + 0.033€/ ∗ ~2033 + 0.131168 ∗
=18550€
(1 + 7%) − 17% ∗ (1 + 7%)
+4.9100 / ∗ 1.433€/ ∗ + 0.036€/ ∗ ~2335 + 0.106217 ∗
=27150€
(1 + 7%) − 17% ∗ (1 + 7%)
+ 120€ + (1 + 7%) . − 17% ∗ (1 + 7%) .
+ & + (0.011€/ ∗ )
+ ∗ ∗ (1 + ) ~3538 + 0.011 ∗ + (1 + 7%) . − 17% ∗ (1 + 7%) .
+ &
+ ∗ ∗ (1 + )
(11)
: ≤ ∗ 0.099312€/
: ≤ ∗ 0.078692€/
(12)

GA MOVE/FP7/265499/Green eMotion WP 9: Deliverable 9.4. Part 2 Page 23 of 70
3 Traffic hotspot charging serviceThis charging service is used by EV customers when they charge at a publicly accessible EVSE onprivate domain and which is located in a traffic hotspot, either because it is a point of interest or a muchfrequented place. Being a traffic hotspot, it is very likely that such a place already has a big demand forparking and, hence, it is assumed that there is an already existing direct payment system. As a result, thetraffic hotspot operator is at the same time the EVSE Operator and the EVSP (no roaming required and,thus, no marketplace). The effect of these assumptions is assessed in section 3.2.4.
The charging speed is assumed to be semi-fast (22 kW, although it could also charge at 11 kW if needed)and the EVSE is assumed to have two outlets. One single EVSE is assumed17.
The maximum amount of energy to be charged by an EV is obtained as 70% of the battery size, from aninitial state of charge (SOC) of 30% to a maximum SOC of 100% [NPE 2010].
Table 4 below presents the sizes of the batteries of some pure EVs sold by the OEMs in the GreeneMotion project consortium:
EV model Battery size (kWh) Range (km) Consumption (Wh/km)
BMW i3 18.8 160 118
Nissan Leaf 24 199 121
Renault Zoe 22 210 105
Smart (fortwo) Electric Drive 17 140 121
Table 4: Battery sizes and ranges of the EVs sold by OEMs in Green eMotion18
Therefore, the maximum amount of energy to be charged would be between 11.90 kWh and 16.8 kWhper session (70% of 17 kWh and 24 kWh, respectively). The amount of energy to be charged in anaverage traffic hotspot charging event depends on the primary use of the traffic hotspot (football stadium,museum, airport, train station…).
Moreover, plug-in hybrid vehicles may also use this charging service, but their batteries have usuallylower capacities. In order to consider all the aspects, 10 kWh per charging session is considered for theaverage charging session in the traffic hotspot.
Based on the data in Table 4, EV efficiency can be calculated by dividing the battery size by the drivingrange. Except Renault Zoe (who has a lower consumption), the other three EVs have a consumption inthe range of 120 Wh/km, so that is the efficiency considered.
3.1 Base caseIn this service, the relative cost for EV customers of the charging event must be compared with refuellingcost of an equivalent trip with an ICE vehicle and, hence, equations (8) are used.
Table 5 presents the different parameters to be used in equations (1) and (8):
17 As there is no need to connect to the marketplace, results can be obtained on a per EVSE basis (seeequation (1)) and, hence, the total number of EVSE does not affect them.18 http://goelectricstations.com/electric-cars.html [access in February 2015].

GA MOVE/FP7/265499/Green eMotion WP 9: Deliverable 9.4. Part 2 Page 24 of 70
Parameter Value Unit Reference
P 2*22 kW
Scenario descriptionE 10 kWh
EF 120 Wh/km
N 1 EVSE
VAT 0 % EVSE Operator is not the final customer
MPEVSEO 0 €/year No marketplace required
Tp 6.832399 €/kW/month
[Endesa 2014]Te1 0.122383 €/kWh
Te2 0.096216 €/kWh
Te3 0.065923 €/kWh
M 1.36 €/month [BOE-A-2011-14782]
EVSEInv 10 500 €/EVSE[NPE 2014]
EVSEO&M 1 725 €/EVSE/year
Table 5: Values for the parameters in the Traffic Hotspot charging service (base case)
The maximum charging service price to be requested by the EVSE Operator so that EV customers havea mileage cost which is competitive against ICE vehicles is calculated by using equations (8):
: ≤ ∗ 0.084733€/ =10 ℎ
120 ℎ/ ∗ 0.084733€/ = 7.0611€/
: ≤ ∗ 0.074561€/ =10 ℎ
120 ℎ/ ∗ 0.074561€/ = 6.2134€/
Therefore, by adding 21% VAT, the maximum EV charging prices for EV customers to have a competitivemileage cost with gasoline and diesel are 8.54 € and 7.52 € per charging session, respectively.
The costs for the EVSE Operator are obtained by using equation (1):
= ⟨{( ∗ ∗ 12) + [(23% ∗ + 66% ∗ + 11% ∗ ) ∗ ∗ ]} ∗ (1 + 5.1127%)⟩
+ ( ∗ 12) ∗ (1 + ) + (1 + 7%) . − 17% ∗ (1 + 7%) .
+ & ∗ +
= ⟨{(44 ∗ 6.832399 ∗ 12)
+ [(23% ∗ 0.122383 + 66% ∗ 0.096216 + 11% ∗ 0.065923) ∗ 10 ∗ ]} ∗ (1 + 5.1127%)⟩
+ (1.36 ∗ 12) ∗ (1 + 0%) +10500
(1 + 7%) . − 17% ∗ (1 + 7%) .
+ 1725 ∗ 1 + 0 = 7380.16 + 1.0396 ∗

GA MOVE/FP7/265499/Green eMotion WP 9: Deliverable 9.4. Part 2 Page 25 of 70
The incomes for the EVSE Operator are obtained by using equation (4):
= ( ∗ ∗ ) + = ( ∗ ∗ 1) +
If no additional sources of income are considered (OS=0), the minimum number of charging sessions perEVSE to have a positive result (income > cost) can be calculated by:
( )7.0611 ∗ = 7380.16 + 1.0396 ∗ ⇔ ~1226 / ⇒ 3.36 /
( )6.2134 ∗ = 7380.16 + 1.0396 ∗ ⇔ ~1427 / ⟹ 3.91 /
(13)
This means that, if each EVSE installed for traffic hotspot charging by an EVSE Operator is used tocharge more than 3.91 (3.36) times per day on average, i.e. 1.96 (1.68) charging sessions per outlet andper day, there is room for a pricing strategy that allows the EVSE Operator to recover its costs and stilloffer a competitive mileage cost for EV customers in comparison with diesel (gasoline) ICE cars. If thereare enough EVs on the road, this target usage does not seem to be very difficult to reach in a traffichotspot.
For lower usage rates, the EVSE Operator will still be able to offer competitive prices to EV customers ifother sources of revenue are found. There are a number of alternatives to get these additional revenues,although the best candidate seems to be the use of the EVSE for advertisement purposes. Out of the allalternatives for advertising existing at the moment, the one with the shape closer to an EVSE is the phonebooth. The same price applies to phone booths of 60x140 cm, 110x80 cm and 45x250 cm surfaces,which are close to the dimensions of EVSE available in the market (e.g. 53x190 cm [ABB 2014], 80x200cm [Efacec 2014]), so the same price as for phone booths is assumed for EVSE adverstising. Dependingon the phone booth location and the actual advertising surface, its price can range between about 4000 €(in small cities, with the regular advertising surface) and almost 10 000 € (in Madrid, Barcelona andSeville for “integral” surfaces in the four sides of the booth)19. In traffic hotspots and taking into accountthe added-value of being advertised in an EVSE (innovation, sustainability…), it is quite likely that theEVSE Operator can negotiate quite good conditions for advertising.
In case the EVSE Operator obtains incomes for advertising in the upper range (OS=10 000 €/year perEVSE), such amount would be enough to pay for all the costs of the EVSE, even if it is never used(7380.16 €/year).
In the lower range (OS=4000 €/year per EVSE), it would still need to recover part of the fixed costs (about3380.16 €/year) and the variable costs per charging session. Then, C is calculated as:
( )7.0611 ∗ + 4000 = 7380.16 + 1.0396 ∗ ⇔ ~562 / ⟹ 1.54 /
( )6.2134 ∗ + 4000 = 7380.16 + 1.0396 ∗ ⇔ ~654 / ⟹ 1.79 /
Therefore, less than 1 charging session per outlet and per day is required to offer competitive prices toEV customers when the EVSE has an income from advertising, which is even more likely to happen intraffic hotspots.
Due to the importance of having several charging sessions per day, the billing scheme must be carefullydesigned. A billing scheme which only considers time is not likely to be accepted by EV customers, as theprice would result too high:
ℎ = ∗ (1 + ) ∗/2
19 http://www.oblicua.es/publicidad-exterior/publicidad-cabinas-telefonicas.htm [access in February 2015].

GA MOVE/FP7/265499/Green eMotion WP 9: Deliverable 9.4. Part 2 Page 26 of 70
( ) ℎ = 7.0611€/ ∗ (1 + 21%) ∗22
10 ℎ/ = 18.80€/ℎ
( ) ℎ = 6.2134€/ ∗ (1 + 21%) ∗22
10 ℎ/ = 16.54€/ℎ
An alternative is to charge per electricity consumption while charging and combine it with a time-basedtariff for the rest of the time that the EV is connected to the EVSE. The price while charging would be:
ℎ =∗ (1 + )
( ) ℎ =7.0611€/ ∗ (1 + 21%)
10 ℎ/ = 0.8544€/ ℎ
( ) ℎ =6.2134€/ ∗ (1 + 21%)
10 ℎ/ = 0.7518€/ ℎ
The time-based tariff should be designed so that it is attractive enough for EV customers to use the traffichotspot EVSE for charging their EVs, but it also prevents them from being connected to the EVSE for toolong. This time-based tariff could be on top of the regular parking tariff of the traffic hotspot (i.e. only forEVs) or it could be socialised among all the users of the traffic hotspot parking space.
3.2 Sensitivity analysis
3.2.1 EVSE amortisationThe EVSE investment cost and the EVSE lifetime data are taken from the latest NPE report [NPE 2014]and are valid for 2013. Although there might be cases where EVSE investment costs are higher (e.g.situations in which the distribution grid must be strongly reinforced, or places where more complicatedcivil works are needed), future prices are expected to decline. Likewise, future EVSE is expected to lastlonger (even if there might be cases where lifetime is reduced by e.g. vandalism).
As the base case for the traffic hotspot charging service already presents quite good conditions for apositive business case and the conditions for EVSE amortisation are expected to improve, no sensitivityanalysis is performed on this parameter.
3.2.2 Battery sizeThe battery size considered in the base case is based on existing EVs (see Table 4). However, this sizeis expected to increase in the future to allow EVs to drive a longer range20. The impact of battery size ismainly in the average energy to be recharged per charging session: as batteries increase in size, EVcustomers request more energy per charge, but they also charge less often. If, for example, an averageof 20 kWh per charging session is assumed (E=20 kWh), maximum CP doubles:
: ≤ ∗ 0.084733€/ =20 ℎ
120 ℎ/ ∗ 0.084733€/ = 14.1222€/
: ≤ ∗ 0.074561€/ =20 ℎ
120 ℎ/ ∗ 0.074561€/ = 12.4268€/
20 Green eMotion partners expect the possibility to have 40 kWh-battery EVs in the market as early as in2016 and battery sizes of up to 80 kWh are expected for longer term.

GA MOVE/FP7/265499/Green eMotion WP 9: Deliverable 9.4. Part 2 Page 27 of 70
However, EVSE Operator’s variable costs double too:
[(23% ∗ 0.122383 + 66% ∗ 0.096216 + 11% ∗ 0.065923) ∗ 20 ∗ ] ∗ (1 + 5.1127%) = 2.0792 ∗
Therefore, in the case of diesel vehicles (the effect is the same for gasoline), C can be calculated as:
12.4268 ∗ = 7380.16 + 2.0792 ∗ ⇔ 2 ∗ 6.2134 ∗ = 7380.16 + 2 ∗ 1.0396 ∗ ⇔= 713.2~714 ℎ
As a result, if the energy demand per charging session is doubled, the required EVSE usage rate ishalved. As demonstrated in the formula above, this ratio is linear, so if battery size is 80 kWh and 40 kWhare charged on average, 357 charging sessions per EVSE and per year would be needed, i.e. about 1charging session per day.
Taking into account that bigger battery sizes will allow EV customers charge less frequently, the batterysize seems to be a non-critical parameter on EVSE Operator’s business model. What really affects thebusiness case is EV customer behaviour, that is, whether EV customers with bigger batteries would usetraffic hotspots to charge their vehicles more often (as EV customers gain more confidence in EVs and,hence, more EVs are sold and each of them is used more frequently) or more seldom (even if the EVmarket and usage increases, most EV customers use private home charging for satisfying their mobilityneeds).
3.2.3 EV efficiencyThe EV efficiency considered in the base case is based on the calculated efficiencies of EVs in Table 4.However, these efficiencies are better than the official efficiencies by EV manufacturers when available(Nissan Leaf’s official efficiency is 150 Wh/km [Nissan 2015, 2] and BMW i3’s efficiency 129 Wh/km21). Atlower efficiencies, the driving range with the same 10 kWh charging session is reduced, which affects themaximum allowable CP to compete with ICE. By considering 150 Wh/km and in the worst case (diesel):
≤10 ℎ
150 ℎ/ ∗ 0.074561€/ = 4.971€/ ℎ
In this case, by calculating C:
4.971 ∗ = 7380.16 + 1.0396 ∗ ⇔ = 1877.36~1878 ℎ
Under these conditions, more than 5.14 charging sessions per EVSE and per day on average arerequired for the EVSE Operator to offer competitive prices to EV customers.
As in the case of the battery size, two opposite effects happen at the same time when EV efficiency islower (higher consumption) and, hence, driving range is reduced. On the one hand, a lower driving rangeresults in a higher mileage cost and, hence, the price per charging session needs to be lower to be ableto compete with ICE vehicles, which only happens when EVSE are used more frequently. On the otherhand, as driving range decreases, EV customers need to charge more often, which results in a morefrequent EVSE usage.
Again, the important aspect is EV customer behaviour, since lower efficiencies may lead to more (ifefficiency does not impact EV market development and EV customers use traffic hotspots to charge theirvehicles as an additional resource to private home charging) or less frequent usages of EVSE (if EVcustomers are more reluctant to buy an EV for their lower driving range).
21 http://www.bmw.com/com/en/newvehicles/i/i3/2013/showroom/technical_data.html [access in February2015].
GA MOVE/FP7/265499/Green eMotion WP 9: Deliverable 9.4. Part 2 Page 28 of 70
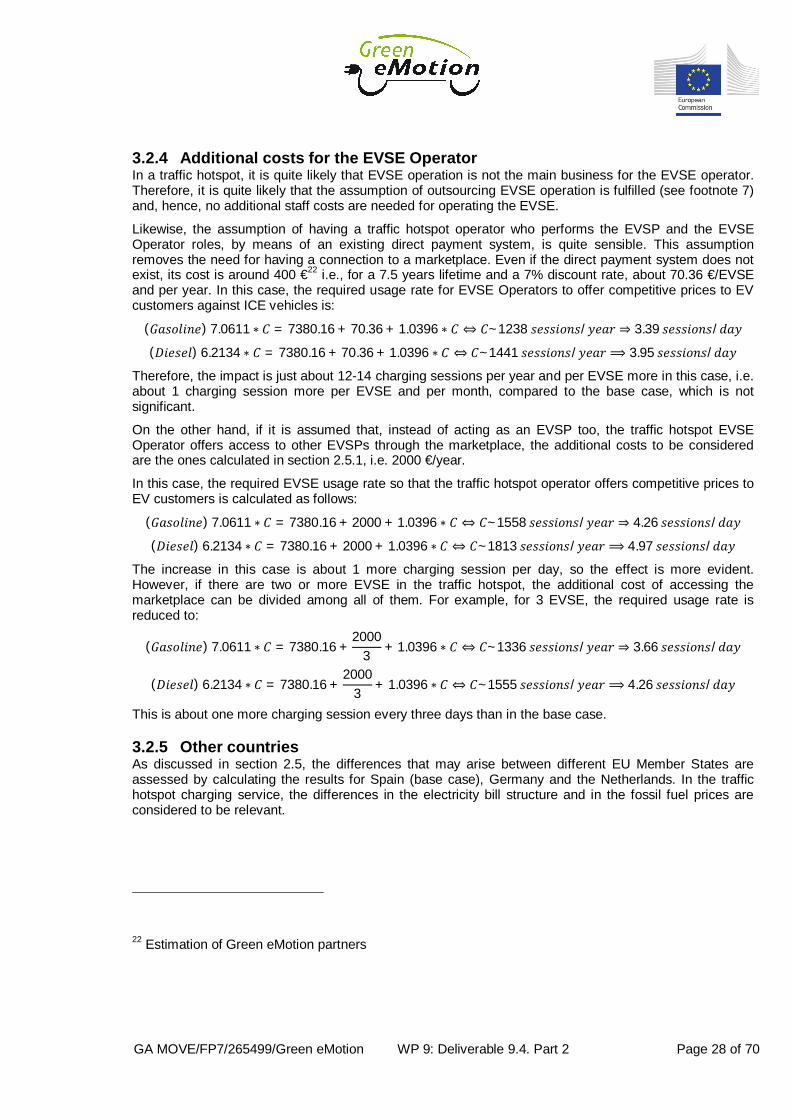
3.2.4 Additional costs for the EVSE OperatorIn a traffic hotspot, it is quite likely that EVSE operation is not the main business for the EVSE operator.Therefore, it is quite likely that the assumption of outsourcing EVSE operation is fulfilled (see footnote 7)and, hence, no additional staff costs are needed for operating the EVSE.
Likewise, the assumption of having a traffic hotspot operator who performs the EVSP and the EVSEOperator roles, by means of an existing direct payment system, is quite sensible. This assumptionremoves the need for having a connection to a marketplace. Even if the direct payment system does notexist, its cost is around 400 €22 i.e., for a 7.5 years lifetime and a 7% discount rate, about 70.36 €/EVSEand per year. In this case, the required usage rate for EVSE Operators to offer competitive prices to EVcustomers against ICE vehicles is:
( )7.0611 ∗ = 7380.16 + 70.36 + 1.0396 ∗ ⇔ ~1238 / ⇒ 3.39 /
( )6.2134 ∗ = 7380.16 + 70.36 + 1.0396 ∗ ⇔ ~1441 / ⟹ 3.95 /
Therefore, the impact is just about 12-14 charging sessions per year and per EVSE more in this case, i.e.about 1 charging session more per EVSE and per month, compared to the base case, which is notsignificant.
On the other hand, if it is assumed that, instead of acting as an EVSP too, the traffic hotspot EVSEOperator offers access to other EVSPs through the marketplace, the additional costs to be consideredare the ones calculated in section 2.5.1, i.e. 2000 €/year.
In this case, the required EVSE usage rate so that the traffic hotspot operator offers competitive prices toEV customers is calculated as follows:
( )7.0611 ∗ = 7380.16 + 2000 + 1.0396 ∗ ⇔ ~1558 / ⇒ 4.26 /
( )6.2134 ∗ = 7380.16 + 2000 + 1.0396 ∗ ⇔ ~1813 / ⟹ 4.97 /
The increase in this case is about 1 more charging session per day, so the effect is more evident.However, if there are two or more EVSE in the traffic hotspot, the additional cost of accessing themarketplace can be divided among all of them. For example, for 3 EVSE, the required usage rate isreduced to:
( )7.0611 ∗ = 7380.16 +2000
3 + 1.0396 ∗ ⇔ ~1336 / ⇒ 3.66 /
( )6.2134 ∗ = 7380.16 +2000
3 + 1.0396 ∗ ⇔ ~1555 / ⟹ 4.26 /
This is about one more charging session every three days than in the base case.
3.2.5 Other countriesAs discussed in section 2.5, the differences that may arise between different EU Member States areassessed by calculating the results for Spain (base case), Germany and the Netherlands. In the traffichotspot charging service, the differences in the electricity bill structure and in the fossil fuel prices areconsidered to be relevant.
22 Estimation of Green eMotion partners

GA MOVE/FP7/265499/Green eMotion WP 9: Deliverable 9.4. Part 2 Page 29 of 70
3.2.5.1 GermanyThe main parameters to be used for the economic assessment of the traffic hotspot EVSE Operator inGermany are listed in Table 6.
Parameter Value Unit Reference
E 10 kWh
Scenario descriptionEF 120 Wh/km
N 1 EVSE
VAT 0 % EVSE Operator is not the final customer
MPEVSEO 0 €/year No marketplace required
Te 0.25 €/kWhData provided by RWE
M 8.60 €/month
EVSEInv 10 500 €/EVSE[NPE 2014]
EVSEO&M 1 725 €/EVSE/year
Table 6: Values for the parameters in the Traffic Hotspot charging service (Germany)
The maximum charging service price to be requested by a German traffic hotspot EVSE Operator so thatEV customers have a mileage cost which is competitive against ICE vehicles is calculated by usingequations (10):
: ≤ ∗ 0.093123€/ =10 ℎ
120 ℎ/ ∗ 0.093123€/ = 7.76025€/
: ≤ ∗ 0.077997€/ =10 ℎ
120 ℎ/ ∗ 0.077997€/ = 6.49975€/
Therefore, by adding 19% VAT, the maximum EV charging prices for EV customers to have a competitivemileage cost with gasoline and diesel are 9.23 € and 7.73 € per charging session, respectively.
The costs for a traffic hotspot EVSE Operator in Germany are obtained by using equation (2):
= ( ∗ ∗ ) + ( ∗ 12) ∗ (1 + ) + (1 + 7%) . − 17% ∗ (1 + 7%) .
+ & ∗
+
= (0.25 ∗ 10 ∗ ) + (8.60 ∗ 12) ∗ (1 + 0%) +10500
(1 + 7%) . − 17% ∗ (1 + 7%) .
+ 1725 ∗ 1 + 0
= 3675.10 + 2.50 ∗
The incomes for the EVSE Operator are obtained by using equation (4):
= ( ∗ ∗ ) + = ( ∗ ∗ 1) +
If no additional sources of income are considered (OS=0), the minimum number of charging sessions perEVSE to have a positive result (income > cost) can be calculated as shown below, for both gasoline anddiesel ICE vehicles:
( )7.76025 ∗ = 3675.10 + 2.50 ∗ ⇔ ~699 / ⇒ 1.92 /

GA MOVE/FP7/265499/Green eMotion WP 9: Deliverable 9.4. Part 2 Page 30 of 70
( )6.49975 ∗ = 3675.10 + 2.50 ∗ ⇔ ~919 / ⟹ 2.52 /
This means that if each EVSE installed for traffic hotspot charging by an EVSE Operator are used tocharge more than 2.52 (1.92) times per day on average, i.e. 1.26 (0.96) charging sessions per outlet andper day, there is room for a pricing strategy that allows the EVSE Operator recover its costs and still offera competitive mileage cost for EV customers in comparison with diesel (gasoline) vehicles. If there areenough EVs on the road, this target usage does not seem to be very difficult to reach in a traffic hotspot,where vehicles are expected to drive very often.
Similarly, EVSEs not used at all cost EVSE Operators 3675 € per year, which is lowest annual price foradvertising in phone booth in a Spanish city, so it is quite likely that a traffic hotspot in Germany canobtain more than that amount for advertising in an EVSE and, hence, that the EVSE Operator is able tooffer an EV charging price which is competitive for EV customers (lower mileage cost than ICE vehicles),and still make a profit even with very low usage rates.
3.2.5.2 The NetherlandsThe main parameters to be used in the assessment for the operation of traffic hotspot EVSE in theNetherlands are listed in Table 7. According to footnote 10, the traffic hotspot is assumed to be a mannedparking garage, so it is considered to have a living or working function.
Parameter Value Unit Reference
E 10 kWh
Scenario descriptionEF 120 Wh/km
N 1 EVSE
VAT 0 % EVSE Operator is not the final customer
MPEVSEO 0 €/year No marketplace required
F 54 €/yearPrices for a three-phase, 80 A,
connection23Te 0.1874 €/kWh
R 311.84 €/year
P 1614.2855 €/year Grid fees for a 3 x 80 A connection24
EVSEInv 10 500 €/EVSE[NPE 2014]
EVSEO&M 1 725 €/EVSE/year
Table 7: Values for the parameters in the Traffic Hotspot charging service (The Netherlands)
The costs for a traffic hotspot EVSE Operator in the Netherlands are obtained by using equation (3):
23 http://www.nuon.nl/mkb/lightbox/tarieven-flexibel.jsp [access in February 2015].24 https://www.enexis.nl/consument/diensten-en-tarieven/tarieven/elektriciteit/periodieke-netwerktarieven-e?pageid=44 [access in February 2015].

GA MOVE/FP7/265499/Green eMotion WP 9: Deliverable 9.4. Part 2 Page 31 of 70
ℎ ℎ
= [( + + ( ∗ ∗ ) − ) ∗ (1 + )] + (1 + 7%) . − 17% ∗ (1 + 7%) .
+ & ∗
+
= [(54 + 1614.2855 + (0.1874 ∗ 10 ∗ )− 311.84) ∗ (1 + 0%)] +10500
(1 + 7%) . − 17% ∗ (1 + 7%) .
+ 1725
= 4928.31 + 1.874 ∗
The incomes for the EVSE Operator are obtained by using equation (4):
= ( ∗ ∗ ) + = ( ∗ ∗ 1) +
If no additional sources of income are considered (OS=0), the minimum number of charging sessions perEVSE to have a positive result (income > cost) can be calculated by:
( )8.276 ∗ = 4928.31 + 1.874 ∗ ⇔ ~771 / ⇒ 2.11 /
( )6.55767 ∗ = 4928.31 + 1.874 ∗ ⇔ ~1052 / ⟹ 2.88 /
This means that the EVSE Operator needs to have each EVSE used more than 2.88 (2.11) times per dayon average, i.e. 1.44 (1.06) charging sessions per outlet and per day, to recover its costs and still be ableto offer a competitive mileage cost for EV customers in comparison with diesel (gasoline) vehicles.
These target usage rates are between the required usage in Germany and in Spain, so it does not seemto be very difficult to reach in a traffic hotspot if there are enough EVs on the road.
Again, advertising seems a good way to recover EVSE costs for lower usage rates. The prices foradvertising in bus shelters in the Netherlands (about 105 €/week25) are similar to the ones in Spanishsmall cities (106 €/week in Girona26). Therefore, the incomes for advertising in the Netherlands areassumed to be the same as for Spain. If the EVSE Operator is able to negotiate a good price foradvertising in its EVSE (even in the lower range of 4000 €), it can offer competitive EV charging prices toEV customers so that these have lower mileage costs than ICE vehicles even at low EVSE usage rates:
6.5577 ∗ + 4000 = 4928.31 + 1.874 ∗ ⇔ = 198.20~199 ℎ
This is less than 0.55 charging sessions per EVSE and per day, i.e. about 2 uses per outlet per week, tobe competitive against diesel vehicles. The required usage to compete against gasoline vehicles is evenlower (about 0.40 usages per EVSE and per day).
25 http://www.exterionmedia.com/nl/onze-mogelijkheden/onze-pakketten/landelijk-adverteren/ns-pakketten/ns-abri-pakket/ [access in February 2015].26 http://www.oblicua.es/publicidad-exterior/mupis.htm [access in February 2015].

GA MOVE/FP7/265499/Green eMotion WP 9: Deliverable 9.4. Part 2 Page 32 of 70
4 Highway charging serviceThis charging service represents the situation in which EV customers charge at a publicly accessibleEVSE on private or public domain and which is located in a highway, most likely in an existing fuel fillingstation. The aim of this EVSE is to allow EV customers to have a fast (in general, more than 22 kW, beingtypically 50 kW DC or 43 kW AC) charging session, so that they can continue their trip.
Although direct payment may also be available27, EV customers are assumed to use the roamingagreement of their EVSP with the highway EVSE Operator (through the marketplace) to be able to chargetheir EVs. Due to the initial stage of EV market, it is assumed that the filling station has only one EVSE.
In fast charging, there is some hysteresis effect when the battery is close to its full load, so it is only ableto charge at fast speed until 80% of SOC [NPE 2010]. As the minimum SOC is considered to remain30%, 50% of the battery charging is considered in this charging service.
The fast charging service is expected to be used to charge as much energy as possible (to allow for thelongest driving range), so keeping the assumption of a 24 kWh battery (see Table 4), average chargingsession demand is 12 kWh.
Driving speed is expected to be higher in highways than in the rest of charging services, so the efficiencyin this case is lower (EFI=150 Wh/km28), due to the effect of speed in efficiency [DOE 2014].
4.1 Base caseTable 8 presents the different parameters to be used in equations (1) and (8).
As in the traffic hotspot charging service, the relative cost for EV customers of the highway chargingevent must be compared with refuelling cost of an equivalent trip with an ICE vehicle. The maximumcharging service price to be requested by the EVSE Operator so that EV customers have a mileage costwhich is competitive against ICE vehicles is calculated by using equations (8):
: ≤ ∗ 0.084733€/ =12 ℎ
150 ℎ/ ∗ 0.084733€/ = 6.77864€/
: ≤ ∗ 0.074561€/ =12 ℎ
150 ℎ/ ∗ 0.074561€/ = 5.96488€/
Therefore, by adding 21% VAT, the maximum EV charging prices for EV customers to have a competitivemileage cost against gasoline and diesel are 8.20 € and 7.22 € per charging session, respectively.
27 In fact, “All recharging points accessible to the public shall also provide for the possibility for electricvehicle users to recharge on an ad hoc basis without entering into a contract with the electricity supplieror operator concerned” [OJ L307/1].28 This is Nissan Leaf’s consumption at 80 km/h [DOE 2014].

GA MOVE/FP7/265499/Green eMotion WP 9: Deliverable 9.4. Part 2 Page 33 of 70
Parameter Value Unit Reference
P 50 kW
Scenario descriptionE 12 kWh
EF 150 Wh/km
N 1 EVSE
VAT 0 % EVSE Operator is not the final customer
MPEVSEO 2000 €/year See section 2.5.1
Tp 6.832399 €/kW/month
[Endesa 2014]Te1 0.122383 €/kWh
Te2 0.096216 €/kWh
Te3 0.065923 €/kWh
M 1.36 €/month [BOE-A-2011-14782]
EVSEInv 27 150 €/EVSE[NPE 2014]
EVSEO&M 3 075 €/EVSE/year
Table 8: Values for the parameters in the Highway charging service (base case)
The costs and incomes for the EVSE Operator are obtained by using equations (1) and (4), respectively :
= ⟨{( ∗ ∗ 12) + [(23% ∗ + 66% ∗ + 11% ∗ ) ∗ ∗ ]} ∗ (1 + 5.1127%)⟩
+ ( ∗ 12) ∗ (1 + ) + (1 + 7%) . − 17% ∗ (1 + 7%) .
+ & ∗ +
= ⟨{(50 ∗ 6.832399 ∗ 12)
+ [(23% ∗ 0.122383 + 66% ∗ 0.096216 + 11% ∗ 0.065923) ∗ 12 ∗ ]} ∗ (1 + 5.1127%)⟩
+ (1.36 ∗ 12) ∗ (1 + 0%) +27150
(1 + 7%) . − 17% ∗ (1 + 7%) .
+ 3075 ∗ 1 + 2000
= 14175.89 + 1.24751 ∗
= ( ∗ ∗ ) + = ( ∗ ∗ 1) +
If no additional sources of income are considered (OS=0), the minimum number of charging sessions perEVSE to have a positive result (income > cost) can be calculated by:
( )6.77864 ∗ = 14175.89 + 1.24751 ∗ ⇔ ~2563 / ⇒ 7.02 /
( )5.96488 ∗ = 14175.89 + 1.24751 ∗ ⇔ ~3005 / ⟹ 8.23 /
(14)

GA MOVE/FP7/265499/Green eMotion WP 9: Deliverable 9.4. Part 2 Page 34 of 70
This means that the highway EVSE needs to be used to charge more than 8.23 (7.02) times per day onaverage, in order for the EVSE Operator to offer a competitive mileage cost for EV customers incomparison with diesel (gasoline) vehicles.
Even with a high penetration of EVs on the road, this target usage seems to be quite difficult to reach in ahighway EVSE, especially considering that each charging sessions takes about 15 minutes (12 kWh /50kW) to be completed, i.e. the EVSE must be in use about 4 hours per day on average. Taking intoaccount that highway EVSEs are expected to be used with a strong seasonal component (used moreoften in summer and in weekends) and that the number of EVSE per filling station is likely to bedimensioned to satisfy peak demand, the average number of charging sessions per EVSE and per day isexpected to be quite low, even if it can be increased with dual charging (see section 4.2.7).
Therefore, the EVSE Operator needs to look for additional sources of revenue. As in the traffic hotspotcharging case, advertising seems to be a good option. In this case, however, the impact of theadvertisement is expected to be lower than in the traffic hotspot, because, on the contrary to theadvertisements in cities (as in the traffic hotspot case), highway advertisements need to have a bigsurface to be visible from the main track of the highway, which is not the case of EVSE located in a fillingstation or similar. Therefore, the price for advertising in highway EVSEs is likely to be lower than in thetraffic hotspot case29. If the expected income is in the lower range of the advertisement options for phonebooths (about 4000 €/year), the required EVSE usage to offer competitive prices to EV customers can bereduced to:
( )6.77864 ∗ + 4000 = 14175.89 + 1.24751 ∗ ⇔ ~1840 / ⇒ 5.04 /
( )5.96488 ∗ + 4000 = 14175.89 + 1.24751 ∗ ⇔ ~2158 / ⟹ 5.91 /
In the upper price ranges (about 10 000 €/year), just 2.07 and 2.43 charging sessions per EVSE and perday would be enough for the EVSE Operator to offer competitive prices against gasoline and dieselvehicles, respectively.
Another good alternative for the highway charging case is the attraction of clients to an existing shop orrestaurant. A shop located in an existing filling station sells about 0.0421 € per litre customers fill in,leaving a commercial margin of about 30%30. Taking into account that the average Spanish driver fills inabout 29.5 litres when they go to a filling station31, the margin per filling is about 0.3726 €. However,highway EVSE need more time to charge the EV than filling pumps need to top up the tanks of ICEvehicles, so it is more likely that EV customers use that extra time to eat or drink in the restaurant or tobuy something in the shop than drivers of ICE vehicles do [Deirdre 2014].
29 For example, the effect of the potential impact can be seen in the price difference for advertising in anairport and in rail stations in the Netherlands: the price for Schiphol airport is more than double the pricein Dutch railways stations (250 € per face and per week, compared to 105 € per face and per week),http://www.exterionmedia.com/nl/onze-mogelijkheden/onze-pakketten/landelijk-adverteren/schiphol-pakket/ [access in February 2015].30
https://mundopetroleo.com/resources/repository/PARTICIPACIONES/Las_diferentes_cuentas_explotacion.pdf [access in February 2015].31 http://www.libertaddigital.com/economia/los-espanoles-echan-3-litros-menos-de-combustible-en-cada-repostaje-1276417460/ [access in February 2015].

GA MOVE/FP7/265499/Green eMotion WP 9: Deliverable 9.4. Part 2 Page 35 of 70
Assuming an additional expenditure of 5 €/charging session (either in the shop or in the restaurant) onaverage, the extra income would be 1.50 €/charging session (30% margin). In this case, the requirednumber of charging sessions to offer competitive prices with diesel vehicles (the same can be done forgasoline) is calculated according to:
5.96488 ∗ + + 1.50 ∗ = 14175.89 + 1.24751 ∗
Therefore, if the income from advertising (Ad) is:
· Ad = 0 €/year (no advertising) è C = 2280 charging sessions/year ~ 6.25 sessions/day.
· Ad = 4000 €/year (lower price range)è C = 1637 charging sessions/year ~ 4.48 sessions/day.
· Ad = 10 000 €/year (upper price range)è C = 672 charging sessions/year ~ 1.84 sessions/day.
Based on these figures, it can be concluded that the highway EVSE Operator needs to obtain a goodadvertising contract and to be able to attract EV consumers to other businesses (shop/restaurant) closeto the EVSE in order to be able to offer prices that make electric mobility competitive with traditional ICEvehicles (7.22-8.20 €/charging session) and have a profitable business case.
An additional constraint is that, on the contrary to existing filling stations, which are the only alternative forfilling up ICE vehicles, highway charging is a complement of private home charging (for EV customerswho can charge at home) and with public charging spot for street side parking (for EV customers whocannot) for long-distance trips. As EV customers can charge their vehicles (at a cheaper price) overnight,highway charging is expected to be mainly used by:
· Long-distance travellers: In general, they will use highway charging along their trip. They arelikely to start their trip with a full battery, therefore, charging time is expected to take place in non-rush hours (around noon or early afternoon). This is a very good customer segment, as they willprobably have lunch while charging and, hence, increase restaurant sales. On the contrary, theymay take up the EVSE for more time than just charging time. Some kind of valet service might berequired in this case.
· EV customers with high daily distance requirements (taxis, delivery fleets…): This customersegment is more likely to request the charging service quite spread throughout the day, althoughit will probably be more concentrated in the morning. It is also likely that they use filling stationslocated in roads or outside the city centre, rather than highway stations, so they may not fit well inthis charging service. In addition, they may also have base stations where they will be able tocharge at cheaper prices.
· EV customers that cannot charge overnight, either because they do not have access to homecharging or because they cannot always find a free public charging spot. These EV customersare expected to charge in rush hours, either in the morning or in the evening. Morning users mayuse the restaurant for having breakfast, while evening users may use it for having a drink.Although they will take up the EVSE for a shorter time, compared to customers having lunch, avalet service may also be required for these customers.
Therefore, the profitability of the highway charging service is not as clear as the one in the traffic hotspotat the moment (with the present EV market, when there are more EVs on the road, it may be theopposite) and it is dependent on the types of EV customers it may serve to. Highway filling stations whichcan attract different types of EV customers (with different charging patterns, as discussed above, so thatthe EVSE have several usages along the day), in areas with enough EVs on the road and which cannegotiate good prices for advertising, may have a positive business case.
In early stages of EVSE deployment, highway fast charging can also be used by the filling station ownerfor self-advertising purposes and, this way, attract more drivers of ICE vehicles to his/her fuel pumps,shops and restaurants.

GA MOVE/FP7/265499/Green eMotion WP 9: Deliverable 9.4. Part 2 Page 36 of 70
In a highway EVSE, the billing scheme might be a time-based or an energy-based system, which mayalso offer different prices depending on the charging speed or type (AC vs. DC).
Due to the importance of having several charging sessions per day, the billing scheme must be carefullydesigned. A billing scheme which only considers time is not likely to be accepted by EV customers, as theprice would result too high:
ℎ = ∗ (1 + ) ∗
( ) ℎ = 6.77864€/ ∗ (1 + 21%) ∗50
12 ℎ/ = 34.18€/ℎ
( ) ℎ = 5.96488€/ ∗ (1 + 21%) ∗50
12 ℎ/ = 30.07€/ℎ
An alternative is to charge per electricity consumption while charging and combine it with a time-basedtariff for the rest of the time that the EV is connected to the EVSE. The maximum price per kWh (so thatEVs have a mileage cost competitive against ICE vehicles) can be calculated as follows:
ℎ =∗ (1 + )
( ) ℎ =6.77864€/ ∗ (1 + 21%)
12 ℎ/ = 0.6835€/ ℎ
( ) ℎ =5.96488€/ ∗ (1 + 21%)
12 ℎ/ = 0.6015€/ ℎ
4.2 Sensitivity analysis
4.2.1 EVSE amortisation costThe EVSE investment cost and the EVSE lifetime data are taken from the latest NPE report [NPE 2014],which are valid for 2013. Although there might be cases where EVSE investment costs are higher (e.g.situations in which the distribution grid must be strongly reinforced, or places where more complicatedcivil works are needed), future prices are expected to decline. Likewise, future EVSE is expected to lastlonger (even if there might be cases where lifetime is reduced by e.g. vandalism).
Therefore, under the assumptions of a 10% reduction in hardware costs (2000 €) and a lifetime extensionto 10 years, the amortisation cost is reduced to:
=25150€/(1 + 7%) − 1
7% ∗ (1 + 7%)
= 3580.79€/ .
This results in an annual amortisation cost about 1200 €/EVSE lower than in the base case, so therequired EVSE usage to offer competitive prices to EV customers against diesel vehicles is also reducedto about 7.5 charging sessions per day, which is still too high:
5.96488 ∗ = 12981.14 + 1.24751 ∗ ⇔ ~2752 / ⟹ 7.54 /
Therefore, the EVSE Operator still needs to negotiate a good advertising contract (e.g. 4000 €/year) andto have an attached shop or restaurant, so that it can offer competitive prices under expected EVSEusage rates:
5.96488 ∗ + 4000 + 1.50 ∗ = 12981.14 + 1.24751 ∗ ⇔ ~1445 / ⟹ 3.95 /

GA MOVE/FP7/265499/Green eMotion WP 9: Deliverable 9.4. Part 2 Page 37 of 70
4.2.2 Battery sizeAs discussed in the traffic hotspot case (see section 3.2.2), the battery size affects the amount of energyto be charged per session. Assuming again that the amount of energy to be charged per session isdoubled (24 kWh), the maximum charging price that the EVSE Operator can request so that EVcustomers have a competitive mileage cost with ICE vehicles is also doubled:
: ≤ ∗ 0.084733€/ =24 ℎ
150 ℎ/ ∗ 0.084733€/ = 13.5573€/
: ≤ ∗ 0.074561€/ =24 ℎ
150 ℎ/ ∗ 0.074561€/ = 11.9298€/
EVSE Operator’s variable costs also double to 2.49502 €/session, so the required amount of chargingsessions for EVSE Operators to offer competitive prices against diesel vehicles is calculated according tothe following formula:
11.9298 ∗ + + ℎ = 14175.89 + 2.49502 ∗
For different incomes from advertisement (Ad) and shop/restaurant (Shop), the minimum average numberof charging sessions per day is presented in Table 9 below.
Shop = 0 €/session Shop = 1.5 €/sessionAd = 0 €/year 4.12 3.55
Ad = 4000 €/year 2.95 2.55
Ad = 10 000 €/year 1.21 1.05
Table 9: Highway EVSE usage requirements for different co-financing alternatives (bigger battery size)
As a result, if battery size increases and, hence, the amount of electricity demanded per chargingsession, less frequent EVSE usage is needed for the EVSE Operator to be able to offer EV chargingprices which make EV mileage cost competitive with ICE vehicles. On the contrary to the traffic hotspotcase (where there was not clear whether battery size increase has a positive or a negative effect on thebusiness case), an increase in EV battery size is expected to have a positive impact in the highwaycharging service, as the EV market is expected to grow, together with EV customers’ confidence to makelonger trips and, hence, use highway charging more often. Moreover, if bigger batteries are a good signalfor EV customers to overcome range anxiety and help increase EV market, these usage rates could beobtained in more locations than in the base case.
However, unless charging power is also increased (e.g. 100 kW, which would lead to higher electricity billand EVSE amortisation and O&M costs, although not double the price considered in the base case)charging time would reach almost half an hour. Therefore, the valet service seems a must in this case toallow for several charging sessions per day.
4.2.3 EV efficiencyUnless disruptive EV designs can be found to overcome air resistance, EV efficiency is not expected tobe better than the one in the base case. Quite on the contrary, it is likely that existing EVs have lowerefficiencies while driving at highway speed. If efficiency is 180 Wh/km (Nissan Leaf’s consumption atabout 100 km/h [DOE 2014]), a 12 kWh charging event provides a driving range of about 67 km. As aresult, EV mileage cost rises (shorter distance travel with the same expenditure) and, thus, it needs lowerEV charging prices to be competitive against ICE vehicles and, hence, more charging sessions per day:
: ≤ ∗ 0.074561€/ =12 ℎ
180 ℎ ∗ 0.074561€/ = 4.9707€/
4.9707 ∗ = 14175.89 + 1.24751 ∗ ⇔ ~3808 / ⟹ 10.43 /

GA MOVE/FP7/265499/Green eMotion WP 9: Deliverable 9.4. Part 2 Page 38 of 70
Moreover, this lower EV efficiency (compared to the base case) may become an additional annoyance forEV customers. For a 100 km round-trip, EV customers would need to charge twice, even if they chargedat home before departure.
However, if EV battery sizes increase (as discussed in subsection 4.2.2), it is likely that EVs are usedmore often for highway travelling, as the same 100 km round trip would require just one charging event(of about 30 minutes: 24 kWh/50 kW) if the battery is filled up at the beginning of the journey. If EVcustomers spend the 30-minute charging period having a meal at a cost of about 15 € on average (1.5people per vehicle [EEA 2010] and about 10 €/person32), the benefit would be 4.50 €/charging session(30% of the expenditure). If, in addition, the EVSE Operator can obtain an advertising contract of e.g.4000 €/EVSE per year, competitive prices can be offered to EV customers with:
4.9707 ∗ + 4.50 ∗ + 4000 = 14175.89 + 1.24751 ∗ ⇔ ~1238 / ⟹ 3.39 /
4.2.4 Additional costs for the EVSE OperatorAs in the traffic hotspot charging service, no additional fixed costs for the highway EVSE operator aretaken into account. In a highway filling station, shop or restaurant, EVSE operation is not the mainbusiness for the EVSE operator. Therefore, it is quite likely that the assumption of outsourcing EVSEoperation is fulfilled (see footnote 7) and, hence, no additional staff costs is needed for operating theEVSE.
However, there might be additional costs for the valet service. Therefore, the EVSE Operator shouldassess whether the increased EVSE usage rate pays for the additional costs of the service.
4.2.5 Other countriesAs discussed in section 2.5, the differences that may arise between different EU Member States areassessed by calculating the results for Spain (base case), Germany and the Netherlands.
4.2.5.1 GermanyThe main parameters to be used in Germany are listed in Table 10.
Parameter Value Unit Reference
E 12 kWh
Scenario descriptionEF 150 Wh/km
N 1 EVSE
VAT 0 % EVSE Operator is not the final customer
MPEVSEO 2000 €/year See section 2.5.1
Te 0.25 €/kWhData provided by RWE
M 8.60 €/month
EVSEInv 27 150 €/EVSE[NPE 2014]
EVSEO&M 3 075 €/EVSE/year
Table 10: Values for the parameters in the Highway charging service (Germany)
32 http://www.numbeo.com/cost-of-living/country_result.jsp?country=Spain [access in February 2015].

GA MOVE/FP7/265499/Green eMotion WP 9: Deliverable 9.4. Part 2 Page 39 of 70
The maximum charging service price to be requested by a German highway EVSE Operator so that EVcustomers have a mileage cost competitive against ICE vehicles is calculated by using equations (10):
: ≤ ∗ 0.093123€/ =12 ℎ
150 ℎ/ ∗ 0.093123€/ = 7.44984€/
: ≤ ∗ 0.077997€/ =12 ℎ
150 ℎ/ ∗ 0.077997€/ = 6.23976€/
Therefore, by adding 19% VAT, the maximum EV charging prices for EV customers to have a competitivemileage cost with gasoline and diesel vehicles are 8.87 € and 7.43 € per charging session, respectively.As in the case of Spain, the billing scheme might be a time-based or an energy-based system, which mayalso offer different prices depending on the charging speed or type (AC vs. DC).
The costs for a traffic hotspot EVSE Operator in Germany are obtained by using equation (2):
= ( ∗ ∗ ) + ( ∗ 12) ∗ (1 + ) + (1 + 7%) . − 17% ∗ (1 + 7%) .
+ & ∗
+
= (0.25 ∗ 12 ∗ ) + (8.60 ∗ 12) ∗ (1 + 0%) +27150
(1 + 7%) . − 17% ∗ (1 + 7%) .
+ 3075 ∗ 1 + 2000
= 9953.74 + 3 ∗
The incomes for the EVSE Operator are obtained by using equation (4):
= ( ∗ ∗ ) + = ( ∗ ∗ 1) +
If no additional sources of income are considered (OS=0), the minimum number of charging sessions perEVSE to have a positive result (income > cost) can be calculated by:
( )7.44984 ∗ = 9953.74 + 3 ∗ ⇔ ~2237 / ⇒ 6.13 /
( )6.23976 ∗ = 9953.74 + 3 ∗ ⇔ ~3073 / ⟹ 8.42 /
This means that the highway EVSE needs to be used to charge more than 8.42 (6.13) times per day onaverage, in order for the EVSE Operator to offer a competitive mileage cost for EV customers incomparison with diesel (gasoline) vehicles. These figures are in line with the results for Spain (better forgasoline and slightly worse for diesel vehicles) so the EVSE Operator needs to look for additional sourcesof revenue. Again, advertising seems a good option for increasing EVSE incomes. If the prices for phonebooth advertising in Spain are considered, the upper range (10 000 €/year per EVSE) would allowrecovering all EVSE Operator’s fixed costs, but, as discussed in section 4.1, the expected income inhighway EVSE advertising is likely to be lower. In the lower range (4000 €/year per EVSE), the requiredEVSE usage to offer competitive prices to EV customers can be reduced to lower values:
( )7.44984 ∗ + 4000 = 9953.74 + 3 ∗ ⇔ ~1338 / ⇒ 3.67 /
( )6.23976 ∗ + 4000 = 9953.74 + 3 ∗ ⇔ ~1838 / ⟹ 5.03 /
On the other hand, the shop and restaurant business in Germany seems to be a growing market. In goodlocations, the turnover per filling station ranges between 94 000 €/year and 162 000 €/year [FS 2014].Assuming the same 30% margin as in Spain, and considering 6-8 pumps per filling station, the benefit perpump is about 4700-6000 €. Without advertising incomes, this extra income reduces to the requiredEVSE usage to even more modest usage rates:
( )7.44984 ∗ + 6000 = 9953.74 + 3 ∗ ⇔ ~889 / ⇒ 2.43 /

GA MOVE/FP7/265499/Green eMotion WP 9: Deliverable 9.4. Part 2 Page 40 of 70
( )6.23976 ∗ + 6000 = 9953.74 + 3 ∗ ⇔ ~1221 / ⟹ 3.34 /
If advertising is added to the income of shops and restaurants, it allows recovering all the fixed costs perEVSE, even in the lower advertising income range.
Although this EVSE usage rate is higher than in Spain, it is still low enough so that it can be reached inearly stages of electric mobility deployment in areas with enough EVs on the road and where EVcustomers need to drive relatively long distances.
4.2.5.2 The NetherlandsA highway EVSE cannot be assumed to be used for living or working function, so there is no reduction inthe electricity bill, as shown in Table 11, together with the rest of the parameters to be used in thisanalysis.
The maximum charging service price to be requested by the EVSE Operator so that Dutch EV customershave a mileage cost which is competitive against ICE vehicles is calculated by using equations (12):
: ≤ ∗ 0.093123€/ =12 ℎ
150 ℎ/ ∗ 0.099312€/ = 7.94496€/
: ≤ ∗ 0.078692€/ =12 ℎ
150 ℎ/ ∗ 0.078692€/ = 6.29536€/
Therefore, by adding 21% VAT, the maximum EV charging prices for EV customers to have a competitivemileage cost with gasoline and diesel are 9.61 € and 7.62 € per charging session, respectively.
Parameter Value Unit Reference
E 12 kWh
Scenario descriptionEF 150 Wh/km
N 1 EVSE
VAT 0 % EVSE Operator is not the final customer
MPEVSEO 2000 €/year See section 2.5.1
F 54 €/yearPrices for a three-phase, 80 A,
connection33Te 0.1874 €/kWh
R 0 €/year
P 1614.2855 €/year Grid fees for a 3 x 80 A connection34
EVSEInv 27 150 €/EVSE[NPE 2014]
EVSEO&M 3 075 €/EVSE/year
Table 11: Values for the parameters in the Highway charging service (The Netherlands)
33 http://www.nuon.nl/mkb/lightbox/tarieven-flexibel.jsp [access in February 2015].34 https://www.enexis.nl/consument/diensten-en-tarieven/tarieven/elektriciteit/periodieke-netwerktarieven-e?pageid=44 [access in February 2015].

GA MOVE/FP7/265499/Green eMotion WP 9: Deliverable 9.4. Part 2 Page 41 of 70
The costs for a highway EVSE Operator in the Netherlands are obtained by using equation (3):
ℎ ℎ
= [( + + ( ∗ ∗ )− ) ∗ (1 + )] + (1 + 7%) . − 17% ∗ (1 + 7%) .
+ & ∗
+
= [(54 + 1614.2855 + (0.1874 ∗ 12 ∗ )− 0) ∗ (1 + 0%)] +27150
(1 + 7%) . − 17% ∗ (1 + 7%) .
+ 3075
∗ 1 + 2000 = 11518.80 + 2.2488 ∗
The incomes for the EVSE Operator are obtained by using equation (4):
= ( ∗ ∗ ) + = ( ∗ ∗ 1) +
If no additional sources of income are considered (OS=0), the minimum number of charging sessions perEVSE to have a positive result (income > cost) can be calculated by:
( )7.94496 ∗ = 11518.80 + 2.2488 ∗ ⇔ ~2022 / ⇒ 5.54 /
( )6.29536 ∗ = 11518.80 + 2.2488 ∗ ⇔ ~2847 / ⟹ 7.80 /
This means that the highway EVSE needs to be used to charge more than 7.80 (5.54) times per day onaverage, in order for the EVSE Operator to offer a competitive mileage cost for EV customers incomparison with diesel (gasoline) vehicles. Although these values are the best among the three countriesanalysed, the EVSE Operator still needs to look for additional sources of revenue and, again, advertisingseems a good option. As discussed in section 4.1, the expected income in highway EVSE advertising islikely to be in the lower range of the prices considered for traffic hotspots (4000 €/year per EVSE). In thiscase, the required EVSE usage to offer competitive prices to EV customers can be reduced:
( )7.94496 ∗ + 4000 = 11518.80 + 2.2488 ∗ ⇔ ~1320 / ⇒ 3.62 /
( )6.29536 ∗ + 4000 = 11518.80 + 2.2488 ∗ ⇔ ~1858 / ⟹ 5.09 /
These usage rates are almost the same as for Germany when the same advertising income isconsidered. In order to further improve EVSE Operator’s business performance, additional incomes froma shop or a restaurant would be more than welcome. The average expenditure of drivers in theNetherlands is 7.80 €/filling [FS 2014], which, assuming the same benefit rate as in Spain (30%), leaves2.34 €/session. In this case, the required EVSE usage rate so that the EVSE Operator can recover itscosts and still offer EV customers a price for EV charging which makes their mileage cost be the same asthe cost of an equivalent trip with an ICE vehicle is calculated as follows:
( )7.94496 ∗ + 4000 + 2.34 ∗ = 11518.80 + 2.2488 ∗ ⇔ ~936 /⇒ 2.56 /
( )6.29536 ∗ + 4000 + 2.34 ∗ = 11518.80 + 2.2488 ∗ ⇔ ~1177 /⟹ 3.23 /
As in the case of Germany, this EVSE usage rate is higher than in Spain, but it is still low enough so thatit can be reached in early stages of electric mobility deployment in areas where there are enough EVs onthe road and EV customers’ driving patterns require driving relatively long distances.

GA MOVE/FP7/265499/Green eMotion WP 9: Deliverable 9.4. Part 2 Page 42 of 70
4.2.6 Number of EVSETable 1235 presents the distribution of the main players in the Spanish filling station market. In 2013, allthe big ten wholesalers had more than 0.75% of market share in Spain.
Brand Stations Share
REPSOL 3615 34.68%
CEPSA 1516 14.54%
BP 675 6.48%
GALP 620 5.95%
DISA 534 5.12%
MEROIL 192 1.84%
SARAS 112 1.07%
ESERGUI 102 0.98%
PETROCAT 84 0.81%
REPOSTAR 80 0.77%
Malls/supermarkets 295 2.83%
Other 2599 24.93%
TOTAL 10 424 100%
Table 12: Number of filling stations per owner in Spain (December 2013)
At the moment, about 3% of the EVSE installed in Spain are located in filling stations36. In 2020, there willbe 82 000 publicly accessible EVSE in Spain [EC 2013, 1], so, assuming the same 3%, 2500 EVSE willbe installed in filling stations for highway fast charging37.
If main stakeholders install EVSE according to their market share, the top ten will have at least 19 EVSEin 2020, which means that having access to the marketplace costs them about 105 € per year and perEVSE (less than 1% of annual costs), compared to 2000 € in the base case (see section 2.5.2).Therefore, the fixed costs per EVSE are reduced in 1895 €/year and, hence:
( )5.96488 ∗ = 14175.89− 1895 + 1.24751 ∗ ⇔ ~2604 / ⟹ 7.13 /
Although this EVSE usage is still quite high, there is a clear portfolio effect, as the complete removal ofthe marketplace access costs would only further decrease the required EVSE usage to 7.07 chargingsessions per day.
35 http://www.invertia.com/noticias/surtidores-consumo-espana-tiene-gasolineras-2934188.htm [access inFebruary 2015].36 http://www.electromaps.com/puntos-de-recarga/espana?TipoP=10 [access in February 2015].37 The objective of publicly accessible EVSE in Spain seems to be quite optimistic, but it is the officialone. On the contrary, fast charging is likely to account for more than 3% of publicly accessible EVSE inthe future, so the total number might be quite well estimated.

GA MOVE/FP7/265499/Green eMotion WP 9: Deliverable 9.4. Part 2 Page 43 of 70
4.2.7 Dual chargingThere is already some equipment in the market [ABB 2014], [Circontrol 2014], [Efacec 2014] which allowsfor dual charging, i.e. a single EVSE allows for charging both at fast charging and at semi-fast charging. Ifthe EVSE Operator installs this type of equipment, it can serve both DC fast (at 50 kW) and AC fast (43kW) or semi-fast charging sessions (22 kW). The EVSE prices considered in this deliverable are takenfrom the latest NPE report [NPE 2014], in particular from illustration 25 in page 51, which does notconsider this type of equipment. Therefore, its costs are estimated as the costs of an EVSE with fastcharging capabilities, plus half the hardware cost of a two-outlet 22 kW EVSE. In this case, amortisationcost is calculated according to the following formula:
=27150€ + 6000€
2(1 + 7%) . − 1
7% ∗ (1 + 7%) .
= 4775.54€/ + 527.68€/
Likewise, EVSE O&M cost is assumed to be the O&M cost of a fast EVSE, plus half the maintenance costof a semi-fast EVSE38:
& = 3075€/ +500
2 €/ = 3075€/ + 250€/
In addition, the power component of the electricity bill needs to be increased, as the contracted powerneeds to be 72 kW (50 kW + 22 kW). In this case, total cost of the power component (including electricitytax) is calculated as follows:
= (50 + 22) ∗ 6.832399€/ / ℎ ∗ 12 ℎ/ ∗ (1 + 5.1127%)= 4309.03€/ + 1895. 97€/
Therefore, the additional cost of the EVSE with dual charging capabilities, compared to the fast EVSE is2673.65 €/year (527.68 + 250 + 1895.97).
Although semi-fast charging sessions do not have the same hysteresis effect as fast charging sessionsand, hence, they could be used to charge up to 70% of the battery, 12 kWh/charging session isconsidered for both types of charging events. Under this assumption, the energy component of theelectricity bill remains the same, as long as C represents the total charging events in the EVSE, i.e. theaddition of fast and semi-fast charging sessions.
By adding these additional 2673.65 € to the annual costs calculated in the base case (section 4.1), EVSEOperator’s costs become:
= 14175.89 + 2673.65 + 1.24751 ∗ = 16849.54 + 1.24751 ∗
As the cost per kilometre for EV customers is compared with an equivalent trip with an ICE vehicle, thesame price is considered for both the fast and the semi-fast charging sessions39.
38 The O&M costs of a semi-fast EVSE (1725 € in total, see Table 5) consist of Special use permit (whichis assumed not to be applicable in a highway EVSE), maintenance cost (500 €/year) and other costs(communications, IT systems…) whose price is the same for both types of EVSE and, hence, which areassumed to be covered by fast EVSE O&M cost.39 It is likely that the price for DC charging is more expensive than for AC charging, as the value providedto EV customers is higher (shorter charging time), but the comparison with the equivalent ICE vehicle tripdoes not take this effect into account.

GA MOVE/FP7/265499/Green eMotion WP 9: Deliverable 9.4. Part 2 Page 44 of 70
In this case, the minimum number of charging sessions to cover EVSE Operator’s costs and still offer acompetitive price to EV customers is calculated as follows:
( )6.77864 ∗ = 16849.54 + 1.24751 ∗ ⇔ ~3047 / ⟹ 8.35 /
( )5.96488 ∗ = 16849.54 + 1.24751 ∗ ⇔ ~3572 / ⟹ 9.79 /
Although the required number of charging sessions per day is higher than in the base case, in the EVSEconsidered here two charging sessions can take place at the same time, so the required usage per EVSEoutlet is almost halved. Moreover, not all existing EVs allow for DC charging, so the portfolio of potentialusers of the EVSE is increased.
If advertising and shop/restaurant can provide additional revenues, the number of charging sessionsrequired can be reduced. The following assumptions are made:
· Advertising: 4000 €/per EVSE and per year (like a regular advertising surface in a phone booth ofa small city, i.e. the lower range of potential income).
· Restaurant: 3 €/charging session. This is the average value of 4.5 €/charging session (EVcharging at 22 kW needs about 30 minutes to charge 12 kWh, which can be used by EVcustomers to have a meal, see end of section 4.2.3) and 1.5 €/charging (the amount assumed forEV customers using fast charging speed).
· Shop: 0.3726 €/charging session (the same expenditure as in existing filling stations, see section4.1).
The required number of charging sessions to offer prices which are competitive against diesel is then:
(5.96488 ∗ ) + 4000 + 3 ∗ + 0.3726 ∗ = 16849.54 + (1.24751 ∗ ) ⇔= 1589 / ~4.35 /
This leads to about 4.35 charging sessions per EVSE and per day, or 2.17 charging session per outletand per day, which still seems a bit high under present EV market, but not so difficult to reach when EVmarket deploys. Moreover, if battery sizes are increased (see section 4.2.2), the amount of energy tocharge doubles (24 kWh) and the variable cost part of EVSE Operator’s cost too (2.49502*C), but alsothe maximum charging service price and the expected income in the restaurant (as average profit canrise from 3 €/charging session to 4.5 €/session). In that case:
(2 ∗ 5.96488 ∗ ) + 4000 + 4.5 ∗ + 0.3726 ∗ = 16849.54 + (2 ∗ 1.24751 ∗ ) ⇔= 899 / ~2.46 /
In an area with enough EVs and with the battery technology allowing longer driving ranges, having twofast charging sessions per day and one semi-fast charging session every two days on average seemsmuch more likely to happen.

GA MOVE/FP7/265499/Green eMotion WP 9: Deliverable 9.4. Part 2 Page 45 of 70
5 Private home charging serviceThis service presents the case of charging at a private EVSE. The charging speed is assumed to be slow(3.7 kW40). EV customers themselves are assumed to buy the EVSE required for charging their EVs (sothey act as EVSE Operator) and buy electricity directly from the Electricity retailer (which performs theEVSP role in this case). As a result, there is no need for a marketplace in this charging service.
Although EV customers already have an existing supply point for their home electricity consumption, it isassumed that electricity supply for the EV is made through a new supply contract. As a result, the powerterm needs to be dimensioned to satisfy maximum EV power demand (4.6 kW), whereas including the EVon the existing supply contract may have avoided any extension41. On the other hand, the EV contractmay use the super-valley tariff (which offers cheaper prices overnight) without having to pay moreexpensive prices for the electricity consumed at home during the day. Moreover, this way they can have amobility contract with the Electricity retailer, so that it is their EVSP for EV charging outside home.
Driving patterns are expected to be equivalent to the traffic hotspot charging service, so the sameefficiency (120 Wh/km) is assumed and the maximum amount of energy to be charged by the EV isobtained as 70% of the battery size, from an initial SOC of 30% to a maximum SOC of 100% [NPE 2010].Hence, it is assumed that each charging session requests 10 kWh of electricity.
5.1 Base caseTable 13 presents the different parameters to be used in this charging service:
Parameter Value Unit Reference
P 4.6 kW
Scenario descriptionE 10 kWh
EF 120 Wh/km
K 19 000 km/year [Nissan 2015, 1]
VAT 21 % EV customers are final customers
MPEVSEO 0 €/year No marketplace required
Tp 3.503619 €/kW/month[BOE-A-2014-1053]
Te3 0.044146 €/kWh
M 0.81 €/month [BOE-A-2011-14782]
EVSEInv 1900 €/EVSEEstimation
EVSEO&M 50 €/EVSE/year
Table 13: Values for the parameters in the Private Home charging service (base case)
40 In central and northern European countries, bigger connections allow for faster charging speeds.41 Power contracts in Spain are limited in 5 A steps, so a regular supply at 230V, single-phase, must haveat least 20 A (4.6 kW, cos phi=1) to be able to supply 3.7 kW, which is the typical home contract in Spain.Hence, if overnight home electricity consumption is low, EVs can be charged with existing connection.

GA MOVE/FP7/265499/Green eMotion WP 9: Deliverable 9.4. Part 2 Page 46 of 70
The EVSE investment cost considered in the base case is lower than the one proposed by GermanNational Platform for Electric Mobility (NPE) for 2013 [NPE 2014], because the technical characteristics(mainly, communication and metering requirements) of the EVSE considered in that report may not beneeded by EV customers. A sensitivity analysis on this parameters is presented in section 5.2.1.
On the contrary to the two charging services discussed so far, private home is expected to be thepreferred charging alternative for those EV customers who can charge their EVs at home. As a result, theimpact of this charging service in EV customers’ TCO is higher and, thus, both fixed and variable costsmust be included in the analysis, so equations (7) are used. Based on them, the TCOs are calculated as:
= 1511 + 0.113528 ∗ = 1511 + 0.113528 ∗ 19000 = 3668.03€/
= 1738 + 0.101219 ∗ = 1738 + 0.101219 ∗ 19000 = 3661.16€/
= 2198 + 0.011 ∗ + (1 + 7%) . − 17% ∗ (1 + 7%) .
+ & + ℎ
= 2198 + 0.011 ∗ 19000 +1900
(1 + 7%) . − 17% ∗ (1 + 7%) .
+ 50 + ℎ
= 2791.20 + ℎ
The EV charging cost in this case is the addition of the cost resulting from private home charging serviceand the cost of charging outside home.
Equation (1) is used to calculate the electricity bill, but having 100% of charging events made at night:
( ℎ ℎ )= ⟨{( ∗ ∗ 12) + [(100% ∗ ) ∗ ∗ ]} ∗ (1 + 5.1127%)⟩ + ( ∗ 12) ∗ (1 + )= ⟨{(4.6 ∗ 3.503619 ∗ 12) + [(100% ∗ 0.044146) ∗ 10 ∗ ]} ∗ (1 + 5.1127%)⟩+ (0.81 ∗ 12) ∗ (1 + 21%) = 257.74 + 0.56148 ∗
If it is assumed that EV customers charge at home one out of two days, C is 180 charging sessions. Inthat case, the annual electricity bill becomes 358.81 €/year and the distance that can be driven due tohome charging is 15 000 km/year:
ℎ ℎ =180 / ∗ 10 ℎ/
120 ℎ/ = 15000 /
The remaining 4000 km must be driven by charging outside home. The maximum charging service pricethat EVSE Operators can ask so that the relative cost of the charging event for EV customers can becompared with the refuelling cost of an equivalent trip with an ICE vehicle is provided by equations (8):
: ≤ ∗ 0.084733€/ =10 ℎ
120 ℎ/ ∗ 0.084733€/ = 7.0611€/
: ≤ ∗ 0.074561€/ =10 ℎ
120 ℎ/ ∗ 0.074561€/ = 6.2134€/
The worst case scenario for EV customers is when they compare their TCO with diesel vehicles (which islower than the TCO for gasoline vehicles), but EVSE Operators for public charging services (traffichotspot and highway charging) establish the charging service price so that the relative cost of thecharging event for EV customers is the same as the cost of an equivalent trip with a gasoline vehicle(which is higher than for a diesel vehicle, as shown just above). In that case, EV customers’ TCObecomes about 3490 €/year, which is about 175 € lower than the cost of owning a diesel vehicle:
= 2791.20 + ℎ = 2791.20+ (257.74 + 0.56148 ∗ 180) + (4000 ∗ 0.084733)= 3488.94€/

GA MOVE/FP7/265499/Green eMotion WP 9: Deliverable 9.4. Part 2 Page 47 of 70
The minimum private home charging service usage rate for EV customers to have a lower TCO than ICEvehicles can be calculated as:
= = 2791.20 + ℎ ⇔ 3668.03
= 2791.20+ (257.74 + 0.56148 ∗ ) + 19000−∗ 10
0.120 ∗ 0.084733 ⇔= 152.45~153 /
This means that about 12 700 km must be driven out of home charging, i.e. about two thirds of the annualmileage must rely on private home charging for EVs to have a TCO lower than ICE vehicles.
5.2 Sensitivity analysisUnder the conditions considered in the base case, the purchase of an EV and the use of private homecharging would be beneficial for EV customers. However, there are uncertainties over some parameterswhich may affect such conditions and, hence, must be assessed.
5.2.1 EVSE investment costThe EVSE investment cost considered in the base case is lower than the one proposed by GermanNational Platform for Electric Mobility (NPE) for 2013 [NPE 2014], because the technical characteristics(mainly, communication and metering requirements) of the EVSE considered in that report may not beneeded by EV customers. However, if such technical requirements are established by national regulation,the cost of EVSE for private home charging must be in line with the values in NPE, and, hence, annualEVSE O&M costs rise up to 1175 €/year and annual EVSE amortisation costs become:
=2500€/
(1 + 7%) . − 17% ∗ (1 + 7%) .
= 439.74€/
The increase in EVSE investment cost would not affect the advantages of EVs over ICE vehicles, as thedifference is about 105.54 €/year higher, which is lower than the TCO difference. On the contrary, muchhigher O&M costs (1175 €/year vs. 50 €/year) due to communication capabilities do change the situationand EV ownership become more expensive than ICE vehicle ownership.
Therefore, regulators must weigh the advantages of imposing more strict technical conditions for privatehome charging against the additional costs for EV customers.
5.2.2 Annual mileageThe annual mileage considered in the base case is based on the reported mileage by Nissan Leaf usersin Spain [Nissan 2015, 1], but the average mileage of Spanish drivers is much lower (9928 km/year). Ifthe annual mileage is assumed to be 10 000 km/year, the TCOs for ICE vehicles result:
= 1511 + 0.113528 ∗ = 1511 + 0.113528 ∗ 10000 = 2646.28€/
= 1738 + 0.101219 ∗ = 1738 + 0.101219 ∗ 10000 = 2750.19€/
Assuming the same distribution of charges as in the base case (80% of mileage is based on private homecharging, while publicly accessible EVSE are used to cover the remaining 20% of mileage), the number ofprivate home charging events can be calculated as:
ℎ ℎ =10000 / ∗ 80% ∗ 0.120 ℎ/
10 ℎ/ = 96 /
This number of sessions results in an annual mileage of 8000 km driven due to private home chargingand a home charging electricity bill of 311.64 €/year:
( ℎ ℎ ) = 257.74 + 0.56148 ∗ = 311.64€/

GA MOVE/FP7/265499/Green eMotion WP 9: Deliverable 9.4. Part 2 Page 48 of 70
The remaining 2000 km must be driven by charging outside home, but, even if all charging sessionsoutside home were for free, the TCOs would be:
= 2198 + 0.011 ∗ + (1 + 7%) . − 17% ∗ (1 + 7%) .
+ & + ℎ
= 2198 + 0.011 ∗ 10000 +1900
(1 + 7%) . − 17% ∗ (1 + 7%) .
+ 50 + 311.08 = 3003.84€/
In this case, EV becomes more expensive than ICE vehicles. However, it is remarkable that, for theaverage Spanish driver, gasoline vehicles are cheaper than diesel vehicles, but diesel is the dominantfuel in Spain, both in terms of total number of vehicles [DGT 2014] and in new registrations42.
Nevertheless, the average mileage of new cars (less than 5 years old) is almost as high as the one byNissan Leaf drivers (18500 km/year43), so the mileage assumed in the base case seems to be morerelevant in the case of electric mobility.
5.2.3 EV efficiencyIf EV efficiency is assumed to be higher than in the base case (as discussed in section 3.2.3), therequired energy amount to drive the same annual mileage increases. Assuming a 150 Wh/km efficiencyand the same annual mileage as in the base case (19 000 km/year), the required electricity amount is2850 kWh/year (19 000 km/year * 0.150 kWh/km).
If it is assumed that EV customers charge at home one out of two days, the private home chargingelectricity bill remains the same. On the contrary, the amount of kilometres driven from home charging islower: 12 000 km per year (180 charging sessions/year * 10 kWh/charging session / 150 Wh/km), so EVcustomers need to drive 7000 km/year by charging outside home.
Again, if the worst case scenario is considered (EV charging price for charging outside home is set tocompete with gasoline vehicles):
= 2791.2 + ℎ = 2791.2+ (257.74 + 0.56148 ∗ 180) + (7000 ∗ 0.084733)= 3743.14€/
The TCO is about 80 € more expensive for EVs than for ICE vehicles. Even if the EV charging price forcharging outside home is set to compete with diesel vehicles, the TCO for EVs is still higher (3671.93€/year) than for ICE vehicles, but almost negligible (just about 10 €/year).
On the contrary, if the same proportion of home charging is considered (80%), EV customers charge2280 kWh/year (80% * 2850 kWh/year) at home, i.e. they make 228 charging sessions at home (10kWh/charging session), and 3800 km/year (19000 km/year * 20%) are driven by charging outside home.In this case, the TCO for EVs is lower than for ICE vehicles:
= 2791.2 + ℎ = 2791.2+ (257.74 + 0.56148 ∗ 228) + (3800 ∗ 0.084733)= 3498.94€/
In this case, the TCO is about 160 € cheaper for EVs than for ICE vehicles, which emphasises theimportance of EV customers charging at home as much as possible to have a positive TCO.
42 Almost twice as many diesel vehicles are still sold compared to gasoline [Aniacam 2015].43 http://www.ioncomunicacion.es/noticia.php?id=%2015818 [access in February 2015].

GA MOVE/FP7/265499/Green eMotion WP 9: Deliverable 9.4. Part 2 Page 49 of 70
5.2.4 Other countriesThe differences that may arise between different EU Member States are assessed by calculating theresults for Spain (base case), Germany and the Netherlands. The differences in the electricity billstructure and in the prices for fossil fuels are considered, but also the average distance driven per year.As in the base case, the EVSE investment and O&M costs are lower than the ones in [NPE 2014], as thetechnical characteristics of the EVSE considered in that report may not be needed by EV customers.
5.2.4.1 GermanyThe main parameters to be used in Germany are listed in Table 14.
Parameter Value Unit Reference
E 10 kWh
Scenario descriptionEF 120 Wh/km
N 1 EVSE
K 15 000 km/year [Nissan 2015, 1]
VAT 19 % EV Customers are final customers
MPEVSEO 0 €/year No marketplace required
Te 0.25 €/kWhData provided by RWE
M 8.60 €/month
EVSEInv 1900 €/EVSEEstimation
EVSEO&M 50 €/EVSE/year
Table 14: Values for the parameters in the Private Home charging service (Germany)
The formula to consider both fixed and variable costs in Germany is presented in equations (9):
= 3161 + 0.011 ∗ + (1 + 7%) . − 17% ∗ (1 + 7%) .
+ & + ℎ
The EV charging cost in this case is the addition of the cost resulting from private home charging serviceand the cost of charging outside home. When charging at home, EV customers act as EVSE Operators,so equation (2) can be used:
= ( ∗ ∗ ) + ( ∗ 12) ∗ (1 + ) + (1 + 7%) . − 17% ∗ (1 + 7%) .
+ & ∗
+
= (0.25 ∗ 10 ∗ ) + (8.60 ∗ 12) ∗ (1 + 19%) +1900
(1 + 7%) . − 17% ∗ (1 + 7%) .
+ 50 ∗ 1 + 0
= 507.01 + 2.975 ∗
If it is assumed that EV customers charge at home one out of two days, C=180 charging sessions. In thatcase, the cost for EV customers as home EVSE Operators becomes 1042.51 €/year; while the distancethat can be driven due to home charging is 15 000 km/year, i.e. total annual mileage, so they would notneed to charge outside home. In this case, the TCO for EV customers results in:

GA MOVE/FP7/265499/Green eMotion WP 9: Deliverable 9.4. Part 2 Page 50 of 70
= 3161 + 0.011 ∗ + (1 + 7%) . − 17% ∗ (1 + 7%) .
+ & + ℎ
= 3161 + 0.011 ∗ 15000 + 1042.51 = 4368.51€/
Equations (9) also give the TCO for ICE vehicles:
= 1656 + 0.121816 ∗ = 3483.24€/
= 1958 + 0.103816 ∗ = 3515.19€/
The lack of subsidies for direct EV purchase, together with the lower average annual mileage consideredin Germany, make EV ownership much more expensive than owning ICE vehicles. In order to have thesame TCO as gasoline, the EV cannot be more than about 5000-5200 € more expensive than theequivalent gasoline vehicle (so a direct subsidy of about 6800-7000 € would be needed).
In Germany, most new cars are company cars (62% [Mock 2014]): the company offers its employees acar (which can be used for private purposes too) and it pays all related charges, usually including fuelcosts. Then, the company claims vehicle costs as business expenditures and can reduce its profit tax.Therefore, the reduction in profit tax should be about 885 €/year (4368 €/year - 3483 €/year) per EV forcompanies to be interested in offering EVs to its employees in the worst case scenario (if the TCO mustbe comparable for EVs and gasoline vehicles, which is the lowest one in Germany).
5.2.4.2 The NetherlandsThe main parameters to be used in the Netherlands are listed in Table 15.
Parameter Value Unit Reference
E 10 kWh
Scenario descriptionEF 120 Wh/km
N 1 EVSE
K 19 000 km/year 44
VAT 21 % EV Customers are final customers
MPEVSEO 0 €/year No marketplace required
F 0 €/year The regular domestic connection in theNetherlands is 3x25 A, which more thanenough to include EV charging within theregular home electricity supply contract.
P 0 €/year
R 0 €/year
Te 0.2189 €/kWh Prices for domestic customers45
EVSEInv 1900 €/EVSEEstimation
EVSEO&M 50 €/EVSE/year
Table 15: Values for the parameters in the Private Home charging service (The Netherlands)
44 Average mileage in the Netherlands is about 9200 km/year [OECD 2014], which is very close to theSpanish average. Hence, the same 19 000 km/year as in Spain are assumed for EV customers.45 https://www.nuon.nl/energie/vaste-prijs-energie/prijzen.jsp [access in February 2015].

GA MOVE/FP7/265499/Green eMotion WP 9: Deliverable 9.4. Part 2 Page 51 of 70
The formulas to consider both fixed and variable costs in the Netherlands are presented in equations(11):
= 2033 + 0.131168 ∗ = 4525.19€/
= 2335 + 0.106217 ∗ = 4353.12€/
= 3538 + 0.011 ∗ + (1 + 7%) . − 17% ∗ (1 + 7%) .
+ & + ℎ
Again, EV charging cost is the addition of the cost resulting from private home charging service and thecost of charging outside home. When charging at home, EV customers act as EVSE Operators, soequation (3) can be used:
ℎ ℎ
= [( + + ( ∗ ∗ )− ) ∗ (1 + )] + (1 + 7%) . − 17% ∗ (1 + 7%) .
+ & ∗
+
= [(0 + 0 + (0.2189 ∗ 10 ∗ )− 0) ∗ (1 + 21%)] +1900
(1 + 7%) . − 17% ∗ (1 + 7%) .
+ 50 ∗ 1 + 0
= 384.20 + 2.265 ∗
Assuming that EV customers charge at home one out of two days (C=180 charging sessions), they areable to drive 15 000 km/year, so they must charge in other public charging services to drive another 4000km/year. According to equations (12), the costs per kilometre are 0.099312 and 0.078692 €/km forgasoline and diesel vehicles, respectively. Even if EV charging price for outside home sessions is set tobe competitive against diesel vehicles, EV customers’ TCO becomes:
= 3538 + 0.011 ∗ 19000 + 384.20 + 2.265 ∗ 180 + 0.078692 ∗ 4000 = 4853.63€/
If EV charging price for outside home sessions is set to be competitive with gasoline vehicles, the TCO iseven higher (4935.25 €/year), so EV ownership is more expensive than ICE vehicle ownership in theNetherlands, among others, because there are no subsidies for direct EV purchase. In order to have thesame TCO as gasoline, the EV cannot be more than between 6375 € (worst case scenario46) and 8400 €(best case scenario) more expensive than the equivalent gasoline vehicles (so a direct subsidy ofbetween 2600-4625 € would be needed).
As in Germany, company cars are also very common in the Netherlands. The reduction in profit tax forthe company should be about 582 €/year (4935.25 €/year - 4353 €/year) per EV for companies to beinterested in offering EVs to its employees in the worst case scenario.
46 In this case, the worst case scenario is when the TCO is compared with diesel vehicles (which is thelowest one in the Netherlands) and EVSE Operators set the EV charging price for outside home sessionsto be competitive against gasoline vehicles (which is higher than prices to compete with diesel). The bestcase scenario is just the opposite: TCO is compared to gasoline and EV charging price is set to competeagainst diesel.

GA MOVE/FP7/265499/Green eMotion WP 9: Deliverable 9.4. Part 2 Page 52 of 70
5.2.5 EV purchase costThe base case EV purchase cost is based on the expected battery price in 2015 under the optimisticscenario in [D9.6] and the subsidy existing in Spain in 2014, due to the difficulty in comparing ICE modelswith equivalent EV models in the market.
By taking for example, Volkswagen e-Golf, retail price difference compared to the gasoline version isabout 15 800 € (35 500 € vs. 19 690 €47), i.e. 11 300 € more than in the base case, see equation (7). Inthis case, the additional annual amortisation cost for the EV can be calculated as:
=11300€
(1 + 7%) − 17% ∗ (1 + 7%)
= 1422.69~1423€/
Therefore, EV TCO becomes about 4912 €/year (3489 + 1423 €/year), which is about 1250 €/year morethan cost of owning an ICE vehicle.
Under the same assumptions as in the base case, the EV purchase price should not be more than about5870 € more expensive than the price for a gasoline vehicle (4070 € more expensive than a dieselvehicle) to have a comparable TCO (TCO difference between gasoline and diesel is just about 7 €, sothey are assumed to be equivalent):
== , − , + + , ⇔ 3661.16€/
= 3488.98€/ −16500
(1 + 7%) − 17% ∗ (1 + 7%)
+12000
(1 + 7%) − 17% ∗ (1 + 7%)
+ −
(1 + 7%) − 17% ∗ (1 + 7%)
⇔ − = 5867.91€
This add-on cost is lower than the price gap in the example of Volkswagen Golf. Although many otherimplications are taken into account when designing the subsidy policy, public bodies must ensure that anysubsidy must be efficient.
For example, the prices in the example above have a 2000 € subsidy from PIVE-6 for both versions, sothere is no subsidy gap for the EV. On the contrary, if the subsidy from MOVELE 2014 (6500 €) isextended to 2015 and the PIVE subsidy is removed for ICE vehicles, price gap can be reduced to 7300 €(15 800 € - 6500 € - 2000 €). Then, if the PIVE budget not used by ICE vehicles is invested to increasethe subsidy to EVs, price gap would be low enough to allow a positive TCO for EVs, but EV subsidywould rise to 10 500 €, which may be a bit high.
5.2.6 EV charging included in regular home electricity billIn the base case, EV charging is assumed to require a new electricity supply contract. If, on the contrary,it is assumed that the electricity to charge the EV is taken from the regular home electricity supplycontract, there is no additional power component48 and meter renting, but the energy cost is higher, asmost Spanish households have a single-period tariff, so, although EVs are charged overnight, the pricefor EV charging is the regular price [BOE-A-2014-1053]. Hence, the new electricity bill components(related to EV charging) can be calculated as follows:
47 http://www.volkswagen.es [access in February 2015].48 A typical home contract in Spain has a contracted power of 4.6 kW (see footnote 41), which is enoughto charge EVs overnight, as home electricity consumption is assumed to be minimal.

GA MOVE/FP7/265499/Green eMotion WP 9: Deliverable 9.4. Part 2 Page 53 of 70
( ℎ ℎ )= ⟨{( ∗ ∗ 12) + [(100% ∗ ) ∗ ∗ ]} ∗ (1 + 5.1127%)⟩ + ( ∗ 12) ∗ (1 + )= ⟨{(0 ∗ 3.503619 ∗ 12) + [(100% ∗ 0.124107) ∗ 10 ∗ ]} ∗ (1 + 5.1127%)⟩ + (0 ∗ 12)∗ (1 + 21%) = 1.5785 ∗
If C=180 charging events, the additional electricity bill becomes 284.12 €/year, which is about 75 €cheaper than in the base case. If the overnight home electricity consumption cannot be neglected and,hence, the contracted power must be increased in one step (5 A, i.e. 1.15 kW), the electricity bill rises to345.61 €/year, which is still lower than in the base case (358.81 €/year), but the are some other costs(one-time fee for having a bigger connection, the costs of the operator who changes the limitation andprotection devices in the home electric installation) which would make the costs higher than in the basecase.
5.2.7 More expensive prices in public EVSEIn early stages of EV deployment, the usage rates of publicly accessible EVSE (such as traffic hotspot orhighway charging services) may not be enough for EVSE Operators to competitive prices againstgasoline or diesel vehicles for equivalent trips, as presented in chapters 3 and 4.
However, when EV customers drive most of their annual mileage by charging at home, their TCO can beabout 180 € lower than the cost of owning an ICE vehicle, as presented in the base case (section 5.1). Inthis case, EV customers may accept to pay a bit more for charging sessions made outside home, as theirTCO is still lower than the cost of ICE vehicles.
If it is assumed that they pay 80 € more for the 4000 km driven from public charging (to have a TCO thatstill is 100 €/year lower than for ICE vehicles), each charging session would cost49:
=80€
4000 ∗10 ℎ/0.120 ℎ/ = 1.67€/
=80€
4000 ∗12 ℎ/0.150 ℎ/ = 1.60€/
If the traffic hotspot EVSE Operator can ask for 1.67 €/session more (which is just profit, as no additionalcosts are needed), the required EVSE usage can be calculated as (based on equation (13)):
( )7.0611 ∗ + 1.67 ∗ = 7380.16 + 1.0396 ∗ ⇔ ~960 / ⇒ 2.62 /
( )6.2134 ∗ + 1.67 ∗ = 7380.16 + 1.0396 ∗ ⇔ ~1079 / ⟹ 2.96 /
Therefore, the required EVSE usage to offer these prices is reduced below 3 sessions per day onaverage. If advertising is also taken into account, even in the lower range (4000 €/EVSE per year), therequired EVSE usage is reduced to about 1.20-1.35 charging sessions per EVSE and per day (about twocharges every three days per outlet).
As for the highway EVSE Operator, starting from equation (14), the additional income results in:
( )6.77864 ∗ + 1.60 ∗ = 14175.89 + 1.24751 ∗ ⇔ ~1988 /⇒ 5.45 /
49 For example, if EV customers charge 18 times in a traffic hotspot, they can drive 1500 km (18 sessions* 10 kWh/session /0.12 kWh/km) and they spend 30 € (18 sessions * 1.67 €/session). Hence, they mustdrive another 2500 km from highway charging, so they charge 31.25 times (2500 km * 0.150 kWh/km / 12kWh/session), which costs them 50 € (31.25 sessions * 1.60 €/session).

GA MOVE/FP7/265499/Green eMotion WP 9: Deliverable 9.4. Part 2 Page 54 of 70
( )5.96488 ∗ + 1.60 ∗ = 14175.89 + 1.24751 ∗ ⇔ ~2245 /⟹ 6.15 /
Although these usage rates are still high, the combination of advertising (4000 €/EVSE per year) and theadditional income from an attached shop or restaurant (1.50 €/charging session) can reduce them to3.23-3.57 sessions per EVSE and per day, which is much more likely to happen.

GA MOVE/FP7/265499/Green eMotion WP 9: Deliverable 9.4. Part 2 Page 55 of 70
6 Public charging spot for street side parkingThis charging service presents the case of charging at a publicly accessible EVSE on public domain. Thecharging speed is assumed to be semi-fast (22 kW, although it could also charge at 11 kW if needed) andthe EVSE is assumed to have two outlets. EV customers are assumed to use the roaming agreement oftheir EVSP with the public EVSE Operator (through the marketplace) to be able to charge their EVs.
It is assumed that the EVSE has two different usage patterns. On the one hand, it is used by EVcustomers who do not have access to private home charging for overnight charging, while, on the other, itis used by other EV customers to charge their EVs during the day. The price to be requested to each typeof customer is different, as the costs for the charging sessions and the value provided to them also differ.Therefore, a price for daytime charging and another price for overnight charging are envisaged.
This is the most complex charging service, as it involves the higher number of stakeholders: EVcustomers who use it as their preferred charging option (EV customers without access to private homecharging who use this charging service for overnight charging50), EV customers who use this chargingservice sporadically (EV customers with access to private home charging and use this alternative just toincrease their range during the day, as in the traffic hotspot charging service) and the EVSE Operator.
The maximum amount of energy to be charged by an EV is obtained as 70% of the battery size, from aninitial SOC of 30% to a maximum SOC of 100% [NPE 2010], as in the traffic hotspot and private homecharging services. Hence, it is assumed that each charging session requests 10 kWh of electricity.Likewise, EV efficiency is assumed to be the same as in those charging services, i.e. 120 Wh/km, asdriving patterns are expected to be equivalent.
In order to estimate the number of public charging spots for street side parking, the following assumptionsare made:
· The EC Directive for Alternative Fuels [OJ L307/1] indicated that “the appropriate averagenumber of recharging points accessible to the public should be equivalent to at least onerecharging point per 10 cars”. Taking into account that 5000 EV customers were considered insection 2.5.3, 500 EV customers who cannot charge in private home are considered.
· In order to be consistent with the charging patterns in the private home charging service, it isassumed that 180 overnight charging events per year are made by those EV customers in thepublic charging spots for street side parking. Therefore, 90 000 overnight charging events areassumed for the whole public charging spot portfolio.
· Since it is not likely that each outlet can be used more than once per night (EV customers are notexpected to unplug their EVs in the middle of the night), the total number of overnight chargingevents per EVSE is 730 (1 events/day/outlet * 2 outlets/EVSE * 365 days).
Based on these assumptions, the minimum number of EVSE is 124 (90 000 charging sessions per year /730 charging sessions per EVSE and per year).
The process to obtain the required EVSE usage rate in this charging service is presented in Figure 3below:
50 As overnight charging is of paramount importance for these EV customers, public authorities may limitthe availability of this charging option to residents.

GA MOVE/FP7/265499/Green eMotion WP 9: Deliverable 9.4. Part 2 Page 56 of 70
Figure 3: Process to obtain the required public charging spot for street side parking usage rate
In the case of EV customers who use this alternative for daytime charging (sporadic EV customers inFigure 3), the relative cost for EV customers of the charging event must be compared with refuelling costof an equivalent trip with an ICE vehicle. This way, the maximum daytime charging service price to berequested by the EVSE Operator is calculated.
On the contrary, for EV customers who use the public charging spot for street side parking very frequently(EV customers without home charging in Figure 3), the whole TCO must be analysed, so that it iscomparable to the TCO of an ICE vehicle. By considering all the fixed costs for EV customers, themaximum EV charging cost is calculated. Then, based on the number of charging sessions in the publiccharging spot for street side parking, the number of kilometres that must be driven by using othercharging services is calculated, which, considering the cost of an equivalent trip with an ICE vehicle,allows calculating the EV charging cost in other charging services. The difference between the maximumtotal cost of EV charging and the EV charging cost in other charging options is the maximum EV chargingcost in the public charging spot for street side parking service. The overnight charging price is calculatedby dividing this maximum EV charging cost in this service by the number of charging sessions in it.
Then, both the daytime charging and the overnight charging prices are used to calculate EVSEOperator’s income, as a function of the number of charging sessions per EVSE. The EVSE Operator aimsat having more benefits than costs, so, by calculating the costs as a function of the number of chargingsessions per EVSE, the required EVSE usage is calculated.

GA MOVE/FP7/265499/Green eMotion WP 9: Deliverable 9.4. Part 2 Page 57 of 70
6.1 Base caseTable 16 presents the different parameters to be used in this charging service:
Parameter Value Unit Reference
P 2*22 kW
Scenario descriptionE 10 kWh
EF 120 Wh/km
N 124 EVSE
K 19 000 km/year [Nissan 2015, 1]
VAT 0 % EVSE Operator is not the final customer
MPEVSEO 2000 €/year See section 2.5.1
Tp 6.832399 €/kW/month
[Endesa 2014]Te1 0.122383 €/kWh
Te2 0.096216 €/kWh
Te3 0.065923 €/kWh
M 1.36 €/month [BOE-A-2011-14782]
EVSEInv 10 500 €/EVSE[NPE 2014]
EVSEO&M 1 725 €/EVSE/year
Table 16: Values for the parameters in the Public charging spot for street side parking service (basecase)
As discussed above, EV customers who use this charging service for daytime charging must have a costper charging event which is comparable to the refuelling cost of an equivalent trip with an ICE vehicle.The maximum daytime charging service price to be requested by the EVSE Operator to meet thisrequirement is calculated by using equations (8):
: ≤ ∗ 0.084733€/ =10 ℎ
120 ℎ/ ∗ 0.084733€/ = 7.0611€/
: ≤ ∗ 0.074561€/ =10 ℎ
120 ℎ/ ∗ 0.074561€/ = 6.2134€/
Therefore, by adding 21% VAT, the maximum daytime EV charging prices for EV customers to have acompetitive mileage cost with gasoline and diesel are 8.54 € and 7.52 € per charging session,respectively.
In order to calculate the TCO for EV customers who use the public charging spot for street side parkingvery frequently, equations (7) must be used, but taking into account that EV customers are not EVSEOperators in this case, so the terms including EVSEInv and EVSEO&M must not be considered:
= 1511 + 0.113528 ∗ = 1511 + 0.113528 ∗ 19000 = 3668.03€/
= 1738 + 0.101219 ∗ = 1738 + 0.101219 ∗ 19000 = 3661.16€/
= 2198 + 0.011 ∗ + (1 + 7%) . − 17% ∗ (1 + 7%) .
+ & + ℎ
= 2198 + 0.011 ∗ 19000 + ℎ = 2407 + ℎ

GA MOVE/FP7/265499/Green eMotion WP 9: Deliverable 9.4. Part 2 Page 58 of 70
Therefore, EV charging cost for EV customers must not be higher than 1254.16 €/year (3661.16 €/year –2407 €/year), so that their TCO is comparable to owning a diesel vehicle (for gasoline vehicle, it is justabout 7 € more). As EV customers are the final customers, they must pay VAT, so the net EV chargingcost for EV customers cannot exceed 1036.50 €/year.
As discussed in the private home charging service, 180 charging sessions per year, at 10 kWh percharging session and with an EV efficiency of 120 Wh/km, allow EV customers to drive 15 000 km (seesection 5.1), so another 4000 km must be driven from other public charging services (traffic hotspot andhighway charging). As in the private home charging service, the worst case scenario for EV customers iswhen the price for charging their EV in traffic hotspots and highway EVSE is established so that therelative cost of the charging event for them is compared with the refuelling cost of an equivalent trip with agasoline vehicle:
ℎ ℎ = 0.084733€/ ∗ 4000 / = 338.93€/
This means that the cost for EV customers when charging in public charging spots for street side parkingmust not exceed 697.57 €/year (1036.50 - 338.93 €/year) for 180 charging sessions, i.e. an overnightcharging price of 3.875 €/session.
According to the prices for overnight (3.875 €/session) and daytime charging (6.2134 €/session, to becompetitive with diesel vehicles), reminding that there are the same number of charging sessions in eachperiod and assuming that there are no additional sources of income, the incomes for the EVSE Operatorare:
= ( ∗ ∗ ) + = 6.2134 ∗ 2 ∗ 124 + 3.875 ∗ 2 ∗ 124 + 0= 625.48 ∗
When dealing with the costs for the EVSE Operator, equation (1) must be used, but some changes arerequired. This charging alternative is assumed to be the preferred one by EV customers who cannotcharge in their private home, so the charging session distribution considered in other charging servicescannot be used. It is assumed that half of the charges are made for overnight charging and the samedaytime charging distribution as in the other charging services is used (23% vs.66%, i.e. about threetimes more in off-peak times).
Therefore, S1=12.5%, S2=37.5% and S3=50% and, thus, equation (1) becomes:
= ⟨{( ∗ ∗ 12) + [(12.5% ∗ + 37.5% ∗ + 50% ∗ ) ∗ ∗ ]}
∗ (1 + 5.1127%)⟩ + ( ∗ 12) ∗ (1 + ) + (1 + 7%) . − 17% ∗ (1 + 7%) .
+ & ∗
+
= ⟨{(44 ∗ 6.832399 ∗ 12)
+ [(12.5% ∗ 0.122383 + 37.5% ∗ 0.096216 + 50% ∗ 0.065923) ∗ 10 ∗ ]} ∗ (1 + 5.1127%)⟩
+ (1.36 ∗ 12) ∗ (1 + 0%) +10500
(1 + 7%) . − 17% ∗ (1 + 7%) .
+ 1725 ∗ 124 + 2000
= 917140 + 109.93 ∗

GA MOVE/FP7/265499/Green eMotion WP 9: Deliverable 9.4. Part 2 Page 59 of 70
EVSE Operator’s incomes equal costs when:
625.48 ∗ = 917140 + 109.93 ∗ ⇔ = 1778.95 / ~4.87 /
This EVSE usage rate means that the EVSE must be used every day for more than 2 overnight chargingsessions per EVSE (1 session per outlet) and another 2 daytime charging sessions, which is too high,even in the medium term horizon considered in this deliverable.
In order to be able to reduce the required EVSE usage to the assumptions considered, additional sourcesof income are required. The expected impact of an advertisement located in a public charging spot forstreet side parking is lower than the one in a traffic hotspot and, in addition, the EVSE Operator may notsucceed in having advertisements placed in all its EVSE, or discounts in the price may be offered for bigvolumes, as the one considered in the analysis (124 EVSE). As a result, the advertisement income isassumed to be in the lower range of the prices in phone booths (see section 3.1). When the income fromadvertising is 4000 €/EVSE per year, the required EVSE usage is reduced to:
625.48 ∗ + = 917140 + 109.93 ∗ ⇔ 625.48 ∗ + 4000 ∗ 124 = 917140 + 109.93 ∗ ⇔= 816.88 / ~2.24 /
Taking into account that the number of EVSE has been calculated to satisfy the overnight demand (onlyhalf the EV customers charge every night and two EV customers can be charged at the same time in asingle EVSE), this EVSE usage rate may seem reachable. However, it must be taken into account that,due to the dispersion in EV customer preferences and EVSE location, it is quite likely that some EVSEare occupied almost every night (and, hence, EV customers do not charge overnight but the day after,either by using this charging service or another one) while some other EVSE are idle for most of the time.Moreover, at least in the early stages of EV deployment, it is not reasonable to think that public spotcharging for street side parking will be massively used for daytime charging. An additional argument inthis sense is the fact that most EV customers are likely to connect their EVs in the evening and that theyselect whether they want to have their EV charged as soon as possible (which would be a daytimecharging in period 2) or at the cheapest price (overnight charging in period 3); in any case, the outletwould be occupied for the whole night, reducing the EVSE availability for further charging sessions.
As in the case of the traffic hotspot charging service, the billing scheme must be carefully designed tohave as many charging sessions per day as possible due to the importance of having as many chargingsessions per day as possible. A billing scheme which only considers time results in too high prices fordaytime charging (the price for overnight charging would be 3.875 €/session + 21% VAT ~ 4.69 €/night):
ℎ = ∗ (1 + ) ∗/2
( ) ℎ = 7.0611€/ ∗ (1 + 21%) ∗22
10 ℎ/ = 18.80€/ℎ
( ) ℎ = 6.2134€/ ∗ (1 + 21%) ∗22
10 ℎ/ = 16.54€/ℎ
Therefore, a mixed approach which charges for electricity and time (see end of section 3.1) is more likelyto be accepted by EV customers. The maximum price per kWh (so that EVs have a mileage costcompetitive against ICE vehicles) can be calculated as follows:
ℎ =∗ (1 + )
=6.2134€/ ∗ (1 + 21%)
10 ℎ/ = 0.7518€/ ℎ
The time-based tariff should be designed so that it is not too high for EV customers (as public bodieswant to promote electric mobility and they are the owners of the parking space) but, at the same time, it isnot too low in order to encourage EV customers to leave the EVSE free once they have their EV charged.

GA MOVE/FP7/265499/Green eMotion WP 9: Deliverable 9.4. Part 2 Page 60 of 70
6.2 Sensitivity analysis
6.2.1 EVSE amortisationThe EVSE investment cost and the EVSE lifetime data are taken from the latest NPE report [NPE 2014]and are valid for 2013. Although there might be cases where EVSE investment costs are higher (e.g.situations in which the distribution grid must be strongly reinforced, or places where more complicatedcivil works are needed), future prices are expected to decline. Likewise, future EVSE is expected to lastlonger due to technological improvement. Moreover, public charging spots for street side parking areexpected to be bought in larger volumes that traffic hotspot EVSE, which can reduce their investment costper unit.
On the contrary, public charging spots for street side parking are more likely to suffer vandalism thanEVSE in traffic hotspots and, hence, they are expected to have a shorter lifetime than those.
With all these effects in mind, the assumed EVSE amortisation rate is assumed to be quite conservative,so no sensitivity analysis is performed on this parameter.
6.2.2 Annual mileageAs in the private home charging case, the annual mileage considered in the base case is based on thereported mileage by Nissan Leaf users in Spain [Nissan 2015, 1], but the average mileage of Spanishdrivers is significantly lower (9928 km/year).
If 10 000 km/year are considered, the TCOs result:
= 1511 + 0.113528 ∗ = 1511 + 0.113528 ∗ 10000 = 2646.28€/
= 1738 + 0.101219 ∗ = 1738 + 0.101219 ∗ 10000 = 2750.19€/
= 2198 + 0.011 ∗ + (1 + 7%) . − 17% ∗ (1 + 7%) .
+ & + ℎ
= 2198 + 0.011 ∗ 10000 + ℎ = 2308 + ℎ
By comparing the TCOs, EV charging cost for EV customers must not be higher than 338.25 €/year(2646.28 €/year – 2308 €/year), so that their TCO is comparable to owning a diesel vehicle (for gasolinevehicle, it is about 442.19 €).
Assuming the same distribution of charges as in the base case (80% of mileage is based on publiccharging spot for street side parking, while traffic hotspots and highway EVSE are used to cover theremaining 20% of mileage), EV customers drive 2000 km by charging in traffic hotspot of highway EVSEand 8000 km by charging in street side EVSE. The worst case scenario for EV customers is when theprice for charging their EV in traffic hotspots and highway EVSE is established so that the relative cost ofthe charging event for them is compared with the refuelling cost of an equivalent trip with a gasolinevehicle:
ℎ ℎ = 0.084733€/ ∗ 2000 / = 169.47€/
By adding 21% VAT, this results in 205.43 €/year, so the maximum EV charging cost in public chargingspots for street side parking is 132.82 €/year (338.25 €/year - 205.43 €/year). Again, this amount includesVAT, so net amount is 109.77 €/year. Consequently, the number of overnight charging events can becalculated as:
ℎ ℎ =10000 / ∗ 80% ℎ ∗ 0.120 ℎ/
10 ℎ/ = 96 /
This usage rate results in a charging price of 1.14 €/session, which is one-third the price in the base case,so the required EVSE usage must be much higher:

GA MOVE/FP7/265499/Green eMotion WP 9: Deliverable 9.4. Part 2 Page 61 of 70
917140 + 109.93 ∗ = 6.2134 ∗ 2 ∗ 124 + 1.14 ∗ 2 ∗ 124 ⇔= 2650.84 / ~7.26 /
Consequently, the momentum for EV customers with lower annual mileages is much further in time thanfor EV customers with higher mileage rates.
6.2.3 EV efficiencyIf EV efficiency is lower than in the base case (see section 3.2.3 for discussion) more energy is requiredto drive the same number of kilometres.
By keeping the assumption that EV customers charge at home one out of two days, but increasing EVconsumption to 150 Wh/km, the amount of kilometres driven from overnight charging is lower: 12 000 kmper year (180 charging sessions/year * 10 kWh/charging session / 150 Wh/km), so EV customers need todrive 7000 km/year by using other charging services, at a cost of about 593.13 €/year:
ℎ ℎ = 0.084733€/ ∗ 7000 / = 593.13€/
As in the base case, the net EV charging cost for EV customers cannot exceed 1036.50 €/year, so thecost of charging in public charging spots for street side parking cannot be higher than 443.37 €/year(1036.50-593.13 €/year) for 180 charging sessions, i.e. 2.463 €/session.
The EVSE Operator’s costs and incomes are the same, as long as:
917140 + 109.93 ∗ = 6.2134 ∗ 2 ∗ 124 + 2.463 ∗ 2 ∗ 124 ⇔= 2142.77 / ~5.87 /
Under the assumption of having the same number of charging session in daytime and overnight, thisusage rate cannot be reached, as more than one overnight charging session per outlet is required. Evenif the same cost for the EVSE Operator is assumed (which is not the case as electricity is more expensivein daytime charging), two daytime charging sessions per day and per outlet would be required, which isvery unlikely to happen in the short to medium term. Therefore, additional sources of revenue areabsolutely required.
6.2.4 Other countriesThe differences that may arise between different EU Member States are assessed by calculating theresults for Spain (base case), Germany and the Netherlands. The main differences considered are theelectricity bill structure and the prices for fossil fuels (as in the three charging services above), but alsothe average distance driven per year.
6.2.4.1 GermanyThe process to be followed is the same as described in Figure 3 and, unless otherwise stated, the valuesin Table 6 (section 3.2.5.1) are used, except the number of EVSE, which is N=124 as discussed insection 6.1 and the mileage K=15 000 km/year must also be considered.
In the case of EV customers who use this charging service during daytime (sporadic use), the relativecost of the charging event must be compared with refuelling cost of an equivalent trip with an ICE vehicle.The worst case scenario for the EVSE Operator is when it is compared with diesel vehicles, as thecharging price is lower price (see section 3.2.5.1):
: ≤ ∗ 0.077997€/ =10 ℎ
120 ℎ/ ∗ 0.077997€/ = 6.49975€/
Therefore, by adding 19% VAT, the maximum daytime EV charging prices for EV customers to have acompetitive mileage cost with diesel is 7.73 € per charging session.

GA MOVE/FP7/265499/Green eMotion WP 9: Deliverable 9.4. Part 2 Page 62 of 70
The TCO for EV customers who use the public charging spot for street side parking very frequently mustconsider that they are not the EVSE Operators in this charging service (so EVSEInv and EVSEO&M are notconsidered here), as well as the equivalent TCOs for ICE vehicles, are calculated as (see section5.2.4.1):
= 1656 + 0.121816 ∗ = 1656 + 0.121816 ∗ 15000 = 3483.24€/
= 1958 + 0.103816 ∗ = 1958 + 0.103816 ∗ 15000 = 3515.19€/
= 3161 + 0.011 ∗ + (1 + 7%) . − 17% ∗ (1 + 7%) .
+ & + ℎ
= 3161 + 0.011 ∗ 15000 + 0 + 0 + ℎ = 3326 + ℎ
As in the private home charging service, EV customers charge 180 times in this charging service, so themileage that EV customers can drive by overnight charging is the same as the assumed annual mileage.Therefore, the cost of EV charging overnight can be up to 157.24 €/year (3483.24 €/year - 3326 €/year),or 132.13 €/year without VAT, i.e. 0.734 €/session.
According to the prices for overnight (0.734 €/session) and daytime charging (6.49975 €/session, to becompetitive against diesel vehicles), reminding that there are the same number of charging sessions ineach period and assuming that there are no additional sources of income, the incomes for the EVSEOperator are:
= ( ∗ ∗ ) + = 6.49975 ∗ 2 ∗ 124 + 0.734 ∗ 2 ∗ 124 + 0= 448.50 ∗
The costs for the EVSE Operator in Germany are calculated by using equation (2) and the values inTable 6, but considering that the EVSE Operator must pay MPEVSEO = 2000 € for accessing themarketplace:
= ( ∗ ∗ ) + ( ∗ 12) ∗ (1 + ) + (1 + 7%) . − 17% ∗ (1 + 7%) .
+ & ∗
+
= (0.25 ∗ 10 ∗ ) + (8.60 ∗ 12) ∗ (1 + 0%) +10500
(1 + 7%) . − 17% ∗ (1 + 7%) .
+ 1725 ∗ 124 + 2000
= 457712.40 + 310 ∗
EVSE Operator’s incomes equal costs when:
448.50 ∗ = 457712.40 + 310 ∗ ⇔ = 3304.78 / ~9.05 /
This EVSE usage rate means that each of the outlets in the EVSE must be used every day for more than2 overnight charging sessions and another 2 daytime charging sessions, which is too high. However, if anadditional income from advertising of 4000 €/EVSE per year is considered (totalling 496 000 €/year forthe 124 EVSE), this income is enough to pay all the fixed costs, so the EVSE Operator would make aprofit even if the EVSE were not used at all.
6.2.4.2 The NetherlandsAs in the other countries analysed, the process in Figure 3 is followed in the Netherlands too. Theparameters for the analysis are presented in Table 17.

GA MOVE/FP7/265499/Green eMotion WP 9: Deliverable 9.4. Part 2 Page 63 of 70
As in the Highway charging service, public charging spots for street side parking cannot be considered ashaving a living or working function, so there is no reduction in the electricity bill.
Parameter Value Unit Reference
E 10 kWh
Scenario descriptionEF 120 Wh/km
N 124 EVSE
K 19 000 km/year 51
VATEVSEO 0 % EVSE Operator is not the final customer
VATEV Customer 21 % EV Customers are final customers
MPEVSEO 2000 €/year See section 2.5.1
F 54 €/yearPrices for a three-phase, 80 A,
connection52Te 0.1874 €/kWh
R 0 €/year
P 1614.2855 €/year Grid fees for a 3 x 80 A connection53
EVSEInv 10 500 €/EVSE[NPE 2014]
EVSEO&M 1 725 €/EVSE/year
Table 17: Values for the parameters in the Public charging spot for street side parking service (TheNetherlands)
The daytime charging price is calculated so that sporadic EV customers have a mileage cost comparableto diesel vehicles (see section 3.2.5.2):
: ≤ ∗ 0.078692€/ =10 ℎ
120 ℎ/ ∗ 0.078692€/ = 6.55767€/
By adding 21% VAT, this price gets 7.93 €/session for EV customers.
The TCO in the Netherlands is (see section 5.2.4.2):
= 2033 + 0.131168 ∗ = 2033 + 0.131168 ∗ 19000 = 4525.19€/
= 2335 + 0.106217 ∗ = 2335 + 0.106217 ∗ 19000 = 4353.12€/
= 3538 + 0.011 ∗ + (1 + 7%) . − 17% ∗ (1 + 7%) .
+ & + ℎ
= 3538 + 0.011 ∗ 19000 + 0 + 0 + ℎ = 3747 + ℎ
51 Average mileage in the Netherlands is about 9200 km/year [OECD 2014], which is very close to theSpanish average. Hence, the same 19 000 km/year as in Spain are assumed for EV customers.52 http://www.nuon.nl/mkb/lightbox/tarieven-flexibel.jsp [access in February 2015].53 https://www.enexis.nl/consument/diensten-en-tarieven/tarieven/elektriciteit/periodieke-netwerktarieven-e?pageid=44 [access in February 2015].

GA MOVE/FP7/265499/Green eMotion WP 9: Deliverable 9.4. Part 2 Page 64 of 70
Hence, EV charging cost for EV customers cannot exceed 606.12 €/year, or 500.93 €/year excluding 21%VAT.
Assuming 180 charging sessions per year, 15 000 km/year can be driven out of public charging spots forstreet side parking, but another 4000 km/year must be charged by using other charging services. Thecost of those other charging services in the worst case (if their price is set to compete against gasoline)is:
ℎ ℎ = 0.099312€/ ∗ 4000 / = 397.25€/
As a result, the maximum EV charging cost for EV customers in public charging spots for street sideparking is 103.68 €/year (500.93 €/year - 397.25 €/year), which, for 180 sessions/year result in anovernight charging price of 0.576 €/session. Consequently, EVSE Operator’s incomes are:
= ( ∗ ∗ ) + = 6.55767 ∗ 2 ∗ 124 + 0.576 ∗ 2 ∗ 124 + 0= 442.29 ∗
The costs for the EVSE Operator in the Netherlands are calculated by using equation (3):
ℎ ℎ
= [( + + ( ∗ ∗ )− ) ∗ (1 + )] + (1 + 7%) . − 17% ∗ (1 + 7%) .
+ & ∗
+
= [(54 + 1852.56 + (0.1868 ∗ 10 ∗ )− 98.86) ∗ (1 + 0%)] +10500
(1 + 7%) . − 17% ∗ (1 + 7%) .
+ 1725
∗ 124 + 2000 = 669070.40 + 231.63 ∗
EVSE Operator’s incomes equal costs when the EVSE are used about 8.70 times per day:
442.29 ∗ = 669070.40 + 231.63 ∗ ⇔ = 3176.07 / ~8.70 /
This EVSE usage rate is too high, so additional incomes are required by the EVSE Operator to have aprofitable business. By considering an advertisement income of 4000 €/EVSE per year (496 000 €/yearfor the 124 EVSE), the required EVSE usage can be reduced to:
442.29 ∗ + 496000 = 669070.40 + 231.63 ∗ ⇔ = 821.56 / ~2.25 /
This usage rate is very similar to the one required in Spain if incomes from advertisement can beobtained. As discussed in the base case, this usage rate can be obtained when there are enough EVs onthe road and in the EVSE located in places where overnight charging will take place every day and thelocation is also attractive for daytime charging.

GA MOVE/FP7/265499/Green eMotion WP 9: Deliverable 9.4. Part 2 Page 65 of 70
7 Summary and discussionElectric mobility is a very complex ecosystem, where a network of actors interrelate with each other andwhere regulatory and market structures still need to be defined. However, despite the advances in the lastcouple of years, EV market is still incipient, so it is difficult to have profitable business models underpresent conditions. Therefore, the analysis presented here looks more into the future (medium term),where the assumed number of EVs on the road is enough to create a considerable demand of publiccharging infrastructure.
Four charging services are presented to describe different charging alternatives for EV customers. Ineach of them, the required EVSE usage for all the involved stakeholders to have a positive business caseis calculated.
In the traffic hotspot and highway charging services, the EVSE Operator aims at establishing an EVcharging price which is enough to recover all its costs, while, at the same time, allows EV customers tohave a cost per kilometre lower than diesel or gasoline vehicles for an equivalent trip. For that purpose,EVSE usage is of paramount importance: as EVSE usage increases, the required EV charging price tocover all EVSE Operator’s cost decreases, which allows EV customers to have a lower cost perkilometre, until it becomes competitive against ICE vehicles.
The traffic hotspot charging service can be profitable if 3-4 charging sessions per EVSE and day areachieved, which, taking into account that each EVSE has two outlets, may be feasible if there are enoughEVs on the road, thanks to the hotspot nature of the location. In general, the electricity bill design is animportant parameter, with better conditions if fixed costs are low in comparison with variable costs. As anadditional source of value to increase EVSE profitability and improve the performance of the businessmodel at lower usage rates, advertising can be a good option. The effect of EV technologicaldevelopment (either by increasing battery size or improving EV efficiency) is difficult to predict, as it mayencourage customers either to charge more or less often at this type of EVSE.
In the highway charging service it seems more difficult to make a profit in the short-term, because, if theEVSE Operator aims at offering an EV charging price that makes EV customers have the same cost asan ICE vehicle for an equivalent trip, it needs to have 7-8 charging sessions per EVSE and per day tocover its costs. The main reasons for the worse performance of this service is the high EVSE investmentand O&M costs, together with a lower EV driving efficiency resulting from the higher driving speeds inhighways. Moreover, the range of existing EVs is not suitable for long-distance trips, which is the maindriver for EV customers to use highway charging. Although advertising does not seem as attractive as intraffic hotspots, it could be a complementary option to increase EVSE incomes. The incomes for theEVSE Operator can be further increased if there is a shop or a restaurant attached to the EVSE, as EVcustomers must wait until the charging process finishes and, thus, they are likely to spend more moneywhile charging. An additional way to improve business performance is to install an EVSE with dualcharging (DC+AC) capabilities, since, although it increases the required EVSE usage rate to about 8-9sessions per day, it allows to charge two EVs at the same time and enlarge the portfolio of potential usersof the EVSE, making it easier to reach the required number of charging sessions.
However, the expected increase in battery size (which can result in double the battery size as early as in2016, see footnote 20) will have a positive effect on the economic performance of highway charging. Onthe one hand, EV customers will gain confidence and will opt to make more long-distance trips, which willincrease the number of potential users of the highway charging service. On the other hand, they willcharge more energy each time they use the service, so a lower EVSE usage rate will be enough to coverall the costs, as many of them are fixed costs. Moreover, charging more energy means spending moretime while charging, which will result in an increasing income from additional sources of revenue, asdiscussed above. Therefore, the required EVSE usage rate can be reduced to 2-3 charging sessions perday (up to 4 if there are no incomes from advertising), which is quite likely to be reached in the future,when there are enough EVs on the road and they are able to drive longer distances in the highway,thanks to the increased battery size.
GA MOVE/FP7/265499/Green eMotion WP 9: Deliverable 9.4. Part 2 Page 66 of 70
Private home charging service is the preferred option by EV customers who can charge at home,because it is the low-cost option for them when time-of-use tariffs are available, even if the investment inthe EVSE is taken into account. In general, these EV customers are expected to charge their EVs athome regularly, so that they normally start their trips with a full battery, and only use the other chargingservices when they have specific, unusual needs to extend their daily range. For EV customers with highannual mileages and who use it intensively (more than about two thirds of the kilometres are driven bycharging at home), it offers a better TCO than ICE vehicles even today, if subsidies for EV purchase areconsidered. It is also important that regulation does not impose too strict technical requirements forprivate home EVSE, as they may increase cost so much that the TCO is not competitive any more.
The public charging spot for street side parking is the most complex service, as it is the one in whichmore actors are involved as two different usage patterns are considered for EV customers. On the onehand, it is used by EV customers who do not have access to private home charging for overnightcharging, while, on the other, it is used by other EV customers to charge their EVs during the day. Theprice to be requested to each type of customer is different, as the costs for the charging sessions and thevalue provided to them also differ.
EV customers who use this charging service sporadically (EV customers with access to private homecharging and use public charging spots for street side parking just to increase their range during the day,as in the traffic hotspot charging service) must have a cost per kilometre which is competitive against ICEvehicles, so the EV charging price for daytime charging has to be carefully selected. Likewise, EVcustomers who use it as their preferred charging alternative (EV customers without access to privatehome charging who use this charging service overnight) must have an ownership cost which iscomparable or lower than the cost of owning an ICE vehicle, so, again, the overnight EV charging pricethat EV customers would accept to pay is limited. By considering these pricing limitations, the only wayfor the EVSE Operator to recover all its costs is if the EVSE usage rate is increased. In the publiccharging spot for street side parking, almost 5 sessions per EVSE and per day are needed for the EVSEOperator to make a profit while offering competitive prices to EV customers. Once more, advertisingappears to be a good option.
Figure 4 below presents the required EVSE usage rate so that the EVSE Operator can recover all itscosts and request a charging service price which allow EV customers have a mileage cost which iscomparable to the mileage cost of an equivalent trip with a diesel vehicle.

GA MOVE/FP7/265499/Green eMotion WP 9: Deliverable 9.4. Part 2 Page 67 of 70
Figure 4: Required EVSE usage rate for EV mileage cost to compete against diesel vehicles
On the grounds of these findings, it seems that EV customers with private home charging availability willbe the early adopters of electric mobility, as long as they need to use their EVs regularly and there aresubsidies for EV purchase. Then, as EV market grows, publicly accessible EVSE with semi-fast chargingcapabilities are likely to appear in cities and traffic hotspots. In the meantime, technology development isexpected to increase driving ranges while reducing costs, so that highway charging can also be profitablein the medium-term.
Until these technological developments materialise, electric mobility should be supported by a favourableregulatory framework. By comparing the electricity bill structures in the countries analysed, giving moreweight to the consumption component (variable part vs. fixed part) and allowing price differences within aday (time of use tariffs) to create better conditions for electric mobility. This effect is further strengthened ifhigher fuel excise taxes are applied to gasoline and diesel prices. Direct subsidies for EV purchase arealso important to improve EV customers’ TCO and, thus, they are especially relevant to enhance theperformance of private home charging and public charging for street side parking. However, thesesubsidies should be phased out as the market conditions and technological development improve theeconomics of EV ownership. In any case, rigorous cost-benefit analyses must be performed, alsoincluding the social component, before any subsidy scheme is considered, in order to be efficient, i.e. toreach the objective of promoting electric mobility without unnecessary public spending. Moreover, theregulatory framework should also provide additional incentives for infrastructure deployment, as publiccharging beyond traffic hotspot does not seem to be profitable at the current trends of EV marketpenetration rate.

GA MOVE/FP7/265499/Green eMotion WP 9: Deliverable 9.4. Part 2 Page 68 of 70
8 References[ABB 2014] – ABB EV Charging Infrastructure, “Electric Vehicle Charging Infrastructure Terra multi-standard DC charging station 53. Product Leaflet”, 2014. Available on-line at:http://www05.abb.com/global/scot/scot344.nsf/veritydisplay/67fec26aa8fea552c1257d690039af2d/$file/4EVC204305-LFEN_Terra53C-CT-CJ-CJG.pdf [access in February 2015].
[Aniacam 2015] – Aniacam, “Dossier de automóviles. Matriculaciones Diciembre 2014”. Available on-lineat: http://www.aniacam.com/datos/2014/archivos/automoviles/DossierAutomoviles_Diciembre14.xls[access in February 2015].
[Baeza 2014] – Baeza M.” Nissan Leaf y Toyota Auris, el eléctrico y el híbrido más demandados”, Blogentry, 7 May 2014. On-line at: http://blogs.elpais.com/coche-electrico/2014/05/nissan-leaf-y-toyota-auris-el-electrico-y-el-hibrido-mas-demandados.html [access in February 2015].
[BOE-A-2001-20850] – Spanish Ministry of Economy, “Real Decreto 1164/2001, de 26 de octubre, por elque se establecen tarifas de acceso a las redes de transporte y distribución de energía eléctrica. Textoconsolidado (13/12/2014)”, Spanish Official State Gazette nº 268, 8 November 2001. BOE-A-2001-20850. Available on-line at: https://www.boe.es/buscar/pdf/2001/BOE-A-2001-20850-consolidado.pdf[access in February 2015].
[BOE-A-2011-14782] – Spanish Ministry of Industry, Tourism and Commerce, “Orden ITC/2452/2011, de13 de septiembre, por la que se revisan determinadas tarifas y primas de las instalaciones del régimenespecial.”, Spanish Official State Gazette nº 223, 16 September 2011. BOE-A-2011-14782. Available on-line at: https://www.boe.es/boe/dias/2011/09/16/pdfs/BOE-A-2011-14782.pdf [access in February 2015].
[BOE-A-2014-1053] – Spanish Ministry of Industry, Energy and Tourism, “Resolución de 31 de enero de2014, de la Dirección General de Política Energética y Minas, por la que se revisa el coste de producciónde energía eléctrica y los precios voluntarios para el pequeño consumidor.”, Spanish Official StateGazette nº 28, 1 February 2014. BOE-A-2014-1053. Available on-line at:http://boe.es/boe/dias/2014/02/01/pdfs/BOE-A-2014-1053.pdf [access in February 2015].
[BOE-A-2014-6176] – Spanish Ministry of Industry, Energy and Tourism, “Real Decreto 414/2014, de 6de junio, por el que se regula la concesión directa de subvenciones para la adquisición de vehículoseléctricos en 2014, en el marco de la Estrategia integral para el impulso del vehículo eléctrico en España2010-2014 (Programa MOVELE 2014).”, Spanish Official State Gazette nº 141, 11 June 2014. BOE-A-2014-6176. Available on-line at: https://www.boe.es/boe/dias/2014/06/11/pdfs/BOE-A-2014-6176.pdf[access in February 2015].
[BOE-A-2014-6684] – Spanish Ministry of Industry, Energy and Tourism, “Real Decreto 525/2014, de 20de junio, por el que se regula la concesión directa de subvenciones del "Programa de Incentivos alVehículo Eficiente (PIVE-6)".”, Spanish Official State Gazette nº 155, 26 June 2014. BOE-A-2014-6684.Available on-line at: http://www.boe.es/boe/dias/2014/06/26/pdfs/BOE-A-2014-6684.pdf [access inFebruary 2015].
[Brady 2013] – Brady J. et al. “Data Collection and Analysis in Green eMotion”, External StakeholderReport, June 2013.
[Circontrol 2014] – Circontrol, “Catalogue 2014-2015, Quick Charge Combo CCL-QPC-CH-CCS”.Available on-line at: http://circarlife.com/sites/default/files/products/pdf/Circontrol-recharging-solutions-for-ev-CCL-QPC-CH-CCS.pdf [access in February 2015].
[CNMC 2014] – Spanish National Markets and Competition Commission, “Listado de Gestores deCargas”, March 2014. Available on-line at:https://sede.cne.gob.es/c/document_library/get_file?uuid=8be589c8-9bbc-4881-b05f-baffd8e49afd&groupId=10136 [access in February 2015].

GA MOVE/FP7/265499/Green eMotion WP 9: Deliverable 9.4. Part 2 Page 69 of 70
[D9.4] – Madina C. et al., “Deliverable D9.4: Envisaged EU mobility models, role of involved entities, andCost Benefit Analysis in the context of the European Clearing House mechanism”, August 2014. Availableon-line at: http://www.greenemotion-project.eu/upload/pdf/deliverables/D9_4_BM-and-Cost-Benefit-Analysis-submitted.pdf [access in February 2015].
[D9.6] – Newbery D., Strbac G. “Deliverable D9.6: Barriers, gaps, and commercial and regulatoryframework for broad rollout of e-mobility. Final Report”, November 2014.
[DGT 2014] – Spanish National Traffic Authority, “Parque de vehículos por tipos, CCAA, provincias ycarburantes – 2013”. Available on-line at: http://www.dgt.es/Galerias/seguridad-vial/estadisticas-e-indicadores/parque-vehiculos/prov-y-tipo-carburante/12_Parque_Vehiculos-tipo-carburante_13.xls[access in February 2015].
[Deirdre 2014] – Deirdre A., “TEN-T International Green Electric Highways”, presentation at the “GreeneMotion meets CROSSING BORDERS” conference, Vienna, 8 October 2014.
[DOE 2014] – U.S. Department of Energy, “2013 Nissan Leaf. Advanced Vehicle Testing – BaselineTesting Results”, Vehicle Technologies Program, Energy Efficiency & Renewable Energy. Available on-line at: http://avt.inl.gov/pdf/fsev/fact2013nissanleaf.pdf [access in February 2015].
[DR-ES1] – Morrissey P. et al., “Demo Region: ES1 Spain – Barcelona and Malaga Data Analysis.Charge Point and Vehicle Data”, October 2014.
[EC 2013, 1] – European Commission, “Clean power for transport – Frequently asked questions”European Commission MEMO 13/24, Brussels, 24 January 2013. Available on-line at:http://europa.eu/rapid/press-release_MEMO-13-24_en.pdf [access in February 2015].
[EC 2013, 2] – European Commission, “EU transport in figures. Statistical Pocketbook 2013”, ISBN 978-92-79-28860-9, Belgium. Available on-line at: http://ec.europa.eu/transport/facts-fundings/statistics/doc/2013/pocketbook2013.pdf [access in February 2015].
[EEA 2010] – European Environment Agency, “Occupancy rates of passenger vehicles (TERM 029)”, July2010. Available on-line at: http://www.eea.europa.eu/data-and-maps/indicators/occupancy-rates-of-passenger-vehicles/occupancy-rates-of-passenger-vehicles-1 [access in February 2015].
[Efacec 2014] – Efafec, “Portfolio of products. QC 50 Quick charger”. Available on line-at:http://www.efacec.pt/PresentationLayer/ResourcesUser/Catalogos%202012/Mobilidade%20Electrica/SA68I1102B1_QC50_EN.pdf [access in February 2015].
[Endesa 2014] – Endesa, “Anexo de precios clientes de empresas. Condiciones económicas”, Pricesapplicable until 31 December 2014. Available on-line at:http://www.endesaonline.com/resourcesES/em0614/preciosE.pdf [access in December 2014].
[EURELECTRIC 2013] – “Deploying publicly accessible charging infrastructure for electric vehicles: howto organise the market?”, Eurelectric Concept Paper, July 2013. Available on-line at:http://www.eurelectric.org/media/84461/0702_emobility_market_model_final-2013-030-0501-01-e.pdf[access in February 2015].
[FS 2014] – Food Service Europe & Middle East, “Filling Stations for Empty Stomachs”, Edition 1/2014,p.8-21. Available on-line at: http://www.food-service-europe.com/market/pdf/696_org.pdf [access inFebruary 2015].
[HUBJECT 2014] – Hubject “ENIO connects charging stations to the intercharge network”, press release,18 November 2014. Available on-line at: http://www.hubject.com/pdf/PM_hubject_20141118_EN.pdf[access in February 2015].
[MINETUR 2014] – Spanish Ministry of Industry, Energy and Tourism, “Precios de carburantes ycombustibles, Datos de junio de 2014”. Available on-line at:http://www.minetur.gob.es/energia/petroleo/Precios/Informes/InformesMensuales/2014/junio2014.pdf[access in February 2015].

GA MOVE/FP7/265499/Green eMotion WP 9: Deliverable 9.4. Part 2 Page 70 of 70
[Mock 2014] – Mock P., Yang Z., “Driving Electrification. A global comparison of fiscal incentive policy forElectric Vehicles”, May 2014. Available on-line at:http://www.theicct.org/sites/default/files/publications/ICCT_EV-fiscal-incentives_20140506.pdf [access inFebruary 2015].
[Nissan 2015, 1] – Nissan Europe, “Nissan’s electric car drivers cover more kilometres than the averagepetrol or diesel vehicle” Press release, ID: 128267, 8 January 2015. Available on-line at:http://newsroom.nissan-europe.com/EU/en-gb/Media/Media.aspx?mediaid=128267 [access in February2015].
[Nissan 2015, 2] – Nissan Motor (GB) Limited, “Nissan Leaf Brochure”. Available on-line at:http://www.nissan.co.uk/content/dam/services/gb/brochure/Nissan_Leaf.pdf [access in February 2015].
[NPE 2010] – German National Electric Mobility Platform, “Interim Report of the National Platform forElectric Mobility”, November 2010. Available on-line at:http://www.bmwi.de/English/Redaktion/Pdf/electro-mobility-report,property=pdf,bereich=bmwi2012,sprache=en,rwb=true.pdf [access in February 2015].
[NPE 2014] – German National Electric Mobility Platform, “Fortschrittsbericht 2014 – Bilanz derMarktvorbereitung”, December 2014. Available on-line at:http://www.bmub.bund.de/fileadmin/Daten_BMU/Download_PDF/Verkehr/emob_fortschrifttsbericht_2014_bf.pdf [access in February 2015].
[OECD 2014] – “Greening Household Behaviour: Overview from the 2011 Survey – Revised edition”,OECD Studies on Environmental Policy and Household Behaviour, OECD Publishing. Available on-lineat: http://dx.doi.org/10.1787/9789264214651-en [access in February 2015].
[OJ L307/1] – “Directive 2014/94/EC of the European Parliament and of the Council of 22 October 2014on the deployment of alternative fuels infrastructure”, Official Journal of the European Union, L307/1, 28October 2014. Available on-line at: http://eur-lex.europa.eu/legal-content/EN/TXT/PDF/?uri=CELEX:32014L0094&from=EN [access in February 2015].
[Schneider 2008] – Schneider Electric, “Guía de Diseño de Instalaciones Eléctricas – Edición 2008”.Available on-line at: http://www.schneiderelectric.es/sites/spain/es/productos-servicios/distribucion-electrica/descarga/pdf-guia-diseno-instalaciones-electricas.page [access in February 2015].