second order draft chapter 11 ipcc wg1 fourth … · second order draft chapter 11 ipcc wg1 ......
TRANSCRIPT
Second Order Draft Chapter 11 IPCC WG1 Fourth Assessment Report
Do Not Cite or Quote 11-140 Total pages: 38
1 2
3 4 5 6 7 8 9
10 11 12 13 14 15 16 17 18
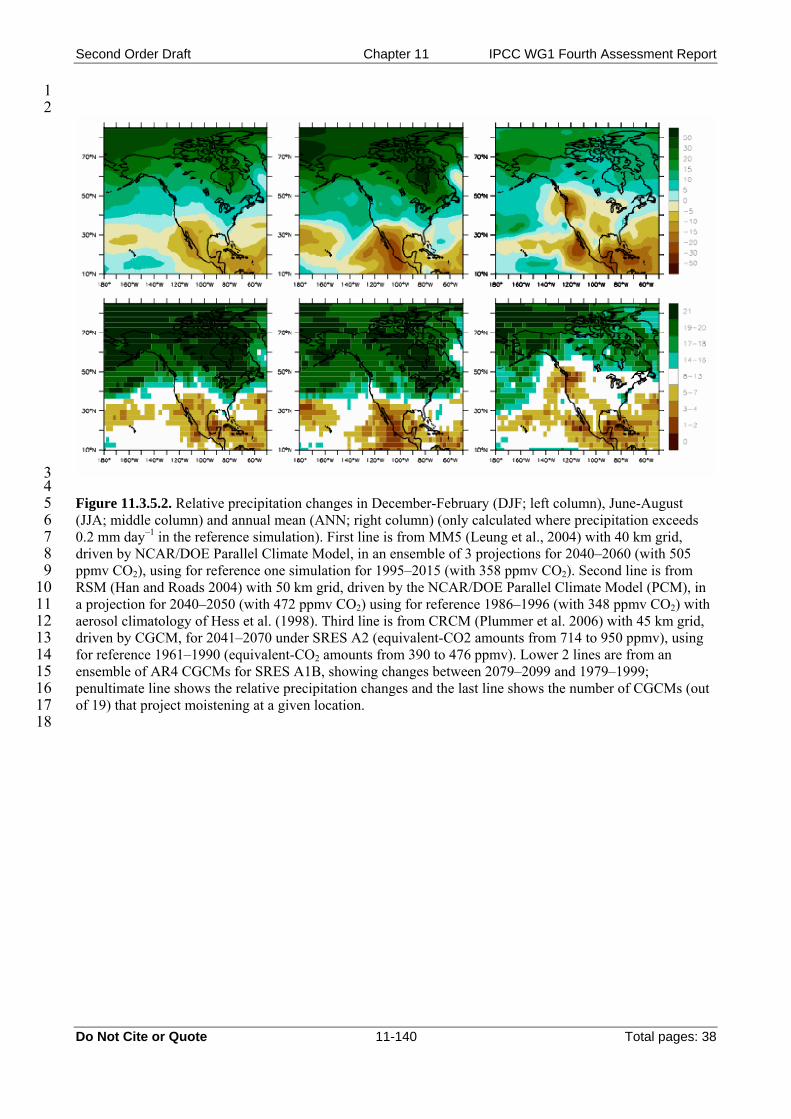
Figure 11.3.5.2. Relative precipitation changes in December-February (DJF; left column), June-August (JJA; middle column) and annual mean (ANN; right column) (only calculated where precipitation exceeds 0.2 mm day–1 in the reference simulation). First line is from MM5 (Leung et al., 2004) with 40 km grid, driven by NCAR/DOE Parallel Climate Model, in an ensemble of 3 projections for 2040–2060 (with 505 ppmv CO2), using for reference one simulation for 1995–2015 (with 358 ppmv CO2). Second line is from RSM (Han and Roads 2004) with 50 km grid, driven by the NCAR/DOE Parallel Climate Model (PCM), in a projection for 2040–2050 (with 472 ppmv CO2) using for reference 1986–1996 (with 348 ppmv CO2) with aerosol climatology of Hess et al. (1998). Third line is from CRCM (Plummer et al. 2006) with 45 km grid, driven by CGCM, for 2041–2070 under SRES A2 (equivalent-CO2 amounts from 714 to 950 ppmv), using for reference 1961–1990 (equivalent-CO2 amounts from 390 to 476 ppmv). Lower 2 lines are from an ensemble of AR4 CGCMs for SRES A1B, showing changes between 2079–2099 and 1979–1999; penultimate line shows the relative precipitation changes and the last line shows the number of CGCMs (out of 19) that project moistening at a given location.

Second Order Draft Chapter 11 IPCC WG1 Fourth Assessment Report
Do Not Cite or Quote 11-141 Total pages: 38
1 2
3 4 5 6 7 8 9
10 11 12 13 14
Figure 11.3.5.3. Relative snow depth changes in January, February and March, as projected by 3 RCMs (only calculated where climatological snow amounts exceed 5 mm of water equivalent). First line is from 40 km MM5 (Leung et al., 2004), driven by NCAR/DOE Parallel Climate Model, in an ensemble of 3 projections using a future scenario of greenhouse gases and sulfate described by Dai et al. (2001) for 2040–2060 (with 505 ppmv CO2), using for reference one simulation for 1995–2015 (with 358 ppmv CO2). Second line is from RSM (Han and Roads 2004) with 50 km grid, driven by the NCAR/DOE Parallel Climate Model (PCM), in a projection for 2040–2050 (with 472 ppmv CO2) using for reference 1986-1996 (with 348 ppmv CO2) with aerosol climatology of Hess et al. (1998). Lower line is from 45-km CRCM (Plummer et al. 2006), driven by CGCM, for 2041–2070 under SRES A2 (equivalent-CO2 amounts from 714 to 950 ppmv), using for reference 1961–1990 (equivalent-CO2 amounts from 390 to 476 ppmv).

Second Order Draft Chapter 11 IPCC WG1 Fourth Assessment Report
Do Not Cite or Quote 11-142 Total pages: 38
1 2
3 4 5 6 7 8
Figure 11.3.6.1. Warming for Central America, Amazonaz and southern South American regions for: 1900–2000 as observed (black line) and as simulated (red envelope); and for 2001–2100 as simulated for the A1B emission scenario (green envelope). The set of AR4 AOGCM simulations used for both periods are only those with all forcings in the 20th century (eleven simulations).

Second Order Draft Chapter 11 IPCC WG1 Fourth Assessment Report
Do Not Cite or Quote 11-143 Total pages: 38
1 2
3 4 5 6 7 8 9
10
Figure 11.3.6.2. Consensus AR4 GCM A1B temperature and precipitation changes over Central and South America. Top row: Annual mean, December-January-February, and June-July-August temperature change between 1980–1999 in the 20C3M simulations and 2080-2099 in A1B, averaged over 21 models. Middle row: same for fractional change in precipitation. Bottom row: number of models out of 21 that project precipitation to increase.

Second Order Draft Chapter 11 IPCC WG1 Fourth Assessment Report
Do Not Cite or Quote 11-144 Total pages: 38
1 2
3 4 5 6 7 8
Figure 11.3.7.1. Warming for northern and southern Austalian regions for: 1900–2000 as observed (black line) and as simulated (red envelope); and for 2001 -2100 as simulated for the A1B emission scenario (green envelope). The set of AR4 AOGCM simulations used for both periods are only those with all forcings in the 20th century (eleven simulations).

Second Order Draft Chapter 11 IPCC WG1 Fourth Assessment Report
Do Not Cite or Quote 11-145 Total pages: 38
1 2
3 4 5 6 7 8 9
Figure 11.3.7.2. Consensus AR4 GCM A1B temperature and precipitation changes over Australia and New Zealand. Top row: Annual mean, December-January-February, and June-July-August temperature change between 1980–1999 in the 20C3M simulations and 2080–2099 in A1B, averaged over 21 models. Middle row: same for fractional change in precipitation. Bottom row: number of models out of 21 that project precipitation to increase.

Second Order Draft Chapter 11 IPCC WG1 Fourth Assessment Report
Do Not Cite or Quote 11-146 Total pages: 38
1 2
3 4 5 6 7 8 9
10 11 12
Figure 11.3.7.3. Ranges of average seasonal and annual rainfall change (%) for around 2030 and 2070 relative to 1990. The coloured bars show the ranges of change for areas with corresponding colours in the maps. The range of uncertainty represented by the coloured bar is due to uncertainty in global warning at the given date (as in IPCC 2001) and differences in regional response (% change per degree of global warming) in the 14 of the AR4 AOGCMs. Ranges are not given for areas with seasonally low rainfall because percentage changes in rainfall cannot be as readily calculated or applied in such regions. The method is as described in CSIRO (2001) and Whetton et al. (2005) except that here AR4 AOGCM simulations are used.

Second Order Draft Chapter 11 IPCC WG1 Fourth Assessment Report
Do Not Cite or Quote 11-147 Total pages: 38
1 2
3 4 5 6
Figure 11.3.7.4. Change in the north-south pressure JJA gradient across New Zealand in the AR4 simulations (2079–2098 mean compared to 1979–1998 for the A1B emission scenario).

Second Order Draft Chapter 11 IPCC WG1 Fourth Assessment Report
Do Not Cite or Quote 11-148 Total pages: 38
1 2
3 4 5 6 7 8
Figure 11.3.8.1. Warming for the Arctic (left) and Antarctic (right) regions for: 1900–2000 as observed (black line) and as simulated (red envelope); and for 2001–2100 as simulated for the A1B emission scenario (green envelope). The set of AR4 AOGCM simulations used for both periods are only those with all forcings in the 20th century (eleven simulations).
Second Order Draft Chapter 11 IPCC WG1 Fourth Assessment Report
Do Not Cite or Quote 11-149 Total pages: 38
1 2
3 4 5 6 7 8 9
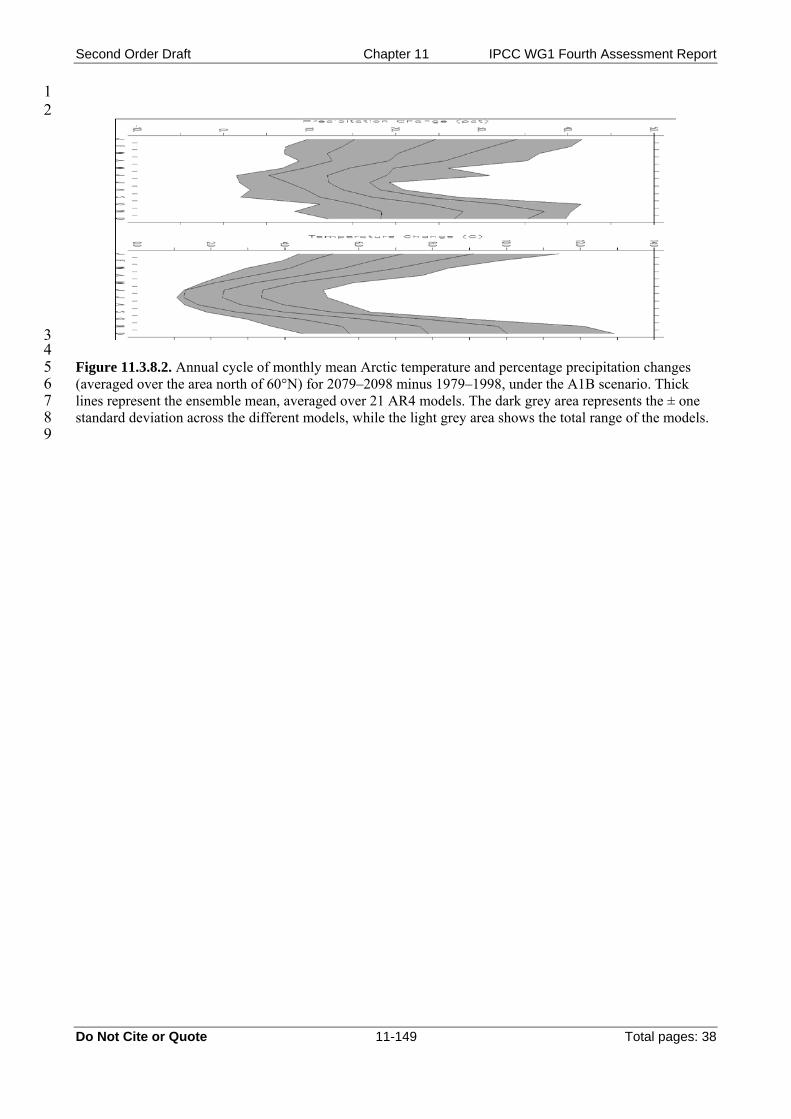
Figure 11.3.8.2. Annual cycle of monthly mean Arctic temperature and percentage precipitation changes (averaged over the area north of 60°N) for 2079–2098 minus 1979–1998, under the A1B scenario. Thick lines represent the ensemble mean, averaged over 21 AR4 models. The dark grey area represents the ± one standard deviation across the different models, while the light grey area shows the total range of the models.

Second Order Draft Chapter 11 IPCC WG1 Fourth Assessment Report
Do Not Cite or Quote 11-150 Total pages: 38
1 2
3 4 5 6 7 8 9
Figure 11.3.8.3. Relationship between the annual percentage precipitation and temperature change (2079–2098 minus 1979–1998) in the Arctic (averaged over the area north of 60°N) under the A1B scenario as seen in each of the 21 AR4 models.

Second Order Draft Chapter 11 IPCC WG1 Fourth Assessment Report
Do Not Cite or Quote 11-151 Total pages: 38
1 2
3 4 5 6 7 8 9
Figure 11.3.8.4. Annual surface temperature change from 1979–1998 to 2079–2098 in the Antarctic under the A1B scenario. Top: mean response, averaged over 21 AR4 models, bottom: number of AR4 models that generate a warming greater than 2°C.

Second Order Draft Chapter 11 IPCC WG1 Fourth Assessment Report
Do Not Cite or Quote 11-152 Total pages: 38
1 2
3 4 5 6 7 8 9
Figure 11.9.1. Warming for seven Oceanic regions for: 1900–2000 as observed (black line) and as simulated (red envelope); and for 2001–2100 as simulated for the A1B emission scenario (green envelope). The set of AR4 AOGCM simulations used for both periods are only those with all forcings in the 20th century (eleven simulations).

Second Order Draft Chapter 11 IPCC WG1 Fourth Assessment Report
Do Not Cite or Quote 11-153 Total pages: 38
1
2 3 4 5 6 7 8
Figure 11.3.9.2. Temperature change (º C) from 1980–1999 to 2080–2099 obtained from AR4/PCMDI models using the SRES A1B scenario for (a) Caribbean (CAR), (b) Indian Ocean (IND), (c) Northern Pacific Ocean (NPA) and (d) Southern Pacific Ocean (SPA). The inner (dark) band refers to plus or minus one standard deviation, and the outer bands give the total range of the global model ensemble.

Second Order Draft Chapter 11 IPCC WG1 Fourth Assessment Report
Do Not Cite or Quote 11-154 Total pages: 38
1 2
3 4 5 6
Figure 11.3.9.3. As for Figure 11.3.9.2 but for precipitation change (%).

Second Order Draft Chapter 11 IPCC WG1 Fourth Assessment Report
Do Not Cite or Quote 11-155 Total pages: 38
1 2
3 4 5 6
Figure 11.3.9.4. Spatial distribution of annual rainfall change (%) and inter-model consistency in terms of number of models with precipitation greater than zero in the Pacific Ocean for A1B 2008–2099 minus 1980–1999.

Second Order Draft Chapter 11 IPCC WG1 Fourth Assessment Report
Do Not Cite or Quote 11-156 Total pages: 38
1 2
3 4 5 6 7 8 9
Box 11.1, Figure 1. Warming for six continental scale regions for: 1900–2000 as observed (black line) and as simulated (red envelope); and for 2001–2100 as simulated for the A1B emission scenario (green envelope). The set of AR4 AOGCM simulations used for both periods are only those with all forcings in the 20th century (eleven simulations).

Second Order Draft Chapter 11 IPCC WG1 Fourth Assessment Report
Do Not Cite or Quote 11-157 Total pages: 38
1
2 3 4 5 6 7 8 9
10
Box 11.1, Figure 2. Robust findings on regional climate change for mean and extreme precipitation, drought, snow, sea-ice, extreme winds and tropical cyclones. This regional assessment is based upon AOGCM based studies, RCMs, statistical downscaling and process understanding. More detail on these findings may be found in the notes below, and their full description, including sources is in Chapter 11. The background map indicates the degree of consistency between AR4 AOGCM simulations (21 simulations used) in the direction of simulated precipitation change.
Second Order Draft Chapter 11 IPCC WG1 Fourth Assessment Report
Do Not Cite or Quote 11-158 Total pages: 38
1 2 3 4 5 6 7 8 9
10 11 12 13 14 15 16 17 18 19 20 21 22 23 24 25 26 27 28 29 30 31 32
Notes: (1) Very likely annual precipitation increase in most of northern Europe, the northern part of North America, the Arctic (largest in cold season), and the South Island of New Zealand (mainly in the west due to topographical effects). (2) Very likely annual precipitation decrease in most of the Mediterranean area, North Africa, northern Sahara and along the southern Andes. (3) Very likely winter (DJF) precipitation increase in Northern Asia and the Tibetan Plateau. (4) Very likely decrease in winter (JJA) rainfall in Southern Africa and southwestern Australia (likely decrease for southern Australia). (5) Likely annual precipitation increases in tropical and East Africa, Antarctica, Northern Pacific (mainly JJA), the Indian Ocean (mainly DJF), and the South Pacific (slight increase only). (6) Likely annual precipitation decrease in Central America (mainly in the dry periods of the annual cycle) and in South-West USA (7) Likely summer (JJA) increase in precipitation in Northern Asia, East Asia, South Asia and northern Southeast Asia, and likely winter (DJF) increase in East Asia. (8) Likely summer (JJA) decrease in precipitation in Central Asia and likely summer (JJA) decrease and winter (DJF) increase in central Europe and over southern British Columbia south-eastward along the USA-Canada border. (9) Likely summer (DJF) increase in southern Southeast Asia and southeastern South America (10) Likely increase in extremes of daily precipitation in northern Europe, South Asia, East Asia, Southeast Asia, Australia and New Zealand. (11) Likely increase in risk of drought in Australia and New Zealand; the Mediterranean, central and Southern Europe (summer drought); in Central America (boreal spring and dry periods of the annual cycle). (12) Very likely decrease in snow season length and snow depth in most of Europe and North America. (13) Arctic sea ice is very likely to decrease in its extent and thickness. (14) Likely increase in peak wind and peak precipitation intensities associated with tropical cyclones over Southeast and East Asia, South Asia, Southeast Pacific and Australia (impact may be affected or offset by changes in tropical cyclone numbers). (15) Likely increase in mean windspeed across the southern island of New Zealand. (16) Likely increased number of intense cyclones and associated strong winds, particularly in winter over the North Atlantic, northern and Central Europe.

Second Order Draft Chapter 11 IPCC WG1 Fourth Assessment Report
Do Not Cite or Quote 11-159 Total pages: 38
1 2
3 4 5 6 7 8
Box 11.4, Figure 1. Change the 50-year return period extreme water level due to changes in atmospheric storminess, mean sea level and vertical land movements (from Lowe and Gregory, 2005).