second graders’ understanding of constant difference and the empty number line gwenanne salkind...
TRANSCRIPT

Second Graders’ Understanding of
Constant Differenceand the Empty Number
Line
Second Graders’ Understanding of
Constant Differenceand the Empty Number
LineGwenanne Salkind
EDCI 726 & 858
May 10, 2008

IntroductionIntroduction
The NCTM Standards (2000) state that prekindergarten through grade 2 students should “develop and use strategies for whole number computations, with a focus on addition and subtraction” (p. 78)
Second graders typically have difficulty understanding and solving two-digit subtraction problems that require regrouping.

Review of LiteratureReview of Literature
Children can solve two-digit subtraction problems strategically (Carpenter, et al., 1999; Carroll & Porter, 2002).
Representations can be powerful tools for learning (NCTM, 2000; Goldin, 2003).
The empty number line is a visual representation that has been used to develop conceptual understanding of subtraction strategies (Bobis, 2007; Klein, Beishuizen, & Treffers, 1998)
Constant difference is a “powerful strategy for subtraction because messy, unfriendly problems can easily be made friendly” (Fosnot & Dolk, 2001, p. 148).

The Empty Number LineThe Empty Number Line
24 + 27 = ?
53 – 27 = ?

Constant DifferenceConstant Difference
Adding or subtracting the same number to both the subtrahend and the minuend in a subtraction problem does not change the answer.
50 – 25 = 25 49 – 24 = 25

Research QuestionsResearch Questions
Do second grade students who were taught using empty number lines:
1. Use a constant difference strategy to solve subtraction problems more frequently?
2. Have better mental computation skills? (speed, accuracy)
3. Have greater procedural competence?(accuracy)

Participants – Second gradersParticipants – Second graders
Treatment Group– 8 boys, 6 girls– 36% Asian, 21% black, 14% white,
14% Hispanic, 14% multi-racial Control Group
– 7 boys, 8 girls– 40% Asian, 33% Hispanic, 13% multi-
racial, 7% black, 7% white

Similarities & Differences in InstructionSimilarities & Differences in Instruction
Both groups– Two-week unit (6 lessons)– Two-digit subtraction– Constant difference– Number lines– Strings, T/F, Story Problems
Treatment group only– Empty number lines

Strings
12 – 6 =
13 – 7 =
14 – 8 =
50 – 25 =
51 – 26 =
52 – 27 =
49 – 24 =
True or False?
15 – 7 = 16 – 8
35 – 30 = 36 – 29
29 – 17 = 30 – 19
32 – 20 = 33 – 21
30 – 22 = 29 – 23
Story
Problems
Aaron is 31 years old. Fahim is 18
years old. What is the difference in
their ages?
Sara is 43 years old. Tom is 8 years younger than Sara. How old is Tom?

Example of number line used during instruction (both groups)
Example of number line used during instruction (both groups)

Examples of empty number lines used during instruction (treatment group only)
Examples of empty number lines used during instruction (treatment group only)
True or False? 49 – 24 = 50 – 25
True or False ? 35 – 30 = 36 – 29

Data Sources Used to Answer Each Research QuestionData Sources Used to Answer Each Research Question
Research Questions
Data Sources 1 2a 2b 3
Mental Speed Tests
Written Subtraction Tests
Student Interviews
Student Work Samples

AnalysesAnalyses Quantitative
– Individual student scores were determined for mental speed tests, written subtraction tests, and interviews.
– T-tests were used to compare means between treatment and control groups.
Qualitative– Student written work samples, written subtraction
tests, and notes from student interviews were analyzed for evidence of the use of the constant difference strategy.
– True/False equations (interviews) were coded according to students’ solution strategies: invalid strategy (I), guess (G), solved both sides (S), and used relational thinking (R).

Mean Scores of Pre/PosttestsMean Scores of Pre/Posttests
Treatment
n = 14
Control
n = 15
Tests Pre Post Pre Post
Mental Speed (10) 1.64 2.71 3.27 2.87
Written Subtraction (8) 3.21 3.57 3.80 3.80
Note: There were no statistically significant differences between means.

Mean Scores of Interview SubtestsMean Scores of Interview Subtests
Treatment
n = 7
Control
n = 7
Subtests Pre Post Pre Post
True/False (10) 2.43 5.86 1.43 2.86
Differences (12) 5.29 6.14 6.14 5.43
Story Problems (3) 0.86 1.71 1.57 1.14
Mental Computation (4) 0.71 1.43 0.57 1.14Note: There were no statistically significant differences between means.

Use of Constant Difference StrategyUse of Constant Difference Strategy
There was no evidence that a student changed a subtraction problem into an easier problem using a constant difference strategy.
Students did use the constant difference strategy to find given differences and to solve true/false equations.

Example of Using a Constant Difference Strategy to Find Given Differences
Example of Using a Constant Difference Strategy to Find Given Differences

Examples of Using a Constant Difference Strategy to Solve True/False Equations
Examples of Using a Constant Difference Strategy to Solve True/False Equations

Percent of Students Who Used a Constant Difference Strategy on Written Classwork
71%
14%
87%
0%0%
10%
20%
30%
40%
50%
60%
70%
80%
90%
100%
Finding GivenDifferences
Solving True/FalseEquations
Per
cen
t o
f S
tud
ents
Treatment Group(n = 14)
Control Group(n = 15)
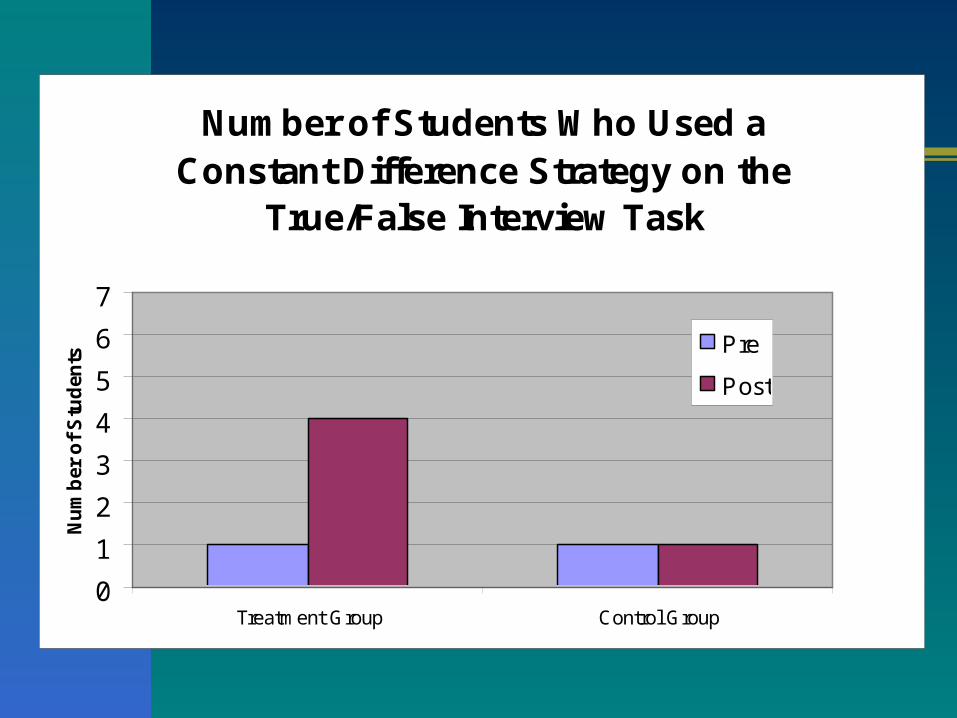
Number of Students Who Used a Constant Difference Strategy on the
True/False Interview Task
0
1
2
3
4
5
6
7
Treatment Group Control Group
Nu
mb
er o
f S
tud
ents
Pre
Post

Key FindingsKey Findings
A high percentage of students used a constant difference strategy to find given differences in both classes.
Only students in the who were taught using empty number lines used a constant difference strategy to solve true/false equations.

Key FindingsKey Findings
There were no statistically significant differences in mental computation speed or accuracy between students taught with an empty number line and those who were not.
There were no statistically significant differences in procedural competence between students taught with an empty number line and those who were not.

LimitationsLimitations
The instructional unit was too short. There was not enough difference in
instruction between the two treatment groups.

ReferencesReferencesBobis. J. (2007). The empty number line: A useful tool or just another
procedure? Teaching Children Mathematics, 13(8), 410-413.Carpenter, T. P., Fennema, E., Franke, M. L., Levi, L., & Empson, S. B.
(1999). Children’s mathematics: Cognitively guided instruction. Portsmouth, NH: Heinemann.
Carroll, W. M., & Porter, D. (2002). Invented strategies can develop meaningful mathematical procedures. In D. L. Chambers (Ed.), Putting research into practice in the elementary grades (pp. 16-20). Reson, VA: The National Council of Teachers of Mathematics.
Fosnot, C. T., & Dolk, M. (2001). Young mathematicians at work: Constructing number sense, addition, and subtraction. Portsmouth, NH: Heinemann.
Goldin, G. A. (2003). Representation in school mathematics: A unifying research perspective. In J. Kilpatrick, W. G. Martin, & D. Schifter (Eds.), A research companion to principles and standards for school mathematics (pp. 275-285). Reston, VA: NCTM.
Klein, A. S., & Beishuizen, M., & Treffers, A. (1998). The empty number line in Dutch second grades: Realistic and gradual program design. Journal for Research in Mathematics Education, 29(4), 443-464.
National Council of Teachers of Mathematics. (2000). Principles and standards for school mathematics. Reston, VA: Author.