second edition 2017 - south african rand and publications/attachments... · financial stability...
TRANSCRIPT

Financial Stability ReviewSecond edition
2017
South African Reserve Bank
Financial Stability ReviewSecond edition
2017

© South African Reserve Bank
All rights reserved. No part of this publication may be reproduced, stored in a retrieval system or transmitted in any form or by any means, electronic, mechanical, photocopying, recording or otherwise, without fully acknowledging the Financial Stability Review of the South African Reserve Bank as the source. The contents of this publication are intended for general information only and are not intended to serve as financial or other advice. While every precaution is taken to ensure the accuracy of information, the South African Reserve Bank shall not be liable to any person for inaccurate information or opinions contained in this publication. Unless indicated otherwise, data were supplied by the South African Reserve Bank.
This issue of the Financial Stability Review focuses mainly on the six-month period ending June 2017. However, selected developments up to the date of publication were also reported on. Data may include own calculations made for purposes of this publication.
Comments and enquiries relating to this Financial Stability Review are welcomed and should be addressed to:
Head: Financial Stability DepartmentSouth African Reserve BankP O Box 427Pretoria 0001
Tel. +27 12 313 3601E-mail: [email protected]
www.resbank.co.za ISSN: 1811-2226
Purpose of the Financial Stability Review
The primary objective of the South African Reserve Bank (SARB) is to protect the value of the currency in the interest of balanced and sustainable economic growth in South Africa.
In addition to this, the SARB’s function and mandate of protecting and enhancing financial stability in the Republic of South Africa is affirmed in the Financial Sector Regulation Act 9 of 2017. In pursuit of this objective and to promote a stable financial system, the SARB publishes a semi-annual Financial Stability Review. The publication aims to identify and analyse potential risks to financial system stability, communicate such assessments and stimulate debate on pertinent issues. The SARB recognises that it is not the sole custodian of financial system stability in South Africa but that it contributes significantly towards, and coordinates a larger effort involving government, other regulators, self-regulatory agencies and financial market participants.
Defining ‘financial stability’
Financial stability is not an end in itself but, like price stability, is generally regarded as an important precondition for sustainable economic growth, development and employment creation.
Financial stability refers to a financial system that is resilient to systemic shocks, facilitates efficient financial intermediation and mitigates the macroeconomic costs of disruptions in such a way that confidence in the system is maintained.

Contents
Overview ............................................................................................................................ 1Developments and trends impacting on financial stability ................................................... 2 Economic growth outlook ............................................................................................ 2 Financial markets ......................................................................................................... 3 Financial institutions ..................................................................................................... 7 Non-financial institutions .............................................................................................. 13 Households ................................................................................................................. 16 Residential real estate .................................................................................................. 18 Government finances................................................................................................... 19 Adequacy of foreign exchange reserves ...................................................................... 20Financial stability risks and outlook ..................................................................................... 22 Update on financial stability risks ................................................................................. 22 Update on the financial cycle ....................................................................................... 23Macroprudential policy regulation ....................................................................................... 24 Assessing the application of the countercyclical capital buffer for banks ...................... 24 Consideration for the activation of the countercyclical capital buffer for banks ................... 25The robustness of the domestic financial infrastructure ...................................................... 27 Update on the Financial Sector Regulation Bill 2015 .................................................... 27 Regulatory developments affecting the domestic banking sector ................................. 27 Regulatory developments affecting the domestic insurance sector .............................. 29 Regulatory developments affecting the domestic financial markets .............................. 30 Global regulatory developments .................................................................................. 31
Box
1 Constructing a Financial Conditions Index for South Africa ............................................ 26
Figures
1 Real GDP growth in emerging markets ........................................................................ 22 South African real GDP growth outcomes and projection ............................................ 33 Risk aversion in global financial markets ...................................................................... 34 US Fed balance sheet ................................................................................................. 45 Leveraged US stock market......................................................................................... 46 Global price-earnings ratio ........................................................................................... 57 Leverage in the S&P500 .............................................................................................. 58 Price to book ratios of MSCI global stock exchange indices ........................................ 59 Global bond indices ..................................................................................................... 610 Non-resident net purchases of South African bonds and equities ................................ 611 Credit default swap spread of speculative-grade debt ................................................. 612 Growth in undrawn facilities and drawn facilities as a percentage of total
loan value for credit cards and overdrafts ................................................................... 713 Credit default ratios for selected asset categories ........................................................ 914 Exposures greater than 90 days as a percentage of total on-balance
sheet exposure reported by the five largest banks ....................................................... 915 Exposures greater than 90 days as a percentage of total on-balance
sheet exposure reported by ‘other’ banks .................................................................... 1016 Return on equity and growth in income and expenses for the banking sector ............. 1017 Cheque and demand deposits up to 1 day .................................................................. 1018 Liquidity coverage ratio ................................................................................................ 1119 Distribution of financial assets between financial intermediaries in South Africa ........... 1120 South Africa’s shadow-banking classification into economic functions ......................... 1121 Total assets of pension fund industry ........................................................................... 12

22 Penetration ratio .......................................................................................................... 1223 Investment allocation of pension funds ........................................................................ 1224 Investment yield of long-term typical insurers ............................................................... 1325 Non-financial corporates’ domestic debt securities, international debt
securities and the Experian Business Debt Index ......................................................... 1526 Non-financial corporate sector: aggregate interest coverage ratio ................................ 1527 Non-financial corporate sector: sectoral interest coverage ratio ................................... 1628 Non-financial corporate sector: State Owned Enterprises’ interest coverage ratio ........ 1629 Non-financial corporate sector: EDF distribution of South African incorporated firms ... 1730 Spread between average household interest rates and prime rate ............................... 1831 Consumer Financial Vulnerability Index and the Consumer Confidence Index .............. 1832 Mortgage-instalment-to-rent and price-to-rent ratios ................................................... 1933 Loan debt of national government ............................................................................... 1934 Guarantees for State Owned Enterprises: Available facilities and actual usage ............. 1935 General government debt-to-GDP ratios of BRICS countries ....................................... 2036 South Africa’s gross gold and other foreign reserves ................................................... 2037 Reserve adequacy for South Africa .............................................................................. 2138 The financial cycle, its components and downward phases of the business cycle ....... 2339 Credit-to-GDP ratio, gap and HP trend ........................................................................ 2440 Private sector credit-to-GDP gap and the Financial Conditions Index ........................... 2441 Credit-to-GDP gaps for households and corporates .................................................... 2542 Selected private sector credit-to-GDP gaps according to asset classes ...................... 2543 Values and volumes settled on SIRESS ...................................................................... 31
Tables
1 Selected indicators of the South African banking sector .............................................. 82 Number of individual policies that lapsed in the first year ............................................. 133 Liabilities, capital adequacy requirement and free assets ............................................. 134 Business confidence index .......................................................................................... 145 Selected indicators for the non-financial corporate sector ............................................ 146 Selected indicators for the household sector ............................................................... 177 Risk assessment matrix ............................................................................................... 228 Participation details of SIRESS .................................................................................... 31

1Financial Stability Review second edition 2017
Overview
The Financial Sector Regulation Bill was signed into law on 21 August 2017 by the President of the Republic of South Africa. The key objective of this Act is to lay the foundation and architecture of the Twin Peaks model of financial regulation and confers on the SARB an explicit, statutory mandate to enhance and protect financial stability in South Africa. The effective date of implementation of the Financial Sector Regulation Act 9 of 2017 will now have to be gazetted by the Minister of Finance. New legislation that will facilitate the resolution of failing financial institutions, an important pillar of the SARB’s expanded mandate is currently developed by the SARB and National Treasury. A key component of such a resolution framework is the establishment of an explicit deposit insurance scheme for banks.
Financial stability risks which were identified and rated as ‘high’ by the SARB include the deteriorating domestic fiscal position resulting from lower-than-expected revenue collection and the rising contingent liabilities of State Owned Enterprises (SOEs); and global geopolitical events (North Korea, the Gulf states and Brexit), which could have considerable implications for financial stability. Also, both the South African financial cycle and the business cycle continued their downward phases in the period under review, implying that should the economy go into a recession under these circumstances, such a recession could be longer and deeper.
Global economic growth continued to recover in the first half of 2017. Emerging markets and developing economies in general are projected to see a sustained pickup in economic activity. The outlook for economic growth in the sub-Saharan Africa region has improved, but growth is expected to be still weak relative to historical trends and is expected to lag behind global growth trends in the next two years. For the South African economy, the SARB’s projection of economic growth remains subdued although the forecast released at the time of the September 2017 Monetary Policy Committee meeting was revised upwards slightly.
Global financial market risk-aversion measures are at very low levels. The low levels of perceived risk could exacerbate any overvaluation and/or mispricing of global financial assets and may amplify any correction that could ensue. The normalisation of the United States (US) Federal Reserves’ (Fed) monetary policy would likely reduce the support of the rise in global equity prices. The South African equity market could be adversely affected by the spillover effects of a more accelarated than currently anticipated normalisation of interest rates and improved growth prospects in advanced economies, but given the indications by the advanced economies’ central banks that the reduction of balance sheets and normalisation of policy rates will be undertaken gradually, such potential effects might be limited, although risks remain.
The global equity market could be deemed to be overvalued. Its continued rise could therefore be a signal of rising global financial stability risks. Despite escalating global geopolitical risks over the past two years, demand for high-yielding financial securities has not declined significantly. These developments have raised concerns over the possible mispricing of risks by investors in the global fixed income markets.
Business confidence in South Africa dropped markedly in the second quarter of 2017 as policy and political uncertainty continued to depress business sentiment. The total debt
securities outstanding in the first quarter of 2017 increased. Although the portion of domestic currency denominated securities have been increasing relative to foreign denominated securities since the fourth quarter of 2015, South African non financial corporates remained exposed to external shocks emanating from foreign currency movements.
South African SOEs’ debt is about R700 billion and attracted interest of about R51 billion in the previous financial year according to National Treasury. Most of these entities would not be viable entities without government support. Government financial guarantees have continued to increase, but government’s overall guarantees to SOEs are expected to remain around 10% of gross domestic product (GDP). However, many SOEs continued to report weak financial results due to operational inefficiencies, weak corporate governance structures and poor procurement practices. The financial condition of most of South African SOEs deteriorated markedly in recent years, which could lead to SOEs defaulting on their debt obligations and which could adversely affect both government finances as well as other financial institutions exposed to these enterprises. Government debt also continued its general upward trend, and is expected to increase to almost 60% of GDP in 2020/21. The containment of public debt and the narrowing of the budget deficit remains a focus area for government. Fiscal consolidation continues to face mounting obstacles.
South African banks remained healthy and well capitalised during the period under review. However, credit defaults continued to increase in the first half of 2017, while impaired advances as a percentage of total gross loans and advances remained stable at a low and healthy level. There appears to be increased credit stress in retail loan categories of the smaller banks. Profitability in the banking sector, while remaining strong, has decreased slightly in the first half of 2017. Total assets of the pension and provident funds industry have continued to increase, but at a slower pace. The financial position of the overall long-term insurance industry continued to be favourable. The long-term insurance industry remained adequately capitalised but its profitability has been negatively impacted by the subdued performance of South African equity market. In accordance with the minimum requirements of Basel III, the countercyclical capital buffer became effective from January 2016. The Financial Stability Committee of the SARB, after taking all relevant information into account, has to date not deemed it necessary to activate the capital add-on for banks.
Households’ balance sheets continued to deteriorate in the second quarter of 2017. While growth in disposable income of households moderated further and households remained financially vulnerable, growth in saving by households remained positive in 2017.
Despite some uncertainties caused by a number of global economic and financial developments including monetary policy normalisation in advanced economies, the South African financial system continues to efficiently facilitate financial intermediation and mitigate negative spillovers and disruptions. Overall, regardless of some headwinds from low domestic economic growth, a deteriorating fiscal position and challenging current political environment, the financial sector is assessed as strong and stable, characterised by well capitalised, liquid and profitable financial institutions and supported by a very robust financial infrastructure.

Financial Stability Review second edition 20172
Developments and trends impacting on financial stability
Economic growth outlookThere are strong linkages between financial stability and the real economy. It is generally accepted that a stable financial system provides a foundation for sustainable economic growth. Conversely, developments in the real economy also impact on financial stability. For example, low levels of economic growth impact financial stability directly through higher unemployment rate and the reduced ability of households and corporates to service debts with financial institutions. A low growth environment might also have an impact on the profitability of banks and insurers, and increase credit risks. Extended periods of low economic growth and the associated economic and social hardships might adversely impact political stability and the policy consensus necessary for recovery, and also put a country’s sovereign credit rating at risk. It is therefore important to monitor trends in the real economy as well as the financial sector to assess possible spillovers that are systemic in nature and could affect the stability of the financial system as a whole.
Global economic growth continued to recover in the first half of 2017 and was generally more broadbased across regions and sectors. Global economic growth has not been as synchronised as it has been in the first half of 2017, for a long time. Despite some geopolitical risks in North Korea and the Gulf States, the recovery was supported by generally reduced trade imbalances and risks as conditions improved in advanced, emerging and developing economies.1 Global inflation remained low, the pace of monetary policy normalisation among central banks of the major advanced economies was slower than expected and the emerging market credit environment showed signs of stabilisation.
Economic activity in the US remained relatively strong, although the full economic impact of the expected fiscal policy changes remains uncertain, adding to the decision by the International Monetary Fund (IMF) to revise downwards its economic growth estimates for the US. Growth in the euro area continued to strengthen, underpinned by falling unemployment levels, improvement in housing market conditions and higher levels of consumer sentiment. However, negotiations on post-Brexit arrangements are expected to offset some of the positive economic developments, with the growth forecast for the United Kingdom (UK) revised downwards for 2017. Emerging markets and developing economies in general are projected to see a sustainable pickup in activity, mainly due to a gradual improvement in commodity exporting countries amid slightly higher commodity prices, favourable business confidence levels and expectations of stronger Chinese growth. Despite a stabilisation in the general macroeconomic environment, vulnerabilities differed sharply across countries, particularly those of emerging markets that have persistent current account and budget deficits, lower commodity revenues and elevated levels of public and private sector debt. Such economies remain susceptible to sudden stops or reversals in capital inflows, should conditions deteriorate.
1 International Monetary Fund, World Economic Outlook, October 2017.
Emerging market and developing economies Sub-Saharan Africa region South AfricaSource: IMF
Percentage change
-3
0
3
6
9
Figure 1 Real GDP growth in emerging markets
2000 2002 2004 2006 2008 2010 2012 2014 2017
3Financial Stability Review second edition 2017
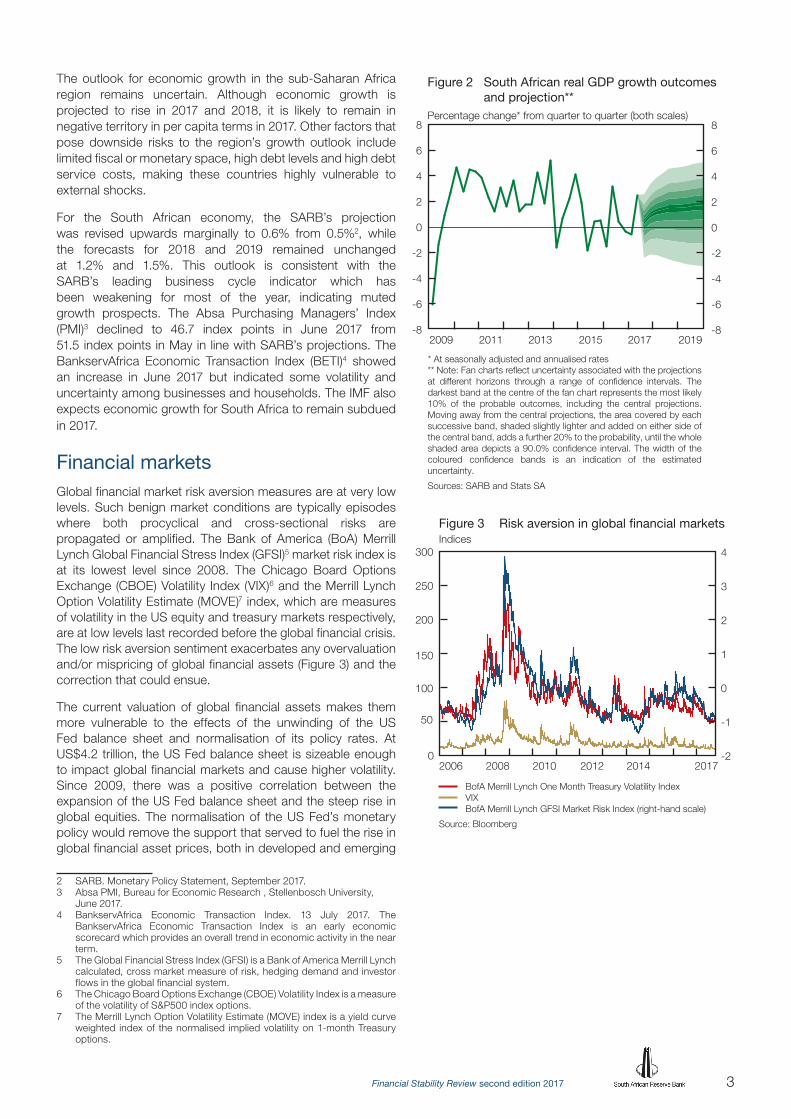
The outlook for economic growth in the sub-Saharan Africa region remains uncertain. Although economic growth is projected to rise in 2017 and 2018, it is likely to remain in negative territory in per capita terms in 2017. Other factors that pose downside risks to the region’s growth outlook include limited fiscal or monetary space, high debt levels and high debt service costs, making these countries highly vulnerable to external shocks.
For the South African economy, the SARB’s projection was revised upwards marginally to 0.6% from 0.5%2, while the forecasts for 2018 and 2019 remained unchanged at 1.2% and 1.5%. This outlook is consistent with the SARB’s leading business cycle indicator which has been weakening for most of the year, indicating muted growth prospects. The Absa Purchasing Managers’ Index (PMI)3 declined to 46.7 index points in June 2017 from 51.5 index points in May in line with SARB’s projections. The BankservAfrica Economic Transaction Index (BETI)4 showed an increase in June 2017 but indicated some volatility and uncertainty among businesses and households. The IMF also expects economic growth for South Africa to remain subdued in 2017.
Financial markets Global financial market risk aversion measures are at very low levels. Such benign market conditions are typically episodes where both procyclical and cross-sectional risks are propagated or amplified. The Bank of America (BoA) Merrill Lynch Global Financial Stress Index (GFSI)5 market risk index is at its lowest level since 2008. The Chicago Board Options Exchange (CBOE) Volatility Index (VIX)6 and the Merrill Lynch Option Volatility Estimate (MOVE)7 index, which are measures of volatility in the US equity and treasury markets respectively, are at low levels last recorded before the global financial crisis. The low risk aversion sentiment exacerbates any overvaluation and/or mispricing of global financial assets (Figure 3) and the correction that could ensue.
The current valuation of global financial assets makes them more vulnerable to the effects of the unwinding of the US Fed balance sheet and normalisation of its policy rates. At US$4.2 trillion, the US Fed balance sheet is sizeable enough to impact global financial markets and cause higher volatility. Since 2009, there was a positive correlation between the expansion of the US Fed balance sheet and the steep rise in global equities. The normalisation of the US Fed’s monetary policy would remove the support that served to fuel the rise in global financial asset prices, both in developed and emerging
2 SARB. Monetary Policy Statement, September 2017.3 Absa PMI, Bureau for Economic Research , Stellenbosch University,
June 2017.4 BankservAfrica Economic Transaction Index. 13 July 2017. The
BankservAfrica Economic Transaction Index is an early economic scorecard which provides an overall trend in economic activity in the near term.
5 The Global Financial Stress Index (GFSI) is a Bank of America Merrill Lynch calculated, cross market measure of risk, hedging demand and investor flows in the global financial system.
6 The Chicago Board Options Exchange (CBOE) Volatility Index is a measure of the volatility of S&P500 index options.
7 The Merrill Lynch Option Volatility Estimate (MOVE) index is a yield curve weighted index of the normalised implied volatility on 1-month Treasury options.
-8
-6
-4
-2
0
2
4
6
8
-8
-6
-4
-2
0
2
4
6
8
* At seasonally adjusted and annualised rates
Percentage change* from quarter to quarter (both scales)
Figure 2 South African real GDP growth outcomes and projection**
2009 2011 2013 2015 2017 2019
** Note: Fan charts reflect uncertainty associated with the projections at different horizons through a range of confidence intervals. The darkest band at the centre of the fan chart represents the most likely 10% of the probable outcomes, including the central projections. Moving away from the central projections, the area covered by each successive band, shaded slightly lighter and added on either side of the central band, adds a further 20% to the probability, until the whole shaded area depicts a 90.0% confidence interval. The width of the coloured confidence bands is an indication of the estimated uncertainty.
Sources: SARB and Stats SA
Indices
2006 2008 20172010 2012 2014
BofA Merrill Lynch One Month Treasury Volatility Index VIX BofA Merrill Lynch GFSI Market Risk Index (right-hand scale)
Source: Bloomberg
Figure 3 Risk aversion in global financial markets
0
50
100
150
200
250
300
-2
-1
0
1
2
3
4

Financial Stability Review second edition 20174
markets. Therefore, the pace, magnitude and timing of the Fed balance sheet unwinding is highly significant for global financial markets (Figure 4). Recently, however, the Federal Open Market Committee (FOMC)8 of the US Federal Reserve Board confirmed the gradual pace of reduction of its balance sheet and normalisation of its policy rate. This approach should limit the potential impact on developed and emerging markets.
Increases in global equity prices have been led by a leveraged US equity market (Figure 5), which is deemed to be overvalued according to the ‘price-to-earnings valuation’. The 10-year moving average price-to-earnings ratio for the Standard and Poor’s 500 index (S&P500) has outpaced that of its counterparts in developed and emerging markets (Figure 6). It increased from levels below 14 times earnings recorded in 2008 to around 26 times earnings during the third quarter of 2017. While the increase in the ratio could partly be accredited to a strong rebound in activity in the US economy and corporate profits since 2009, equity valuation measurements suggest that current valuations are above their long-term averages and seem to be overvalued. The 10-year moving average price-to-earnings ratio for the S&P500 has surpassed the pre-crisis peak of 2007, which ushered in the cyclical downswing. In addition, the UK and German equity markets are also trading at levels last seen in 2008 and above their respective long-term averages (calculated from 2006). Specifically, the reduced expectations of the positive impact of fiscal stimulus and greater infrastructure investment in the US might not have been priced in yet.
In South Africa, the JSE Limited (JSE) All Share Index (Alsi) price-earnings ratio has remained range-bound below 18 times earnings since 2011. Its increase during 2016 was similar to that of similar indices in the UK, US and Germany, despite low domestic economic growth (Figure 6).
Underpinning the seemingly overvalued global equity market is the leveraged buying of shares supported by the prevailing low interest rates, recovering economic growth and favourable financial market conditions in advanced economies. Possible triggers for a global equity market correction cannot be predicted with certainty. However, the close positive correlation between the New York Stock Exchange (NYSE) measure of margin debt9 and the US S&P500 indicates some reasons for concern. Rising from levels just below US$200 billion in 2009, the value of NYSE margin debt has increased to US$549 billion in August 2017.
In addition, the debt-to-EBITDA (earnings before interest, taxes, depreciation and amortisation) ratio of non-financial corporations listed on the S&P500 has increased significantly from low levels that were last recorded before the global financial crisis (Figure 7). Such increase in financial imbalances exposes global equity markets to the risk of a sudden rise in global interest rates or removal of quantitative easing by central banks. In this regard, the South African equity market could have been adversely affected by the spillover effects of a sudden normalisation of interest rates and improved growth
8 US Federal Reserve. FOMC statement, 20 September 2017.9 Margin debt reflects loans taken out with stocks or bonds as collateral and
is typically used to buy more financial assets hence it can be viewed as a relatively good gauge of just how bullish retail investors are.
US$ trillions Index
2007 2009 20172011 2013 2015
Mortgage-backed securities Treasuries Agencies Total Fed balance sheet S&P500 index (right-hand scale)
Source: Bloomberg
Figure 4 US Fed balance sheet
0
1
2
3
4
5
500
1 000
1 500
2 000
2 500
US$ billionsIndex
1999 2001 2003 2005 20172007 2009 2011 2013 2015
S&P500 index NYSE Margin Debt (right-hand scale)
Source: Bloomberg
Figure 5 Leveraged US stock market
500
1 000
1 500
2 000
2 500
3 000
100
200
300
400
500
600

5Financial Stability Review second edition 2017
prospects in advanced economies. Given the indications by advanced economies’ central banks that the reduction of balance sheets and normalisation of policy rates will be undertaken gradually, such potential affects might be limited.
The rebound in global economic growth contributed positively to the synchronous steady rise in the global Morgan Stanley Capital International (MSCI) price-to-book index, especially in 2016 to 2017 (Figure 8). Price-to-book ratios are often used by market participants to assess banks’ incentives to issue new capital and are also viewed as indicators of expected returns on a company’s equity. In theory, there are at least two reasons why companies could have a low price-to-book ratio: i) investors are unsure that a company’s net assets are valued correctly in their financial statements, or ii) the company has poor or highly uncertain future profit prospects. However, to the extent that the market is not correctly pricing for expected future profits, the global equity market could be deemed to be overvalued. Its continued rise could therefore be a signal of rising global financial stability risks.
The valuation for the S&P500 index has recently surpassed its 2007 peak and remains at 3 times the book value. The world price-to-book ratio is steadily increasing towards 2.5 times. By contrast, South Africa’s MSCI price-to-book ratio has been declining since 2015 and stabilised between 2.0 and 2.5 times in 2017.
Global high-yielding corporate bonds continue to outperform emerging markets and US sovereign bonds, particularly since the November 2016 US presidential elections. Since January 2016, high yielding corporate debt has increased by 26% compared to a 3.8% increase in the US sovereign bond index over the same period. In line with low levels of risk aversion, the emerging market corporate debt posted a 19.6% return, compared to 12% growth in the global investment-grade debt. Despite escalating global geopolitical risks over the past two years, demand for high-yielding financial securities has not declined significantly (Figure 9). These developments have raised concerns over the possible mispricing of risks by investors in the global fixed income markets.
The South Africa sovereign bond market has shown a disproportionate level of sensitivity to global risk factors and idiosyncratic political factors. For an example, following the British referendum vote to leave the European Union, South Africa’s composite sovereign debt index recorded a bigger decline relative to global bond indices (Figure 9). The risk therefore is that in the event of a sharp correction in the global bond market, the domestic bond market could be severely impacted. Monthly data from the Institute of International Finance (IIF) shows that South Africa recorded net capital outflows from its equity market since August 2015 to June 2017. The demand for domestic bonds according to the IIF was more volatile than that of equities. Following net purchases of US$846 million in July 2017, non-resident purchases of domestic bonds had declined to US$141 million in August 2017.
The worsening of political tensions between the US and North Korea could result in capital flight from emerging markets in search of safe haven assets. In this regard, the results could be much worse than the US$3 billion net capital outflows from South Africa which was recorded during November 2016 on the back of market uncertainty following the possible
Indices
2006 2008 20172010 2012 2014
JSE alsi 10-year moving average PE ratio S&P 500 10-year moving average PE ratio UK FTSE 10-year moving average PE ratio German DAX 10-year moving average PE ratio
Source: Bloomberg
Figure 6 Global price-earnings ratio
10
15
20
25
30
Ratio Index
2007 2009 20172011 2013 2015
Total debt-to-EBITDA of non-financial S&P500 companies S&P500 Non-financial corporations index (right-hand scale)
Source: Bloomberg
Figure 7 Leverage in the S&P500
1.8
2.0
2.2
2.4
2.6
2.8
3.0
3.2
250
400
550
700
850
Ratio
2006 2008 20172010 2012 2014
Europe South Africa Asia Pacific
Source: Bloomberg
Figure 8 Price to book ratios of MSCI global stock exchange indices
1.0
1.5
2.0
2.5
3.0
3.5
World Emerging markets S&P500 index

Financial Stability Review second edition 20176
implications of the US presidential elections (Figure 10). With a persistent current account and budget deficit, the risks of experiencing persistent capital outflows could be very challenging for South Africa.
Against the backdrop of projected weak economic growth for 2017, a resultant slower than expected government revenue could lead to an increase in the issuance of South African government bonds. In the October Medium Term Budget Policy Statement (MTBS), the projected government bonds issuance for 2017 was revised upward to about 15% of the fiscal deficit. Under such conditions, for the non-resident investor, the domestic bonds may still remain attractive as they are classified as high-yielding securities. However, from the financial stability perspective, there is a risk of a sudden stop in non-residents’ appetite for local bonds if South Africa were to be downgraded. In this regard, the country’s sovereign bonds would be excluded from the World Government Bond Index (WGBI). Consequently, all global bonds portfolios that are benchmarked against the WGBI could be forced to sell their holdings of South African government bonds.
Since the beginning of 2017, the credit default swap (CDS) spread of speculative-grade bonds remained range-bound between 310 and 350 basis points. While the CDS spread was above 500 basis points towards the end of 2016, owing to heightened geopolitical uncertainty, investors do not appear to be demanding a significantly high level of compensation for holding bonds amid the latest political tensions between the US and North Korea (Figure 11).
At current elevated global bond prices, a significant market correction, triggered by a period of sustained increases in global interest rates or the withdrawal of US quantitative easing could result in substantial losses in the global financial system. Most major central banks have not given strong signals about their commitments to a gradual approach to monetary policy normalisation. There are still some divergences between what financial markets expect central banks to do and what central banks communicate in this regard. Therefore, financial markets remain vulnerable to further market corrections should policy uncertainty continue. Given current valuations across a broad range of financial assets (including emerging market bonds and equities), such a period of uncertainty could imply more vulnerability during events of high-risk aversion – particularly in emerging markets with weak fundamentals. For South Africa especially, this may represent additional downside risks.
Index
20172016
Emerging market sovereign bond index US government bond index Global high-yield corporate bond index Global investment-grade corporate bond index South Africa sovereign bond index Emerging market corporate bond index
Source: Bloomberg
Figure 9 Global bond indices
95
100
105
110
115
120
125
130
US$ millions
2014 20172015 2016
South Africa non-resident purchases of equity South Africa non-resident purchases of bonds
Source: IIF
Figure 10 Non-resident net purchases of South African bonds and equities
-4 000
-3 000
-2 000
-1 000
0
1 000
2 000
3 000
Source: Bloomberg
260
310
360
410
460
510
560
610
Figure 11 Credit default swap spread of speculative-grade debt
2014 2015 2016 2017
Basis points

7Financial Stability Review second edition 2017
Financial institutions
Banks and bank lending conditions in South Africa
The five largest banks in South Africa continued to hold over 90% of the total assets in the banking sector, with both the Gini and Herfindahl-Hirshman concentration indices confirming the high level of concentration (Table 1). Annual growth in both total assets and gross loans and advances ranged between 0% and 4% from February to June 2017. From July 2017, annualised growth in gross loans and advances and total assets increased, specifically due to increases in the ‘term loans’ and ‘specialised lending’ categories.
The ratio of total impaired advances (commonly known as non-performing loans (NPLs)) as a percentage of total gross loans and advances remained stable at between 2.8% and 2.9% since February 2017. Growth in both committed and uncommitted undrawn facilities has declined since January 2016 (Figure 12). This could be an indication of borrowers increasing draw-downs on facilities as well as less or lower value facilities available to borrowers. The slight year-on-year increase in committed facilities granted in July 2017 was recorded by two large banks. Draw-downs on credit cards as a percentage of total exposure remained largely unchanged since January 2014, at around 55%. Draw-downs on overdraft facilities have increased from 27% in January 2014 to 29% in July 2017, indicating increased usage of readily available credit facilities.
Credit cards - drawn as % total Overdrafts - drawn as % total
Per cent
-20
-10
0
10
20
30
40
50
60
Figure 12 Growth in undrawn facilities and drawn facilities as a percentage of total loan value for credit cards and overdrafts
Growth in committed undrawn Growth in uncommitted undrawn
2015 2016 2017

Financial Stability Review second edition 20178
Table 1 Selected indicators of the South African banking sector*
Per cent, unless indicated otherwise
2017
Feb Mar Apr May Jun Jul
Market share (top five banks) .......................................... 90.71 90.28 90.27 90.31 90.12 90.00
Gini concentration index ................................................. 82.84 82.78 82.83 82.79 82.85 82.80
Herfindahl–Hirschman Index (H-index) ............................ 0.181 0.179 0.179 0.179 0.179 0.179
Banks’ share prices (year-on-year percentage change) .. 19.98 18.52 -6.03 1.90 23.96 11.20
Balance sheet
Total assets (R billions).................................................... 4909.5 4940.5 4917.1 4933.1 4946.6 5015.9
year-on-year percentage change ................................. 0.3 1.7 2.9 1.8 2.1 3.5
Total loans and advances (R billions) .............................. 3740.3 3783.3 3741.2 3762.2 3774.2 3805.6
year-on-year percentage change ................................. 0.4 1.7 2.7 2.3 2.1 4.2
Capital adequacy
Total capital-adequacy ratio ............................................ 15.9 16.1 16.0 16.0 16.5 16.4
Tier 1 capital-adequacy ratio .......................................... 12.9 13.0 13.0 13.1 13.5 13.5
Common equity Tier 1 capital-adequacy ratio ................ 12.6 12.6 12.6 12.7 13.0 13.0
Credit risk
Impaired advances (R billions)** ....................................... 106.1 107.6 108.2 109.2 109.4 108.6
Impaired advances to gross loans and advances ....................................................... 2.8 2.8 2.9 2.9 2.9 2.9
Specific credit impairments (R billions) ............................ 47.1 47.6 47.6 48.0 48.3 47.8
Specific credit impairments to impaired advances .......... 44.4 44.2 44.0 44.0 44.1 44.1Specific credit impairments to gross loans and advances
1.26 1.26 1.27 1.28 1.28 1.26
Profitability
Return on assets (smoothed).......................................... 1.33 1.34 1.34 1.34 1.32 1.33
Return on equity (smoothed) .......................................... 17.46 17.33 17.20 17.07 16.63 16.65
Interest margin to gross income (smoothed) ................... 57.44 57.50 57.29 57.13 57.38 57.34
Operating expenses to gross income (smoothed) ........... 55.21 55.25 55.28 55.25 55.62 55.61
Liquidity
Liquid assets to total assets (liquid-asset ratio) ............... 9.57 9.69 9.66 9.64 9.74 9.59
Liquid assets to short-term liabilities ............................... 18.74 19.02 19.18 19.15 19.21 19.03
Liquidity coverage ratio (LCR) ......................................... 108.74 113.19 117.13 118.20 124.41 120.10
* Data were updated on 15 September 2017. ** Impaired advances are advances in respect of which a bank has raised a specific impairment and includes any advance or
restructured credit exposures subject to amended terms, conditions or concessions that are not formalised in writing.
Sources: SARB. Data on share prices were obtained from the JSE Limited

9Financial Stability Review second edition 2017
Credit defaults continued to increase in the first half of 2017. Credit default ratios10 of retail asset classes have increased since January 2017 (Figure 13). Total banking sector credit exposure to public sector entities (PSEs) declined by 4.5% since December 2016, and constituted only 2.3% of total credit exposure in July 2017.
The ratio of exposures overdue for more than 90 days as a percentage of on-balance sheet exposures (the 90 days overdue ratio) reported by the five largest banks for most categories of loans dropped compared to December 2016 (Figure 14). However, the small and medium enterprise (SME) retail amounts in arrears indicated a marginal increase from December 2016.
There appears to be increased credit stress in retail loan categories reported by ‘other’ banks (that is, all banks excluding the five largest banks) (Figure 15). The ‘retail revolving’11 and ‘retail other’12 categories recorded the highest 90 days overdue ratios in the sector. These categories constituted 17.8% of total other banks’ on-balance sheet exposure and 1.8% of total banking sector on-balance sheet exposure. The 90 days overdue ratios for residential mortgages, SME retail and retail other categories increased since December 2016, with the 90 days overdue ratios for retail revolving assets declining since December. The 90 days overdue ratios for the corporate and SME corporate asset classes reported by other banks decreased from December 2016.
Profitability in the banking sector, as measured by the year-on-year return on equity (ROE) ratio, has decreased slightly in the first half of 2017, from 17.7% in January to 16.7% in July 2017 (Figure 16). Since June 2016, growth in operating income exceeded growth in operating expenses, but this trend reversed from June 2017. Profitability benefited from less credit losses being charged to the income statement since September 2016, as well as strong growth rates in net interest income that were recorded for the seven months to February 2017. The interest rate differential (or spread) between lending and deposit rates increased marginally between 2015 and 2016, but has dropped in 2017. The lower spread in 2017 was mainly due to an increase in interest expense paid on interbank deposits.
Cheque and demand deposits (up to 1 day) have increased by between 9% and 12% since December 2016 (Figure 17), which means a larger portion of deposits held by banks is of a shorter term and therefore of a more volatile nature. With the majority of assets being longer term, increased short-term deposits require more active liquidity risk management. The liquidity coverage ratio (LCR), a Basel III liquidity ratio designed to promote the short-term resilience of the liquidity risk profile of banks, increased from 88.6% in July 2015 to over 100% from July 2016 (Figure 18). The sector increased its stock of high quality liquid assets by 14.7% and decreased its expected net cash outflows over a 30-day period by almost 10% for the year to June 2017. The sectors’ LCR exceeded the minimum requirement during the period under review.
10 Credit default ratios are reported by banks using internal ratings-based approaches for measuring and reporting credit risk for regulatory purposes.
11 The retail revolving asset class includes all retail revolving credit facilities such as credit cards and overdraft facilities.
12 The retail other asset class includes all credit exposures other than residential mortgages, SME retail and retail revolving exposures. This category includes vehicle and asset finance, as well as unsecured lending.
Retail revolving credit Retail other Residential mortgage advances
Per cent
Figure 13 Credit default ratios for selected asset categories
SME corporate SME retail Corporate Public sector entities
2014 2015 2016 2017
0
1
2
3
4
5
6
7
Retail revolving credit Residential mortgage advances Retail other
Per cent
Figure 14 Exposures greater than 90 days as a percentage of total on-balance sheet exposure reported by five of the largest banks
SME corporate SME retail Corporate Public sector entities
2014 2015 2016 2017-1
0
1
2
3
4
5
6
7
8
9

Financial Stability Review second edition 201710
Media reports on the involvement of a major auditing firm, that audits many of South Africa’s banks, in allegations of state capture have put banks that contract the services of this firm into the spotlight. To address some of the concerns given the high levels of public interest, the SARB issued a statement in this regard. The SARB, from a supervisory perspective, has for many years required large banks to appoint joint auditors as this reduces independence-related risk. KPMG is the auditor to three of the four largest banks as well as to other banks and insurance companies. There is risk to financial stability emanating as a result of potential contagion from damage to an individual audit firm’s reputation leading to weakening public confidence in a bank or the banking sector. In the interest of financial stability, further market concentration in the auditing and auxiliary professional services sector should be avoided. However, there are policy considerations about the potential systemic effect of large auditing and professional services firms which need further reflection to further strengthen governance and transparency in the auditing and accounting profession.13
Stress testing the South African banking sector14
The SARB conducted a combined bottom-up (BU) and top-down (TD) common scenario stress-testing exercise during 2015/2016. The exercise assessed the vulnerability of the South African banking system to adverse economic developments and the results of the test were communicated in the first edition of the Financial Stability Review of 2016.
The stress-testing exercise was subjected to two peer reviews, by the Deutsche Bundesbank and the IMF, during October to December 2016 and January to March 2017 respectively, to validate the robustness of the procedures and future stress-testing exercises. In line with the SARB’s governance framework, full stress-testing exercises are conducted once every two years or as and when deemed necessary. The Deutsche Bundesbank conducted an on-site review while the IMF conducted a desk-top exercise followed by a technical review.
Based on the documentation that the SARB submitted to the IMF, the IMF embarked on a post peer-review visit to the SARB during July 2017. The visit’s objective was to assist in the implementation of some of the suggestions contained in the report, which were also in line with those of the Deutsche Bundesbank. The terms of reference of the visit included the designing of a liquidity stress-test framework and the carrying out of a stress test exercise from a TD perspective.
The SARB intends enhancing the stress-testing framework and model by:
(a) expanding the scope of the stress-testing exercise to include other risk types and non-domestic exposures;
13 Available online at: https://www.resbank.co.za/Lists/Speeches/Attach-ments/509/IFRS%209%20Workshop%20Opening%20Speech%20.pdf.
14 The SARB conducted a common scenario stress test to evaluate the soundness of the South African domestic banking sector during 2015/16. More information on this test can be found in the first edition 2016 Financial Stability Review, page 21.
Retail revolving credit (right-hand scale) Residential mortgage advances Retail other (right-hand scale)
Per cent
-20
-10
0
10
20
30
40
-1
0
1
2
3
4
5
6
Figure 15 Exposures greater than 90 days as a percentage of total on-balance sheet exposure reported by ‘other’ banks
SME corporate SME retail Corporate Public sector entities
2014 2015 2016 2017
Growth in operating expenses Growth in operating income ROE (right-hand scale)
Per cent
-15
-10
-5
0
5
10
15
20
25
0
3
6
9
12
15
Figure 16 Return on equity and growth in income and expenses for the banking sector
2015 2016 2017
0
200
400
600
800
1 000
1 200
1 400
1 600
1 800R billion Per cent
20162015 2017 Cheque Weighted average interest rate on call deposits (right-hand scale)
Demand deposits up to 1 day Weighted average interest rate on cheque deposits (right-hand scale)
Figure 17 Cheque and demand deposits up to 1 day
0
1
2
3
4
5
6
7

11Financial Stability Review second edition 2017
(b) reconsidering the dividend pay-out ratios assumptions;
(c) refining the reporting template for the BU exercise; and
(d) including ‘single factor’ sensitivity tests.
These refinements will be included in the SARB’s 2018/2019 stress-testing cycle.
Non-bank financial institutions
Shadow banking in South Africa
South Africa continues to participate in the annual shadow banking exercise.15 The share of financial assets held by other financial intermediaries (OFIs) in South Africa has increased consistently since the global financial crisis, and has continued to increase during the period under review. However, with 30% of financial intermediaries’ assets held by banks, banks still hold the largest share of assets.
In order to accurately measure shadow banking, activities that do not adhere to the financial stability definition should be removed from the OFI measure, while activities by pension funds and insurance companies that are related to credit intermediation or the facilitation of credit should be added. This narrowed definition is required in order to identify risks in the non-bank sector based on the economic function classification of the Financial Stability Board.16
Activities that are excluded from the shadow-banking measure include equity funds, real estate funds, equity, real-estate investment trusts (REITs), trust companies and banks’ investment in securitisation schemes. Shadow-banking entities or activities comprise money-market funds (MMFs), multi-asset funds, fixed-income funds, hedge funds, non-equity fund of funds, participation bond schemes, finance companies and securitisation schemes.
The largest portion of South Africa’s shadow-banking system is classified into Economic Function 1 (EF1) and is thus possibly subject to ‘run-risk’. However, it should be noted that this classification was performed without taking the new regulatory framework into account, in which new regulatory tools would be available to avoid such ‘runs’. Figure 20 shows that since the global financial crisis, EF1 has increased at a much faster pace than EF2-5. At a global level, assets under management of EF1-4 have decreased between 2008 and 2016 while assets under management of entities classified into EF1 have increased.
Interconnectedness among OFIs and banks is also relatively high in South Africa when compared to other jurisdictions. This entails banks in South Africa receiving a relatively larger portion of their funding from OFIs than banks in other countries that participated in the international annual shadow-banking monitoring exercise. While this is not a risk in itself, it could contribute to systemic risks.
15 http://www.fsb.org/2017/07/fsb-publishes-assessment-of-shadow-banking-activities-risks-and-the-adequacy-of-policy-tools/
16 SARB. Financial Stability Review September 2015: 15
Other 5 largest
Per cent
0
20
40
60
80
100
120
140
160
180
200
Figure 18 Liquidity coverage ratio
Total sector Minimum requirement
2015 2016 2017
Figure 19 Distribution of financial assets between financial intermediaries in South AfricaPer cent
SARB Insurance companies Public financial enterprises
0
5
10
15
20
25
30
35
40
45
Banks Pension funds Other Financial Intermediaries
2003 2005 2007 2009 2011 2013 2015 2017
Figure 20 South Africa's shadow-banking classification into economic functionsR trillions
Economic function 1
0
500
1 000
1 500
2 000
2008 2016 Economic functions 2–5
Financial Stability Review second edition 201712
On the global level, the Financial Stability Board has established that the aspects of shadow banking considered to have contributed to the global financial crisis have declined significantly, and generally no longer pose financial stability risks. Furthermore, the Financial Stability Board has not identified any new financial stability risks that could emanate from shadow-banking activities and which warrant additional regulatory action at present. However, since shadow banking evolves over time, the Financial Stability Board recommends that authorities continue to monitor vigilantly and address promptly any related emerging financial stability risks.
Pension and provident funds
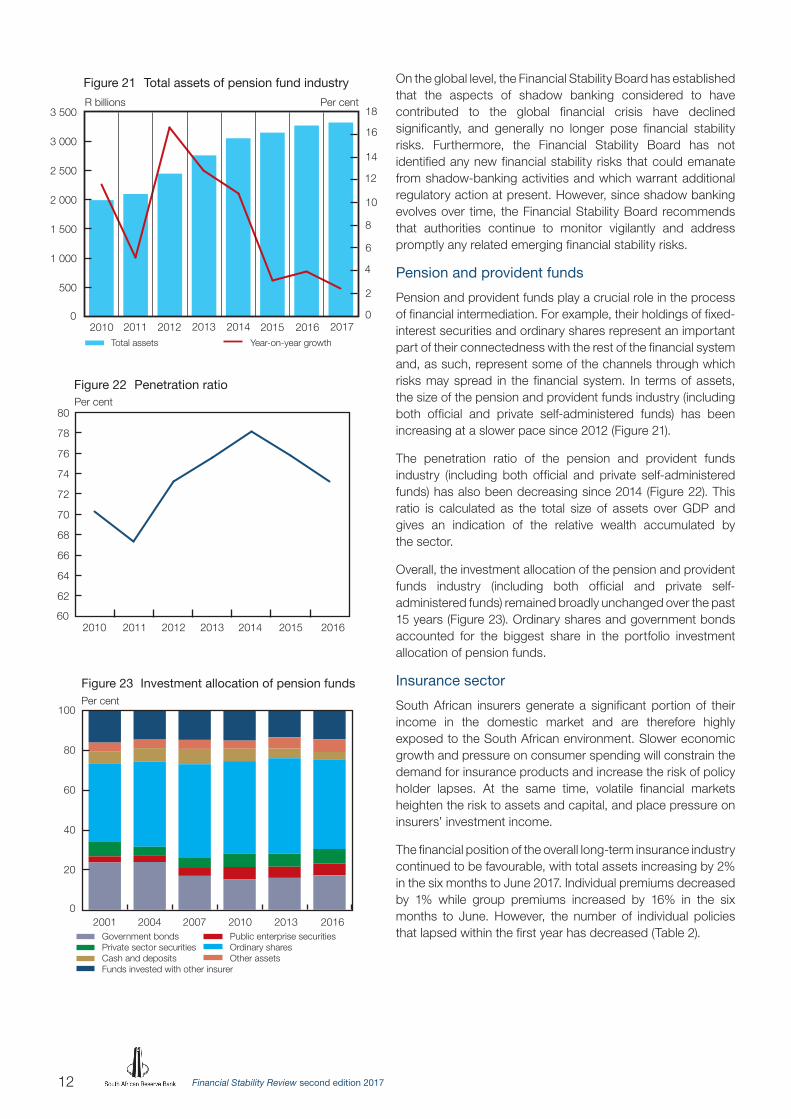
Pension and provident funds play a crucial role in the process of financial intermediation. For example, their holdings of fixed-interest securities and ordinary shares represent an important part of their connectedness with the rest of the financial system and, as such, represent some of the channels through which risks may spread in the financial system. In terms of assets, the size of the pension and provident funds industry (including both official and private self-administered funds) has been increasing at a slower pace since 2012 (Figure 21).
The penetration ratio of the pension and provident funds industry (including both official and private self-administered funds) has also been decreasing since 2014 (Figure 22). This ratio is calculated as the total size of assets over GDP and gives an indication of the relative wealth accumulated by the sector.
Overall, the investment allocation of the pension and provident funds industry (including both official and private self-administered funds) remained broadly unchanged over the past 15 years (Figure 23). Ordinary shares and government bonds accounted for the biggest share in the portfolio investment allocation of pension funds.
Insurance sector
South African insurers generate a significant portion of their income in the domestic market and are therefore highly exposed to the South African environment. Slower economic growth and pressure on consumer spending will constrain the demand for insurance products and increase the risk of policy holder lapses. At the same time, volatile financial markets heighten the risk to assets and capital, and place pressure on insurers’ investment income.
The financial position of the overall long-term insurance industry continued to be favourable, with total assets increasing by 2% in the six months to June 2017. Individual premiums decreased by 1% while group premiums increased by 16% in the six months to June. However, the number of individual policies that lapsed within the first year has decreased (Table 2).
Figure 21 Total assets of pension fund industry
Total assets Year-on-year growth
0
500
1 000
1 500
2 000
2 500
3 000
3 500
0
2
4
6
8
10
12
14
16
18
2010 2011
Per centR billions
2012 2013 2014 2015 2016 2017
2011 20122010 20142013 20162015
Per cent
60
62
64
66
68
70
72
74
76
78
80
Figure 22 Penetration ratio
Figure 23 Investment allocation of pension fundsPer cent
Government bonds Private sector securities Cash and deposits Funds invested with other insurer
0
20
40
60
80
100
20072001 2004 2010 2013 2016 Public enterprise securities Ordinary shares Other assets

13Financial Stability Review second edition 2017
Table 2 Number of individual policies that lapsed in the first year
Number of policies6 months
to June 2017
6 months to
Dec 2017
6-month change
12 months to
June 2017
12 months to
June 2016
12-month change
Risk business ....................... 802 463 983 968 -18% 1 786 431 2 040 542 -12%
Savings business ................. 51 467 66 410 -23% 117 877 102 012 16%
Retirement annuities ............. 2 393 2 266 6% 4 659 7 089 -34%
Credit life .............................. 201 937 313 257 -36% 515 194 1 142 402 -55%
Total lapses within first year 1 058 260 1 365 901 -23% 2 424 161 3 292 045 -26%
Source: ASISA
The long-term insurance industry remained adequately capitalised, although free assets decreased by 2% for the six months ended in June 2017. This period also showed an increase of 2% in total policy liabilities and a 4% increase in the capital adequacy ratio (CAR) (Table 3).
The profitability of the long-term insurers has been affected by the South African equity market’s subdued performance, which has reduced the sector’s investment returns (Figure 24). Lower returns reduce insurer profitability by reducing investment income on shareholder assets, and by limiting growth in assets under management, which also forms the basis for fee income earned on savings and investment business.
Long-term primary insurers maintained adequate capital buffers. Most long-term insurance companies were covered by a free assets-to-capital-adequacy requirement – also referred to as CAR cover – of 2-5 times. Any insurer with a CAR cover below 1 is investigated and corrective measures are taken by the Registrar of Long-term Insurance.
Non-financial institutionsBusiness confidence (Table 4) dropped markedly in the second quarter of 2017 as political uncertainty continued to depress business. All sub-indices declined, with the new vehicle dealers, manufacturing and retail traders’ subcomponents experiencing the largest declines. Although the South African economy managed to overcome the technical recession recorded in the first quarter of 2017, business confidence is expected to remain weak as economic growth is expected to remain subdued.
Per cent
20132012 2014 2015 2016Source: FSB
0
2
4
6
8
10
12
14
16
18
Figure 24 Investment yield of long-term typical insurers
Table 3 Liabilities, capital adequacy requirement and free assets
R million
Jun-17 Dec-16 Jun-16 6-month change
12-month change
Total assets .................................... 2 687 800 2 633 998 2 642 430 2% 2%
Less: Policy liabilities ..................... 2 350 200 2 297 645 2 309 168 2% 2%
Less: Other liabilities ....................... 115 589 113 079 113 206 2% 2%
Excess of assets over liabilities .... 222 010 223 274 220 056 -1% -1%
Capital adequacy requirement ........ 42 193 40 475 39 305 4% 7%
Free assets (excess after CAR) ..... 179 817 182 799 180 751 -2% 1%
Source: ASISA

Financial Stability Review second edition 201714
Measured over a period of 12 months (Table 5), profitability of the non-financial corporates moderated to 9.3% in the second quarter from 11.7% in the first quarter of 2017, as business activity continued to be constrained by subdued domestic demand and weak business confidence. Since non-financial corporates remain the main borrowers from financial institutions, weaknesses in these corporates could readily be transmitted to the financial sector.
The current weak domestic economic environment accompa-nied by low business and consumer confidence continued to weigh on non-financial corporates’ fixed investment and credit demand. Growth in gross fixed investment by the private sec-tor contracted in the second quarter by 3.4%, mainly due to contractions in transport equipment, residential buildings and non-residential buildings. Credit growth remained driven main-ly by general loans and advances and, albeit to a lesser extent, mortgage advances.
Table 4 Business confidence index*
Indices2016 2017
2nd qr 3rd qr 4th qr 1st qr 2nd qr
Business confidence index ......................................... 31.8 42.0 38.2 40.2 29.4
New vehicle dealers’ confidence ............................... 25.0 37.0 26.0 30.0 11.0
Retail traders’ confidence .......................................... 26.0 43.0 34.0 45.0 35.0
Wholesale traders’ confidence ................................... 47.0 56.0 53.0 56.0 49.0
Building contractors’ confidence ............................... 38.0 44.0 48.0 42.0 36.0
Manufacturers’ confidence ........................................ 23.0 30.0 30.0 28.0 16.0
* The business confidence index is measured on a scale of 0 to 100, where 0 indicates an ‘extreme lack of confidence’, 50 ‘neutral’ and 100 ‘extreme confidence’
Source: BER, Stellenbosch University
Table 5 Selected indicators for the non-financial corporate sector
Annual percentage change, unless indicated otherwise
2016 2017
2nd qr 3rd qr 4th qr 1st qr 2nd qr
Bank credit granted* ...................................................... 13.0 12.5 10.7 8.9 9.1
Gross fixed capital formation** ....................................... 3.0 -0.7 -1.6 0.0 -3.4
Credit as a percentage of GDP...................................... 47.8 49.4 50.1 52.0 51.8
Credit as a percentage of annualised profits*** ............... 213.6 233.3 239.0 251.0 213.2
Net operating surplus**** ................................................ 3.0 8.9 13.5 11.7 9.3
Deposits ........................................................................ 7.0 4.9 3.9 0.6 0.3
* Bank credit to the corporate sector includes instalment sale and leasing finance, mortgage advances, overdrafts, credit card debtors, and other loans and advances.
** At current prices (seasonally adjusted). *** Bank credit to the corporate sector and net operating surpluses of corporations were used as proxies for corporate debt and
corporate profits respectively.**** Gross operating surplus minus depreciation (seasonally adjusted rates).
15Financial Stability Review second edition 2017
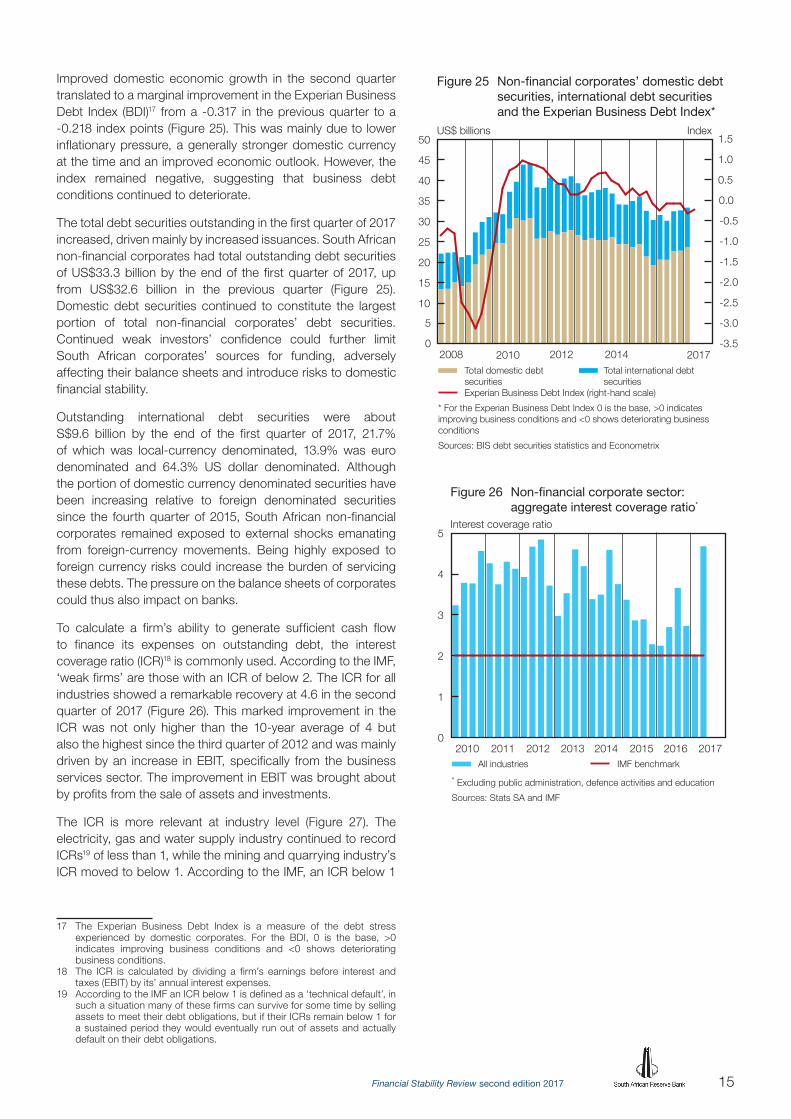
Improved domestic economic growth in the second quarter translated to a marginal improvement in the Experian Business Debt Index (BDI)17 from a -0.317 in the previous quarter to a -0.218 index points (Figure 25). This was mainly due to lower inflationary pressure, a generally stronger domestic currency at the time and an improved economic outlook. However, the index remained negative, suggesting that business debt conditions continued to deteriorate.
The total debt securities outstanding in the first quarter of 2017 increased, driven mainly by increased issuances. South African non-financial corporates had total outstanding debt securities of US$33.3 billion by the end of the first quarter of 2017, up from US$32.6 billion in the previous quarter (Figure 25). Domestic debt securities continued to constitute the largest portion of total non-financial corporates’ debt securities. Continued weak investors’ confidence could further limit South African corporates’ sources for funding, adversely affecting their balance sheets and introduce risks to domestic financial stability.
Outstanding international debt securities were about S$9.6 billion by the end of the first quarter of 2017, 21.7% of which was local-currency denominated, 13.9% was euro denominated and 64.3% US dollar denominated. Although the portion of domestic currency denominated securities have been increasing relative to foreign denominated securities since the fourth quarter of 2015, South African non-financial corporates remained exposed to external shocks emanating from foreign-currency movements. Being highly exposed to foreign currency risks could increase the burden of servicing these debts. The pressure on the balance sheets of corporates could thus also impact on banks.
To calculate a firm’s ability to generate sufficient cash flow to finance its expenses on outstanding debt, the interest coverage ratio (ICR)18 is commonly used. According to the IMF, ‘weak firms’ are those with an ICR of below 2. The ICR for all industries showed a remarkable recovery at 4.6 in the second quarter of 2017 (Figure 26). This marked improvement in the ICR was not only higher than the 10-year average of 4 but also the highest since the third quarter of 2012 and was mainly driven by an increase in EBIT, specifically from the business services sector. The improvement in EBIT was brought about by profits from the sale of assets and investments.
The ICR is more relevant at industry level (Figure 27). The electricity, gas and water supply industry continued to record ICRs19 of less than 1, while the mining and quarrying industry’s ICR moved to below 1. According to the IMF, an ICR below 1
17 The Experian Business Debt Index is a measure of the debt stress experienced by domestic corporates. For the BDI, 0 is the base, >0 indicates improving business conditions and <0 shows deteriorating business conditions.
18 The ICR is calculated by dividing a firm’s earnings before interest and taxes (EBIT) by its’ annual interest expenses.
19 According to the IMF an ICR below 1 is defined as a ‘technical default’, in such a situation many of these firms can survive for some time by selling assets to meet their debt obligations, but if their ICRs remain below 1 for a sustained period they would eventually run out of assets and actually default on their debt obligations.
US$ billions Index
Figure 25 Non-financial corporates’ domestic debt securities, international debt securities and the Experian Business Debt Index*
Total domestic debt securities Experian Business Debt Index (right-hand scale)* For the Experian Business Debt Index 0 is the base, >0 indicatesimproving business conditions and <0 shows deteriorating businessconditionsSources: BIS debt securities statistics and Econometrix
Total international debt securities
0
5
10
15
20
25
30
35
40
45
50
-3.5
-3.0
-2.5
-2.0
-1.5
-1.0
-0.5
0.0
0.5
1.0
1.5
2008 2010 2012 2014 2017
Interest coverage ratio
Figure 26 Non-financial corporate sector: aggregate interest coverage ratio*
All industries* Excluding public administration, defence activities and education Sources: Stats SA and IMF
IMF benchmark
0
1
2
3
4
5
2010 2011 2012 2013 2014 2015 2016 2017

Financial Stability Review second edition 201716
is defined as a ‘technical default’. At a level of below 1, firms can survive for some time by selling assets to meet their debt obligations, but if their ICRs remain below 1 for a sustained period they would eventually run out of assets and actually default on their debt obligations. Therefore, ICRs below 1 is an indication of heightened vulnerabilities in these industries. Except for the transport, storage and communication industry, all other industries recorded an ICR that was higher than 2.
According to National Treasury, SOEs20 debt is about R700 billion, which attracted interest of about R51 billion in the previous financial year. Most of these corporates would not be viable entities without government support. Government financial guarantees have continued to increase, but government’s overall guarantees to SOEs are expected to remain within the 10–11% of GDP range.21 However, SOEs continued to report weak financial results due to operational inefficiencies, weak corporate governance structures and poor procurement practices.
The financial condition of South African SOEs deteriorated markedly over time, which could lead to SOEs defaulting on their debt obligations and which could not only adversely affect government finances, but also other financial institutions exposed to these enterprises (Figure 28).
The expected default frequency (EDF) measures the probability that a firm will default within a given time horizon (in this case, within a year) by failing to make an interest or principal payment. The EDF assesses a firm’s ability to service its debt by calculating its probability of default based on the values of the firm’s assets and liabilities. The measure is forward-looking as it uses market-based variables, including equity prices, equity volatilities and default barriers. About 77% of South African corporates have EDFs below 3% (Figure 29). Of the 190 South African companies included in the portfolio, 147 have an EDF of 3% or less and 43 (22%) have EDFs of 3% and higher. The debt rating of domestic non-corporates was Caa1 (based on the correlation between implied ratings by S&P and the EDF credit measures) indicating the high credit risk profile of non-financial corporates. About 70% of South African corporates have a debt rating of B and above, indicating that they have adequate capacity to meet their financial commitments. About 30% of South African corporates can be classified as ‘vulnerable’ with a debt rating of CaaC. These institutions’ ability to meet their credit commitments is highly dependent on improved business and economic conditions. Only five South African non-financial corporates have extremely strong capacities to meet their financial commitments with a debt rating of Aaa.
HouseholdsWith poverty in South Africa currently on the increase as the current economic climate and high unemployment continue to weigh in on households’ finances22, household indebtedness
20 As reported by the Minister of Finance in Parliament, June 2017.21 Moody’s Sovereign Monitor Report. Focus on South Africa, September 2017.22 Statistics South Africa report, “Poverty trends in South Africa:
An examination of absolute poverty between 2006 and 2015”, 22 August 2017.
2016 Q2 2016 Q3 2016 Q4
* Excluding public administration, defence activitiesand education.
Sources: Stats SA and IMF
Mining and quarrying
Electricity, gas andwater supply
Transport, storageand communication
Business services
Construction
Manufacturing
Trade
Personal services
0 2 4 6 8 10 12
Figure 27 Non-financial corporate sector*: sectoral interest coverage ratio
2017 Q1 2017 Q2 IMF benchmarks
Interest coverage ratio
Figure 28 Non-financial corporate sector: State Owned Enterprises’ interest coverage ratio*
ICR* Calculated from a combination of selected State Owned Enterprisesbalance sheets.Sources: Bloomberg and IMF
IMF benchmark
0
1
2
3
4
5
6
2005 2007 2009 2011 2013 2016

17Financial Stability Review second edition 2017
remains a concern for financial stability. Highly indebted households are more vulnerable to the current economic environment and therefore, are more likely to default on debt obligations. This could cause distress on both lenders and borrowers.
Household’s balance sheets continued to deteriorate in the second quarter of 2017. Also, growth in disposable income moderated further (Table 6), which corresponds with the BankservAfrica Disposable Salary Index, indicated a moderation in disposable income. According the this index, ‘take-home pay’ moderated from 7.6% in the first quarter to 6.7% year on year in the second quarter of 2017.23 In real terms, however, ‘take-home pay’ did slightly improve over this period because of lower inflation. Consumption expenditure growth also improved, from 0.7% to 1.6% year on year in the second quarter. However, consumer expenditure is still expected to remain subdued amid a weak labour market and weak economic conditions.
Saving by households remained positive in 2017. Growth in the net wealth of households (as measured by growth in total assets) slowed in the first quarter to 3.4% year on year from 4.2% in the previous quarter. According to the Momentum South African Household Wealth Index,24 this was due to the
23 BankservAfrica Disposable Salary Index, July 201724 Momentum and Unisa, Summary South African Household Wealth Index,
Q3 2016.
Table 6 Selected indicators for the household sector
Annual percentage change, unless indicated otherwise
2016 2017
2nd qr 3rd qr 4th qr 1st qr 2nd qr
Disposable income ....................................................... 8.0 7.6 7.3 7.3 6.5
Financial assets ............................................................ 5.0 6.3 4.5 3.6 2.7
Total assets .................................................................. 5.6 6.4 4.8 4.2 3.4
Net wealth* ................................................................... 5.8 7.0 5.0 4.3 3.4
Consumption expenditure ............................................ 0.9 0.8 1.0 0.7 1.6
Consumption expenditure to GDP ............................... 59.2 59.4 59.3 59.8 59.2
Capital gearing** ........................................................... 16.3 16.3 16.4 16.2 16.3
Credit extension ........................................................... 2.1 1.2 0.7 0.7 2.9
Mortgage advances extended to households ............... 4.2 3.5 2.9 2.9 3.0
Mortgage debt as percentage of household disposable income ...................................................... 36.7 36.5 35.9 35.8 35.6
Savings as a percentage of disposable income ........... -0.2 -0.2 0.2 0.3 0.2
Debt as a percentage of disposable income ................. 74.8 73.9 73.1 73.0 72.6
Debt as a percentage of GDP ...................................... 44.2 43.8 43.4 43.8 43.1
Debt-service cost of household debt ........................... 13.1 10.4 8.1 4.5 3.3
Debt-service cost as a percentage of disposable income ...................................................... 9.7 9.6 9.4 9.4 9.4
Debt ............................................................................. 4.4 3.6 3.4 3.9 3.4
FNB Household Debt-Service Risk Index ..................... 5.23 5.19 5.20 5.24 n/a
* Household net wealth is defined as total assets of households less total financial liabilities** Capital gearing’ refers to household debt as a percentage of total assets of households. Data are preliminary
Sources: SARB and FNB
Expected default frequency(Percentage of population)
Implied rating (Percentage of population)
0% - 0.01% 0.01% - 0.03% 0.03% - 0.1% 0.1% - 0.3%
Source: Moody’s Analytics
Aaa-Aa Baa B
Figure 29 Non-financial corporate sector: EDF distribution of South African incorporated firms
A Ba Caa-C
0.3% - 1% 1% - 3% 3% - 10% 10% - 30% 30% - 50%

Financial Stability Review second edition 201718
current weak economic environment. Moreover, the majority of households are still not saving sufficiently for retirement. As a result, households’ financial assets increased only moderately in the second quarter compared with the first quarter. Therefore, with a deceleration in disposable income in the second quarter, higher unemployment and heightened economic uncertainty, households struggled to adjust financially.
Growth in credit extended to households picked up in the second quarter to 2.9% year on year from 0.7% in the previous quarter (Table 6). According to the National Credit Regulator, the loan rejection rate was 49.7% in the first quarter of 2017, down from 52.4% in the fourth quarter of 2016 but the First National Bank (FNB) Household Debt-Service Risk Index25 remained unchanged. Households remained financially vulnerable, as the index also indicates that households remained in the ‘high risk’ range. Also, the average spread between the average interest rates paid by households26 and the prime rate has increased, contributing to the financial pressure on households.
The FNB/BER Consumer Confidence Index (CCI) remained below its eight-year average of -0.4 index points. After some recovery in the first quarter of 2017, it fell in the second quarter to -9 index points from -5 index points in the previous quarter (Figure 31). In the first quarter of 2017, consumers still expected the economy to perform better in the following 12 months. However, consumers have since reversed their view on the prospects for the economy following downgrades of South Africa’s sovereign credit rating by key ratings agencies during the end of the first quarter.
In line with the CCI, MBD Credit Solutions/Bureau of Market Research (MBD/BMR) Consumer Financial Vulnerability Index (CFVI) declined to 48.40 index points in the second quarter of 2017 from 52.32 index points in the first quarter (Figure 31). The CFVI was below its eight-year average of 51.4 index points, entering its ‘very exposed’ category which is between 40 and 49.9 index points. For the first time since its inception, the CFVI’s four sub-components were classified as ‘very exposed’. The expenditure vulnerability score experienced the largest decline of 4.66 index points, followed by the income and debt servicing vulnerability score respectively. Generally, consumers feel very vulnerable being uncertain about their income and believe that they cannot purchase what they used to buy. Moreover, they find it difficult to service their debt and are unable to save sufficiently for retirement and other goals.
Residential real estateThe mortgage instalment-to-rent and price-to-rent ratios (Figure 32) indicate the affordability and profitability of owning residential property in South Africa. Both these indicators have been decreasing since the second quarter of 2016, indicating
25 An index can vary between 1 and 10. 1–3.4 means ‘low risk’, 3.5–5.4 means ‘medium risk’ and 5.5–10 means ‘high risk’.
26 This is calculated by taking the financing cost of household debt and dividing it by total household debt.
-50
0
50
100
150
200
250
300
5
6
8
9
11
12
14
15
17
19Basis points Per cent
Figure 30 Spread between average household interest rates and prime rate
Spread between average household borrowing interest rates and prime rate Average interest rate on current household debt (right-hand scale) Prime rate (right-hand scale) Debt-service cost to disposable income (right-hand scale)
20102009 2011 2012 2013 2014 2015 20172016
Consumer Financial Vulnerability Index (CFVI) Consumer Confidence Index (CCI) Average CFVI since 2009 Average CCI since 2009
Indices
Figure 31 Consumer Financial Vulnerability Index*
and the Consumer Confidence Index**
2009 2011 2013 2015 2017
* A rating of 0-20 means ‘financially very vulnerable’, 20-39,9 ‘financially vulnerable’, 40-49,9 ‘financially very exposed’, 50-59,9 ‘financially mildly exposed’, 60-79,9 ‘financially secure’ and 80-100 ‘financially very secure’.** The consumer confidence index is expressed as a net balance between optimistic and pessimistic consumers. According to the Bureau for Economic Research (BER) at the University of Stellenbosch, the index can vary between -100 for ‘extreme pessimism’ and 100 for ‘extreme optimism’, with 0 being ‘neutral’.Sources: MBD Credit Solutions and Bureau of Market Research, Unisa; FNB/ BER, Stellenbosch University
-20
-10
0
10
20
30
40
50
60

19Financial Stability Review second edition 2017
that households prefer to rent rather than buy, also reflected in the record low confidence levels.
The FNB/BER Building Confidence Index27, which increased in the first quarter of 2017, again fell in the second quarter of 2017. Moreover, all of the sub-subsectors measured with this index registered a drop in confidence. This has only happened in five other instances since the index was first compiled in 1997. The current level of the index indicates that close to 70% of respondents are dissatisfied with prevailing business conditions.
Government financesGovernment debt continued its general upward trend, with total gross loan debt increasing to R2 309 billion in June 2017 (Figure 33). Gross loan debt is expected to increase from R2.5 trillion or 54.2% of GDP in 2017/18 to R3.4 trillion or 59.7% of GDP in 2020/21. Of this debt, about 91% is domestic and about 9% is foreign denominated. The containment of public debt and the narrowing of the budget deficit remains a focus area for government; the latter is forecast to increase from 3.3% of GDP in 2016/17 to 4.3% in 2017/18, before stabilising at 3.9% thereafter. However, this would require a fine balance between maintaining government’s spending commitments (which have been exacerbated by the substantial revenue under-collection in 2016/17) and ensuring the long-term health of government finances, especially given its commitments to SOEs.
Fiscal consolidation continues to face mounting obstacles as the shortfall in tax revenues for the 2017/18 fiscal year is currently projected to be R50.8 billion. The shortfall is the result of a broad-based underperformance in tax collections for the year, with personal income tax and value added tax (VAT) alone contributing an estimated R32.2 billion to the projected shortfall. Despite a moderate recovery in global economic activity, South African trade-related tax revenue remains subdued, while poor domestic growth prospects are likely to weigh further on personal income tax and corporate taxes. The revenue shortfall will outweigh the initially budgeted contingency reserve of R6 billion for the 2017/18 fiscal year, while contingency reserves for the next three fiscal years have been pared down in order to offset projected shortfalls and reduce borrowing.
Government finances and contingent liabilities of SOEs
The contingent liabilities of government are becoming more of a concern as SOEs either fail to raise new capital in the market or fail to roll over existing debt. As can be seen in Figure 34, besides the provisioning that was made for independent power providers (IPPs) from 2014/15, the total amount of guarantees made available by government has not increased significantly over the past four fiscal years, but the actual exposure of government has increased substantially from about 45% in the 2013/14 fiscal year to 65% in 2016/17. The majority of this
27 The FNB Building Confidence Index measures the business confidence of all the major role players and suppliers involved in the building industry such as architects.
85
90
95
100
105
110
115
120
Mortgage instalment-to-rent ratio Price-to-rent ratio (right-hand scale)
* A ratio of 6-15: more affordable to buy, 16-25: renting less expensive but buying might be better, 26-35: more affordable to rent.
Sources: FNB, StatSA and SARB
Index: 2012 = 100 Ratio
13.8
14.0
14.2
14.4
14.6
14.8
15.0
15.2
Figure 32 Mortgage-instalment-to-rent and price-to-rent* ratios
2012 2013 2014 2015 20172016
0
500
1 000
1 500
2 000
2 500
0
10
20
30
40
50
60Percentage of GDP R billions
Figure 33 Loan debt of national government
Total gross loan debt as a percentage of GDP Total outstanding domestic debt (right-hand scale) Total foreign debt (right-hand scale)
2000 2003 2006 2009 2012 2015 2017
0
100
200
300
400
500
FY16/17FY15/16FY14/15FY13/14
Figure 34 Guarantees for State Owned Enterprises: Available facilities and actual usageR billions
Actual Exposure
Source: National Treasury
Guarantees available
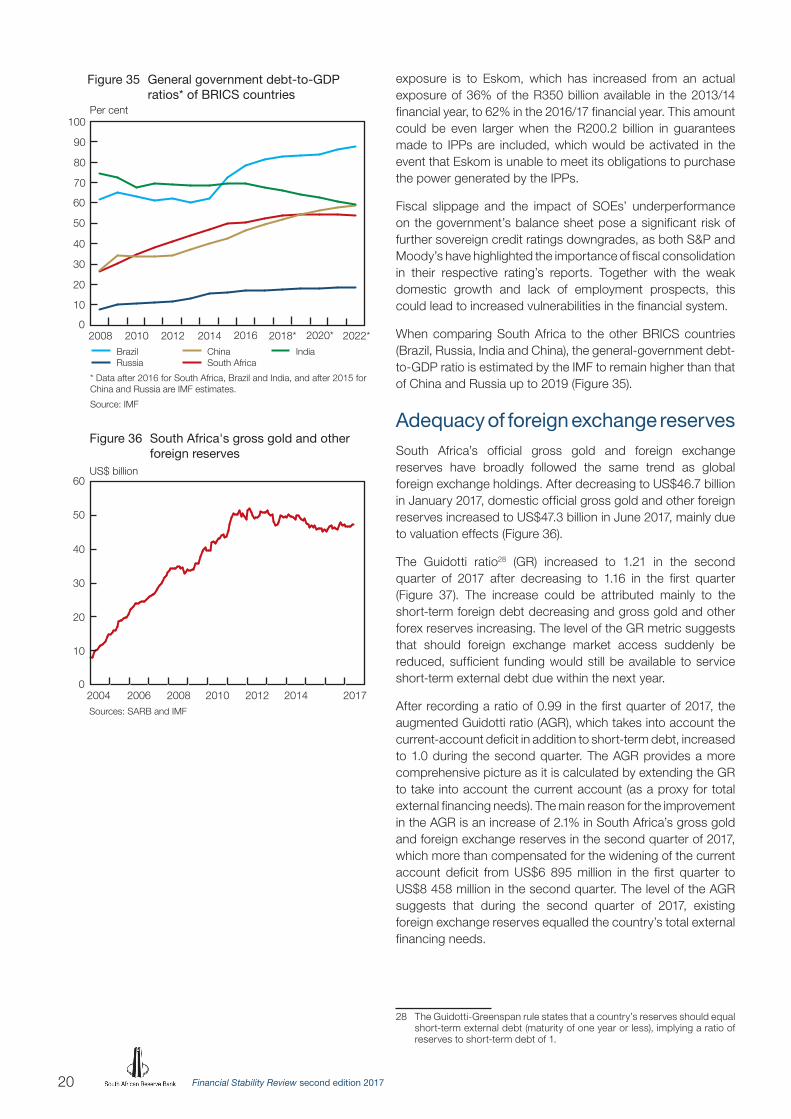
Financial Stability Review second edition 201720
exposure is to Eskom, which has increased from an actual exposure of 36% of the R350 billion available in the 2013/14 financial year, to 62% in the 2016/17 financial year. This amount could be even larger when the R200.2 billion in guarantees made to IPPs are included, which would be activated in the event that Eskom is unable to meet its obligations to purchase the power generated by the IPPs.
Fiscal slippage and the impact of SOEs’ underperformance on the government’s balance sheet pose a significant risk of further sovereign credit ratings downgrades, as both S&P and Moody’s have highlighted the importance of fiscal consolidation in their respective rating’s reports. Together with the weak domestic growth and lack of employment prospects, this could lead to increased vulnerabilities in the financial system.
When comparing South Africa to the other BRICS countries (Brazil, Russia, India and China), the general-government debt-to-GDP ratio is estimated by the IMF to remain higher than that of China and Russia up to 2019 (Figure 35).
Adequacy of foreign exchange reservesSouth Africa’s official gross gold and foreign exchange reserves have broadly followed the same trend as global foreign exchange holdings. After decreasing to US$46.7 billion in January 2017, domestic official gross gold and other foreign reserves increased to US$47.3 billion in June 2017, mainly due to valuation effects (Figure 36).
The Guidotti ratio28 (GR) increased to 1.21 in the second quarter of 2017 after decreasing to 1.16 in the first quarter (Figure 37). The increase could be attributed mainly to the short-term foreign debt decreasing and gross gold and other forex reserves increasing. The level of the GR metric suggests that should foreign exchange market access suddenly be reduced, sufficient funding would still be available to service short-term external debt due within the next year.
After recording a ratio of 0.99 in the first quarter of 2017, the augmented Guidotti ratio (AGR), which takes into account the current-account deficit in addition to short-term debt, increased to 1.0 during the second quarter. The AGR provides a more comprehensive picture as it is calculated by extending the GR to take into account the current account (as a proxy for total external financing needs). The main reason for the improvement in the AGR is an increase of 2.1% in South Africa’s gross gold and foreign exchange reserves in the second quarter of 2017, which more than compensated for the widening of the current account deficit from US$6 895 million in the first quarter to US$8 458 million in the second quarter. The level of the AGR suggests that during the second quarter of 2017, existing foreign exchange reserves equalled the country’s total external financing needs.
28 The Guidotti-Greenspan rule states that a country’s reserves should equal short-term external debt (maturity of one year or less), implying a ratio of reserves to short-term debt of 1.
Brazil Russia
* Data after 2016 for South Africa, Brazil and India, and after 2015 forChina and Russia are IMF estimates.
Source: IMF
Per cent
0
10
20
30
40
50
60
70
80
90
100
Figure 35 General government debt-to-GDP ratios* of BRICS countries
2008 2014 2016 2018* 2020*2010 2012 China South Africa
India
2022*
Sources: SARB and IMF
US$ billion
0
10
20
30
40
50
60
Figure 36 South Africa's gross gold and other foreign reserves
2004 2006 2008 2010 2012 2014 2017

21Financial Stability Review second edition 2017
The import cover ratio, which is a more traditional measure of reserve adequacy and a simple way of scaling the level of reserves by the size and openness of the economy29, decreased to 4.9 months in the second quarter of 2017 from 5.0 months in the first quarter. This remains above the 3 month general rule-of-thumb requirement and can be interpreted as South Africa being able to sustain its 4.9 months level of imports should all other inflows and outflows terminate. The international-reserves-to-broad-money-supply30 (M2) ratio, which provides a measure of the potential for resident-based capital flight from the currency31, decreased to 24.03% at the end of June 2017. The IMF regards this level as not quite adequate due to South Africa’s high short-term external financing requirements.32
Attention could shift back to foreign reserve holdings as a stabilising mechanism should the global economic outlook deteriorate. A high level of gross external financing needs might make South Africa vulnerable to market volatility as reserves are important for maintaining liquidity, allowing time to absorb shocks and provide confidence in the discharge of external obligations.
29 International Monetary Fund, Debt- and Reserve-Related Indicators of External Vulnerability, March 2000.
30 Broad money supply refers to M1 plus other short-term and medium-term deposits held by the domestic private sector.
31 International Monetary Fund, Debt- and Reserve-Related Indicators of External Vulnerability, March 2000.
32 International Monetary Fund, Global Financial Stability Report, April 2016.
Guidotti ratio Augmented Guidotti ratio Threshold (Guidotti–Greenspan rule of a ratio of reserves to short-term debt of 1)
Sources: SARB and IMF
Ratios
0.0
0.2
0.4
0.6
0.8
1.0
1.2
1.4
1.6
1.8
Figure 37 Reserve adequacy for South Africa
2009 2011 2013 2015 2017

Financial Stability Review second edition 201722
Financial stability risks and outlook
This section reviews the developments in both domestic and international financial infrastructure as well as the regulatory environment.
Update on financial stability risksThe SARB regularly assesses the risks to financial stability in the following 12 months, with a view to identifying and mitigating risks and vulnerabilities in the domestic financial system. A number of key scenarios regarding potential threats to financial stability are identified. These potential threats to financial stability are identified and rated according to the likelihood of their occurrence as well as their expected impact on the domestic financial system. The risks identified are classified as ‘high’, ‘medium’ or ‘low’ in terms of likelihood of the risk occurring, and as ‘high’ or ‘moderate’ in terms of their possible impact on financial stability.
Table 7 Risk assessment matrix
Risk and probability Expected impact on financial stability
Deteriorating domestic fiscal position
High High
Deteriorating domestic fiscal position resulting from lower-than-expected revenue collection and the rising contingent liabilities of state-owned enterprises, compounded by the underlying weakness and subdued outlook for the domestic economy, against the backdrop of political and policy uncertainty.
Further sovereign credit rating downgrades, resulting in capital outflows or a possible sudden-stop scenario, higher cost of and reduced access to funding with spillovers to the banking sector (increasing impairments and reduced profitability and confidence). Institutional investors unwinding positions according to their mandates.
Deteriorating geopolitical events
High High
Global geopolitical events (e.g. North Korea, the Gulf states and Brexit).
A rally to safe haven assets. Tensions and the severing of diplomatic, economic and security relations between authorities in the Gulf triggers a sharp increase in oil prices and a fall in related equity prices. Outcomes of the negotiations between the UK and EU on Brexit highly uncertain in a difficult political context. Unexpected developments could trigger market movements and affect financial stability in the UK and euro area.
Exuberance in global financial markets
Medium Moderate
Exuberance in equity and debt markets, especially in the US and EMEs, with low long-term interest rates and market volatility measures at historic lows, combined with high and growing corporate debt.
Financial system becomes more vulnerable to sharp corrections should earnings and credit performance projections change abruptly. Weaker confidence, higher financial market volatility and/or asset price losses (exchange rates, bond yields and equities).
China’s rising debt levels
Medium Moderate
China’s rising corporate, government and shadow-banking debt could lead to riskier credit conditions and dampen global GDP growth. Shadow-banking activities might be larger than estimated. Interconnectedness with official financial sector through wealth management products.
Weaker sentiment, abrupt deleveraging, higher non-performing loans, slower Chinese and global GDP growth, higher volatility and asset price losses, and lower commodity prices.
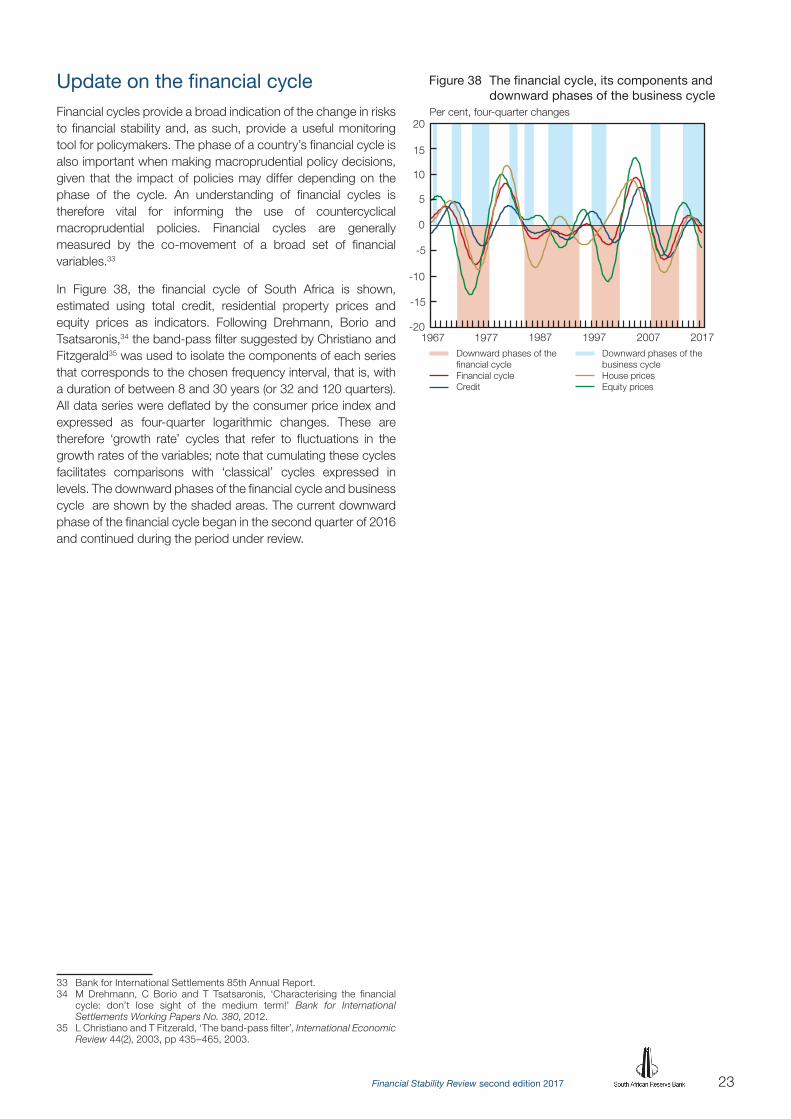
23Financial Stability Review second edition 2017
Update on the financial cycle Financial cycles provide a broad indication of the change in risks to financial stability and, as such, provide a useful monitoring tool for policymakers. The phase of a country’s financial cycle is also important when making macroprudential policy decisions, given that the impact of policies may differ depending on the phase of the cycle. An understanding of financial cycles is therefore vital for informing the use of countercyclical macroprudential policies. Financial cycles are generally measured by the co-movement of a broad set of financial variables.33
In Figure 38, the financial cycle of South Africa is shown, estimated using total credit, residential property prices and equity prices as indicators. Following Drehmann, Borio and Tsatsaronis,34 the band-pass filter suggested by Christiano and Fitzgerald35 was used to isolate the components of each series that corresponds to the chosen frequency interval, that is, with a duration of between 8 and 30 years (or 32 and 120 quarters). All data series were deflated by the consumer price index and expressed as four-quarter logarithmic changes. These are therefore ‘growth rate’ cycles that refer to fluctuations in the growth rates of the variables; note that cumulating these cycles facilitates comparisons with ‘classical’ cycles expressed in levels. The downward phases of the financial cycle and business cycle are shown by the shaded areas. The current downward phase of the financial cycle began in the second quarter of 2016 and continued during the period under review.
33 Bank for International Settlements 85th Annual Report.34 M Drehmann, C Borio and T Tsatsaronis, ‘Characterising the financial
cycle: don’t lose sight of the medium term!’ Bank for International Settlements Working Papers No. 380, 2012.
35 L Christiano and T Fitzerald, ‘The band-pass filter’, International Economic Review 44(2), 2003, pp 435–465, 2003.
Per cent, four-quarter changes
-20
-15
-10
-5
0
5
10
15
20
Figure 38 The financial cycle, its components and downward phases of the business cycle
1967 19971977 1987 2007 2017 Downward phases of the financial cycle Financial cycle Credit
Downward phases of the business cycle House prices Equity prices
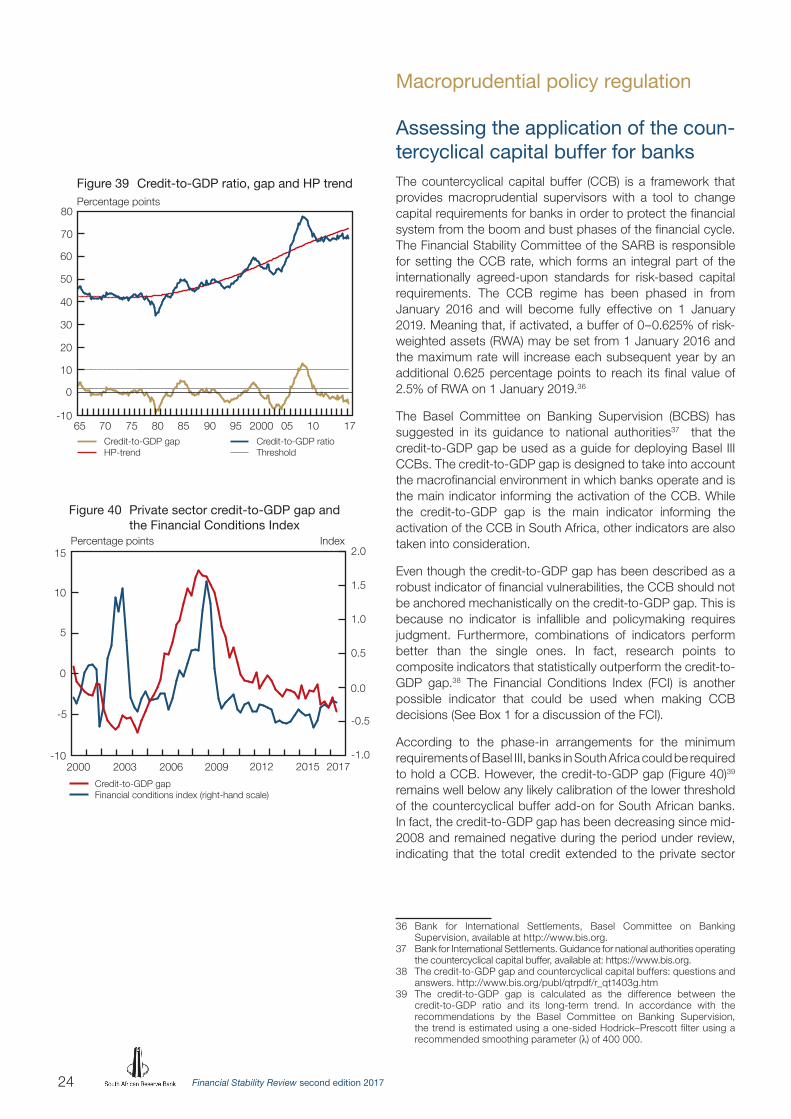
Financial Stability Review second edition 201724
Macroprudential policy regulation
Assessing the application of the coun-tercyclical capital buffer for banksThe countercyclical capital buffer (CCB) is a framework that provides macroprudential supervisors with a tool to change capital requirements for banks in order to protect the financial system from the boom and bust phases of the financial cycle. The Financial Stability Committee of the SARB is responsible for setting the CCB rate, which forms an integral part of the internationally agreed-upon standards for risk-based capital requirements. The CCB regime has been phased in from January 2016 and will become fully effective on 1 January 2019. Meaning that, if activated, a buffer of 0–0.625% of risk-weighted assets (RWA) may be set from 1 January 2016 and the maximum rate will increase each subsequent year by an additional 0.625 percentage points to reach its final value of 2.5% of RWA on 1 January 2019.36
The Basel Committee on Banking Supervision (BCBS) has suggested in its guidance to national authorities37 that the credit-to-GDP gap be used as a guide for deploying Basel III CCBs. The credit-to-GDP gap is designed to take into account the macrofinancial environment in which banks operate and is the main indicator informing the activation of the CCB. While the credit-to-GDP gap is the main indicator informing the activation of the CCB in South Africa, other indicators are also taken into consideration.
Even though the credit-to-GDP gap has been described as a robust indicator of financial vulnerabilities, the CCB should not be anchored mechanistically on the credit-to-GDP gap. This is because no indicator is infallible and policymaking requires judgment. Furthermore, combinations of indicators perform better than the single ones. In fact, research points to composite indicators that statistically outperform the credit-to-GDP gap.38 The Financial Conditions Index (FCI) is another possible indicator that could be used when making CCB decisions (See Box 1 for a discussion of the FCI).
According to the phase-in arrangements for the minimum requirements of Basel III, banks in South Africa could be required to hold a CCB. However, the credit-to-GDP gap (Figure 40)39 remains well below any likely calibration of the lower threshold of the countercyclical buffer add-on for South African banks. In fact, the credit-to-GDP gap has been decreasing since mid-2008 and remained negative during the period under review, indicating that the total credit extended to the private sector
36 Bank for International Settlements, Basel Committee on Banking Supervision, available at http://www.bis.org.
37 Bank for International Settlements. Guidance for national authorities operating the countercyclical capital buffer, available at: https://www.bis.org.
38 The credit-to-GDP gap and countercyclical capital buffers: questions and answers. http://www.bis.org/publ/qtrpdf/r_qt1403g.htm
39 The credit-to-GDP gap is calculated as the difference between the credit-to-GDP ratio and its long-term trend. In accordance with the recommendations by the Basel Committee on Banking Supervision, the trend is estimated using a one-sided Hodrick–Prescott filter using a recommended smoothing parameter (λ) of 400 000.
Credit-to-GDP gap HP-trend
Percentage points
-10
0
10
20
30
40
50
60
70
80
Figure 39 Credit-to-GDP ratio, gap and HP trend
65 70 75 80 85 90 05 10 1795 2000 Credit-to-GDP ratio Threshold
Percentage points Index
-1.0
-0.5
0.0
0.5
1.0
1.5
2.0
-10
-5
0
5
10
15
Figure 40 Private sector credit-to-GDP gap and the Financial Conditions Index
2000 2003 2006 2009 2012 2015 2017
Credit-to-GDP gap Financial conditions index (right-hand scale)
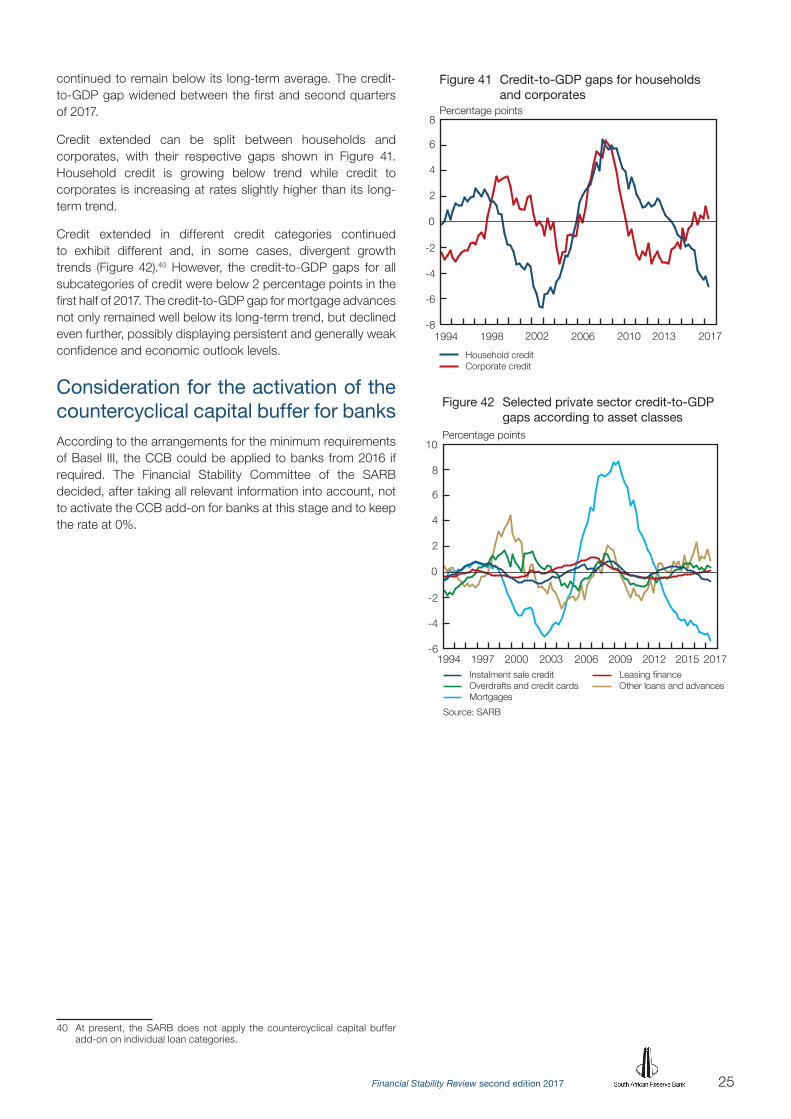
25Financial Stability Review second edition 2017
continued to remain below its long-term average. The credit-to-GDP gap widened between the first and second quarters of 2017.
Credit extended can be split between households and corporates, with their respective gaps shown in Figure 41. Household credit is growing below trend while credit to corporates is increasing at rates slightly higher than its long-term trend.
Credit extended in different credit categories continued to exhibit different and, in some cases, divergent growth trends (Figure 42).40 However, the credit-to-GDP gaps for all subcategories of credit were below 2 percentage points in the first half of 2017. The credit-to-GDP gap for mortgage advances not only remained well below its long-term trend, but declined even further, possibly displaying persistent and generally weak confidence and economic outlook levels.
Consideration for the activation of the countercyclical capital buffer for banksAccording to the arrangements for the minimum requirements of Basel III, the CCB could be applied to banks from 2016 if required. The Financial Stability Committee of the SARB decided, after taking all relevant information into account, not to activate the CCB add-on for banks at this stage and to keep the rate at 0%.
40 At present, the SARB does not apply the countercyclical capital buffer add-on on individual loan categories.
Percentage points
-8
-6
-4
-2
0
2
4
6
8
Figure 41 Credit-to-GDP gaps for households and corporates
1994 1998 2002 2006 2010 2013 2017
Household credit Corporate credit
Instalment sale credit Overdrafts and credit cards MortgagesSource: SARB
Percentage points
-6
-4
-2
0
2
4
6
8
10
Figure 42 Selected private sector credit-to-GDP gaps according to asset classes
1994 1997 2000 2003 2006 2009 2012 2015 2017
Leasing finance Other loans and advances
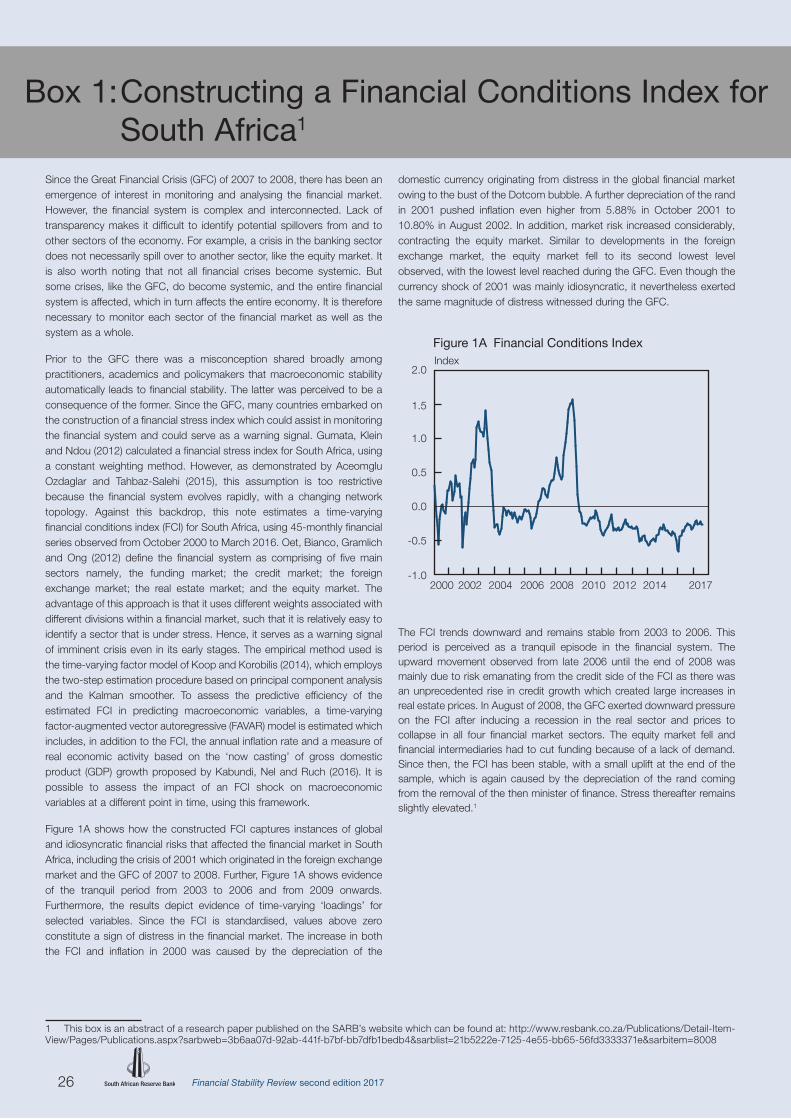
Since the Great Financial Crisis (GFC) of 2007 to 2008, there has been an emergence of interest in monitoring and analysing the financial market. However, the financial system is complex and interconnected. Lack of transparency makes it difficult to identify potential spillovers from and to other sectors of the economy. For example, a crisis in the banking sector does not necessarily spill over to another sector, like the equity market. It is also worth noting that not all financial crises become systemic. But some crises, like the GFC, do become systemic, and the entire financial system is affected, which in turn affects the entire economy. It is therefore necessary to monitor each sector of the financial market as well as the system as a whole.
Prior to the GFC there was a misconception shared broadly among practitioners, academics and policymakers that macroeconomic stability automatically leads to financial stability. The latter was perceived to be a consequence of the former. Since the GFC, many countries embarked on the construction of a financial stress index which could assist in monitoring the financial system and could serve as a warning signal. Gumata, Klein and Ndou (2012) calculated a financial stress index for South Africa, using a constant weighting method. However, as demonstrated by Aceomglu Ozdaglar and Tahbaz-Salehi (2015), this assumption is too restrictive because the financial system evolves rapidly, with a changing network topology. Against this backdrop, this note estimates a time-varying financial conditions index (FCI) for South Africa, using 45-monthly financial series observed from October 2000 to March 2016. Oet, Bianco, Gramlich and Ong (2012) define the financial system as comprising of five main sectors namely, the funding market; the credit market; the foreign exchange market; the real estate market; and the equity market. The advantage of this approach is that it uses different weights associated with different divisions within a financial market, such that it is relatively easy to identify a sector that is under stress. Hence, it serves as a warning signal of imminent crisis even in its early stages. The empirical method used is the time-varying factor model of Koop and Korobilis (2014), which employs the two-step estimation procedure based on principal component analysis and the Kalman smoother. To assess the predictive efficiency of the estimated FCI in predicting macroeconomic variables, a time-varying factor-augmented vector autoregressive (FAVAR) model is estimated which includes, in addition to the FCI, the annual inflation rate and a measure of real economic activity based on the ‘now casting’ of gross domestic product (GDP) growth proposed by Kabundi, Nel and Ruch (2016). It is possible to assess the impact of an FCI shock on macroeconomic variables at a different point in time, using this framework.
Figure 1A shows how the constructed FCI captures instances of global and idiosyncratic financial risks that affected the financial market in South Africa, including the crisis of 2001 which originated in the foreign exchange market and the GFC of 2007 to 2008. Further, Figure 1A shows evidence of the tranquil period from 2003 to 2006 and from 2009 onwards. Furthermore, the results depict evidence of time-varying ‘loadings’ for selected variables. Since the FCI is standardised, values above zero constitute a sign of distress in the financial market. The increase in both the FCI and inflation in 2000 was caused by the depreciation of the
1 This box is an abstract of a research paper published on the SARB’s website which can be found at: http://www.resbank.co.za/Publications/Detail-Item-View/Pages/Publications.aspx?sarbweb=3b6aa07d-92ab-441f-b7bf-bb7dfb1bedb4&sarblist=21b5222e-7125-4e55-bb65-56fd3333371e&sarbitem=8008
domestic currency originating from distress in the global financial market owing to the bust of the Dotcom bubble. A further depreciation of the rand in 2001 pushed inflation even higher from 5.88% in October 2001 to 10.80% in August 2002. In addition, market risk increased considerably, contracting the equity market. Similar to developments in the foreign exchange market, the equity market fell to its second lowest level observed, with the lowest level reached during the GFC. Even though the currency shock of 2001 was mainly idiosyncratic, it nevertheless exerted the same magnitude of distress witnessed during the GFC.
2000
Index
2002 2004 2006 2008 2010 2012 2014 2017-1.0
-0.5
0.0
0.5
1.0
1.5
2.0
Figure 1A Financial Conditions Index
The FCI trends downward and remains stable from 2003 to 2006. This period is perceived as a tranquil episode in the financial system. The upward movement observed from late 2006 until the end of 2008 was mainly due to risk emanating from the credit side of the FCI as there was an unprecedented rise in credit growth which created large increases in real estate prices. In August of 2008, the GFC exerted downward pressure on the FCI after inducing a recession in the real sector and prices to collapse in all four financial market sectors. The equity market fell and financial intermediaries had to cut funding because of a lack of demand. Since then, the FCI has been stable, with a small uplift at the end of the sample, which is again caused by the depreciation of the rand coming from the removal of the then minister of finance. Stress thereafter remains slightly elevated.1
Box 1: Constructing a Financial Conditions Index for South Africa1
26 Financial Stability Review second edition 2017
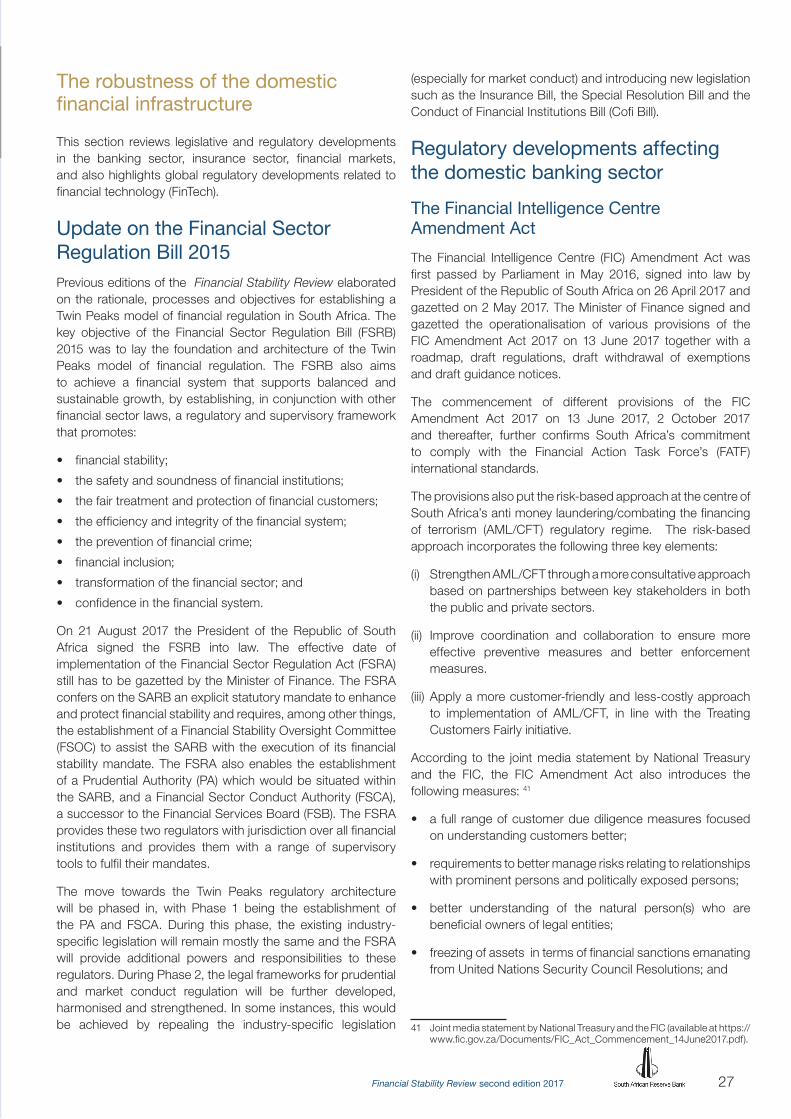
27Financial Stability Review second edition 2017
The robustness of the domestic financial infrastructure
This section reviews legislative and regulatory developments in the banking sector, insurance sector, financial markets, and also highlights global regulatory developments related to financial technology (FinTech).
Update on the Financial Sector Regulation Bill 2015Previous editions of the Financial Stability Review elaborated on the rationale, processes and objectives for establishing a Twin Peaks model of financial regulation in South Africa. The key objective of the Financial Sector Regulation Bill (FSRB) 2015 was to lay the foundation and architecture of the Twin Peaks model of financial regulation. The FSRB also aims to achieve a financial system that supports balanced and sustainable growth, by establishing, in conjunction with other financial sector laws, a regulatory and supervisory framework that promotes:
• financial stability;
• the safety and soundness of financial institutions;
• the fair treatment and protection of financial customers;
• the efficiency and integrity of the financial system;
• the prevention of financial crime;
• financial inclusion;
• transformation of the financial sector; and
• confidence in the financial system.
On 21 August 2017 the President of the Republic of South Africa signed the FSRB into law. The effective date of implementation of the Financial Sector Regulation Act (FSRA) still has to be gazetted by the Minister of Finance. The FSRA confers on the SARB an explicit statutory mandate to enhance and protect financial stability and requires, among other things, the establishment of a Financial Stability Oversight Committee (FSOC) to assist the SARB with the execution of its financial stability mandate. The FSRA also enables the establishment of a Prudential Authority (PA) which would be situated within the SARB, and a Financial Sector Conduct Authority (FSCA), a successor to the Financial Services Board (FSB). The FSRA provides these two regulators with jurisdiction over all financial institutions and provides them with a range of supervisory tools to fulfil their mandates.
The move towards the Twin Peaks regulatory architecture will be phased in, with Phase 1 being the establishment of the PA and FSCA. During this phase, the existing industry-specific legislation will remain mostly the same and the FSRA will provide additional powers and responsibilities to these regulators. During Phase 2, the legal frameworks for prudential and market conduct regulation will be further developed, harmonised and strengthened. In some instances, this would be achieved by repealing the industry-specific legislation
(especially for market conduct) and introducing new legislation such as the Insurance Bill, the Special Resolution Bill and the Conduct of Financial Institutions Bill (Cofi Bill).
Regulatory developments affecting the domestic banking sector
The Financial Intelligence Centre Amendment Act
The Financial Intelligence Centre (FIC) Amendment Act was first passed by Parliament in May 2016, signed into law by President of the Republic of South Africa on 26 April 2017 and gazetted on 2 May 2017. The Minister of Finance signed and gazetted the operationalisation of various provisions of the FIC Amendment Act 2017 on 13 June 2017 together with a roadmap, draft regulations, draft withdrawal of exemptions and draft guidance notices.
The commencement of different provisions of the FIC Amendment Act 2017 on 13 June 2017, 2 October 2017 and thereafter, further confirms South Africa’s commitment to comply with the Financial Action Task Force’s (FATF) international standards.
The provisions also put the risk-based approach at the centre of South Africa’s anti money laundering/combating the financing of terrorism (AML/CFT) regulatory regime. The risk-based approach incorporates the following three key elements:
(i) Strengthen AML/CFT through a more consultative approach based on partnerships between key stakeholders in both the public and private sectors.
(ii) Improve coordination and collaboration to ensure more effective preventive measures and better enforcement measures.
(iii) Apply a more customer-friendly and less-costly approach to implementation of AML/CFT, in line with the Treating Customers Fairly initiative.
According to the joint media statement by National Treasury and the FIC, the FIC Amendment Act also introduces the following measures: 41
• a full range of customer due diligence measures focused on understanding customers better;
• requirements to better manage risks relating to relationships with prominent persons and politically exposed persons;
• better understanding of the natural person(s) who are beneficial owners of legal entities;
• freezing of assets in terms of financial sanctions emanating from United Nations Security Council Resolutions; and
41 Joint media statement by National Treasury and the FIC (available at https://www.fic.gov.za/Documents/FIC_Act_Commencement_14June2017.pdf).

Financial Stability Review second edition 201728
• sharing of information and arrangements for key enforcement and supervisory bodies.
The implementation of the FIC Amendment Act demonstrates South Africa’s commitment to combating corruption, money laundering and illicit financial flows. It also brings South Africa’s regulatory regime for AML/CFT in line with other members of the Group of Twenty (G20), thereby ensuring the safety and soundness of the financial system.
Proposals to establish a deposit insurance scheme for South Africa
The SARB and National Treasury are currently developing new legislation for a framework that will facilitate the resolution of failing financial institutions in an orderly and transparent way, one which seeks to minimise the use of government funding to bail out such institutions. This new resolution framework is an important pillar of the SARB’s expanded and explicit financial stability mandate, as contained in the FSRA. A key component of such a resolution framework is the establishment of an explicit deposit insurance scheme to ensure that depositors who are most exposed to an asymmetry of information and thus least able to hedge or mitigate against financial loss in the event of a bank failure, are protected against losses and hardship that may stem from a bank failure. This framework is expected to enhance the public’s trust in the banking sector, which is an important aspect of financial stability.
The implementation of an explicit deposit insurance scheme will bring about increased adherence to the Key Attributes of Effective Resolution Regimes and the Core Principles of Effective Deposit Insurance Systems issued by the Financial Stability Board and the International Association of Deposit Insurers respectively.
Implicit deposit insurance
South Africa has a well-regulated and stable banking sector, but one that is also quite concentrated. Where one tends to find relatively regular failures of small banks in some other countries, bank failures in South Africa are rare – although when they do occur, they are typically more disruptive.
Bank failures in South Africa seldom occur, and in the past, these failures involved relatively small banks or banks with a limited retail client base, which made it possible for government to at least compensate the retail depositors. Over time, this practice has led many South Africans to believe that their bank deposits are fully insured. This type of deposit protection is implicit rather than explicit, with compensation being largely dependent on the size of the failing bank and the fiscal strength of government at the time of such failure.
An implicit deposit insurance scheme that is dependent on government funding at the time of a bank failure has a number of weaknesses. Firstly, there is no clear, upfront assurance of the types of, and amount up to which, deposits are guaranteed, which creates uncertainty in the event of a payout. Payout decisions within an implicit policy framework
invariably depend on the prevailing circumstances as opposed to an explicit framework in which covered deposits are clearly defined and the covered amount is specified and guaranteed. Secondly, in an implicit scheme, compensation of depositors is funded from taxpayer funds, and depends on the ability of government to fund such payouts at the time. In principle, it is not desirable that public funds are used to pay for private bank failures. Thirdly, even if government decides to compensate depositors of a failed bank it can be a lengthy process to actually execute the payments in the absence of readily available depositor information and payout mechanisms. This can cause prolonged periods of hardship for depositors who do not have access to their bank accounts.
Lastly, compensation that depends on government funding at the time of failure tends to be pro-cyclical because support is usually required at a time when the economy and the financial system may already be vulnerable as a result of wide-spread banking distress.
From a banking sector perspective, the advantage of the implicit deposit insurance arrangements, which South Africa has had in place to date, is that it does not put a direct cost on the banking sector. However, for the reasons cited above, such arrangements are more risky from a financial stability perspective as they create a significant contingent liability for government.
Moving towards an explicit deposit insurance
An explicit deposit insurance scheme sets out clear payment arrangements and ensures there is adequate funding available. This funding is built up by the banking sector in good times rather than at the point of failure. Although the proposed deposit insurance scheme will be partially prefunded, the SARB and National Treasury endeavour to avoid excessive costs on the banking system that could distort competitiveness in the banking sector, or cause moral hazard to the extent that it may become a threat to financial stability.
South Africa is currently the only G20 country that does not have an explicit deposit insurance scheme. About 125 countries have an explicit deposit insurance scheme, of which the Federal Deposit Insurance Corporation in the US is probably the best known, having been established in the 1930s, after the Great Depression. The organisation, funding and operations of deposit insurance schemes vary greatly between countries; while there are a number of generic characteristics, each jurisdiction ultimately decides on the type and structure of the deposit insurance scheme that best suit its own financial system.
However, a common denominator of all deposit insurance schemes is that they play an important role in the resolution of failed banks and the curtailment of financial crises emanating from institutional failures. They also contribute, in combination with other resolution tools, to the process through which poorly managed and weak banks can leave the system in an orderly way, without causing extreme hardship, thereby making way for efficiently managed firms that can better serve the needs of the economy and of the population.

29Financial Stability Review second edition 2017
Key proposals for a deposit insurance scheme for South Africa
On 31 May 2017 the SARB and National Treasury published a discussion paper that contains the proposals for the establishment of a deposit insurance scheme for South Africa. The main features are summarised below.
Firstly, the deposit insurance scheme would be housed in a separate legal entity established as a subsidiary of the SARB. This organisational structure would ensure adequate independence for the deposit insurance scheme to pursue its objectives, but with the backing of the SARB for good governance and operational support.
Secondly, all deposits (except those by other financial institutions and government, listed in the paper) would be covered, irrespective of the type or term of the deposits. Deposits at all banks – small, medium and large – would be covered to the same limit of R100 000. Based on a survey of the deposits at all banks, coverage of R100 000 would be sufficient to fully cover the deposits of about 98% of the retail depositors in South Africa. This level of coverage would help the small banks to expand their funding base and over time, contribute to the diversification of the banking sector.
Thirdly, the envisaged deposit insurance scheme would be funded by the banks themselves, and all registered banks would be obliged to contribute to the fund. The discussion paper proposes two possible funding options that were considered. However, the most cost-efficient funding mechanism is still being discussed with the banking sector, and the ultimate decision may well differ from the proposals in the paper. It is important that the deposit insurance scheme is funded in such a way that the cost to the banking sector does not exceed the financial stability benefits, and that there is sufficient funding available to make the deposit insurance scheme effective. It is also important to have emergency funding available in the event that the deposit insurance scheme experiences a funding shortfall. Emergency funding arrangements should include prearranged and guaranteed sources of liquidity funding and should be legislated. This is, however, subject to the proviso that such emergency funding is subsequently recovered from the remaining banks after the failure event.
Lastly, the build-up of a fund is but one aspect of the deposit insurance scheme. Equally important is the availability of accurate depositor information as well as information technology systems and mechanisms to enable prompt payout of deposits, supported by a sound legal framework, effective operational controls, and a strong governance framework. There will be extensive work for both the deposit insurance scheme and the banks once the legislation is in place. In this regard, the International Association of Deposit Insurers, of which South Africa is currently an associate member, has developed a set of
tried and tested Core Principles as a guide in the development of scheme with world-class features. There are also some more detailed areas that will require further research and deliberation, for example, how exactly should pooled accounts be treated, and how the small cooperative financial institutions should fit into the deposit insurance scheme framework. These aspects are important and will receive special attention in the coming months, without delaying the legislative processes.
A major part of the success of the deposit insurance scheme will depend on the public’s awareness of the scheme and knowledge about how it works. Enhancing such awareness will be an ongoing task of the deposit insurance scheme.
Regulatory developments affecting the domestic insurance sector
Update on the draft Insurance Bill of 2016
Developments on the legislative processes of the draft Insurance Bill of 2016 (Insurance Bill) were reported on in the previous editions of the Financial Stability Review, including the first edition of 2017. The Insurance Bill is being enacted as part of the broader Twin Peaks model of financial regulation. The Insurance Bill will introduce the Solvency Assessment and Management (SAM) regime and will also promote financial inclusion and transformation in the insurance sector. At the time of the first edition of the 2017 Financial Stability Review, the Standing Committee on Finance (SCOF) had called for public hearings42 on the Insurance Bill. On 10 May 2017, the National Treasury presented its response to public comments received on the Insurance Bill to the SCOF. The following key changes were proposed:43
• a number of amendments to explicitly provide for the realisation of the public policy objective of transformation;
• a number of amendments to align the Insurance Bill to the FSRA;
• a number of amendments to provide for additional criteria that the PA must consider in exercising its powers or performing functions under the Insurance Bill; and
• a number of amendments to allow for insurers and reinsurers to be cooperatives.
The envisaged commencement date for the Insurance Bill is July 2018. Once enacted, the Insurance Bill will contribute to maintaining financial stability through an enhanced supervisory framework.
42 The first round of public hearings was conducted in April 2015 and 34 comments were received during that public consultation.
43 The presentation to the SCOF is available at https://www.fsb.co.za/Departments/insurance/Documents/2017.05.12%20Final%20Insurance%20Bill%20presentation%20to%20SCOF.pdf
Financial Stability Review second edition 201730
Finalisation of the International Financial Reporting Standard 17 on Insurance Contracts
On 18 May 2017, the International Accounting Standards Board (IASB) published the International Financial Reporting Standard (IFRS) 17: Insurance Contracts.44 IFRS 17 replaces IFRS 4: Insurance Contracts. IFRS 17 is intended to improve transparency and consistency in reporting by entities on insurance contracts. According to the IFRS Foundation, IFRS 17 also “introduces consistent accounting for all insurance contracts based on a current measurement model.”45
IFRS 17 distinguishes two ways insurers earn revenues from insurance contracts. These are earnings from providing insurance cover and net earnings from financial investments. These are earnings from providing insurance cover and net earnings from financial investments. These revenue sources are matched with what insurers expect to collect in terms of premiums. If expected expenses exceed expected revenue, insurers would be required to regard such insurance contracts as loss-making and recognise this in the income statement immediately.
IFRS 17 is applicable for reporting periods from 1 January 2021. Reporting entities will be allowed the option of reporting earlier under the new standard provided both of IFRS 15: Revenue from Contracts with Customers and IFRS 9: Financial Instruments have also been adopted. The Financial Stability Board has welcomed the introduction of IFRS 17, which it had identified as a priority area in its 25 September 2015 Plenary meeting in London.46
Regulatory developments affecting the domestic financial markets
Retirement fund default regulations
The first edition of the 2016 Financial Stability Review reported on the developments regarding retirement default fund regulations which had been published for final public comment by National Treasury on 9 December 2016. On 25 August 2017, the Minister of Finance issued the final regulations (Regulations) for implementation. These were made in terms of section 36 of the Pension Funds Act 24 of 1956.47
The aim of default strategies is to reduce complexity by requiring retirement funds to develop cost-effective, relatively simple, and standardised products during the accumulation phase, when members withdraw from funds before they retire,
44 The IASB published a detailed Standards Project Summary on IFRS 17 available at http://www.ifrs.org/-/media/project/insurance-contracts/ifrs-standard/ifrs-17-project-summary.pdf/
45 http://www.ifrs.org/-/media/project/insurance-contracts/ifrs-standard/ifrs-17-project-summary.pdf/
46 On 17 July 2017 the FSB noted the IFRS 17 developments. Refer to www.fsb.org/2017/07/fsb-welcomes-new-insurance-accounting-standard/
47 The Regulations can be accessed at http://www.treasury.gov.za/publications/RetirementReform/
and when members convert their retirement savings into an income upon retirement. According to the Regulations, default investment options are automatic choices made on behalf of members.
These final Regulations are meant to improve the outcomes for members of retirement funds by ensuring that they receive good value for their savings and retire comfortably. The Regulations require retirement funds’ trustee boards to offer a default in-fund preservation arrangement to members who leave the services of the participating employer before retirement, and also a default investment portfolio to contributing members who do not exercise any choice regarding how their savings should be invested. For retiring members, a fund should have an annuity strategy with annuity options, either in-fund or out-of-fund, and can only ‘default’ retiring members into a particular annuity product after a member has made a choice.
Exemption of retirement funds from certain prudential investment limits
In another retirement fund reform development, on 21 July 2017, the FSB released Notice No. 1 of 2017 in terms of which it proposes to exempt retirement funds from certain prudential investment limits under regulation 28 of the Pension Funds Act 24 of 1956.48 These limits determine that funds may invest in debt instruments issued or guaranteed by a listed South African bank against its balance sheet, subject to limits being based on the market capitalisation of the South African bank (the issuer). In practice, the controlling company is often the listed entity and not necessarily a South African bank. Accordingly, an exemption is required to regularise the application of the aforementioned limits.
Enabling retirement funds to access safe local assets to invest in could lead to an increase in aggregate domestic savings which could potentially reduce reliance on volatile foreign capital inflows. These savings would then help fund higher rates of investment, an important pre-requisite for higher economic growth and the creation of jobs.
The SADC Integrated Regional Electronic Settlement System
The September 2013 and March 2015 editions of the Financial Stability Review reported on the plans to establish the Southern African Development Community (SADC) Integrated Electronic Settlement System (SIRESS) and provided an update on progress with SIRESS. The SIRESS system is one of the building blocks that contribute to greater regional financial integration, one of the key goals of SADC. Over the last two and a half years, participation in SIRESS has grown from nine to 14 countries, with at least one bank in each country being active on the SIRESS platform. The overall number of participants has also increased to 83 banks of which seven are central banks and 76 are commercial banks (Table 8).
48 https://www.fsb.co.za/Departments/retirementFund/documentfor Comments/Pages/default.aspx

31Financial Stability Review second edition 2017
Table 8 Participation details of SIRESS
Countries Number
Participating countries 14
Participants Number
Participating central banks (as settlement banks) 7
Participating commercial banks 76
Total participating banks 83
RCS operators Number
Regional clearing operators 1
Regional payment schemes Number
None 0
Increasing bank membership of SIRESS is an on-going process and there are a number of banks currently at various stages in the process to become SIRESS participants. Among these is the Reserve Bank of Madagascar which has indicated its willingness to join the platform. Its participation will mean that SIRESS will have at least one participating bank from each of the current 15 SADC states. It is envisaged that SIRESS will reach the milestone of 100 participating banks within the next 12 to 18 months.
SIRESS volumes and values have shown gradual growth over the last two years. Volumes have grown from an average of around 22 000 transactions per month in the third quarter of 2015 to about 24 000 transactions per month in the second quarter of 2017. Values settled have also increased steadily from about R90 billion per month in the third quarter of 2015 to just below R100 billion per month in the second quarter of 2017. The total values settled since inception reached the R1 trillion mark in April 2015 and by end July 2017 the total value and volumes of transaction settled were R3.49 trillion (US$267.59 billion) and 813 551 respectively (Figure 43).
The SIRESS implementation project team continues to work with the SADC Committee of Central Bank Governors (CCBG) Payment System subcommittee, SADC member states’ central banks and the SADC Banking Association to further develop and enhance SIRESS. Current projects in different stages of implementation include the implementation of the settlement of cross-border retail batches as well as the inclusion of the US$ as a settlement currency in SIRESS. Given the increasingly important role that SIRESS plays in the regional payment settlement environment and the significant values of transactions settled, it is likely that SIRESS will be formally designated a financial market infrastructure (FMI) participant active in the payment area, warranting closer attention and supervision in terms of the Principles for Financial Market Infrastructure (PFMI) and will probably be designated a domestic systemically important financial institution (D-SIFI). It is also likely that SIRESS will be able to fill some, but not all,
of the gaps brought about by the decline of correspondent banking relations in SADC associated with the derisking that have taken place recently in the region by some globally active banks.
Global regulatory developments
Financial technology innovation, financial stability and regulatory approaches
The ongoing, rapid expansion of technology-enabled innovation in financial services (FinTech) has attracted the attention of financial authorities in a number of jurisdictions. On 27 June 2017, the Financial Stability Board released a report (the Report) on the potential financial stability implications from FinTech.49 The Report developed a framework to assess the FinTech landscape by defining the scope of FinTech activities and exploring the potential benefits and risks to financial stability. In addition, the Report depicts the regulatory and supervisory issues related to FinTech and have identified 10 issues that merit authorities’ attention.
The Report defines the scope of FinTech activities covered and classifies them by their primary economic function rather than the underlying technologies and the regulatory classification.50 FinTech activities are grouped into five categories of financial services: i) payments, clearing and settlement; ii) deposits, lending and capital raising; iii) insurance; iv) investment management; and v) market support. In an ever-evolving FinTech landscape, where the players and methods or forms of financial services change over time, this classification focuses the attention on what really matters, for example the economic functions of financial intermediation. Furthermore, this approach enables analysis of FinTech to be technology neutral.
49 The report Financial Stability Implications from FinTech: Supervisory and Regulatory issues that Merit Authorities’ Attention is available on the Financial Stability Board website at http://www.fsb.org/wp-content/uploads/R270617.pdf. This first part of this section is based on this Report.
50 See page 8 of the Report.
Volume R billionsFigure 43 Values and volumes settled on SIRESS
Volume Value (right-hand scale)
0
5 000
10 000
15 000
20 000
25 000
30 000
0
20
40
60
80
100
120
2015 2016 2017

Financial Stability Review second edition 201732
issues identified therein that merit attention. Going forward, the G20 called for continued monitoring of the evolving financial stability implications of FinTech developments and encouraged all countries to closely monitor these developments. The Report also highlighted the dangers posed to financial stability and the financial system by cyberattacks or what it refers to as the ‘malicious use of Information and Communication Technologies’.56 The Financial Stability Board’s FinTech report found that a “majority of jurisdictions surveyed have already taken or plan to take regulatory measures to respond to FinTech”.57 South Africa has also taken measures aligned to the concerns raised by the G20 with regard to cybersecurity and in the FinTech report.
The SARB, as the key domestic agency responsible for financial stability, established a dedicated Cybersecurity Unit in 2014. In August 2016, the SARB hosted a cybersecurity conference, with the theme: ‘Collaboration for building cyber-resilience’, for all local financial institutions and relevant parties to serve as catalysts with regard to building national cyber-resilience in the financial community. The SARB has a number of evolving governance documents and practices on cybersecurity that covers all the important areas of cybersecurity, spearheaded by its Cyber-information Security Unit (CISU). In addition, the SARB’s CISU is becoming battle-tested with the rapid and increasing trend of cybersecurity attacks on financial institutions globally. The SARB’s cyber-related practices are also subject to appropriate governance and audit arrangements as well as regular reviews. The SARB has taken an active role in participating and guiding developments in cyber-incident detection and response within the financial sector and developing national cybersecurity structures.
The SARB started monitoring FinTech innovation in 2013 when it joined an informal, domestic intergovernmental working group (IWG) consisting of National Treasury, FIC, and the South African Revenue Services. This working group was established to better understand virtual currencies (VCs) such as bitcoin and regulatory implications and, in 2014, the working group issued a user alert on VCs through National Treasury. The SARB in turn, through its National Payment System Department, issued a position paper on VCs. In 2014, the SARB established an internal working group that focused on VCs and expanded its scope in 2016 to include distributed ledger technology (DLT) and also established a VC/DLT steering committee to provide oversight guidance. The main objective was to gain a better understanding of how these emerging technologies might impact the SARB and its mandate.58
The SARB acknowledges that FinTech extends beyond VCs and DLT, and has shifted its focus to the relationship between FinTech and financial services activities. For this reason, the SARB has recently reconstituted the VC/DLT steering
56 See page 8 of the G20 Hamburg Action Plan, an Annex to G20 Leaders Declaration, which is available at https://www.g20.org/Webs/G20/EN/G20/Summit_documents/summit_documents_node.html.
57 The Report, page 8.58 Regulatory responses to FinTech developments, Keynote address by
Francois Groepe, Deputy Governor of the South African Reserve Bank, at the Strate GIBS FinTech Innovation Conference on 22 August 2017, page 8. The speech is available on the SARB website.
The Report analyses the potential risks and benefits associated with FinTech. Potential benefits identified for financial stability include “decentralisation and increased intermediation by non-financial entities; greater efficiency, transparency, competition and resilience of the financial system; and greater financial inclusion and economic growth, particularly in emerging market and developing economies”.51 The potential risks identified for financial stability include both micro-financial – such as, credit risk, leverage, liquidity risk, maturity mismatch and operational risks, especially cyber and legal – and macrofinancial – such as, non-sustainable credit growth, increased interconnectedness or correlation, incentives for greater risk-taking by incumbent institutions, procyclicality, contagion and systemic importance – dimensions to risks.52
The Report argues that several FinTech activities and risks are already addressed to some extent, for example, by the Financial Stability Board framework for enhanced oversight of shadow banking. With regard to the Report’s assessment of regulatory approaches in relation to FinTech, it explains that the policy objectives pursued by national authorities are informed mostly by “consumer and investor protection, market integrity, financial inclusion, promotion of innovation” and, most recently, financial stability.53 Regulatory approaches in jurisdictions vary and changes thereto are determined by, among other things, the relevant “size and structure of domestic financial and FinTech sectors as well as the flexibility and scope of existing frameworks”. The Report surveys regulatory changes underway in jurisdictions in terms of the five economic functions mentioned earlier, and found that most regulatory changes fall within the areas of payment, capital raising and investment management,54 and that only a few are in the areas of insurance and market support.
Of the 10 issues identified as warranting attention from financial authorities, the Report prioritises the following three:55
• Managing operational risks from third-party service providers.
• Mitigating cyber-risks.
• Monitoring macrofinancial risks.
The other remaining issues that merit attention are: cross-border issues and regulatory arrangements; governance and disclosure frameworks for big data analytics; assessing the regulatory perimeter and updating it on a timely basis; shared learning with a diverse set of private sector parties; further developing open lines of communication across relevant authorities; and building staff capacity in new areas of required expertise.
At the Leaders’ Summit in Hamburg, in July 2017, the G20, among others, welcomed the Financial Stability Board’s FinTech report and endorsed the supervisory and regulatory
51 See page 3 of the Report. For a more detailed of the discussion on these benefits refer to pages 12-17 of the Report.
52 See page 3 of the Report. For a more detailed of the discussion on these risks refer to pages 17–21 of the Report.
53 See page 24 of the Report. 54 These are the three issues as set out in the Report and the remaining
seven issues listed further in this paragraph are based on pages 2–3 of the Report.
55 This paragraph is based on pages 2–3 of the Report.
33Financial Stability Review second edition 2017
committee to focus on FinTech developments and established a broader FinTech programme, with a dedicated unit of full-time staff members. Although it is at an early stage, this programme will be required to facilitate the development of policy stances for the SARB across the FinTech domain.59
The SARB recently made three proposals to strengthen the regulatory approaches to FinTech. These proposals, aligned to the Financial Stability Board’s FinTech report, are as follows:60
• focusing analysis on activities involving financial services rather than on firms or technologies;
• continuing collaboration between local and global regulatory authorities; and
• investigating and deciding on the most appropriate structures, such as sandboxes, to keep abreast of FinTech developments and to allow for demonstration of the technology and experimentation with user cases.
The SARB regards these three approaches to be inter-connected and are required for developing sound policy stances with regard to FinTech. In addition, it believes that these approaches must be augmented by risk-based principles. These proposals endorse the focus on regulating financial services provision or economic functions of FinTech activities of the Financial Stability Board’s FinTech report. Appropriate regulatory responses will require robust analyses of both the benefits and risks of emerging FinTech innovations as decisions taken early on these matters may set important precedents61 and may have significant consequences.
59 Regulatory responses to FinTech developments, page 8.60 Regulatory responses to FinTech developments, pages 6–7.61 The Report, page 6.

Financial Stability Review second edition 201734
Abbreviations
AGR augmented Guidotti ratioAlsi All-Share IndexAML/CFT anti-money laundering and combating the
financing of terrorismBCBS Basel Committee on Banking SupervisionBDI Business Debt IndexBER Bureau for Economic Research
(Stellenbosch University)BETI BankservAfrica Economic Transaction IndexBMR Bureau of Market ResearchBoA Bank of AmericaBRICS Brazil, Russia, India, China, South AfricaCAR capital adequacy ratioCBOE Chicago Board Options ExchangeCBR Conduct of Business ReturnCCB countercyclical capital bufferCCI Consumer Confidence IndexCDS credit default swapCFVI Consumer Financial Vulnerability IndexCIS collective investment schemesCISU Cyber-information Security UnitCPMI Committee on Payments and Market InfrastructuresDTI debt-to-income ratioDTL distributed ledger technologyEBIT earnings before interest and taxesECL expected credit lossEDF expected default frequencyELMI+ Emerging Local Markets Index PlusEM emerging marketsEMBIG Emerging Market Bond Indices GlobalEU European UnionFATF Financial Action Task ForceFAVAR factor-augmented vector autoregressiveFCI Financial Conditions IndexFIC Financial Intelligence CentreFMI financial market infrastructureFNB First National BankFOMC Federal Open Market CommitteeFSB Financial Services BoardFSC Financial Stability CommitteeFSCA Financial Sector Conduct authorityFSOC Financial Stability Oversight CommitteeFSR Act Financial Sector Regulation Act 9 of 2017FSR Bill Financial Sector Regulation Bill 2015FXRC Foreign Exchange Review CommitteeG-20 Group of TwentyGBI-EM Global Bond Index Emerging MarketsGD Global DiversifiedGDP gross domestic productGFC Great Financial CrisisGFSI Global Financial Stress IndexGR Guidotti ratioHPI House Price IndexIAASB International Standard on Auditing and Assurance
Standards Board
IAS International Accounting StandardIASB International Accounting Standards BoardICR interest coverage ratioICT information and communication technologyIFRS International Financial Reporting StandardIG investment gradeIIF Institute of International FinanceIMF International Monetary FundIOSCO International Organization of Securities CommissionsIPP independent power providersISA International Standard on AuditingIWG intergovernmental working groupJSE JSE LimitedLCR liquidity coverage ratioLTV loan-to-value ratioMMF money market fundsMOVE Merrill Lynch Option Volatility EstimateMPC Monetary Policy CommitteeMSCI Morgan Stanley Capital InternationalMTBS Medium Term Budget Policy StatementNCOP National Council of ProvincesNCPF National Cybersecurity Policy FrameworkNPL non-performing loans OFI other financial intermediaryOTC over the counterPCTI Portfolio Committee on Trade and IndustryPFMIs Principles for financial market infrastructuresPMI Purchasing Managers’ IndexPPR Policyholder Protection RulesPSE public sector entitiesREIT real-estate investment trustROE return on equitySADC Southern African Development CommunitySAM Solvency Assessment and ManagementSARB South African Reserve BankSBEG Shadow Banking Experts Group (Financial
Stability Board)SCAV Standing Committee on Assessment of Vulnerabilities
SCOF Standing Committee on Finance
SIFI systemically important financial institutions
SIRESS SADC Integrated Electronic Settlement System
SME small and medium enterprise
SOEs State Owned Enterprises
the dti Department of Trade and Industry
UK United Kingdom
US United States
VC virtual currencies
WGBI World Government Bond Index