seattle dpd - port of seattle market report: terminal 91 ... 91 development options study ... made...
TRANSCRIPT
December 28, 2010
Prepared for
Port of Seattle c/o Arai Jackson Ellison Murakami 2300 Seventh Avenue Seattle, WA 98121 Attn: Frank Silkwood
Prepared by
GVA Kidder MathewsBlair Howe 601 Union Street, Suite 4270 Seattle, WA 98101 206.296.9600 [email protected]
MARKET REPORTTERMINAL 91 DEVELOPMENT OPTIONS STUDY
DRAFT FOR DISCUSSION

Terminal 91 Development Options Study
Executive Summary ............................................................................................... 2
Introduction ........................................................................................................... 5
Market Overview ................................................................................................... 7
Industrial Market .................................................................................................. 11
Flex Market .......................................................................................................... 24
Office Market ....................................................................................................... 30
Biotech Market .................................................................................................... 44
Retail Market ....................................................................................................... 49
Land Value ........................................................................................................... 56
Highest & Best Use ............................................................................................. 59
Addendum ........................................................................................................... 64
Table of Contents
NATURE OF THE ASSIGNMENT
The information supplied herein is from sources we deem reliable. It is provided without any representation, warranty or
guarantee, expressed or implied as to its accuracy. Prospective Owner, Buyer or Tenant should conduct an independent
investigation and verification of all matters deemed to be material, including, but not limited to, statements of value, income, and
expenses. CONSULT YOUR ATTORNEY, ACCOUNTANT, OR OTHER PROFESSIONAL ADVISOR.

Terminal 91 Development Options Study
Page 3
PURPOSE
The Port of Seattle’s has determined that a portion of its
Terminal 91 property is surplus to marine operations and
is exploring development options. The Port has engaged
Arai Jackson Ellison Murakami (AJEM) and Kidder Mathews
(KM) to assist in the evaluation of development options for
the property. This report is an assessment of the supply
and demand characteristics of the relevant real estate
markets and an estimation of the development potential of
the Port’s surplus property.
CONTEXT
The nation is still recoiling from one of the deepest
economic recessions to hit in recent history. The real estate
industry has been particularly hard hit. The recessions
effects included; sale transaction volume slowing to a
trickle, frozen capital markets, falling rental rates and
property values, and a development industry that has been
turned in-side-out. The good news is that the economy
and certain segments of the real estate industry are
showing signs of recovery. Employment growth figures,
the most influential indicators of recovery in the real estate
industry, to date, have yet to show signs of recovery.
PROPERTY DESCRIPTION
The subjects of this study are two Terminal 91 properties.
They are referred to as the West Yard, located to the south
of the Magnolia Bridge along the waterfront, and the North
Bay property, located to the north of the bridge. The West
Yard and the North Bay property are approximately 3.2
and 30 acres, respectively. The properties are currently
vacant or used for yard storage and are paved, lighted,
and generally level. The current zoning is IG1 U45’
a designation that allows for industrial, research, and
development uses.
MARKET SUPPLY AND DEMAND
Industrial
The demand for industrial space in the City of Seattle
and in the Ballard Interbay Northend Manufacturing &
Industrial Center (BINMIC) area has been strong for many
years. The demand is so strong that the supply of space
is overly constrained and its price high. Businesses, driven
to reduce costs, have been forced to locate out of town
on less expensive real estate within close proximity of low
cost labor. When compared to other markets, the recent
recession has had only a modest impact on industrial space
demand in Seattle. The demand that remains the strongest
is from small industrial tenants and owner/users.
Flex
Flex space, that relatively small segment of the market
made up of flexible industrial buildings that contain 50%
office space, includes showroom, light distribution, light
manufacturing, and research and development uses. The
outlook for future demand in that segment of the Seattle flex
market that caters to high tech, research, and development
firms is modest, but good. In the BINMIC flex market
the demand picture is less robust. One the other hand,
historically the market for lower cost flex space, made up
of the other uses, has been constrained in Seattle and
BINMIC. Just like its industrial cousin, most new flex space
development has recently occurred outside the City due to
lack of affordable, developable land. It is clear that there is
and will continue to be demand for this type of space in the
City and in the BINMIC market, however, the building type
and user base is small and easily over supplied.
Office
Buildings in the 74 million square foot Seattle office market
are currently 13% vacant, representing almost 10 million
square feet of space. Asking rental rates are down more
than 15% from the peak of the market in 2007. Vacancy
Executive Summary

Terminal 91 Development Options Study
Page 4
in the submarket market area, made up of the Magnolia,
Queen Anne, Interbay, Ballard, Freemont, and Lake
Union, is currently 12%. The Class A vacancy in the
submarket is 27%, attributable mostly to a few empty
buildings. Recent demand for office space in the
submarket has been for waterfront or water-proximate
property, a trend that is likely to continue given its
scarcity. Projections, based on historical events, suggest
that it may be five to seven years until the development of
new speculative office space is feasible in Seattle or in the
submarket.
Biotech
Although smaller than other leading US biotechnology
centers, the metropolitan Seattle biotechnology center
is the home of a fast growing and vibrant biotechnology
community. The area has an abundance of startup
and early stage firms but is somewhat lacking in larger
established firms as several area companies have been
acquired in recent years. Biotech space can take two
forms; headquarters/lab/medical technology space and
manufacturing space. Biotech manufacturing plants do
not necessarily need to be co-located with a company’s
headquarters or research facilities and are sited in a
similar fashion to other industrial requirements; driven by
low cost labor and real estate. Biotech headquarters/
lab/medical technology space in Seattle is focused in, the
amenity laden, South Lake Union area, an environment
that allows scientists to easily collaborate with one
another, based on close proximity.
The biotech space market in the region is relatively small,
estimated to be approximately out 5.8 million square feet;
up from 2.1 million square feet in 1990. Seattle’s share of
the market is roughly 4.8 million square feet and most of
the balance of the space is located in Bothell. Vacancy in
Seattle is estimated to be 3% and in Bothell it is roughly
40%. Transactions in the works in Seattle are expected
to put more pressure on the market. In anticipation,
developers are permitting new projects in the Lake Union
area that are expected to meet the demand for biotech
space for much of the decade.
Retail
There is significant demand for retail in the Interbay area.
The location is situated between two of Seattle’s most
affluent neighborhoods; Queen Anne and Magnolia. The
IG1 U45 zoning does not allow for the type of retail uses
that could capture the greatest demand, however, the
data suggests that a modest amount of service retail,
that caters to the businesses located on the Terminal 91
property, would be successful. The amount of space
that could reasonably be absorbed is between 2,500 to
10,000 square feet of building area.
HIGHEST AND BEST USE
The highest and best use of land or a site as though
vacant is defined by the real estate industry as, among
all reasonable, alternative uses, the use(s) that yields
the highest present land value, after payments are
made for labor, capital, and coordination. The IG1 U45
zoning permits a range of industrial and research and
development uses, and a limited amount of office space.
A process of elimination can be used to establish the
highest and best uses for the properties.
The North Bay property is a difficult location for office
uses. The adjoining rail yard, marine industrial facilities,
and the existing industrial buildings are less suitable for
people intensive activities than other locations. The West
Yard’s location is physically removed from the industrial
uses, is waterfront property, and has with views of Elliott
Bay and downtown; unique characteristics that don’t
exist elsewhere in the City of Seattle. It is reasonable to
believe that, if permitted, office uses, located on the West
Yard, represent the long term highest and best use of the
land.
The congestion associated with accessing major
highways in the area make the Terminal 91 properties
undesirable for industrial development that involves
distribution uses. There are other segments of the
industrial market that are not as reliant on immediate
access to highways and for which demand exists. They
Terminal 91 Development Options Study
Page 5
include incubator, small industrial, and flex space. There
is demand for small spaces that can serve each of these
industrial uses.
During the last ten years 3.5 million square feet of space
has been taken out of the Seattle industrial market. During
the same period of time millions of square feet of new
space has been developed outside the City. The market
is constrained and high priced. The data suggests the
BINMIC market could capture in excess of 80,000 square
feet of demand for industrial space each year, reflecting a
portion of demand created within the market and a portion
of the demand not fulfilled elsewhere in the City. However,
if North Bay is to capture any of the demand it will need to
offer space that is priced competitively with markets located
outside the City.
Historically, there has been demand for yard storage on the
West Yard and North Bay properties, in the form of vehicle
parking and equipment storage.
Estimates of property value using the land residual
technique can provide perspective about the potential of
a use to contribute value to the land. Recognizing the
technique is highly sensitive to changes in inputs, the table
below suggests the range of land values that would result
from each use.
Land Use Land Value/sf
Office $56 to $83
Flex $8 to $13
Small Industrial $8 to $12
Industrial Incubator $8 to $12
Yard Storage $22 to $30
Sensitivity analysis suggests that as rental rates increase
in the future, land values could increase. By way of
example, with all inputs held constant, a 10% increase in
revenue associated with flex, small industrial, and incubator
development would result in roughly a $5 per square foot
increase in land value.
Comparable land sales data can be used to test the
reasonableness of the land residual technique conclusions.
Recent sales of land comparable to the West Yard, with
zoning that allows for office building development, have
approached $100 per square foot of land area. The most
recent sale was made to an owner/user who intends
to build on the site. It is reasonable to suggest that an
owner/user could purchase/lease the West Yard property;
however, anticipating such a demand is difficult. The
market data indicates that demand adequate to support
speculative office development on the West Yard property
may take five to seven years to materialize. Accordingly,
is reasonable to discount the value indicated by the
comparables to account for holding costs, suggesting
the land residual estimate is not unreasonable given its
conceptual nature.
Completed sales of similarly zoned property in the area
suggest a range of values $37 to $71 per square foot of
land area. Since the comparable sales were completed the
real estate market has corrected significantly and at about
the same time stricter land use regulations were imposed
on the City’s industrial land. Another factor that impacts
the North Bay property in particular is its location compared
to the comparables. Each of these factors suggests lower
land values than those indicated by the comparable sales
data.
CONCLUSION
Market indicators suggest that two approaches to
developing the property are possible. The first calls for
actively marketing the property for a single large user that
values the unique opportunity to acquire a large property
located close to downtown Seattle. This approach may
require many years before it is realized as transactions of
this nature occur rarely. The second approach focuses on a
combination of uses. The West Yard’s current highest and
best use is to hold for office development with an interim
use as yard storage. The highest and best use of the North
Bay property is for yard storage. If emphasis is placed on
industrial job creation, the development of a range of small
industrial and flex buildings, located on lower cost land with
competitive rental rates represents the best use of the land.

Terminal 91 Development Options Study
Page 6
PURPOSE OF THE ASSIGNMENT
The Port of Seattle has contracted with Arai Jackson Ellison
Murakami (AJEM) to evaluate development options for
the Port of Seattle’s Terminal 91 surplus properties. GVA
Kidder Mathews (GVAKM) is providing real estate consulting
services in support of AJEM’s work. GVAKM’s primary task
is to assess the real estate markets and understand the
potential of the property to support new development. The
scope of work for this work involves a current analysis of the
industrial, flex, office, retail, and land markets. This report
presents key data, findings and conclusions.
METHODOLOGY
In 2005 the Port of Seattle conducted an in depth study
of North Bay that included market, economic, and
environmental analysis. The study covered a broad range
of development scenarios, ranging from development under
the zoning in place at the time to mixed use development
requiring zone reclassifications. This study focuses only on
uses permitted under the current zoning code.
PROPERTY DESCRIPTION
There are two Port of Seattle surplus properties at Terminal
91 that are the subject of this study; that property that is
referred to as the West Yard, located to the south of the
Magnolia Bridge along the waterfront, and the property
referred to as North Bay, located to the north of the bridge.
The image (Exhibit I-1) shows the location of the property in
the context of its immediate neighborhood.
The West Yard is a rectangular shaped parcel of property
located south of the Magnolia Bridge that measures
approximately 3.2 acres, with roughly 1,000 feet of frontage
on the water. There are currently no improvements on the
property. It is accessed by traveling westbound on the
Magnolia Bridge and using the bridge exit ramp to West
Marina Place. Exiting the property is via the eastbound
on-ramp to the Magnolia Bridge from West Marina Place.
There is no access from the West.
North Bay is an irregular shaped property measuring
approximately 30 acres. A portion of the property is
improved with five industrial buildings that measure a total
of 332,117 square feet. The buildings were constructed
between as long ago as 1955 and as recently as 2007.
They range is size between 25,000 and 95,000 square feet
and are used primarily for warehousing and cold storage.
Major tenants include Trident Seafood and City Ice.
The property is accessed in one of two ways. (1) From
Elliott Avenue West to the Magnolia Bridge to West Marina
Introduction
Exhibit I-1

Terminal 91 Development Options Study
Page 7
Place, and (2) from the north via the Dravis Street Bridge
and 20th Avenue West.
ZONING
The Terminal 91 property is zoned IG1 U/45’. The function
of the IG1 Zone is an area that provides opportunities for
manufacturing and industrial uses and related activity,
where these activities are already established and viable,
and their accessibility by rail and/or waterway make them a
specialized and limited land resource.
Typical permitted land uses in the IG1 Zone include a
wide range of agricultural, commercial, institutional,
manufacturing, parks and open space, storage,
transportation and utility uses. As principal uses, many
non-industrial uses are limited on gross floor area on a lot.
Important examples include: office, retail sales and sales
and services each at 10,000 square feet per lot. Uses with
limitation on maximum size are further limited to floor areas
of 2.5 times lot size. Research and development has no size
limit.
The zoning code indicates there is no maximum height
limit; except that non-industrial principal uses are limited
to 45 feet as designated on the City’s Official Land Use
Map. There is a separate agreement with the Magnolia and
Queen Anne Neighborhoods that limits all uses to 65 feet.
The property is currently divided into a large number of
small lots. The code provides for each lot, if large enough,
to contain 10,000 square feet of office space. There has
been some discussion between the Port and the City of
Seattle about consolidating some of the permitted office
space into one location. Throughout this report references
to this consolidation possibly taking place on the West
Yard property are based on the modification to the code.
In addition, the West Yard is restricted by shoreline zoning
requirements, and any redevelopment of the property would
need to respond to the code.

Terminal 91 Development Options Study
Page 8
The market overview provides context for the analysis of
each of the real estate market segments. The overview
provides a near-term national economic forecast, a
summary of the national real estate markets, a Puget Sound
economic forecast, and a real estate cycle discussion and
forecast.
NATIONAL ECONOMIC OUTLOOK
The Conference Board Leading Economic Index® (LEI)
for the U.S. Increases Again
NEW YORK, November 18, 2010
The Conference Board Leading Economic Index® (LEI)
for the U.S. increased 0.5 percent in October to 111.3
(2004=100), following a 0.5 percent increase in September,
and a 0.1 percent increase in August. Says Ataman
Ozyildirim, economist at The Conference Board: “The
LEI remains on an upward trend, suggesting the modest
economic expansion will continue in the near term. The
LEI’s growth has been slowing this year, but gains in the
financial components helped its pickup in October.”
Says Ken Goldstein, economist at The Conference Board:
“The economy is slow, but latest data on the U.S. LEI
suggest that change may be around the corner. Expect
modest holiday sales, driven by steep discounting. But
following a post-holiday lull, the indicators are suggesting a
mild pickup this spring.”
The Conference Board Coincident Economic Index®
(CEI) for the U.S. increased 0.1 percent in October to
101.5 (2004=100), following no change in September,
and no change in August. The Conference Board Lagging
Economic Index® (LAG) increased 0.1 percent in October
to 108.7 (2004=100), following a 0.5 percent increase in
September, and a 0.1 percent increase in August.
Market Overview
INDEX POINTS TO A MILD PICKUP THIS SPRING
112
108
104
100
96
92
88
84
8099 00 01 02 03 04 05 06 07 08 09 10 11
01:3
07:1
2
09:6
01:1
1
Inde
x (2
004=
100)
Latest LEI Trough March 2009, Latest CEI Trough June 2009Shaded areas represent recessions as determined by the NationaBureau of Economic Research.Source: The Conference Board
The Conference Board Leading Economic IndexThe Conference Board Coincident Economic Index
® (LEI) for the United States® (CEI) for the United States
LEI
CEI
Exhibit M-1

Terminal 91 Development Options Study
Page 9
NATIONAL REAL ESTATE MARKETS
Industrial & Flex
Total Industrial inventory in the U.S. market area amounted
to 19.8 billion square feet in 558,240 buildings as of the end
of the third quarter 2010. The Flex sector consisted of 2.2
billion square feet in 84,736 projects and the Warehouse
sector consisted of 17.6 billion square feet in 473,504
buildings. During the last 12 months, 579 new buildings
measuring 31.9 million square feet were completed. Within
the Industrial market there were 57,590 owner-occupied
buildings accounting for 3.6 billion square feet or 18% of all
Industrial space.
The U.S. Industrial market ended the third quarter 2010
with a vacancy rate of 10.3%. Vacancy was 10.0% and
13.0%, respectively for warehouse and flex space segments
of the market. The vacancy rates have generally been
unchanged during the past 12 months as net absorption
has been almost non-existent.
Nationally, quoted rental rates for available Industrial
space averaged $5.22 per square foot per year at the
end of the third quarter 2010. This represented a 1.3%
decrease since the end of the second quarter, when rents
were reported at $5.29 per square foot. Warehouse rates
averaged $4.66, down from the second quarter when they
were $4.72 per square foot. Flex rates averaged $10.19,
up slightly from last quarter’s $10.06 per square foot.
Total year-to-date industrial building sales activity in 2010
is up compared to the previous year. In the first six months
of 2010, the market saw 1,565 industrial sales transactions
with a total volume of $5.3 billion. The price per square
foot has averaged $44.82 this year. In the first six months
of 2009, the market posted 1,203 transactions with a total
volume of $4.1 billion. Averaging $52.31 per square foot.
Cap rates have been higher in 2010, averaging 8.95%,
compared to the first six months of last year when they
averaged 8.70%.
Office
Total office inventory in the U.S. market area amounted to
9.8 billion square feet in 439,217 buildings as of the end of
the third quarter 2010. The Class-A office sector consisted
of 3.1 billion square feet in 16,806 projects. There were
178,558 Class-B buildings totaling 4.6 billion square feet,
and the Class-C sector consisted of 2.1 billion square feet
in 243,853 buildings. Within the Office market there were
15,718 owner-occupied buildings accounting for 667 million
square feet of office space.
During the past twelve months 920 new buildings
measuring 58 million square feet were completed.

Terminal 91 Development Options Study
Page 10
The office vacancy rate in the U.S. market area for all
building classes was 12.9% at the end of the third quarter
2010, up from 12.7% at the end of the fourth quarter
2009. The overall vacancy rate in at the end of the third
quarter 2010 was 11.7% in U.S.’s central business districts
and 13.2% in the suburban markets. Vacancy in Class A
buildings was 15.2% and is Class B and Class C buildings it
was 13.2 and 8.9 respectively.
The average quoted asking rental rate for available office
space, all classes, was $21.61 per square foot per year at
the end of the third quarter 2010 in the U.S. market area.
The average quoted rate within the Class-A sector was
$26.78, while Class-B rates stood at $19.45, and Class-C
rates at $16.21.
The average quoted asking rental rate in U.S.’s CBD was
$26.64 at the end of the third quarter 2010, and $20.51 in
the suburban markets. .
Total office building sales activity in 2010 were up compared
to 2009. In the first six months of 2010, the market saw
698 office sales transactions with a total volume of $11.4
billion. The price per square foot averaged $180.96. In
the same first six months of 2009, the market posted 464
transactions with a total
volume of $6.8 billion. The price per square foot averaged
$176.22. Cap rates have been higher in 2010, averaging
8.7% compared to the same period in 2009 when they
averaged 8.2%.
Retail
Total retail inventory in the U.S. market area amounted to
11.8 billion square feet in 880,447 buildings and 89,831
retail centers, as of the end of the third quarter 2010. Over
the past four quarters, a total of 48.8 million square feet of
new retail space in 2,003 buildings has been built in U.S.
U.S.’s retail vacancy rate at the end of the third quarter
2010, stood at 7.3%, basically unchanged during the past
12 months. The amount of vacant sublease space in the
U.S. market has trended down over the past four quarters
and currently measures 33 million square feet or two tenths
of 1%.
Average quoted asking rental rates in the U.S. retail market
are down over previous quarter levels, and down from
their levels four quarters ago. Quoted rents ended the third
quarter 2010 at $15.18 per square foot per year, triple net.
That compares to $15.36 per square foot in the second
quarter 2010, and $15.81 per square foot at the end of the
fourth quarter 2009. This represents a 1.2% decrease in
rental rates in the current quarter, and a 4.15% decrease
from four quarters ago.
Total retail center sales activity in 2010 was up compared
to 2009. In the first six months of 2010, the market saw
771 retail sales transactions with a total volume of $4.7
billion. The price per square foot averaged $105.26. In
the same first six months of 2009, the market posted 565
transactions with a total volume of $2.9 billion. The price per

Terminal 91 Development Options Study
Page 11
square foot averaged $107.81. Cap rates have been higher
in 2010, averaging 8.64% compared to the same period in
2009 when they averaged 7.94%.
PUGET SOUND ECONOMIC FORECAST
The Puget Sound Economic Forecaster’s Dick Conway
and Doug Pedersen are optimistic about a job turnaround
in the Puget Sound region. In their September 2010 news
letter they predict that, assuming no bubbles, between
2010 and 2020 nearly 370,000 new jobs will be created.
The graph (Exhibit M-2) shows the rate of growth of several
key economic indicators; employment, personal income,
consumer price index, population growth, and retail sales.
The forecast for each indicator shows positive growth
throughout the decade.
MARKET CYCLES
The demand for real estate is cyclical in nature. Real estate
cycles represent a pattern of prices over a fairly long period
of time, ranging from two or three years to over 20 years.
Cycles account for interim price movements of real estate
properties, however, real estate cycles are not exact cycles
because they are neither periodic nor resemble each other
in an exact manner.
Each cycle differs from previous cycles in terms of its
causes, length, depth, and effect on different property types
and regions. Real estate cycles behave differently from
other market cycles, such as the stock or commodities
markets. Real estate markets are imperfect, less liquid, and
slower to respond to economic changes.
The typical market cycle can be described in four phases;
recession, recovery, expansion, and oversupply. The
recession phase
is marked by
increasing vacancy
and more the
completion of new
projects. During
the recovery phase
vacancy begins
to decline and
new construction
is nonexistent or
limited. In the
expansion phase
vacancy continues
to decline and the construction of new projects begins. In
the oversupply phase new projects are completed and
vacancy begins to increase.
In most practitioner’s opinion, the Seattle real estate
market is nearing the end of its recessionary phase as
shown in Exhibit M-3. Rental rates and vacancies have
corrected and signs of recovery are present in some market
segments.
PEAKINGMARKET
FALLINGMARKET
RISINGMARKET
BOTTOMINGMARKET
Exhibit M-3
0.0%
1.0%
2.0%
3.0%
4.0%
5.0%
6.0%
RETAIL SALES
POPULATION
CONSUMER PRICE INDEX
PERSONAL INCOME
EMPLOYMENT
202020192018201720162015201420132012
PUGET SOUND ECONOMIC FORECAST2010 TO 2020 (% CHANGE)
Exhibit M-2

Terminal 91 Development Options Study
Page 12
Industrial buildings are a type of building(s) adapted for a
combination of uses such as assemblage, processing, and/
or manufacturing products from raw materials or fabricated
parts. Additional uses include warehousing, distribution, and
maintenance facilities.
SEATTLE INDUSTRIAL MARKET
Seattle businesses are located in 2,149 industrial buildings
containing approximately 60.3 million square feet of space.
The distribution of the buildings is shown in Exhibit I-1.
The average building measures 28,900 square feet. Forty
percent of the buildings measure less than 10,000 square
feet and 33% of the buildings measure between 10,000 and
25,000 square feet.
Forty-nine percent of the buildings were constructed prior to
1960 and another 36% were built between 1960 and 1980.
Sixty one percent of the buildings are warehouses and 26%
are manufacturing buildings. The balance of the inventory
consists of distribution, refridge/cold storage, truck terminal,
and other. Today there is no new industrial space under
construction.
Approximately 40% of the building inventory is occupied by
owner/users, accounting for 500 buildings each averaging
approximately 50,000 square feet. Sixty percent and 1,600
buildings are occupied by tenants in buildings measuring,
on average, 20,000 square feet.
The data suggests buildings in the Seattle Industrial market
are generally small, older and in many cases functionally
obsolete. During recent times there has been a reduction
in inventory as a result of two factors. Zoning changes
have allowed non-industrial uses to creep into industrial
neighborhoods and big projects have resulted in industrial
building demolitions. Examples of these projects include
the Harbor Island Marine Terminal, Quest and Safeco Fields,
and the King County Metro and Sound Transit maintenance
bases.
Absorption
Since 2000 alone, the existing inventory of industrial
buildings in the City of Seattle has declined by 3.5 million
square feet, due to demolitions and conversion to other
uses.
Delivery and Construction
There are currently no new buildings proposed or under
construction in the Seattle Industrial Market. During the last
Industrial Market Analysis
Exhibit I-1

Terminal 91 Development Options Study
Page 13
ten years 744,000 square feet of new industrial buildings
have been constructed in Seattle.
Construction Costs
RS Means reports that the national average for hard costs
to build a typical 100,000 square foot factory building
averages $96 per square foot. A 100,000 square foot
tilt-up concrete warehouse building is estimated to cost
$70 per square foot. The cost estimates are exclusive of
land costs, site work, and soft costs. Engineering News
Construction Cost Index indicates that construction costs
have increased each year during the last ten years between
2% and 6%, with year to date 2010 figure equal to a 4.4%
increase.
Vacancy
In Seattle vacancy in all industrial buildings is currently
4.7% or 2.8 million square feet. Since 2000, vacancy has
remained below 5%, reflecting the limited supply of land
and little new construction. Exhibit I-2 shows historical
vacancy each year since 2000.
Buildings that measure less than 10,000 square feet are
3.6% vacant. Those that are between 10,000 and 24,999
square feet are 3.1% vacant. Buildings in the 25,000 to
99,000 square feet are approximately 6% vacant. Buildings
over 100,000 square feet are about 4% vacant. The
sublease space available equals 0.1%.
Vacancy in only the tenant occupied building category is
8%. In tenant occupied buildings that measure less than
25,000 square feet, vacancy is 4%. In this category of
building those that measure between 25,000 and 99,000
square feet are 8% vacant and those over 100,000 square
feet are 14% vacant.
Sublease Space
Sublease space accounts for one tenth of one percent
(.01%) of total inventory. During the past ten years sublease
space has averaged between 0% and one half percent
(.05%). Currently sublease asking blended rental rates are
roughly 20% to 30% less than for space that is available
direct from the landlord.
Rental Rates
In the Seattle Industrial market, the average asking blended
rental rate averages $.65 per square foot, per month, triple
net. Rates have increased since 2000, when they were
$.49 per square foot. Exhibit I-3 shows the changes in
asking rental rates over the past decade.
The asking rates for smaller buildings, less than 10,000
square feet average $.88 per square foot, compared to $.54
per square foot for buildings over 100,000 square feet. The
rates for building less than 25,000 square feet were $.56
per square foot in 2000, rose to a peak in the fourth quarter
of 2008 of $.90 per square, and since have dropped off to
$.75 per square foot.
The typical industrial building in the market consists of
shell space and office space. Rental rates are quoted on
a blended basis; a rate for the building shell and another
for the office space are combined. Most, but not all of the
Seattle Market is an add-on market where rent is charged
for the entire shell of the building and additional rent is
added-on for the office space area. Blended rates can
be misleading because the amount of office space in a
warehouse building can have a significant impact on the
blended rate calculation.
Market rental rates for recently completed transactions
are presented in the table below (Exhibit I-4). Shell rates
range from $.52 to $.62 per square foot per month.
0.0%
1.0%
2.0%
3.0%
4.0%
5.0%
6.0%
QTD20101Q
20091Q
2008Q1
20071Q
20061Q
20051Q
20041Q
20031Q
SEATTLE INDUSTRIAL VACANCY
20021Q
20011Q
20001Q
VACANCY
Exhibit I-2

Terminal 91 Development Options Study
Page 14
Office rates range from $.75 to $.85 per square foot. The
resulting blended rates represent a broad range, from $.55
to $.93 per square foot. Each transaction involves rental
rate escalations, concessions, and tenant improvement
contributions that impact the effective rental rate the tenant
will actually pay.
The demand for small industrial spaces has historically
pushed rental rates to the highest levels. The business
parks located in the close-in Seattle industrial market
demonstrate the dynamic. A representative from Harsch
Investments, the owners of four business parks, indicated
that in the last fourteen years, 2010 is the first time that
any of their properties have experienced material vacancy.
The combined vacancy for all of Harsch’s business parks
currently stands at less than 5%. Harsch’s parks generally
offer spaces that measure between 600 and 5,000 square
feet. Blended rental rates for the smallest spaces are as
high as $.82 per square foot and the larger spaces as
high as $.75 per square foot. The Harsch business parks
provide a range of services and are located with easy
access to highways and both the airport and seaports.
Agents who regularly work the Seattle Industrial market
suggest that depending on the age, quality, and location of
the building, shell rates range from $.50 to $.75 and add-on
office rates from $.75 to $.80 per square foot. Lease terms
typically range from five to ten years and in some cases a
few months of free rent is involved. Rent escalations can
range from 3% to 4%. Tenant improvement contributions
by the landlord are ranging from $5 to $10 per square foot
of office space, depending on the existing conditions.
Recent Lease Transactions
Costar has tracked leasing transactions in Seattle’s
industrial market for 11 years. The transactions are
primarily new leases, but also include a small number of
renewals. On average, each year there is 1.3 million square
feet and 108 new industrial leasing transactions completed
in the City.
During the last year, 135 industrial leasing transactions
totaling 2.2 million square were completed in Seattle.
$4.00
$4.50
$5.00
$5.50
$6.00
$6.50
$7.00
$7.50
$8.00
QTD20101Q
20091Q
2008Q1
20071Q
20061Q
20051Q
20041Q
20031Q
20021Q
20011Q
20001Q
SEATTLE INDUSTRIAL ASKING RENTAL RATES
TOTAL AVERAGE RATE
Exhibit I-3
Exhibit I-4
Seattle Industrial Leases
Name/Location Age Coverage SF Whse Office/ Percent
Begin/ Term (Mos)
Term Shell Rate
Office Rate
Blended Rate
Seattle Distribution Center 6795 E. Marginal Way S.
1967 NA 12,838 11,336 1,502 13%
Oct-1062
mos. $0.62 $0.85 $0.65
Northwest Corporate Park 600 S. Brandon St.
1977 60,11361%
33,689 32,295 1,3944%
Aug-1060
mos. $0.58 $0.85 $0.59
Allied Waste54 S. Dawson
1950/ 1989
187,61329%
53,817 35,161 18,656 53%
Jan-1060
mos. $0.58 $0.84 $0.93
Industrial Distribution Group5601 1st Avenue S
1959 91,47651%
46,669 41,669 8,00011%
Oct-0960
mos. $0.50 $0.75 $0.57
NW Corporate Park Bldg M & O417 - 419 S Fidalgo Street
1967 130,68015%
19,500 18,000 1,5008%
Feb-09123
mos. $0.52 $0.85 $0.55

Terminal 91 Development Options Study
Page 15
Seventy percent or 95 transactions, measuring 360,000
square feet, involved tenants occupying less than 10,000
square feet.
During 2010 significant lease transactions include a 56,461
square foot leased by Charlie’s Produce located at 3800 1st
Avenue South, Pacific Terminals lease of 157,515 square
feet at 3480 West Marginal Way South, and Associated
Grocers renewal of its lease 925,653 lease at 3301 South
Northfolk Street.
Sales Activity
In greater Puget Sound, 1,712 industrial building sales
have taken place since 2000. Median price ranged from
a low of $65 in 2000 to a high of $122 per square foot in
2008. Since 2008 the median sale price has fallen to $103
per square foot. Median capitalization rates were 8.75%
in 2000. They dropped to 6.1% in 2007 and have since
increased to 7.8%, where they have been for the first three
quarters of 2010.
This compares with RERC’s 3rd Quarter Investment
Survey national estimates that that indicate that going-in
capitalization rates for industrial buildings are between 6.3%
and 10%, with an average of 7.9%. The warehouse cap
rate average is slightly lower at 7.7%.
Since 2000 Costar has tracked 477 industrial sales in the
City of Seattle, worth $1.1 billion dollars. The median price
of the sales was $104 per square foot, ranging from a low
of $75 per square foot in 2000 to a high of $203 in 2009.
Since January of 2009, Costar Comps has tracked 26
industrial sales in the City of Seattle. The sales ranged in
price between $395,000 and $16.6 million. The median
price was $182 per square foot of building area. Twenty
of the sales were owner/user sales, three sales were
investments, and three were unidentified. Fifteen of the
sales were over $1 million dollars and only one sale was
over $5 million. During 2010 there have been no sales in
excess of $10 million.
Seattle Market Forecast
Demand Drivers
The universe of existing businesses located in Seattle
totals 35,173 total firms employing approximately
530,000 employees. Exhibit I-5 shows the number
and type of businesses that are currently operating in
Seattle. The retail, services, and finance sectors make
up 81% of all businesses and all employees. The other
19% of the businesses, include construction (Cons/Res),
manufacturing, and wholesale trade (WTU), commonly
associated with the use of industrial space.
Demand Indicators
Indicators of demand for industrial real estate can be
categorized as follows:
• Anticipated Economic Growth,
• Employment Growth,
• Manufacturing Output,
• Building Vacancy,
• Age of Building Inventory,
• Changes in Rental Rates,
• Land Supply.
Exhibit I-5
Seattle Business Profile
Businesses Approximate Employment DistributionNAICS Code Number Percent
Construction and Re-sources (Const/Res):
11, 21, 23 2,400 6.9% 3.5%
Finance, Insurance and Real Estate (FIRE):
52, 53 3,561 10.1% 9.5%
Manufacturing: 31-33 1,338 3.8% 6.3%
Retail: 44, 45 7,397 21.0% 20.2%
Services: 51, 54-56, 61p, 62, 71, 72, 81
15,648 44.5% 44.9%
Wholesale Trade, Trans., and Util. (WTU):
22, 42, 48, 49 2,793 8.1% 9.4%
Government (excluding education):
670 1.9% 5.6%
Other: 1,366 3.9% 0.5%
35,173 100% 100%
Souce: ESRI

Terminal 91 Development Options Study
Page 16
The indicators that are often used to estimate future
demand are shown in the list below. The indicators
that have historically correlated best with the absorption
of industrial space are manufacturing output and total
employment. Manufacturing output is a measure of the
changes in the quantity manufactured products. National
data is available for manufacturing output and can be used
to estimate absorption for the nation. At the local level, total
employment data is available and is the next best indicator
of the future demand for industrial space. The demand
indicated by each indicator is discussed below.
Manufacturing Output .88
Employment Based Measures
Total Employment (non Ag) .80
Wholesale Trade .79
Manufacturing .75
Transportation/Utilities .66
Business Inventories .23
Real GDP .18
Population .06
Source: AMB Determinants of Industrial Real Estate Demand
Anticipated Economic Growth: AMB Property Corporation, one of the leading owners
and developers of industrial real estate has created
the AMB Industrial Business Indicator. AMB’s Industrial
Business Indicator (IBI) is a proprietary monthly diffusion
index developed by integrating customer insights with
macroeconomic data to provide leading indications of
trends in the U.S. industrial real estate sector, including:
strength and direction of its customers’ businesses,
directional trend of the overall economy; and
demand for distribution and industrial space.
AMB’s April 2010 index indicated that,
nationally, industrial space utilization is on
the cusp of expansion, driven by higher
production levels, improving imports into the
U.S. and rebuilding of inventories. Higher
utilization factors will lead to stronger demand for industrial
space in the second half of 2010.
In Seattle, long term trends in key industries provide
perspective about the demand for industrial space.
Business revenue in those industries that are industrial
space users; construction, manufacturing, wholesale trade,
transportation and warehousing, and utilities have trended
upward over the last twenty years as shown in Exhibit I-6.
Employment Growth. The Puget Sound Regional Council
is projecting that total employment is expected to increase
from 580,000 in 2010 to 762,000 by 2040, reflecting a
compounded annual increase of between .94% and 1.18%
per year over the term. For each new employee in the City
demand for an additional 100 square feet of industrial space
is created. The data suggests that in the next 10 years
there will be demand for 7.8 million square feet of industrial
space or 780,000 square feet per year as presented in
Exhibit I-7.
$0
$20
$40
$60
$80
$100
$120
$140
$160
Transportation and WarehousingWholesale TradeManufacturing
ConstructionUtilities
2009
2008
2007
2006
2005
2004
2003
2002
2001
2000
1999
1998
1997
1996
1995
1994
1993
1992
1991
1990
Seattle Business Revenue by Industry
Busi
ness
Rev
enue Billi
ons
Exhibit I-6
Seattle Area Industrial Space Demand
2000 2010 2020 2030 2040
Employment 528,569 580,713 653,514 708,348 762,395
Annual Compounded Growth 0.94% 1.18% 0.80% 0.73%
SF per Employee 111 99 100 100 100
Occupied Industrial SF 58,835,090 57,512,349 65,351,400 70,834,800 76,239,500
New Demand 7,839,051 5,483,400 5,404,700
Employment growth estimates based on PSRC2006 2040 estimates. No adjustment made for recent recession

Terminal 91 Development Options Study
Page 17
It is important to note that while growth is occurring in
overall employment, there has been a long term downward
trend the manufacturing employment.
Manufacturing Output. In 2002 AMB developed an
industrial absorption indicator index. The index is based
on the quantity of goods produced, rather than weight
or value of the product. The index predicts near term
future absorption with a high degree of reliability. AMB’s
October 2010 Industrial Absorption Index indicated that
the industrial market reached an inflection point in the third
quarter reflecting positive net absorption for the first time in
three years. The timing of this turnaround is consistent with
its forecast in June 2009. Net absorption is expected to
remain positive throughout the fourth quarter and into 2011.
Building Vacancy. Vacancy has historically remained
below 5% in Seattle’s industrial markets, making it one of
the strongest commercial real estate markets in the region.
Age of Building Inventory. Forty-nine percent of Seattle’s
Industrial buildings were constructed prior to 1960 and
another 36% were built before 1980. The existing buildings
are generally small, older, less efficient, and in many cases
functionally obsolete when compared to modern facilities.
Changes in Rental Rates. Recently Seattle industrial
rental rates have fallen off from highs reached in 2008,
however, rates show substantial long-term growth and
currently the highest in the region.
Land Supply. The supply of industrial land available and
suitable for industrial development is limited. With very few
exceptions, demolition of existing buildings is required to
make way for new development.
In summary, the indicators of demand for industrial space in
Seattle are positive.
• Long term economic growth is anticipated,
• Employment growth is expected,
• Manufacturing output is increasing,
• Vacancy is low,
• Existing inventory is old and functionally obsolete,
• With the exception of the recent market correction
rental rates have been increasing and
• Land supply is limited.
Conclusion
When buildings are demolished, the supply is constrained.
Since 2000 Seattle industrial inventory has declined
by roughly 5%. There are currently no new buildings
under construction, only one 15,500 square foot building
undergoing renovation, and no proposed buildings.
Vacancy for all buildings has remained below 5% since
2000. Rental rates have increased 33% since 2000.
During the third quarter of 2009 the demolition of industrial
buildings in Seattle came to a halt. The change was the
result of two factors; a) the slowing economy, and b)
changes in the zoning code that took place in late 2007
which make the transition of industrial lands to non-
industrial uses difficult.
In Seattle, buildings that measure less than 25,000 square
feet are experiencing vacancy equal to 3% and blended
rental rates averaging $.75 per square foot per month.
While rental rates are off 17% from recent highs, smaller
buildings in the market have held up surprisingly well during
the recession. On the other hand, the larger buildings in
the market have not fared as well, with vacancy increasing
substantially over the last several years.
The demand for industrial space in the BINMIC area has
been strong for many years. The demand is so strong
that the supply of space is overly constrained and its price
high. Businesses, driven to reduce costs, have been forced
to locate out of town on less expensive real estate within
close proximity of low cost labor. When compared to
other markets, the recent recession has had only a modest
impact on industrial space demand in Seattle. The demand
that remains the strongest is from small industrial tenants
and owner/users.
BINMIC INDUSTRIAL MARKET
The Ballard Interbay Northend Manufacturing & Industrial
Center (BINMIC) businesses occupy 366 industrial buildings
containing 6.66 million square feet of space, up from 6.52

Terminal 91 Development Options Study
Page 18
million square feet and 363 buildings in 2000. The diagram
(Exhibit I-8) shows the concentrations of industrial buildings.
The average building measures 18,200 square feet. Forty
eight percent of the buildings measure less than 10,000
square feet and 35% of the buildings are between 10,000
and 25,000 square feet. Less than 2% of the buildings
measure over 100,000 square feet.
Forty six percent of the buildings were constructed prior
to 1960 and another 37% were built before 1980, making
83% of the inventory more than 30 years old. Consistent
with the rest of the City, sixty three percent of the buildings
are warehouses and 26% are manufacturing buildings.
Of the total inventory in the BINMIC market, 1.76 million
square feet of space in 60 buildings is owner occupied and
the average building measures 29,400 square feet. Seventy
three percent of the inventory or 306 buildings are occupied
by tenants.
Consistent with the Seattle market, the BINMIC industrial
market is dominated by small, older, and in many cases
functionally obsolete buildings.
Absorption
During the last ten years the inventory of industrial buildings
has increased by 130,000 square feet. During this period
of time new buildings have been added and old buildings
demolished or converted to non-industrial uses.
Delivery and Construction
There is currently no pure industrial space under proposed
or under construction in the market.
Vacancy
Today, 3% of the 6.7 million square feet of space in the
BINMIC market is vacant. During the last ten years vacancy
has, for the most part, been in the ranges of 1% to 4%.
Buildings that measure less than 10,000 square feet are
2% vacant and those that
are between 10,000 and
25,000 square feet are
3% vacant. Buildings
in the 25,000 to 49,000
square foot range are 6%
vacant and those over
50,000 square are 3%
vacant.
Sublease Space
There is virtually no
sublease space available
in the BINMIC market.
Rental Rates
In the BINMIC market, the
average asking blended
rental rate for industrial
space is $.82 per square
foot, per month, triple
net. In recent times,
rates have increased
significantly - ten years
Exhibit I-8
Terminal 91 Development Options Study
Page 19
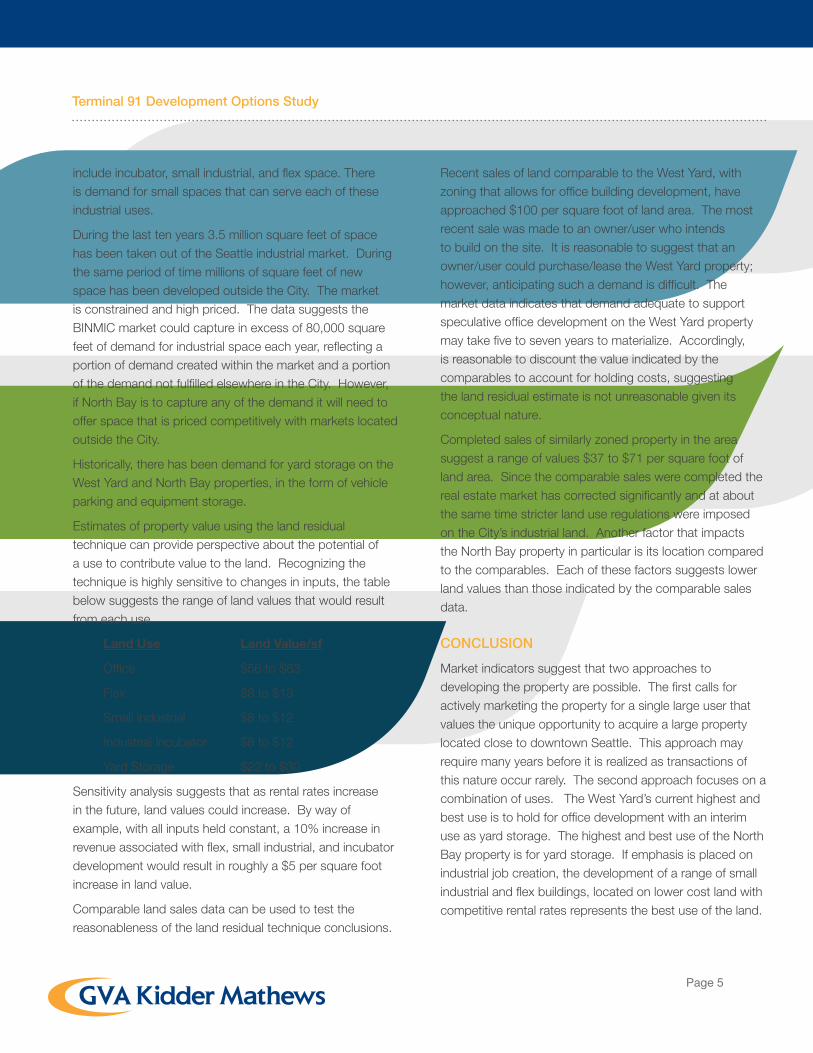
ago the rate was $.49 per square foot. Exhibit I-9 shows the
change in rental rates since 2000. The average asking rate
for smaller buildings, less than 25,000 square feet is $.89
per square foot. Asking rates for buildings less than 25,000
square feet were $.52 per square foot in 2000 and rose to
a peak in the fourth quarter of 2008 of $.96 per square. It
is important to note that the amount of office space in a
building will significantly impact the blended rental rate.
Rental rates tracked by Costar for 11 lease transactions
that closed during the last 12 months averaged $.77 per
square foot.
Exhibit I-10 shows the details from is a list of industrial
lease transactions that were completed during 2010. The
indicated rental rates vary significantly, however some rules
of thumb apply. Rental rates for some water dependent
locations tend to be lower, given the limited demand. Rates
for larger spaces are generally lower and rates for smaller
spaces are higher. Spaces that have visibility from the
major thoroughfares can demand higher rates. And most
importantly the age and condition of the building has a
major impact on achievable rental rates.
Recent Lease Transactions
According to Costar, during the last 11 years, each year on
average, there have been 100,000 square feet and 14 new
leasing transactions completed in the BINMIC industrial
market. In 2010 leasing 19 transactions totaled 64,000
square feet. The majority of the transactions were less than
10,000 square feet.
The larger transactions in the market that were completed
during the last year include; Puget Sound Energy’s 30,544
square foot lease at 1123 Elliott Ave West, a 10,603 square
foot lease at 943 NW 50th Street in Ballard, Ocean Beauty’s
7,950 square foot lease at 1116 W Ewing Street, and 6,200
0.30
0.40
0.50
0.60
0.70
0.80
0.90
QTD20101Q
20091Q
2008Q1
20071Q
20061Q
20051Q
20041Q
20031Q
20021Q
20011Q
20001Q
BINMIC INDUSTRIAL ASKING RENTAL RATES
TOTAL AVERAGE RATE
Exhibit I-9
Exhibit I-10
BINMIC Industrial Lease Comparisons
Name/Location Age Lot/ Coverage
Bldg SF Whse Office/ Percent
Begin/ Term (Mos)
Blended Rate/ Escalations
Comments
Maximun Conformance2122 W. Elmore Street
1,963 20,03794%
18,929 15,617 3,312 17%
Jan-1036 mos.
$0.552.5%/year
Sublease
Ocean Beauty1116 West Ewing Street
1957 71,00271%
50,223 7,950 1,95025%
Aug-1063
$0.503%/year
5 mos. 1/2 rentRowing Club
Rowe Building943 NW 50th Street
1972 12,632113%
14,320 3,717 N/A Mar-10NA
$0.59
3425 16th Avenue West 1991 5,66298%
5,570 5,570 N/A11%
Sep-10NA
$0.61
910 NW 48th Street 1916 4,356101%
4,400 4,400 00%
In Process60
$0.94 $.14 Add. Rent for TI
Batch Building4616 14th Avenue NW
1948 26,13670%
18,240 2,500 0 0%
Nov-1036
$0.90
Frosty's Marine1133 NW 46th Street
1979 N/A 5,630 5,630 0 0%
Mar-1056
$0.853%/year
Viking Rafts1145-55 NW 46th Street
1987 27,007 23,040 7,800 0 0%
Sep-1018
$0.903%/year

Terminal 91 Development Options Study
Page 20
square foot lease at 925-927 NW 50th Street.
One of the largest tenants in the market and one of Seattle’s
largest manufacturing employers, GM Namplate, has been
exploring relocation opportunities for a number of years.
The property is currently for sale and it is reasonable to
believe that relocation is possible.
Sales Activity
Costar tracked 82 sales of industrial building between 2000
and 2010, for a total of $165 million. Of the buildings that
sold, 90% sold for less than $5 million dollars. The under
$5 million group represented 53% of the total dollar volume.
Of this group, since January
of 2009 seven sales
have closed for a total of
$8.1 million. Four of the
transactions were owner/
user buyers, one was and
investment buyer, and
two it is unknown whether
they were owner/user or
investment buyers. Two of
the sales closed in 2009
and five closed in 2010.
The largest transactions
were the 20,294 square
foot 4220 22nd Avenue
West Building that sold for
$1.8 million, the Rolls Royce Building located at 4451 14th
NW that sold for $1.7 million, and the 7,776 square foot
Neuvant Building that sold for $1.2 million.
There are currently 24 industrial buildings, measuring
390,000 square feet, listed for sale in the Commercial
Broker’s association market areas of Magnolia/Queen
Anne and Ballard/Freemont. The buildings range in price
from $595,000 to 10.5 million. On a per square foot basis
the asking prices for the buildings range from $100 to
$300. The average age of the listed buildings is 1947,
with a roughly a third of the buildings refurbished in the in
the 1970s and 1980s. Many of the buildings are mix use,
containing retail, office, and industrial space. Most are
owner/user buildings.
BINMIC Market Forecast
Demand Drivers
In BINMIC market, there are approximately 992 businesses
with 11,977 employees. Retail, services, and finance
make up 64% of all businesses and 49% of all employees.
Thirty six percent of the businesses are construction,
manufacturing, and wholesale trade. The table below
(Exhibit I-11) shows the number and type of businesses that
are currently operating in the BINMIC.
Demand Indicators
The key indicators of the demand for industrial space in
the City of Seattle also provide and indication about the
demand for industrial space in the BINMIC area. The trends
in anticipated economic growth, employment growth,
manufacturing output, and land supply suggest continued
demand for industrial space.
Examination of vacancy, age of the building inventory, and
changes in rental rates specific to the BINMIC area provide
and indication future demand for space within BINMIC.
Employment Growth. The Puget Sound Regional Council
projects total employment in Magnolia, Interbay, Ballard,
Exhibit I-11
BINMIC Business Profile
Businesses Approximate Employment DistributionNAICS Code Number Percent
Construction and Resources (Const/Res): 11, 21, 23 104 10.5% 7.5%
Finance, Insurance and Real Estate (FIRE): 52, 53 63 6.4% 6.0%
Manufacturing: 31-33 105 10.6% 23.1%
Retail: 44, 45 203 20.5% 18.3%
Services: 51, 54-56, 61p, 62, 71, 72, 81 328 33.1% 22.6%
Wholesale Trade, Trans., and Util. (WTU): 22, 42, 48, 49 153 15.4% 20.2%
Government (excluding education): 9 0.9% 1.8%
Other: 27 2.7% 0.3%
992 100% 100%
Source: ESRI

Terminal 91 Development Options Study
Page 21
Fremont, and Queen Anne, to increase from 33,025 in 2010
to 49,040 by 2040. For each new employee demand for
an additional 100 square feet of industrial space is created.
The data suggests that in the next 10 years there will be
demand for 467,300 or 47,000 square feet per year. as
presented in Exhibit I-12.
Building Vacancy. Industrial vacancy in the BINMIC area
is 3%. Most real estate practitioners believe vacancy less
than less than 5% is overly constrained. In a competitive
business environment over constrained real estate
conditions drive tenants to other markets; precisely the
long-term dynamic that has been at work in Seattle and the
BINMIC area for decades.
Age of Building Inventory. With only 17% of the
buildings built after 1980, it is easy to conclude that most
of the inventory is functionally obsolete, indicating possible
demand for new buildings in the market.
Changes in Rental Rates. Since 2000 asking rental rates
in the BINMIC industrial market have increased 67%. This
figure represents significant growth when considering to the
average asking industrial rate in the region only increased by
21% over the same period. Again demand is indicated.
LOCATION ANALYSIS
North Bay
Industrial site selection often involves making quantitative
and qualitative assessments of competing markets. The
North Bay property can be analyzed in a similar fashion to
understand its competitive strengths and weaknesses. The
following assessment reflects how large scale industrial
space users might assess and compare key Puget Sound
industrial markets. The competitive markets identified for
evaluation are BNMIC, Duwamish, Everett, and the Kent
Valley. Key considerations are evaluated for each market.
Travel Time to Employee Housing. The cost of housing
in North Seattle and in particular the subject’s neighborhood
is high compared to the other markets. The high cost
of housing extends travel time for lower cost labor that
can only afford to live in less expensive suburban or rural
locations.
Travel Time to Executive Housing. The subject is well
located in relation to executive housing. The large stock of
executive housing in the immediate area makes the location
attractive for executives who are often key site selection
decision makers.
Travel Time to Passenger Airports. The subject is located
reasonably close to SeaTac International Airport, however,
its competitors the Duwamish and Kent Valley offer better
access and shorter drive times.
Proximity to Air Freight Service. The subject market
is also reasonably close to local airfreight terminals; both
SeaTac and Boeing Field. The Duwamish and the Kent
Valley markets have superior access.
Proximity to Rail. The Ballmer Rail Yard is located directly
adjacent to the site with rail spurs that directly serve the
property, making rail service excellent. The Duwamish and
Kent Valley markets also have competitive rail infrastructure
and service.
Proximity to Major Arterials. Most industrial real estate
is all about proximity to major roadways. The majority of the
regions industrial buildings are located within a reasonable
proximity of the I-5 corridor. The subject’s access to major
roadways is viewed as less attractive than the competing
markets; congestion being the biggest negative factor.
Public Infrastructure. Preliminary indications suggest
that for uses that do not have extraordinary infrastructure
demands, the subject’s infrastructure is adequate. When
Exhibit I-12
BINMIC Market Employment Forecast
2000 2010 2020 2030 2040
Employment 31,538 33,025 37,788 43,070 49,040
New Employment 1,487 4,763 5,282 5,970
SF per Employee 100 100 100 100
Demand for New Space
148,700 476,300 528,200 597,000
Employment growth estimates based on PSRC2006 2040 estimates. No adjust-ment made for recent recession

Terminal 91 Development Options Study
Page 22
comparing the subject to the other markets, the age of its
infrastructure may put it at a slight disadvantage, given that
new development may require incremental upgrades.
Travel Time to Customers. The subject location with
respect to industrial businesses customer base is difficult to
determine. It can be said that it is centrally located within
the region, arguably better than the competing industrial
markets. On the other hand, the traffic congestion and the
travel time to I-5 are drawbacks.
Inventory of Buildable Land. The subject’s competitive
position with respect to available buildable land is
interesting. On one hand, the subject is one of the largest
close-in development sites. On the other hand, because
the supply of land supply is so limited, the location is
probably not on the minds of site selectors.
Land Cost. The cost of land in the subject market is
higher than the competing industrial markets. From a
cost perspective the subject is at a disadvantage.
Taxations. Taxes in the City of Seattle are slightly
higher than in the competing market jurisdictions,
making the cost of occupancy lower outside the City of
Seattle.
Vibration/Noise Nuisance. Most industrial locations
that are served by rail have noise and vibration
considerations. The subject’s adjoining rail yard and
marine terminal create noise and vibration impacts,
likely greater than in the other suburban industrial
markets. Interestingly, noise impacts from new
development at the subject will likely be less tolerated
than the same impacts would be in competing
markets given the proximity to the adjoining residential
neighborhoods.
Proximity to Container Port. The subject is
reasonably well situated to the Harbor Island container
terminal; however, it is not as well located to access the
Port of Tacoma terminal. The Duwamish industrial market is
driven, to a large part, by its proximity to Harbor Island and
the Duwamish waterway. The Kent Valley industrial market
is best situated to access both the Port of Seattle and Port
of Tacoma marine container terminals.
Soil Quality. The soils conditions, both stability and
contamination, are an issue for the Seattle industrial
markets. Soil stability is an issue in the Kent Valley. In
Everett, specifically around Paine Field, soils are better for
supporting structures. The cost to build on the subject is
greater than the other suburban industrial markets, putting it
at an economic disadvantage.
Topography. Developers and users want level land on
which to place new industrial buildings. Uneven topography
requires grading that drives occupancy costs upward,
putting any such site at a competitive disadvantage.
Quantitative Analysis. Exhibit I-13 quantifies the strengths
and weaknesses of each of the competing industrial
markets.
Naturally, site selection criteria will vary by firm and
the results the analysis will vary in each situation. The
outcomes below suggest how a firm contemplating locating
a large facility in the region might think about each market.
Small firm’s would look at the site differently, possibly
Exhibit I-13
Comparative Location Analysis
BINMIC Duwamish Everett Kent Valley
Travel Time to Employee Housing 2 3 4 4
Travel Time to Executive Housing 5 3 3 3
Travel Time To Passenger Airports 3 5 2 4
Proximity to Air Freight Service 3 5 4 5
Proximity to Rail 5 5 3 4
Proximity to Major Arterials 2 5 3 5
Public Infrastructure 3 3 4 4
Travel Time to Customers 3 4 3 4
Inventory of Buildable Land 3 3 4 4
Land Cost 1 2 4 5
Taxations 2 2 3 3
Vibration/Noise Nuisance 2 2 3 3
Proximity to Container Port 3 5 2 5
Soil Quality 1 1 4 2
Topography 5 5 3 5
45 56 52 63

Terminal 91 Development Options Study
Page 23
putting more weight on the close-in location and less weight
on other factors including the increased occupancy costs.
West Yard
The West Yard is markedly less industrial in nature than
North Bay; it is further from the rail yard, other industrial
buildings, and the influence of Magnolia Bridge. Looking
at the property from an industrial real estate perspective,
the West Yard’s characteristics are, in most ways similar to
the North Bay property. In the industrial context, it’s only
differences are that it is not served directly by rail and its
size limits development potential.
CONCLUSION
Historically, demand for industrial space in the BINMIC
market is so strong that landlords have been able to charge,
in some cases, more than twice as much as competing
markets. A sampling of asking blended rental rates in
competing markets includes; Everett at $.38, Kent Valley at
$.36, and Port of Tacoma/Fife at $.39 per square foot per
month. Demand has always been stronger and rental rates
higher for smaller spaces.
While demand can be viewed as strong over the long term,
a combination of historical market conditions and current
events make the future picture less clear. Property owners
in the market have become so accustomed to low vacancy
and high rental rates that the market has not adjusted to
the effects of the recession. There is very little activity in the
market; the average time a space is on the lease market
in Seattle is 17 months and in BINMIC it is 12 months.
The recession has put many businesses under substantial
pressure making the very prospect of moving daunting.
Looking forward to a time when the effects of the recession
have lessened, it is reasonable to believe that the market
will adjust to new realities and/or demand will increase.
In the City of Seattle, on average, each year there is
1.3 million square feet and 108 new industrial leasing
transactions completed. In 2010 the numbers were 135
transactions totaling 2.2 million square feet. Seventy
percent or 95 transactions, measuring 360,000 square feet,
involved tenants occupying less than 10,000 square feet.
The data suggests there is employment driven demand for
new industrial space in the City equal to 780,000 square
feet per year.
According to Costar, during the last 11 years, each year on
average, there have been 100,000 square feet and 14 new
leasing transactions completed in the BINMIC industrial
market. In 2010 leasing 19 transactions totaled 64,000
square feet. The majority of the transactions were under
10,000 square feet. The employment projections indicate
that there will be demand for new industrial space equal to
47,000 square feet per over the next ten years.
The BINMIC market can capture a portion of the roughly
100,000 square feet of historical demand generated from
within as well as a portion of the demand for the City as
a whole. It is reasonable to suggest that the North Bay
property could capture 50,000 square feet or 50% of the
BINMIC demand as well as 10% or 36,000 square feet of
the City-wide demand for small tenants; for a total annual
capture of 86,000 square feet. However, if North Bay is
to capture any of the demand it will need to be priced
competitively with markets located outside the City.

Terminal 91 Development Options Study
Page 24
Flex MarketFlex buildings are buildings designed to be versatile,
which may be used in combination with office (corporate
headquarters), research and development, quasi-retail
sales, and including but not limited to industrial, warehouse,
and distribution uses. At least half of the rentable area of
the building must be used as office space. Flex buildings
typically have ceiling heights under 18’, with light industrial
zoning. Flex buildings can also be called incubator, tech
and showroom, light distribution, light manufacturing, and
research and development.
SEATTLE FLEX MARKET
The Seattle flex market is the home of 186 buildings
measuring 7.6 million square feet. In 2000 there was 6.6
million square feet of space in 173 buildings. Fifty eight
percent of the buildings were constructed before 1960
and another 29% were constructed between 1960 and
1999. The building inventory is dispersed amongst 15
different Seattle submarkets. SoDo has the largest single
share of the market, with 38% or 2.8 million square feet.
The Queen Anne and Lake Union markets together have
22% and 1.7 million square feet of the Seattle flex market
inventory. Exhibit F-1 shows the concentration of existing
flex buildings in the Seattle Market.
Vacancy
Vacancy in the market is currently 7.1%, totaling 862,016
square feet. In 2000 vacancy was at a low of 2% and
then increased to 8.4% in the first quarter of 2005. By
2006 vacancy was down to 2.7%, followed by an increase
that began in mid 2008. There is currently an additional
110,196 square feet of sublease space on the market that
represents an additional .01% vacancy.
Rental Rates
Flex rental rates are highly dependent on location and
building type. A moderate sized space located in an older
building in the South Duwamish market, with grade level
doors and lower clear heights will garner a lower rate than
a multi-story building located in the South Lake Union
market. The blended rental rates in these two scenarios
could be as little as $10 per square foot and as high as $60
Exhibit F-1
Terminal 91 Development Options Study
Page 25
per square foot. To facilitate discussion and analysis, a
base rental rate that is based on the cost to create modern
single story flex space, such as the Gateway North or Cedar
River Corporate Park is instructive. The rate can then be
adjusted for location and building type. A rate equal to $.60
for shell space and an add-on of $.80 for the office portion
of the space is representative of the market for flex space in
the South Duwamish market.
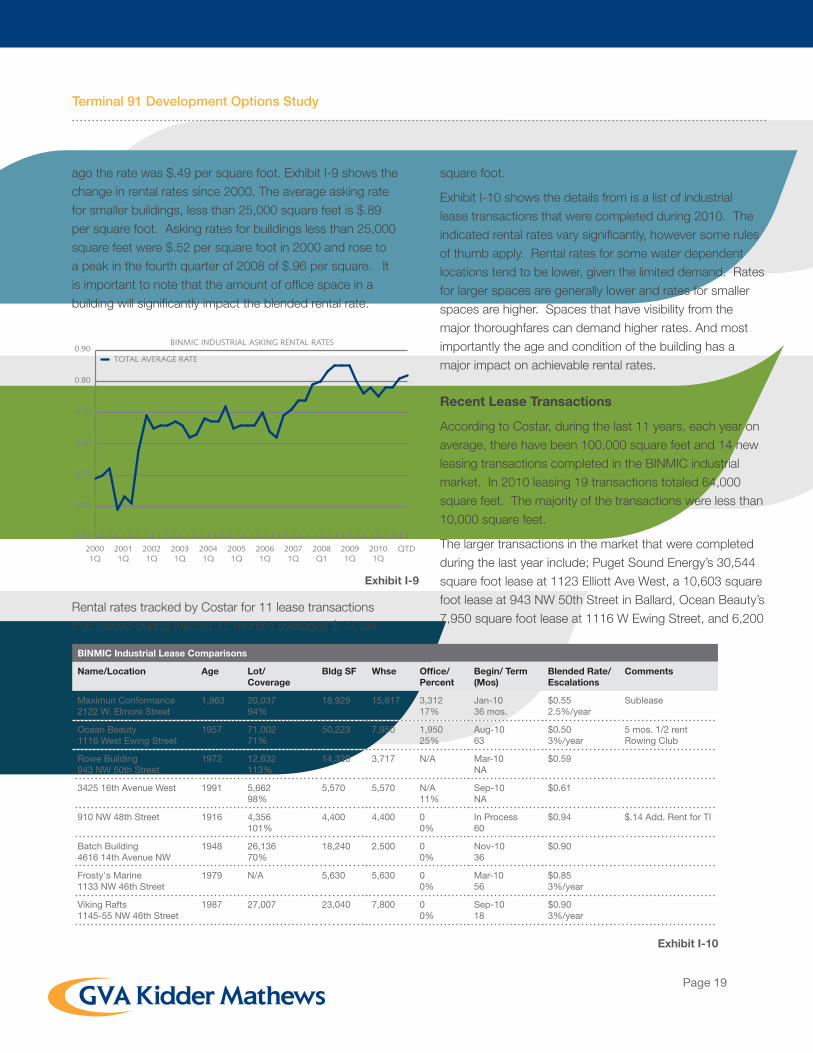
New Construction & Absorption
There are currently no new flex buildings under construction
or proposed projects in the Seattle market. During the last
ten years, 930,000 square feet of new flex buildings have
been added to the market. Two thirds of this total, was
the 2004 addition of Amgen’s Helix Campus that measures
686,000 square feet. Adjusting for the 2004 anomaly, on
average 24,000 square feet of new space has been added
to the market each year during the last decade.
Forecast
The graph (Exhibit F-2) forecasts vacancy through 2015,
assuming that flex space is absorbed at a rate equivalent
to the previous five year average and new buildings are
delivered and absorbed based on the know construction
activity, which in this case is none. The analysis suggests
that vacancy rates will decline from the current level of
7.1% to below 6%. The graph shows the amount of new
space delivered to the market since 2001, in blue. Known
construction and deliveries are projected into the future.
The yellow bars represent the amount of space absorbed
by the market each quarter. The trend line, in red, displays
the projected market vacancy. The forecast suggests that if
no new buildings are constructed and space is absorbed as
it was during the last five years, vacancy will decline slightly.
What the analysis does not show is that 75% of the flex
inventory is located outside of Seattle. In Puget Sound
there is 31 million square feet of space in 1031 properties
that are currently 13% vacant. Since 2000, 4.4 million
square feet of new flex space has been constructed. The
data suggests that historically there is demand for flex
space that is being met in other markets.
0%
1%
2%
3%
4%
5%
6%
7%
8%
9%
10%
-300
-200
-100
0
100
200
300
400
500
600
700
800
2001
1Q
20
02 1
Q
2003
1Q
20
04 1
Q
2005
1Q
20
06 1
Q
2007
1Q
20
08 1
Q
2009
1Q
20
10 1
Q
2011
1Q
20
12 1
Q
2013
1Q
20
14 1
Q
2015
1Q
Thou
sand
SF
SEATTLE FLEX SPACE FORECAST
NET DELIVERIES NET ABSORPTION VAC RATE
Exhibit F-2
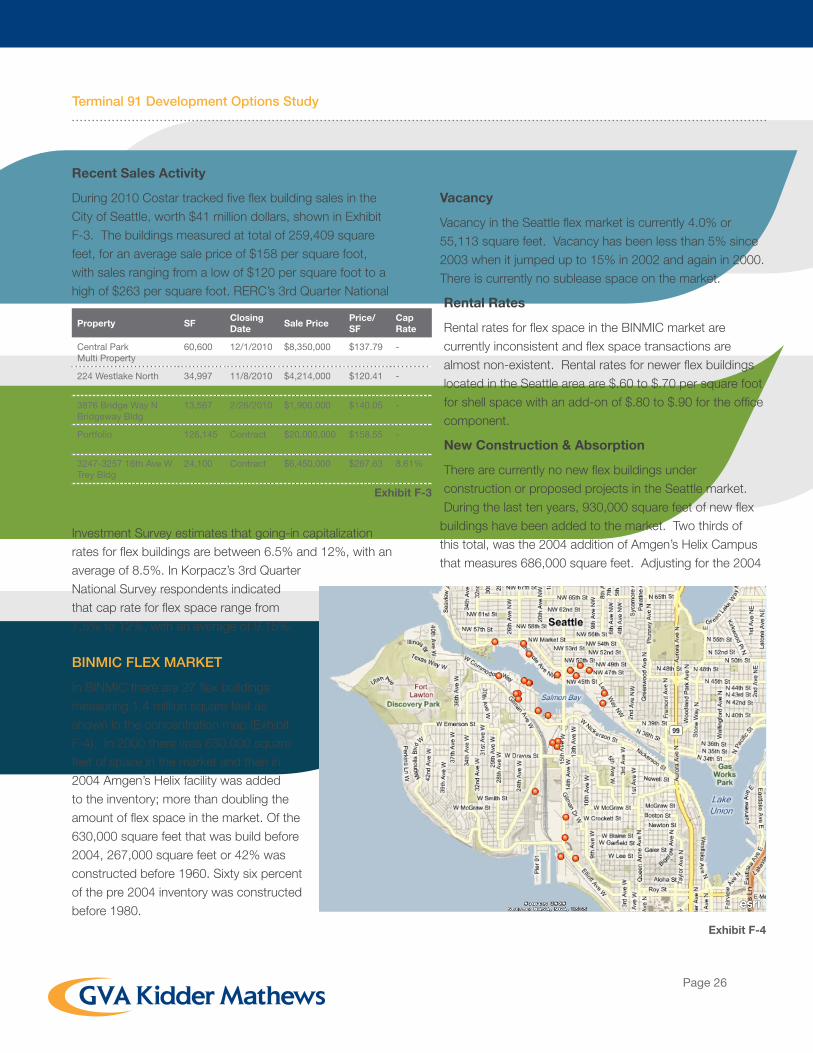
Terminal 91 Development Options Study
Page 26
Recent Sales Activity
During 2010 Costar tracked five flex building sales in the
City of Seattle, worth $41 million dollars, shown in Exhibit
F-3. The buildings measured at total of 259,409 square
feet, for an average sale price of $158 per square foot,
with sales ranging from a low of $120 per square foot to a
high of $263 per square foot. RERC’s 3rd Quarter National
Investment Survey estimates that going-in capitalization
rates for flex buildings are between 6.5% and 12%, with an
average of 8.5%. In Korpacz’s 3rd Quarter
National Survey respondents indicated
that cap rate for flex space range from
7.5% to 12%, with an average of 9.15%.
BINMIC FLEX MARKET
In BINMIC there are 27 flex buildings
measuring 1.4 million square feet as
shown in the concentration map (Exhibit
F-4). In 2000 there was 630,000 square
feet of space in the market and then in
2004 Amgen’s Helix facility was added
to the inventory; more than doubling the
amount of flex space in the market. Of the
630,000 square feet that was build before
2004, 267,000 square feet or 42% was
constructed before 1960. Sixty six percent
of the pre 2004 inventory was constructed
before 1980.
Vacancy
Vacancy in the Seattle flex market is currently 4.0% or
55,113 square feet. Vacancy has been less than 5% since
2003 when it jumped up to 15% in 2002 and again in 2000.
There is currently no sublease space on the market.
Rental Rates
Rental rates for flex space in the BINMIC market are
currently inconsistent and flex space transactions are
almost non-existent. Rental rates for newer flex buildings
located in the Seattle area are $.60 to $.70 per square foot
for shell space with an add-on of $.80 to $.90 for the office
component.
New Construction & Absorption
There are currently no new flex buildings under
construction or proposed projects in the Seattle market.
During the last ten years, 930,000 square feet of new flex
buildings have been added to the market. Two thirds of
this total, was the 2004 addition of Amgen’s Helix Campus
that measures 686,000 square feet. Adjusting for the 2004
Exhibit F-4
Exhibit F-3
Property SFClosing Date
Sale PricePrice/SF
Cap Rate
Central ParkMulti Property
60,600 12/1/2010 $8,350,000 $137.79 -
224 Westlake North 34,997 11/8/2010 $4,214,000 $120.41 -
3876 Bridge Way NBridgeway Bldg
13,567 2/26/2010 $1,900,000 $140.05 -
Portfolio 126,145 Contract $20,000,000 $158.55 -
3247-3257 16th Ave W Trey Bldg
24,100 Contract $6,450,000 $267.63 8.61%

Terminal 91 Development Options Study
Page 27
anomaly, on average 24,000 square feet of new space has
been added to the Seattle market each year during the last
decade.
Forecast
Historically the market for lower cost flex space has been
constrained to the extent most new development has
recently occurred outside the City of Seattle. It is clear
that there is and will continue to be demand for this type
of space in the BINMIC market. On the other hand, the
demand from the segment of the flex market that caters to
high tech, research, and development firms is not as robust
in BINMIC. The Biotech Market Analysis section of this
report forecasts the demand for high end of the flex market.
LOCATION ANALYSIS
The location analysis examines a number of proximity and
site characteristics, assesses strengths and weaknesses,
and contrasts the subject location to competing locations.
The competing locations have been identified as the
Duwamish, Everett, and the Kent Valley. The analysis
is consistent with the methodology used by many site
selectors and mirrors the informal process most businesses
undertake when contemplating new facilities. The analysis
and the findings are generally consistent with Industrial
Location Analysis; however, some of the considerations
take on different importance.
North Bay
The key location considerations and discussion are as
follows:
Travel Time to Employee Housing. The cost of housing
in North Seattle and in particular the subject’s neighborhood
is high compared to the other markets. The high cost
of housing extends travel time for lower cost labor that
can only afford to live in less expensive suburban or rural
locations. Its proximity of higher cost labor that is well
educated is a plus for those flex space users who rely on a
highly educated work force. The subject has an advantage
in this regard compared to the competing markets.
Travel Time to Executive Housing. The subject is well
located in relation to executive housing. The large stock of
executive housing in the immediate area makes the location
attractive for executives who are often key site selection
decision makers.
Travel Time to Passenger Airports. The subject is
located reasonably close to SeaTac International Airport,
however, its competitors the Duwamish and Kent Valley
offer better access and shorter drive times.
Proximity to Air Freight Service. The subject market
is also reasonably close to local airfreight terminals; both
SeaTac and Boeing Field. The Duwamish and the Kent
Valley markets have superior access.
Proximity to Rail. The Ballmer Rail Yard is located directly
adjacent to the site with rail spurs that directly serve the
property, making rail service excellent. Flex users do not
typically require rail service, and while it is a nice amenity; it
is not a factor in the site selection process.
Proximity to Major Arterials. The subject’s access
to major roadways is viewed as less attractive than the
competing markets; congestion being the biggest negative
factor. For flex space users, access to the I-5 corridor is
not as important as for general industrial uses.
Public Infrastructure. Preliminary indications suggest
that for uses that do not have extraordinary infrastructure
demands, the subject’s infrastructure is adequate. When
comparing the subject to the other markets, the age of its
infrastructure may put it at a slight disadvantage, given that
new development may require incremental upgrades.
Proximity to Amenities. The subject has good access
to downtown Seattle, arguably the regions richest cultural
center. The subject is better located than the competing
markets to access a broad array of urban amenities. .
Travel Time to Customers. The subject location provides
good access to the Seattle CBD and its concentration of
businesses; customers and service providers. The central
location is arguably better than the competing markets.
Inventory of Buildable Land. The subject’s is in a unique
position of being one of the largest undeveloped parcels
of land with close proximity to downtown Seattle. The

Terminal 91 Development Options Study
Page 28
Everett and Kent Valley markets have a larger inventory of
developable land than the subject. In the Duwamish market
there are a small number of large parcels that could support
a substantial amount of development; however, they are not
currently available.
Land Cost. The cost of land in the subject market is higher
than the competing markets. From a cost perspective the
subject is at a disadvantage.
Taxations. Taxes in the City of Seattle are slightly higher
than in the competing market jurisdictions, making the cost
of occupancy lower outside the City of Seattle.
Vibration/Noise Nuisance. The subject’s adjoining
rail yard and marine terminal create noise and vibration
impacts, likely greater than in the other suburban industrial
markets. Noise and vibration at the subject could be an
issue for some flex space users and not for others. For
flex space uses that are consistent with traditional industrial
uses like incubator, manufacturing and
light distribution, noise and vibration
created by the adjoining industrial
uses will not be an issue. Other flex
uses, such as tech, research, and
development may find the noise from
adjoining uses disruptive.
Proximity to Container Port. The
subject is reasonably well situated to
the Harbor Island container terminal;
however, it is not as well located to
access the Port of Tacoma terminal.
The Duwamish market is driven, to a
large part, by its proximity to Harbor
Island and the Duwamish waterway.
The Kent Valley market is best situated
to access both the Port of Seattle and
Port of Tacoma. Some flex users will
find access to the Ports an important
consideration and for others the
proximity is not a factor.
Soil Quality. The soils conditions, both stability and
contamination, are an issue for the Seattle industrial
markets. Soil stability is an issue in the Kent Valley. In
Everett, specifically around Paine Field, soils are better for
supporting structures. The cost to build on the subject is
greater than the other suburban industrial markets, putting it
at an economic disadvantage.
Topography. Developers and users want level land on
which to place new industrial buildings. Uneven topography
requires grading that drives occupancy costs upward,
putting any such site at a competitive disadvantage.
Quantitative Analysis. Exhibit F-5 quantifies the strengths
and weaknesses of each of the competing industrial
markets. Naturally, site selection criteria will vary by firm
and the results the analysis will be different in each situation.
The ratings below suggest how a firm might think about
each market. Small firm’s would look at the site differently,
possibly putting more weight on the close-in location
and less weight on other factors including the increased
occupancy costs.
West Yard
For flex space users, the analysis of the West Yard is
Exhibit F-5
Comparative Location Analysis
BINMIC Duwamish Everett Kent Valley
Travel Time to Employee Housing 4 3 3 3
Travel Time to Executive Housing 5 3 3 3
Travel Time To Passenger Airports 3 5 2 4
Proximity to Air Freight Service 3 5 2 4
Proximity to Major Arterials 3 5 3 5
Public Infrastructure 3 3 4 4
Proximity to Amenities 4 3 2 2
Travel Time to Customers 5 3 3 3
Inventory of Buildable Land 3 3 4 4
Land Cost 1 2 4 4
Taxations 2 2 3 3
Vibration/Noise Nuisance 2 2 3 3
Soil Quality 1 1 4 2
Topography 5 5 3 5
44 45 43 49

Terminal 91 Development Options Study
Page 29
consistent with the North Bay location analysis, however,
the sites attributes make is more attractive. The proximity
to the water, views, and distance from the adjoining
industrial land uses make it an location that would be
viewed favorably by any flex user. The cost of land rules
the site out for lower intensity uses, such and incubator,
manufacturing, and light distribution. The high tech flex
users would find the site attractive, just as Immunex
(Amgen) found its location desirable.
Location Conclusion
Form a location perspective, the North Bay property is well
suited for flex space. The location is competitive in most
respects; however, the anticipated land cost puts it at a
disadvantage. The West Yard is well suited to support high
tech flex uses that are housed in multi-story buildings and
are not as sensitive to price as their lower tech cousins.
CONCLUSION
There is demand for space from a segment of the flex
market made up of firms that have a low cost operating
model. These firms use the shell portion of their space for
light distribution, light manufacturing, and industrial research
and development. Those firms that are not as cost driven
which are engaged in technology or need showroom space
are not as likely to locate in BINMIC. This segment of
the market has other choices in location that have better
access and amenities.
The increased revenue associated with the high percentage
of office space in flex buildings is attractive to developers,
owners and investors; however, success can be elusive.
The flex space market is relatively small and can become
easily overbuilt. Flex space at the high end of the market
frequently contains specialized building improvements with
limited potential for reuse. In the BINMIC market, careful
consideration to design will allow a new project to capture
the demand for flex space while maintaining a lower risk
profile.

Terminal 91 Development Options Study
Page 30
Office Market The primary intended use of an office building is to house
employees of companies that produce a product or service
primarily for support services such as administration,
accounting, marketing, information processing and
dissemination, consulting, human resources management,
financial and insurance services, educational and medical
services, and other professional services. Office buildings
are characterized by work efficient floor plans, work areas,
comfortable heating and cooling, cabling for phones and
computers, and other conveniences that allow people
conduct business. The interior finish and the structural
design of the building supports the activities of the
employees. Office buildings are typically configured for
high density use, with a ratio of people to square footage
in the 150 to 300 or more range and less than 25% of the
demised floor space allocated to industrial or retail use.
Some physical characteristics of a building may assist in
classifying the property as “office” if the property’s use is not
apparent.
The office building class designation is a way of
differentiating buildings of the same building type into
different categories of quality. These classes represent a
combination of a subjective and objective quality rating
of buildings that indicates the competitive ability of each
building to attract similar types of tenants. Assigning class
codes allows us to compare individual buildings within a
market as well as across markets, and also to compare
office market conditions between areas in peer groups.
For the purposes of comparison, office buildings are
categorized into four classes. The options are Class A, B,
C, or F, with assignment depending on a variety of building
characteristics, such as total rentable area, age, building
finishes and materials, mechanical systems standards and
efficiencies, developer, architect, building features, location/
accessibility, property manager, design/tenant layout, and
much more. Once assigned, a building’s class reflects not
only characteristics and attributes evaluated objectively, but
also the subjective evaluations of finishes and amenities.
PUGET SOUND OFFICE MARKET
Total inventory in the Seattle/Puget Sound office market
area amounted to 170.8 million square feet in 6,889
buildings as of the end of the third quarter 2010. Class A
office space totaled 54 million square feet in 245 buildings;
Class B buildings totaled 88 million square feet in 2,839
buildings; and Class C space totaled 27 million square feet
in 3,805 buildings.
The Puget Sound Office market ended the third quarter
2010 with a vacancy rate of 13.0%. Class A projects
reported a vacancy rate of 17.2%, Class B projects
reported a vacancy rate of 12.2%, and Class C projects
reported a vacancy rate of 7.7. The vacancy rate was
down over the previous quarter, with net absorption totaling
positive 620,796 square feet in the third quarter. Vacant
sublease space decreased in the quarter, ending the quarter
at 1.7 million square feet. Full service rental rates ended the
third quarter at $25.49.
A total of five buildings delivered to the market in the quarter
totaling 274,068 square feet, with 2.3 million square feet still
under construction at the end of the quarter.
The largest lease signings occurring in 2010 included: the
158,875-square-foot lease signed by Intellectual Ventures
at Sunset North Bldg IV in the Eastside market; the 149,832
square foot deal signed by General Service Administration
at Fifth & Yesler Building in the Downtown Seattle market;
and the 110,111 square-foot lease signed by F5 Networks,
Inc. at Elliott West III in the Downtown Seattle market.
During the second quarter of 2010, 10 office transactions
closed with a total volume of $110,333,121. The 10
buildings totaled 588,327 square feet with the average price
per square foot equal $187.54 per square foot.

Terminal 91 Development Options Study
Page 31
0%
5%
10%
15%
20%
25%
ALLCLASS CCLASS BCLASS A
QTD
2010
1Q
2009
1Q
2008
1Q
2007
1Q
2006
1Q
2005
1Q
2004
1Q
2003
1Q
2002
1Q
2001
1Q
2000
1Q
SEATTLE VACANCY BY CLASS
Exhibit O-2
SEATTLE OFFICE MARKET
Inventory
There are 1,253 office buildings containing approximately
74.3 million square feet of space in the Seattle office
market.
Approximately 47% of this space was constructed prior
to 1980, another 23% was built between 1980 and 2000,
and approximately 20% of the total office space was
constructed since 2000.
Office inventory is typically broken into three classes; Class
A space, which are the extremely desirable investment
grade properties; Class B space, which lack prestige but
are generally in good to average condition; and Class C
space which are generally no-frills, older buildings that offer
basic space. The images in Exhibit O-1 shows the general
nature of the building classifications.
Of the total inventory in the Seattle market, approximately
42% is Class A space; approximately 43% is Class B
space; and approximately 15% is Class C space. Exhibit
O-2 shows the distribution of buildings by class.
Since 2000 the inventory in the Seattle office market has
grown by about 16 million square feet. As shown, Class A
office space has been growing at a faster rate since 2000,
relative to Class B and C office space. Of the total new
inventory delivered since 2000, 65% has been Class A
space. By comparison only 34%has been Class B space,
and about 1% has been Class C space.
Absorption
Annual net absorption, which represents the change in
occupied office space from one year to the next, peaked
at approximately 2.8 million square feet in 2006; annual
net absorption fell precipitously over the next three years
dipping to negative 1.1 million square feet in 2009. As of
November 2010, year-to-date net absorption stands at
almost 1.5 million square feet; approximately 80%, or 1.2
million of this absorption has been Class A space.
Vacancy
Of the total inventory approximately
13.6% or 10.1 million square feet is
currently vacant; this is slightly lower than
the ten year peak of 14.2%, in fourth
quarter 2009.
When broken down by class, it becomes
apparent that the 6.3 million square feet
of surplus Class A office space is the
primary driver behind the spike in overall
vacancy.
Class A office vacancy is currently 20.2%. By comparison
vacancy in Class B space is 9.8% and vacancy in Class
C space is only 5.9%. Overbuilding in the last up cycle is
CLASS A CLASS B CLASS C
EXHIBIT O-1

Terminal 91 Development Options Study
Page 32
responsible for much of the vacancy up, in buildings built
since 2000 vacancy is 22.4%.
There is currently 806,941 square feet of vacant sublease
space in the Seattle office market, accounting for
approximately 8% of the total vacant space.
Largest Lease Signings
As of third quarter 2010 significant lease transactions
include a 149,832 square foot leased by the General
Service Administration located at the 2 Fifth and Yelser
Building, the Colbalt Groups lease of 104,999 square feet
of space located at 5605 Union Station, and the Institute for
Systems Biology’s lease of 90,458 square feet located at
the 6 Rosetta Inpharmatics building.
Exhibit O-3 lists the largest lease signings in the Seattle
Market as of third quarter 2010.
Rental Rates
According to CoStar, average quoted rental rates in the
Seattle office market are currently $27.16 per square foot,
per year, full service. This is down 17% from a five year
peak of $32.77, in third quarter 2008.
Class A rental rates are currently $30.65 per square foot,
per year; Class B space is $23.26; and Class C space is
$18.87 per square foot, per year, full service.
Asking rates for buildings built since 2000 are currently
$31.29 per square foot. This is down 17% from a five year
peak of $37.62, in third quarter 2008. Exhibit O-4 shows
the history of asking rental rates since 2000.
Exhibit O-5 lists rent comparisons for recently completed
transactions. Each transaction involves rental rate
escalations, concessions, and tenant improvement
contributions that impact the effective rental rate the tenant
will actually pay.
$10
$15
$20
$25
$30
$35
$40
ALLCLASS CCLASS BCLASS A
QTD
2010
1Q
2009
1Q
2008
1Q
2007
1Q
2006
1Q
2005
1Q
2004
1Q
2003
1Q
2002
1Q
2001
1Q
2000
1Q
ASKING RENTAL RATES BY CLASS (FULL SERVICE)
Exhibit O-4
Exhibit O-3
Building Submarket Size/SF Quarter Tenant Name
2 Fifth & Yesler Bldg Seattle CBD 149,832 2nd General Service Administration
5605 Union Station Pioneer Sq/Waterfront 104,999 3rd Cobalt Group, Inc.
6 Rosetta Inpharmatics Lake Union 90,458 3rd Institute for Systems Biology
73101 Western Building* Queen Anne/Magnolia 87,538 2nd Isilon Systems, Inc.
8 Elliott West - Bldg 2 - F5 Networks* Queen Anne/Magnolia 84,765 2nd F5 Networks, Inc.
9 Fifth & Yesler Bldg Seattle CBD 83,240 2nd General Service Administration
103131 Elliott Ave* Queen Anne/Magnolia 76,690 2nd Emeritus
11 West 8th Lake Union 72,888 1st Casey Family Programs
14 West 8th Lake Union 61,500 1st Seattle Children’s Hospital
15 Russell Investments Center Seattle CBD 58,884 2nd N/A
Source: Costar *Indicates a renewal

Terminal 91 Development Options Study
Page 33
Exhibit O-6 shows the spread between asking rental rates
for direct and sublet office space. As of November 2010,
asking rental rates for direct space average $27.74 per
square foot, full service; sublet space averages $20.88
per square foot. This represents a difference of $6.86 per
square foot.
Deliveries and Construction
Since the beginning of 2010 there have been 10 buildings
totaling approximately 1.3 million square feet of office space
delivered in Seattle. Since 2000, annual deliveries ranged
from a low of 224,561 square feet in 2003, to a high of 3
million square feet in 2009.
The most notable delivery in 2010 were the Amazon
Campus buildings 1A, 1B, and II which combined total
613,349 square feet, currently 95% leased. Other notable
deliveries include the 505 First Building which is 287,851
square feet and only 16% leased; and the Stadium
Innovation Center which is only 9% leased as of third
quarter 2010.
Under Construction
There are currently five buildings totaling 1.7 million square
feet under construction on the Seattle Market.
The amount of office space under construction on an
annual basis since 2000 has ranged from a low of 480,226
square feet in 2002, to high of 4.7 million square feet in
2008.
The most notable projects currently under construction
are the Amazon Campus buildings III and IV which total
846,568 square feet and are approximately 90% pre-leased
to Amazon; the 590,135 square foot 500 fifth Ave North
Campus building which is 100% preleased to the Gates
Foundation; and the
141,200 square foot
Home Plate Center
North building which is
0% preleased.
Proposed Projects
According to Costar
there are 19 buildings
totaling approximately
3 million square feet of
proposed office space
in the Seattle market
area. If history is an
indicator, less than 1
million square feet of this will likely get built in the next five
years, if ever.
Sales Activity
Since 1990 Costar has tracked 495 office building sales
in the City of Seattle, representing $3.7 billion dollars sales
volume. Over the last decade the median price of the sales
ranged from a low of $150 per square foot in 2000, to a
$20
$22
$24
$26
$28
$30
$32
$34
SUBLET AVERAGE RATEDIRECT AVERAGE RATE
QTD
2010
1Q
2009
1Q
2008
1Q
2007
1Q
2006
1Q
2005
1Q
2004
1Q
2003
1Q
2002
1Q
2001
1Q
2000
1Q
ASKING RENTAL RATES BY CLASS (FULL SERVICE)
Exhibit O-5
Exhibit O-6
Building Name/Address
BldgClass
DealComplete
Tenant YearBuilt
SquareFeet
Year OneRate
Escalation TermMo.
TIs
World Trade Center2401 Elliott Ave
A Q3 2010 PMI 2000 42,791* $32.02/FS 3%/yr 132 $39.43
Dexter Building1100 Dexter Ave N
A Q3 2010 Regus 1997 21,487* $27.60/FS 3%/yr 89 $10
West 8th718 Virginia St
A Q2 2010 Casey Family
2009 74,000 $36.00/FS 3%/yr 132 $100
645 Elliot - North Bldg635 Elliot Ave
A Q2 2010 Clear Channel
2009 31,943 $38.00/FS Flat 180 Est: $70
Union Bay Building1633 Westlake Ave N
A Q2 2010 Angiotech 2000 19,000 $29.17/FS NA 84 $30
Lakeview at Fremont 837 N 34th St
B Q2 2009 Tableau 2008 31,751 $35.00/FS $1.00/sf/yr 72 $65
* Indicates a renewal.

Terminal 91 Development Options Study
Page 34
high of $285 in 2007.
Since January of 2010, Costar tracked 17 office sales in the
City of Seattle. The sales ranged in price between $255,000
and $20.7 million, with a median price per square foot of
$159. Eleven of the sales were over $1 million dollars,
three of the sales were over $10 million, and none of the
sales during 2010 were in excess of $25 million.
The graph (Exhibit O-7) shows the sales dollar volume by
year since 1990 in the Seattle Office Market as well as the
median sales price per square foot.
A survey by Price Waterhouse Coopers found that office
cap rates in the Pacific Northwest ranged between 6%
and 12%, and averaged 8.41% as of third quarter 2010.
According to Costar.com the average cap rate in the Seattle
office market is 8.02%; this is slightly below the twenty year
average of 8.19%.
Employment
The demand for office space is driven by employment
growth. Employment growth can be a function of business
activity and population growth. As shown in the table,
Exhibit O-8, the Puget Sound Regional Council (PSRC)
estimates the number of covered employees in Seattle to be
580,713; up by 52,144, or approximately 10% since 2000.
The PSRC estimates this number to increase to 653,514 by
2020.
Office Using Employees
Office Using Employees (OUEs) are defined as are those
employees who require office space therefore are the
primary drivers of office demand. As shown in the table,
O-9, below the portion of OUE’s to total employees
varies by sector. The total number of OUE’s as of 2010 is
estimated to be 226,121. This calculates to approximately
283 feet of occupied office space per OUE. The number
of OUEs is forecasted to grow by 34,785, to 260,907 by
2020. This represents an average annual growth rate of
3478 OUEs.
Office Space Forecast
Exhibit O-10 shows the amount of new space delivered
each quarter to the market since 2000, in grey. The blue
bars represent the amount of space absorbed by the
market each year. The trend line, in orange, displays the
historical and projected market vacancy.
The forecast relies on the following assumptions:
1. Only known projects that are under construction or
0
200
400
600
800
1000
DOLLAR VOLUME
2010
2009
2008
2007
2006
2005
2004
2003
2002
2001
2000
1999
1998
1997
1996
1995
1994
1993
1992
1991
1990
MIL
LIO
NS
0.00
50.00
100.00
150.00
200.00
250.00
300.00
MEDIAN PRICE PER SF
SEATTLE SALES TRENDS
Exhibit O-7
Exhibit O-8
Seattle Covered Employment
2000 2010 2020 2030
FIRES 244,290 279,243 329,950 371,492
Manufacturing 42,945 34,331 31,835 29,255
Retail 82,345 86,829 97,335 105,520
WTCU 69,252 69,317 74,272 76,537
Gov/Ed 89,737 110,993 120,122 125,544
Total 528,569 580,713 653,514 708,348
Source: Puget Sound Regional Council
Exhibit O-9
Seattle Covered Office Using Employees
% OUE 2000 2010 2020 2030
FIRES 60% 146,574 167,546 197,970 222,895
Manufacturing 10% 4,295 3,433 3,184 2,926
Retail 10% 8,235 8,683 9,734 10,552
WTCU 35% 24,238 24,261 25,995 26,788
Gov/Ed 20% 17,947 22,199 24,024 25,109
Total 201,289 226,121 260,907 288,269
Source: Puget Sound Regional Council; Berk and Assotiates 2005; GVA Kidder Mathews analysis, 2010
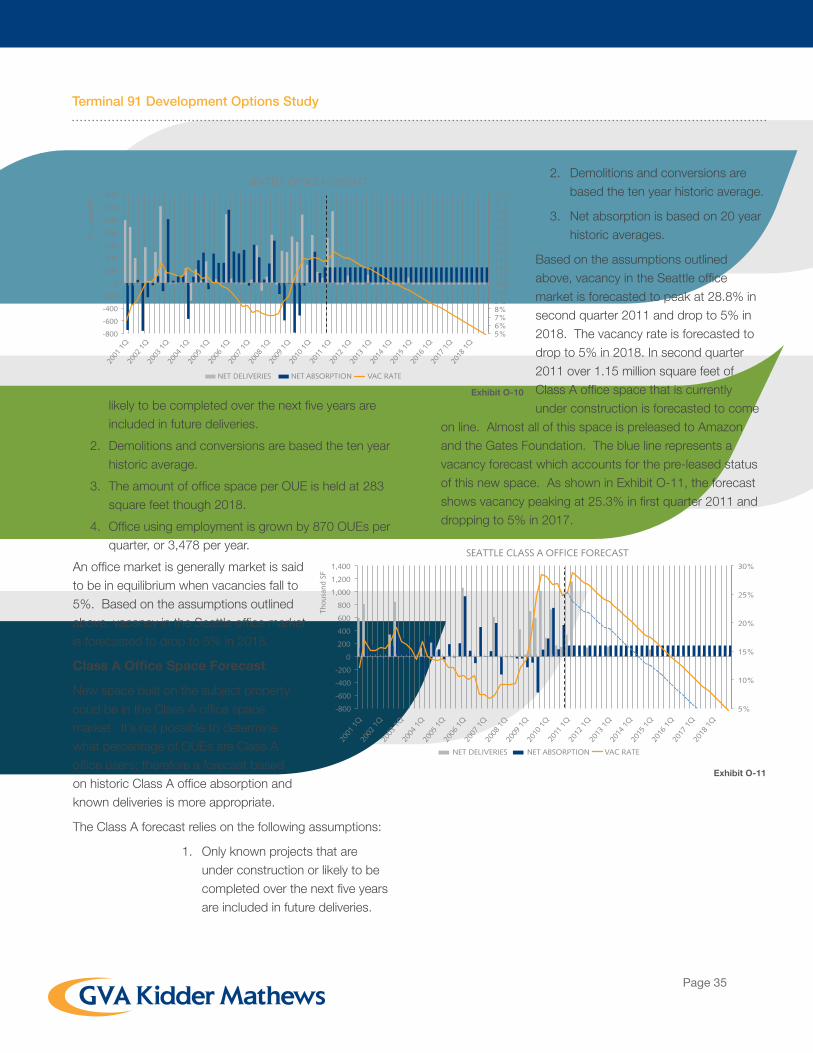
Terminal 91 Development Options Study
Page 35
likely to be completed over the next five years are
included in future deliveries.
2. Demolitions and conversions are based the ten year
historic average.
3. The amount of office space per OUE is held at 283
square feet though 2018.
4. Office using employment is grown by 870 OUEs per
quarter, or 3,478 per year.
An office market is generally market is said
to be in equilibrium when vacancies fall to
5%. Based on the assumptions outlined
above, vacancy in the Seattle office market
is forecasted to drop to 5% in 2018.
Class A Office Space Forecast
New space built on the subject property
coud be in the Class A office space
market. It’s not possible to determine
what percentage of OUEs are Class A
office users; therefore a forecast based
on historic Class A office absorption and
known deliveries is more appropriate.
The Class A forecast relies on the following assumptions:
1. Only known projects that are
under construction or likely to be
completed over the next five years
are included in future deliveries.
2. Demolitions and conversions are
based the ten year historic average.
3. Net absorption is based on 20 year
historic averages.
Based on the assumptions outlined
above, vacancy in the Seattle office
market is forecasted to peak at 28.8% in
second quarter 2011 and drop to 5% in
2018. The vacancy rate is forecasted to
drop to 5% in 2018. In second quarter
2011 over 1.15 million square feet of
Class A office space that is currently
under construction is forecasted to come
on line. Almost all of this space is preleased to Amazon
and the Gates Foundation. The blue line represents a
vacancy forecast which accounts for the pre-leased status
of this new space. As shown in Exhibit O-11, the forecast
shows vacancy peaking at 25.3% in first quarter 2011 and
dropping to 5% in 2017.
5% 6% 7% 8% 9% 10% 11% 12% 13% 14% 15% 16% 17% 18% 19% 20% 21% 22%
-800
-600
-400
-200
0
200
400
600
800
1,000
1,200
1,400
2001
1Q
20
02 1
Q
2003
1Q
20
04 1
Q
2005
1Q
20
06 1
Q
2007
1Q
20
08 1
Q
2009
1Q
20
10 1
Q
2011
1Q
20
12 1
Q
2013
1Q
20
14 1
Q
2015
1Q
20
16 1
Q
2017
1Q
20
18 1
Q
Thou
sand
SF
SEATTLE OFFICE FORECAST
NET DELIVERIES NET ABSORPTION VAC RATE
Exhibit O-10
5%
10%
15%
20%
25%
30%
-800
-600
-400
-200
0
200
400
600
800
1,000
1,200
1,400
2001
1Q
20
02 1
Q
2003
1Q
20
04 1
Q
2005
1Q
20
06 1
Q
2007
1Q
20
08 1
Q
2009
1Q
20
10 1
Q
2011
1Q
20
12 1
Q
2013
1Q
20
14 1
Q
2015
1Q
20
16 1
Q
2017
1Q
20
18 1
Q
Thou
sand
SF
SEATTLE CLASS A OFFICE FORECAST
NET DELIVERIES NET ABSORPTION VAC RATE
Exhibit O-11

Terminal 91 Development Options Study
Page 36
PRIMARY OFFICE PRIMARY MARKET AREA
The Primary Market Area (PMA), shown in Exhibit O-12,
is made up of six Forecast Analysis Zones (FAZs), which
cover Portions of the Ballard Lake Union, Queen Ann/
Magnolia submarkets.
FAZs are the units of the geographic boundary system used
by the PSRC to model and report its small area Forecasts
The Primary Market Area (PMA), shown to the right, is
made up of six Forecast Analysis Zones as described by
the Puget Sound Regional Council. This area includes
Portions of the Ballard Lake Union, Queen Ann/Magnolia
submarkets.
Inventory
There are 556 office buildings containing approximately
14.3 million square feet of space in the Primary Market
Area (PMA). This inventory represents approximately 19%
of Seattle’s total office inventory. Exhibit O-13 shows the
distribution of buildings in the primary market area
Compared to Seattle as a whole, a much larger portion of
the inventory in the PMA was built within the last decade.
Approximately 44% of the total office space in the PMA was
built since 2000; by comparison only 20% of the total office
space in Seattle was built since 2000. Approximately 26%
was built between 1980 and 2000; and approximately 29%
was built before 1980.
Exhibit O-12
Exhibit O-13
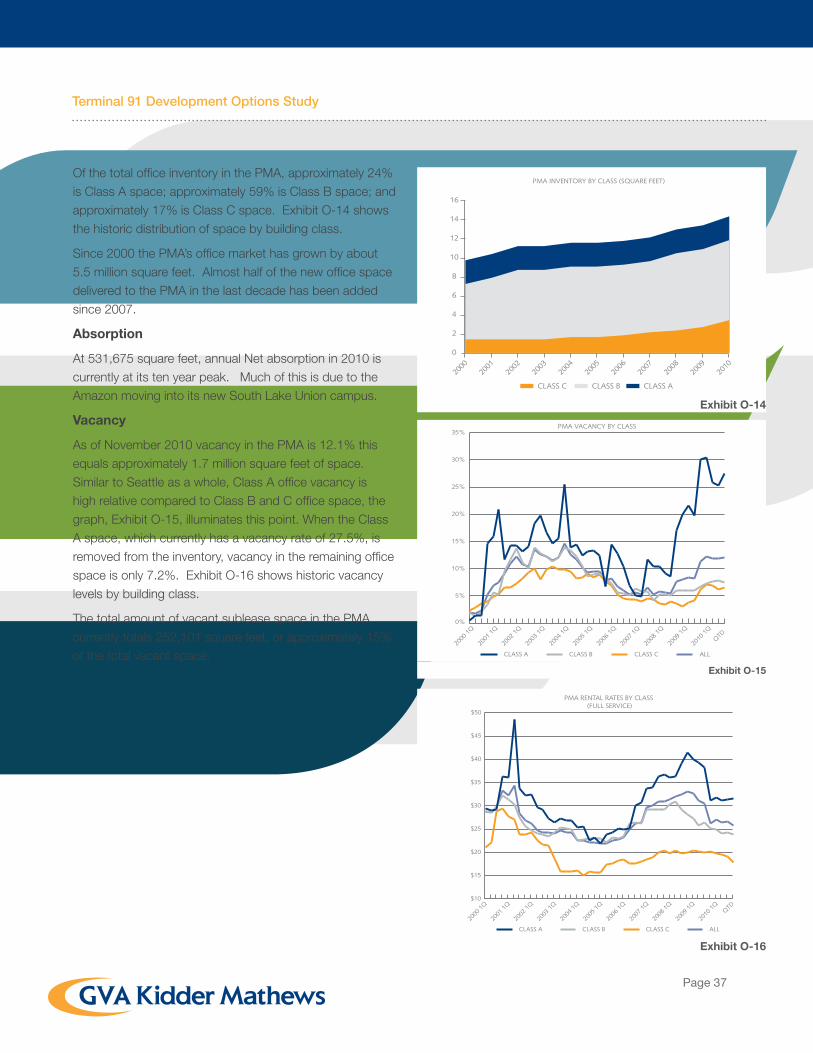
Terminal 91 Development Options Study
Page 37
Of the total office inventory in the PMA, approximately 24%
is Class A space; approximately 59% is Class B space; and
approximately 17% is Class C space. Exhibit O-14 shows
the historic distribution of space by building class.
Since 2000 the PMA’s office market has grown by about
5.5 million square feet. Almost half of the new office space
delivered to the PMA in the last decade has been added
since 2007.
Absorption
At 531,675 square feet, annual Net absorption in 2010 is
currently at its ten year peak. Much of this is due to the
Amazon moving into its new South Lake Union campus.
Vacancy
As of November 2010 vacancy in the PMA is 12.1% this
equals approximately 1.7 million square feet of space.
Similar to Seattle as a whole, Class A office vacancy is
high relative compared to Class B and C office space, the
graph, Exhibit O-15, illuminates this point. When the Class
A space, which currently has a vacancy rate of 27.5%, is
removed from the inventory, vacancy in the remaining office
space is only 7.2%. Exhibit O-16 shows historic vacancy
levels by building class.
The total amount of vacant sublease space in the PMA
currently totals 252,101 square feet, or approximately 15%
of the total vacant space.
PMA VACANCY BY CLASS
0%
5%
10%
15%
20%
25%
30%
35%
ALLCLASS CCLASS BCLASS A
QTD
2010
1Q
2009
1Q
2008
1Q
2007
1Q
2006
1Q
2005
1Q
2004
1Q
2003
1Q
2002
1Q
2001
1Q
2000
1Q
Exhibit O-15
PMA RENTAL RATES BY CLASS (FULL SERVICE)
$10
$15
$20
$25
$30
$35
$40
$45
$50
ALLCLASS CCLASS BCLASS A
QTD
2010
1Q
2009
1Q
2008
1Q
2007
1Q
2006
1Q
2005
1Q
2004
1Q
2003
1Q
2002
1Q
2001
1Q
2000
1Q
Exhibit O-16
PMA INVENTORY BY CLASS (SQUARE FEET)
0
2
4
6
8
10
12
14
16
CLASS ACLASS BCLASS C
2010
2009
2008
2007
2006
2005
2004
2003
2002
2001
2000
Exhibit O-14

Terminal 91 Development Options Study
Page 38
Largest Lease Signings
As of third quarter 2010 significant lease transactions
include a 90,458 square foot lease by the Institute for
Systems Biology located at the 6 Rosetta Inpharmatics
Building; the Isilon Systems renewal of 87,538 square feet
of space located at the 73101 Western Building; and the
F5 Networks renewal of 84,765 square feet located at the 8
Elliot West building.
The table (Exhibit O-17) lists the largest lease signings in the
PMA as of third quarter 2010.
Rental Rates
According to CoStar, average quoted rental rates in the
PMA are $25.86 per square foot, per year, full service.
This is down almost 25% from a ten year peak $34.42, in
second quarter 2001. Class A space is currently $31.50 per
square foot, per year; Class B space is currently $23.78;
and Class C space is currently $17.81 per square foot, per
year, full service.
Asking rates for buildings built since 2000 are currently
$29.53 per square foot. This is down 27% from its ten year
peak of $40.34 in fourth quarter 2008.
As of November 2010, the average direct rental rate was
$26.73 per square foot, full service. By comparison the
average sublease rental rate is $19.13 per square foot; this
represents a discount of approximately 28%, as shown in
Exhibit O-18.
Deliveries and Construction
Since the start of 2010 there have been five office buildings
totaling approximately 732,345 square feet of office space
delivered in the PMA. There are currently four buildings
totaling 1.5 million square feet under construction in the
PMA.
Annual deliveries have ranged from a low of zero square
feet in 2003 and 2005, to a high of 1.1 million square feet
in 2000. The amount of office space under construction
on an annual basis since 2000 has ranged from a low of
87,527 square feet in 2004 to high of 2.6 million square feet
in 2009.
The most notable 2010 delivery is Amazon Campus
buildings 1A, 1B, and II which combined total 613,349
square feet and are about 95% leased as of third quarter
2010. Other notable deliveries include the 505 first building
which is 287,851 square feet and only 16% leased as of
third quarter 2010; and the Stadium Innovation Center
which is only 9% leased as of third quarter 2010.
PMA DIRECT AND SUBLET RENTAL RATES
$20
$22
$24
$26
$28
$30
$32
$34
$36
$38
SUBLET AVERAGE RATEDIRECT AVERAGE RATE
QTD
2010
1Q
2009
1Q
2008
1Q
2007
1Q
2006
1Q
2005
1Q
2004
1Q
2003
1Q
2002
1Q
2001
1Q
2000
1Q
Exhibit O-18
Exhibit O-17
Building Submarket Size/SF
Qtr Tenant Name
6 RosettaInpharmatics
Lake Union 90,458 3rd Institute for Sys-tems Biology
73101 Western Bldg* Queen Anne/Magnolia
87,538 2nd Isilon Systems, Inc.
8 Elliott West-Bldg 2F5 Networks*
Queen Anne/Magnolia
84,765 2nd F5 Networks, Inc.
103131 Elliott Ave* Queen Anne/Magnolia
76,690 2nd Emeritus
11 West 8th Lake Union 72,888 1st Casey Family Programs
14 West 8th Lake Union 61,500 1st Seattle Children’s Hospital
Source: Costar *Indicates a renewal

Terminal 91 Development Options Study
Page 39
The most notable projects currently under construction
are the Amazon Campus buildings III and IV which total
846,568 square feet and are over 90% pre-leased; the
590,135 square foot 500 fifth Ave North Campus building
which is 100% preleased to the Gates Foundation; and
the 141,200 square foot Home Plate Center North building
which is 0% preleased.
Proposed Projects
According to Costar, there are 9 buildings totaling
approximately 1.5 million square feet of proposed office
space in the Seattle market area. It is anticipated that less
than 400,000 square feet of this will get built in the next five
years, if ever.
Sales Activity
Since 1990 Costar has tracked 150 office building sales in
the PMA. The annual median price of the sales ranged from
a low of $153 per square foot in 2000 to a high of $331 in
2007.
Since January of 2010, Costar has tracked 6 office sales
in the PMA. The sales ranged in price between $255,000
and $4.07 million. The median price was $262 per square
foot of building area. Four of the sales were over $1 million
dollars and none were over $5 million.
Exhibit O-19 shows the sales dollar volume by year since
1990 in the PMA as well as the median sales price per
square foot.
Employment
To understand the dynamics of the Primary Market Area,
it is instructive to forecast future market conditions.
Demand for office space is driven primary by employment.
As shown in the table, Exhibit O-20, the Puget Sound
Regional Council (PSRC) estimates the number of covered
employees in the PMA to be 98,683; this is up by 8,926
covered employees since 2000. The PSRC estimates this
number to increase to 119,369 by 2020.
As shown in Exhibit O-21 Office Using Employees (OUEs),
defined as those employees who require office space, vary
significantly by sector. The number of OUEs as of 2010 is
estimated to be 37,452. This calculates to approximately
337 square feet of occupied office space per OUE. The
number of OUEs is forecasted to grow by 10,458, to
47,910 by 2020. This represents an average growth rate of
0
20
40
60
80
100
120
140
DOLLAR VOLUME
50
100
150
200
250
300
350
AVERAGE PRICE PER BLDG SF
2010
2008
2006
2004
2002
2000
1998
1996
1994
1992
1990
SEATTLE SALES TRENDS
Exhibit O-19
Exhibit O-20
PMA Covered Employment
2000 2010 2020 2030
FIRES 39,448 45,304 60,907 70,361
Manufacturing 14,126 10,421 9,547 8,288
Retail 14,945 16,417 19,348 21,953
WTCU 14,428 15,245 17,084 18,147
Gov/Ed 6,766 11,251 12,483 13,348
Total 89,712 98,638 119,369 132,097
Source: Puget Sound Regional council
Exhibit O-21
PMA Covered Office Using Employees
% OUE 2000 2010 2020 2030
FIRES 60% 23,669 27,182 36,544 42,217
Manufacturing 10% 1,413 1,042 955 829
Retail 10% 1,495 1,642 1,935 2,195
WTCU 35% 5,050 5,336 5,979 6,351
Gov/Ed 20% 1,353 2,250 2,497 2,670
Total 32,979 37,452 47,910 54,262
Source: Puget Sound Regional Council; Berk and Assotiates 2005; GVA Kidder Mathews analysis, 2010

Terminal 91 Development Options Study
Page 40
1,046 OUEs per year.
Forecast
The graph, Exhibit O-22, shows the amount of new space
delivered to the market since 2000, in grey. The blue bars
represent the amount of space absorbed by the market
each year. The trend line, in red, displays the historical
and projected market vacancy. The forecast relies on the
following assumptions:
Only known projects that are under construction or likely to
be completed over the next five years are included in future
deliveries.
1. Demolitions and conversions are based on ten the
ten year historic average.
2. The amount of office space per office using
employee is assumed to remain at 337 square feet
though 2018.
3. Office using employment grown by 261 OUE’s per
quarter. This matches the growth rate outlined in the
previous section.
Based on these assumptions, the analysis suggests that
vacancy rates will decrease to around 5.2% by second
quarter 2018. It is generally accepted that a 5% vacancy
rate represents a market in equilibrium; it is also at this point
where it once again makes sense to build additional office
product.
5% 6% 7% 8% 9% 10% 11% 12% 13% 14% 15% 16% 17% 18% 19% 20% 21% 22%
-800
-600
-400
-200
0
200
400
600
800
1,000
1,200
1,400
2001
1Q
20
02 1
Q
2003
1Q
20
04 1
Q
2005
1Q
20
06 1
Q
2007
1Q
20
08 1
Q
2009
1Q
20
10 1
Q
2011
1Q
20
12 1
Q
2013
1Q
20
14 1
Q
2015
1Q
20
16 1
Q
2017
1Q
20
18 1
Q
Thou
sand
SF
PMA OFFICE FORECAST
NET DELIVERIES NET ABSORPTION VAC RATE
Exhibit O-22
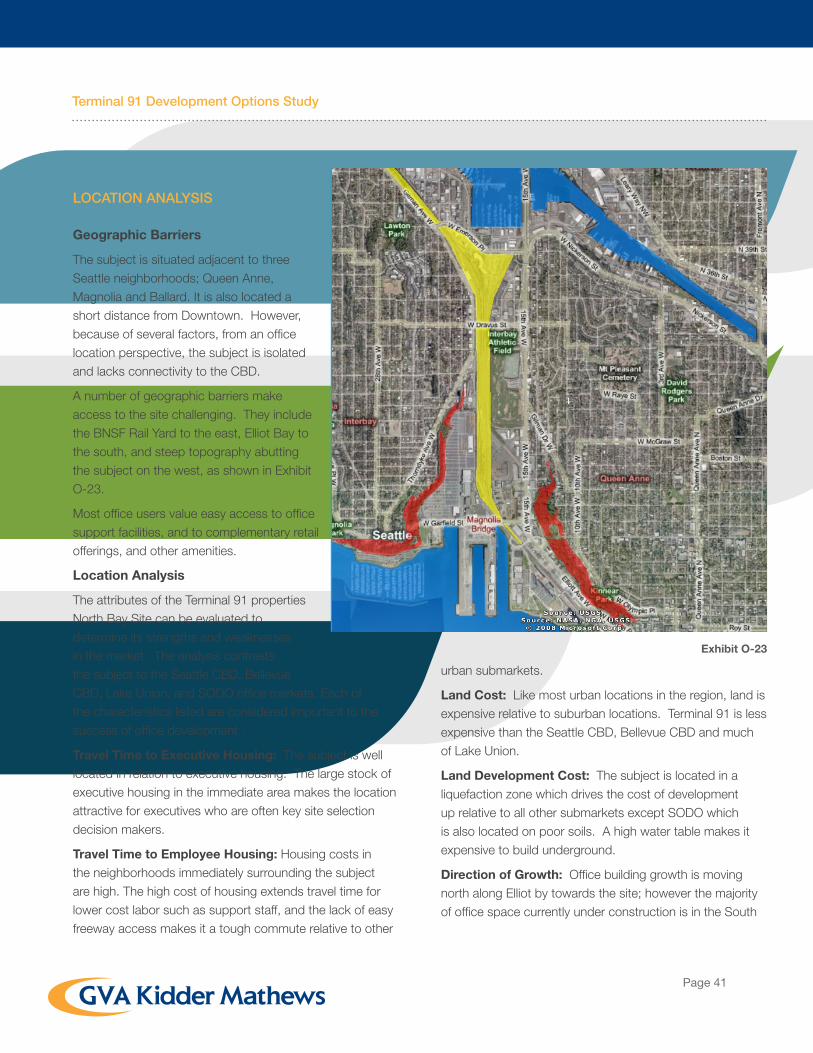
Terminal 91 Development Options Study
Page 41
LOCATION ANALYSIS
Geographic Barriers
The subject is situated adjacent to three
Seattle neighborhoods; Queen Anne,
Magnolia and Ballard. It is also located a
short distance from Downtown. However,
because of several factors, from an office
location perspective, the subject is isolated
and lacks connectivity to the CBD.
A number of geographic barriers make
access to the site challenging. They include
the BNSF Rail Yard to the east, Elliot Bay to
the south, and steep topography abutting
the subject on the west, as shown in Exhibit
O-23.
Most office users value easy access to office
support facilities, and to complementary retail
offerings, and other amenities.
Location Analysis
The attributes of the Terminal 91 properties
North Bay Site can be evaluated to
determine its strengths and weaknesses
in the market. The analysis contrasts
the subject to the Seattle CBD, Bellevue
CBD, Lake Union, and SODO office markets. Each of
the characteristics listed are considered important to the
success of office development .
Travel Time to Executive Housing: The subject is well
located in relation to executive housing. The large stock of
executive housing in the immediate area makes the location
attractive for executives who are often key site selection
decision makers.
Travel Time to Employee Housing: Housing costs in
the neighborhoods immediately surrounding the subject
are high. The high cost of housing extends travel time for
lower cost labor such as support staff, and the lack of easy
freeway access makes it a tough commute relative to other
urban submarkets.
Land Cost: Like most urban locations in the region, land is
expensive relative to suburban locations. Terminal 91 is less
expensive than the Seattle CBD, Bellevue CBD and much
of Lake Union.
Land Development Cost: The subject is located in a
liquefaction zone which drives the cost of development
up relative to all other submarkets except SODO which
is also located on poor soils. A high water table makes it
expensive to build underground.
Direction of Growth: Office building growth is moving
north along Elliot by towards the site; however the majority
of office space currently under construction is in the South
Exhibit O-23

Terminal 91 Development Options Study
Page 42
Lake Union market.
Linkages to Other Offices and Support Facilities: Geographic barriers isolate the subject from office support
facilities located in the Seattle CBD. Each of the other
markets have superior access to other offices and support
facilities.
Proximity to Complementary Retail Uses: The
proximity of complimentary retail uses is efficient for
business operations and
helps to attract and retain
employees. The site is
isolated from complimentary
retail uses when compared
to the other markets.
Public Planning and Zoning: The subject zoning
is not fully supportive of
pure office development.
cThe subject zoning is more
restrictive of office uses than
any of the other markets.
Views: The West Yard
property offers views of
both the Seattle skyline and
Elliot Bay. The North Bay
property has only territorial views. The West Yard views are
superior to the other markets, unless high-rise buildings are
constructed that capture significant views. Views from the
North Bay property are inferior to the other markets.
Public Transportation: The subject is not well served by
public transit relative to other competitive submarkets. The
other markets have superior public transit service.
The table (Exhibit O-24) contrasts the Terminal 91 location
to other competing markets. . The overall score can be
used to evaluate a site to the other markets. The score
itself is not as important as the thought process used to
evaluate the characteristics.
The West Yard would make a good location for a modest
amount of office space. There is available land, great
views, good proximity to executive housing and reasonable
proximity to employee housing. The North Bay property is a
challenging location for office buildings. Among its biggest
challenge is the sites proximity to adjoining industrial uses
that would be incompatible with people intensive office
uses.
Exhibit O-24
Comparative Location Analysis
Subject Seattle CBD Bellevue CBD Lake Union
SODO
Travel Time to Emlpoyee Housing 3 4 4 4 4
Travel Time to Executive housing 4 5 5 5 3
Land Cost 3 2 2 3 4
Land Development Cost 2 4 4 3 2
Public Planning and Zoning 1 3 3 3 2
Direction of Multistory office Growth 3 4 5 4 2
Linkages to other offices and support Facilities 2 5 5 4 2
Proximity to complementary retail uses 2 5 4 4 1
Views 5 4 4 4 2
Public Transportation 2 5 3 4 2
Total 27 41 39 38 24

Terminal 91 Development Options Study
Page 43
CONCLUSION
Buildings in the 74 million square foot Seattle office market
are currently 13% vacant, representing almost 10 million
square feet of space. Asking rental rates are down more
than 15% from the peak of the market in 2007. Vacancy
in the submarket market area, made up of the Magnolia,
Queen Anne, Interbay, Ballard, Freemont, and Lake Union,
is currently 12%. The Class A vacancy in the submarket is
27%, attributable mostly to a few empty buildings. Recent
demand for office space in the submarket has been for
waterfront or water-proximate property, a trend that is
likely to continue given its scarcity. Projections, based on
historical events, suggest that it may be five to seven years
until the development of new speculative office space is
feasible in Seattle or in the submarket.
Subject to demand and zoning, the West Yard is the
best location for office development at on the Terminal
91 properties. Its location is unique, it offers great views,
is somewhat removed from the industrial impact in the
neighborhood, and has good proximity to executive and
employee housing. The North Bay property is less people
friendly with the adjoining industrial uses generating
vehicular, noise, and visual impacts.

Terminal 91 Development Options Study
Page 44
BIOTECH MarketA Biotech/Lab Space building is built-out for extensive
laboratory use. Such space may have, but is not limited
to, extensive steel frame with concrete floors to handle
additional floor loading, extremely high floor separations
allowing extensive mechanical equipment “runs” above the
suspended ceiling and below the floor structure above,
high speed data access, heavy duty HVAC, higher roof
loading capacity to support heavy air handling equipment,
and enhanced environmental control technology. This
space may also be designated a “clean room” for
handling materials with high tolerances and contamination
requirements.
MARKET OVERVIEW
Although smaller than other leading biotechnology
cluster cities, the Seattle metro area remains a fast
growing and vibrant cluster known for its research and
entrepreneurial spirit. The market is anchored by the
University of Washington (UW) and the Fred Hutchinson
Cancer Research Center (FHCRC) both of which are major
recipients of National Institutes of Health (NIH) research
funding. The NIH is the major federal government source
of medical research funding in the U.S. According to the
Washington Biotechnology and Biomedical Association,
more than one-third of the biotechnology and medical
device firms in the state are founded on technologies
developed at these institutions. The area has an
abundance of startup and early stage firms but is somewhat
lacking in larger, established firms as several companies
have been acquired.
Manufacturing
The Biotech section of this report focuses on lab and
medical technology space. Related manufacturing plants
do not necessarily need to be co-located with a company’s
headquarters or research facilities. In deciding where to
locate a manufacturing plant, different site selection factors
come into play. The cost of land, utilities, and labor are the
primary driving factors. These are the same market forces
that are at work in all industrial manufacturing markets;
addressed in the Industrial Market section of this report.
Inventory
The total inventory of lab and medical technology space in
the region is about 5.8 million square feet. Inventory is up
by about 1.8 million square feet from 2005 when inventory
was estimated to be approximately 4 million square
feet. Since 1990 when total inventory in the region was
estimated to be approximately 2.1 million square feet, the
amount of space has more than doubled.
The majority of lab and medical technology space in the
region is located in Seattle. Of the total 5.8 million square
feet of regional inventory, 4.8 million is located in Seattle.
The remaining 1 million square feet is mostly located on the
eastside which includes Bothell.
New Construction, Proposed and Under Construction
There are several life science developers including
Alexandria Real Estate Equities, Touchstone, BioMed Realty
Trust, Martin Selig Real Estate and others who have shell
properties that can be renovated into lab space or who
have sites designed to accommodate lab and medical
technology development. Many of these projects are
already entitled with Seattle’s Department of Planning and
Development and can be brought to market in 12 months
(entitled, shell ready and renovation properties) to 24
months (new construction).
The present financial crisis however, which began in fall
2008 has taken its toll on both users and developers of
lab and medical technology space. Financing for existing
and new life science companies has become difficult
to secure; the same is true for developers of lab and
medical technology space as their traditional sources of
development capital have dried-up and investors and
lenders have dramatically changed their underwriting
criteria. It is uncertain how long this situation will impact
tenant demand or new development.

Terminal 91 Development Options Study
Page 45
As highlighted below, Alexandria Real Estate Equities and
Biomed Realty Trust have recently completed and have
permitted new Biotech projects in Seattle.
• Alexandria Real Estate Equities’ 115,000 sq ft 199
Blaine St. Development was recently delivered in
January of 2010.
• Alexandria’s five-story, 110,000 sq ft 1165 Eastlake
addition/renovation project is currently in permitting
process.
• Biomed Realty Trust’s six story 93,000 sq ft Fairview
Research Center was recently completed. They have
also acquired adjacent land and will increase the size
the project by up 100,000 sq ft in a second phase as
dictated by demand.
Vacancy and Absorption
The vacancy rate for lab and medical technology space
in Seattle is estimated to be below 3%. There are several
medium-to-large size transactions currently in the works
that will effectively eliminate any existing second generation
space in Seattle. By comparison, vacancy in the Eastside
market is currently pushing 40%.
Largest Lease Signings
Gilead moved into its new home at Alexandria’s 199 Blaine
building, Dendreon inked a deal at Selig’s new 635/645
Elliott Avenue project, Acucela leased administrative space
in Russell Investments Center, and Seattle Children’s
Hospital leased office space in Touchstone’s West Eight
building.
Rental Rates
Asking rental rates for second generation Class A lab and
medical technology space are currently between $30.00
and $40.00, per rentable square foot, per year, triple net.
When available, first generation space in Seattle will run
between $50.00 and $60.00 per rentable square foot, per
year, triple net. Concessions offered by landlords, (e.g.,
abated base rent, rent phase-ins, pocket space, tenant
improvement allowances, etc.) may lower the “effective”
rate paid over the term from the $50.00 to $60.00 “face
rate” contained in the lease.
Exhibit B-1 lists rent comparisons for recently completed
transactions. Each transaction involves rental rate
escalations, concessions, and tenant improvement
contributions that impact the effective rental rate the tenant
will actually pay.
Building Name/Type & Location
BuildingAge, Size,% of total
Current Occ.Office/Admin.Lab/Product.
BeginExpire
TermMo.
Rent$/sf/yr
Escalations Tis
NanostringFairview Research CenterNew Construction Lake Union
200895,849 18%
17,639 7,056 10,583
100%40%60%
Dec-08Nov-13
60 $56 NNN 3.5%/yr $2,204,875 $125
Kineta307 Westlake(sublease from SBRI)
2004115,060 4%
5,010 1,503 3,507
100%30%70%
Feb-08Jan-10
24 $48 NNN 3%/yr $0
Allozyne1600 FairviewNew Construction/Renovation
200827,991 46%
12,796 1,503 3,507
100%12%27%
Apr-08Mar-18
120 $49 NNN 3%-5%CPI
$1,599,500$125
Novo NordiskFairview Research CenterNew Construction Lake Union
200895,849 41%
38,900 13,615 25,285
100%35%65%
Apr-09Mar-19
120 $51 NNN 3%/yr $6,029,500$155
Gilead199 BlaineNew Construction Lake Union
200995,849 115%
109,760 43,904 65,856
100%40%60%
Dec-08Nov-14
72 $56 NNN 3%/yr $13,720,000$125
Exhibit B-1

Terminal 91 Development Options Study
Page 46
Forecast
The Puget Sound life sciences industry has reached a
“critical mass” and should experience strong growth even
if punctuated by the occasional downturn that reflects
the risky nature of the business and the overall economic
conditions of the current (ending) recession. The sheer
number of firms in the region has achieved a level that
establishes Seattle as one of the major life science research
markets in the nation. A number of companies are
maturing with at least one product that has demonstrated
significant effectiveness in Phase II or Phase III trials. Also,
it has prominent research institutions and an entrepreneurial
culture that has led to the creation and development of
successful firms including Immunex (acquired by Amgen),
one of the most successful early biotechnology firms.
Finally, the high-quality of life helps recruit and retain
scientists and employees. The Seattle biotechnology
market will continue to thrive in the long run. The demand
for biotechnology laboratory and office space will continue
to grow in the local real estate market even if relatively small
compared with other real estate categories.
LOCATION ANALYSIS
The attributes of the Terminal 91 properties can be
evaluated to determine its strengths and weaknesses
in the market. The analysis contrasts the subject to the
entire Eastside, Bothell, and the Lake Union/Denny Triangle
biotech markets. Each of the characteristics listed are
considered important to the success of the development of
biotech space.
Travel Time to Executive Housing: The subject is well
located in relation to executive housing. The large stock of
executive housing in the immediate area makes the location
attractive to executives who are often key site selection
decision makers. The subject could be considered equal to
the competing markets.
Travel Time to Employee Housing: Housing costs in the
neighborhoods immediately surrounding the subject are
high. The high cost of housing extends travel time for lower
cost labor such as support staff.
Land Cost: The Eastside has a slight advantage over the
subject in terms of access to lower cost labor.
Development Cost: The subject is located in a
liquefaction zone which increases the cost of development.
A high water table in the area also drives up the cost of
development. The competing markets are at an advantage,
with better soil conditions.
Direction of Growth: Although a few projects have begun
to locate closer to the subject the majority of growth
continues to cluster around in the Lake Union/Denny
Triangle submarket. The Lake Union/Denny Triangle is “the”
location when it comes to biotech.
Linkages to Other Offices and Support Facilities: The
subject is at a competitive disadvantage when compared
to the competing markets. While the subject is with
reasonable proximity of the Amgen’s Helix Campus, the
location is considered a fringe location and lacks support
facilities.
Proximity to Complementary Retail Uses: Employees
and employers value proximity to shopping and dining
offerings. Close proximity to retail amenities saves travel
time and increases employee satisfaction. The subject is at
a disadvantage compared to the competing markets.
Public Planning and Zoning: The zoning code allows
medical technology, research, and development space at
Terminal 91. However, freestanding office space is limited to
10,000 square feet unless it is an accessory use.
Views: The West Yard property offers views of both the
Seattle skyline and Elliot Bay. The North Bay property has
only territorial views. The West Yard views are superior
to the other markets, unless high-rise buildings are
constructed that capture significant views. Views from the
North Bay property are inferior to the other markets.
Public Transportation: The subject is not currently well
served by public transit. Bothell’s transit service is similar
to the subject’s and the other markets have superior transit
service.
Parking Cost: Parking In certain Eastside locations and in
Bothell parking is free. In other Eastside locations parking is

Terminal 91 Development Options Study
Page 47
more expensive. In the Lake Union/Denny Triangle market
the cost of parking is likely greater than is would be at
the subject. The subject may be in a position to create a
competitive advantage by providing more parking at a more
competitive rate than available in other markets.
Access to Major Airport: In terms of access to SeaTac
International Airport, the subject
is at a competitive advantage
compared to most of the Eastside,
but at a disadvantage when
compared to the Lake Union/Denny
Triangle market.
Proximity to Educational Institutions: AThe subject is
compares well when contrasted to
Eastside locations and proximity
to major educational institutions.
Seattle’s biotech space market,
centered in the market, evolved, in
part, due to its proximity to the UW
and Fred Hutch. While there are
exceptions, biotech workers like
to be within close proximity of their
collegues and the UW and Fred
Hutch.
Noise/Vibration: The North Bay property, with its
proximity to the rail yard and other industrial activity put it
at a competitive disadvantage. An disadvantage that can
be overcome through technology, just as Immunex/Amgen
did at the their Helix Campus. The West Yard is subject
to noise stemming from the adjoining seaport terminal,
however, it is less prone to noise and vibration than is the
North Bay property. The competing markets do not have
significant noise and vibration issues.
Quantitative Analysis: The attributes of the Terminal 91
properties can be evaluated to determine its strengths
and weaknesses of the location in the market. Exhibit
B-2 compares the subject to competing markets from a
location perspective. Each of the characteristics listed are
considered important to the success of a development.
Given each firm has it’s own site selection preferences, the
score itself is not as important as the thought process used
to evaluate the characteristics.
Location Summary
The heart of region’s biotech hub is located in the Lake
Union/Denny Triangle market. The subject is located on
the periphery of this market and other users have chosen
the neighborhood. The Terminal 91 properties are at a
competitive when compared to the all of the Eastside and
the Bothell submarket. The subject lacks proximity to major
education institutions, a significant grouping of other biotech
firms, support amenities, an good pedestrian and vehicular
access.
Exhibit B-2
Comparative Location Analysis
Subject Eastside Bothell Lake Union/Denny Triangle
Travel Time to Employee Housing 3 3 3 3
Travel Time to Executive housing 5 5 3 5
Land Cost 3 3 5 2
Development Cost 2 3 4 3
Public Planning and Zoning 4 3 5 5
Direction Life Sciences Growth 3 2 3 5
Linkages to Other Offices and Support Facilities 3 2 3 5
Proximity to Complementary Retail Uses 3 3 3 4
Views 5 3 3 4
Public Transportation 3 3 2 4
Parking Cost 3 3 5 3
Access To Major Airport 3 2 2 4
Proximity to Educational Institution 4 4 3 5
Noise/Vibration 2 4 4 4

Terminal 91 Development Options Study
Page 48
CONCLUSION
In the Seattle lab and medical technology space market
there is approximately 4.8 million square feet of inventory;
the majority of this inventory is in the Lake Union/Denny
Triangle submarket.
The vacancy rate for lab and medical technology space
in Seattle is estimated to be below 3%. By comparison,
vacancy in the Eastside market is currently pushing 40%.
If Biotech continues to grow in the region, demand will likely
spur a new round of development in Seattle. The subject
is unlikely to benefit from any short term demand however,
as there are several life science developers with property
located in more desirable areas. They include Alexandria
Real Estate Equities, Touchstone, BioMed Realty Trust,
and Martin Selig Real Estate, each with shell properties
that can be transformed into first class lab product, or with
sites that can accommodate lab and medical technology
development. One such example is the Troy Laundry
Block, located in the heart of Lake Union where up to
800,000 square feet of space could be developed. These
development opportunities likely have the capacity to meet
the demand for biotech space for the next ten years.
Although rare, large users similar to Amgen require large
amounts of contiguous space. For these users the subject
is one of the largest contiguous development parcels
located in the city of Seattle.

Terminal 91 Development Options Study
Page 49
Retail Market A Retail property’s primary intended use is to promote,
distribute or sell products and services to the general public.
It will often be in high traffic or easily accessible areas. Retail
buildings are configured for the display of merchandise or
the interaction of company sales personnel with others.
Retail buildings can be used for various sales opportunities,
including, but not limited to, stand-alone (convenience
stores to department stores), store fronts, strip centers (no
anchors), neighborhood, community, regional, and super-
regional malls, power centers, factory outlet centers, and
fashion or specialty centers.
A Big Box Store is a large stand-alone store that specializes
in a single line of products, such as home improvements,
toys, or office supplies; no-frills discount stores that sell in
volume and category killers are often big box stores.
SEATTLE RETAIL MARKET
For the purposes of this study, the City of Seattle represents
an appropriate Secondary Market Area (SMA).
In the SMA there are there are 3,690 buildings measuring
40.3 million square feet of retail space, representing
approximately 40% of the existing retail space in the King
County as a whole.
As of third quarter 2010 vacancy in the SMA stands at 4%,
representing 1.6 million square feet of vacant space. By
comparison, retail vacancy currently is 6% in the County as
a whole. Asking rental rates in the SMA average $20.42 per
square foot, per year, triple net; by comparison rental rates
are currently $19.53 in the County. For buildings built in the
SMA since 2000, the average rental rate is currently $26.36
per square foot, triple net.
Demographics
In 2000 the population in the City of Seattle was 563,374,
in 2010 the total is estimated to be 614,161; it is projected
to increase by 32,159, to 646,320 in 2015. The average
annual rate of growth between 2000 and 2010 was .86%,
SEATTLE TOTAL POPULATION
0
100,000
200,000
300,000
400,000
500,000
600,000
700,000
2015201020001990
Exhibit R-1
SEATTLE TOTAL HOUSEHOLDS
0
100,000
200,000
300,000
400,000
2015201020001990
Exhibit R-2
SEATTLE MEDIAN HOUSEHOLD INCOME
0
20
40
60
80
2015201020001990
$79,650$64,294$45,760$29,352
Exhibit R-3

Terminal 91 Development Options Study
Page 50
and between 2010 and 2015 it is expected to be 1.03%.
Exhibit R-1 shows historical and projected population for
the SMA.
The total employee population (daytime
population), which represents all of those
employed in businesses located within the City
of Seattle, is currently estimated to be 420,630.
By sex the population is balanced, 50% males
and 50% females. By race, the population is
64% White, and 16% Asian, with the balance
made up other races. The median age is 37.7 years old
and approximately 48% of the housing in the City is owner
occupied.
In 2000 there were 258,499 households in the SMA.
In 2010 the number has increased to 285,718, and is
expected to grow to 302,470 by 2015. The average annual
growth rate between 2000 and 2010 was 1.0% per year,
and is projected to grow by 1.15% per year through 2015.
Exhibit R-2 shows the historical and projected household
population in the SMA.
As of 2010 the median household income in the SMA is
estimated to be $64,294, this figure is projected to grow
to $79,650 by 2015. The average annual rate of change
between 2000 and 2010 was 3.46% and through 2015 it
is expected to increase by 4.38% per year. The median
disposable household income is estimated to be $52,747
in 2010. Exhibit R-3 shows the changes, historical and
projected, in household income.
Retail Potential
According to CCIM’s Site to do Business, there is a total of
$9.0 billion in retail expenditures made annually in the SMA.
Of this figure $7.3 billion is in retail trade and $1.7 billion is
in food and drink. The data suggests that there is $203
million in retail expenditures that are being made outside
the trade area by the population that lives in the trade area,
commonly known as retail leakage. If food and drink, which
is experiencing an annual spending gap of $309 million
was not included retail trade surplus would be almost $513
million in the SMA.
Exhibit R-4 shows the retail sales in the area (supply) and
retail potential (demand) for goods and services.
PRIMARY MARKET AREA
The Primary Market Area (PMA) is composed of zip codes
98119 and 98199. As shown in the map (Exhibit R-5) this
area covers the neighborhoods of Magnolia, Interbay, West
Queen Ann and a portion of both North and Lower Queen
Ann. The size and shape of the PMA was influenced by
geographic barriers to access, physical site constraints
(e.g., site size, shape, and contour), and the location of
competing retail.
In the PMA there are 212 buildings measuring 1.47 million
square feet, this represents approximately 3.6% of the
Exhibit R-5
Exhibit R-4
Industry Summary Demand(Retail Potential)
Supply(Retail Sales)
Retail Gap(Demand - Supply)
Total Retail Trade and Food & Drink (NAICS 44-45, 722)
$9,199,496,093 $8,996,400,133 $203,095,960
Total Retail Trade (NAICS 44-45) $7,846,966,329 $7,334,157,741 $512,808,588
Total Food & Drink (NAICS 722) $1,352,529,764 $1,662,242,392 -$309,712,628

Terminal 91 Development Options Study
Page 51
Seattle’s total retail inventory. As shown on Exhibit R-6, the
majority of this space is concentrated in Lower Queen Ann,
Magnolia Center, along Elliot Ave W, and along 15th Ave W.
About 22% of the PMA’s total inventory, or 324,000 square
feet, has been built since 2000.
As of third quarter 2010 vacancy in the PMA was 2%,
representing 23,000 square feet of vacant space. By
comparison, vacancy currently stands at 4% in the Seattle
as a whole. According to Costar, asking rental rates in
the PMA average $20.31 per square foot, triple net; by
comparison rental rates are currently $20.42 in Seattle. For
buildings built in the PMA since 2000, the average rental
rate is currently $30.65 per square foot, triple net; this
compares to $26.36 in the Seattle as a whole.
Demographics
In 2000, the population in the PMA was 39,957, and in
2010 the total is estimated to be 41,995. By 2014 the
population is projected to increase by 1,546 people, to
43,541. The annual rate of growth from 2000 to 2010
was .50%, and from 2010 to 2015 it is forecasted to be
.72%. Exhibit R-7 shows the PMA historical and projected
changes in population in the past.
The total employee population (also referred to as the
daytime population), which represents all of those employed
in businesses located within the PMA, is currently 21,692.
Similar to the City as a whole, by sex the population is
balanced, with 48% males and 52% females. By race, the
population is 83% White, and 7% Asian, with the balance
made up other races. The median age is slightly higher
than the City as a whole at 38.7 years old. Approximately
50% of the housing in the PMA is owner occupied.
In 2000, there were 19,999 households in the PMA.
In 2010 the number has increased to 21,340 and is
Exhibit R-6
PMA TOTAL POPULATION
34,000
36,000
38,000
40,000
42,000
44,000
2015201020001990
Exhibit R-7
SEATTLE TOTAL HOUSEHOLDS
0
100,000
200,000
300,000
400,000
2015201020001990
Exhibit R-8

Terminal 91 Development Options Study
Page 52
expected to grow to 22,232 by 2015. The annual growth
rate between 2000 and 2010 was .65% per year, and is
projected to grow by 0.6% per year through 2015. Exhibit
R-8 shows changes in the total household income.
As of 2010 the estimated median household income in
the PMA is $76,408. This figure is projected to grow by
$19,773 to $96,181, by 2015. The annual rate of change
between 2000 and 2010 was 3.5%, and through 2015 it
is expected to increase by 4.7% per year. By comparison
the Median household income in the City, as of 2010 is
only $64,294. The median disposable household income
in the PMA is estimated to be $60,076 in 2010. Exhibit R-9
presents the historical and projected changes in median
household income.
Primary Market Area Psychographics
ESRI’s market segmentation system called Community
Tapestry, classifies U.S. neighborhoods into 65 segments
based on their socioeconomic and demographic
composition. Segmentation explains customer diversity,
describes lifestyles and life stages, and incorporates a wide
range of data such as demographic, business, and market
potential data.
The top three tapestry segments in the PMA are the Metro
Renters which makes up 35% of the total population,
Laptops and Lattes which make up 15% of the population,
and Exurbanites which make up 13%of the total population.
Together these three tapestry groups represent 63% of
the total households in the PMA. The following describes
these three market segments and the characteristics of the
segments on a national basis.
Metro Renters. Young, educated singles, residents of
Metro Renters neighborhoods are just beginning their
professional careers in some of the largest U.S. cities. The
median age of 33.5 years is younger than the U.S. median
of 36.9 years. Approximately 30 percent are in their 20s;
14 percent are in their early 30s. This younger population is
also more diverse than the U.S. population.
The median household income is $59,197 and rising.
Approximately 60 percent of employed residents work in
professional and management occupations, most in the
service industry sector. More than one in four Metro Renters
residents aged 25 years or older holds a graduate degree;
one in three has earned a bachelor’s degree. Approximately
90 percent of this group are housed apartments.
Because they rent, “home and hearth” products are low
priority, although they will buy new furniture from stores
such as Crate & Barrel or Pier One Imports. Most of
them have renter’s insurance. They buy clothes and other
merchandise from traditional stores or online from favorites
such as Banana Republic, Gap, Nordstrom, Amazon.com,
and Barnesandnoble.com. They take their clothes to dry
PMA MEDIAN HOUSEHOLD INCOME
0
20,000
40,000
60,000
80,000
100,000
2015201020001990
$96,181$76,408$53,659$34,029
Exhibit R-9

Terminal 91 Development Options Study
Page 53
cleaners. Active Metro Renters residents work out regularly
at clubs, play tennis and volleyball, practice yoga, ski, and
jog. They take advantage of their urban milieu; they go
dancing, visit museums, attend classical or rock concerts,
go to karaoke nights and the movies, and eat out. Painting
and drawing are favorite hobbies. Residents enjoy traveling
domestically and overseas and drinking domestic and
imported beer and wine.
They read two or more daily newspapers; history books;
and airline, fashion, epicurean, travel, and business/finance
magazines. They listen to alternative, jazz, classical music,
all-news, and public radio. They seldom watch TV; most
households own only one set so they can watch movies
and news programs. They rent foreign and classic films on
DVD.
They go online frequently to look for jobs, make travel
arrangements, download music, research real estate, watch
videos, and shop. Many buy their PCs online; they prefer
laptops, although many also own PDAs. Politically, these
neighborhoods are liberal.
Trendsetters. On the cutting edge of urban style,
Trendsetters residents are young, diverse, and mobile. More
than half the households are singles who live alone or share
the rent with a roommate. Families comprise the remainder.
With a median age of 35.3 years, this segment is slightly
younger than the U.S. median. Ethnically diverse, more than
10 percent of the residents are Asian, and 25 percent are
Hispanic; both percentages are well above those of the U.S.
These residents are educated professionals who work in
substantive jobs. Eighteen percent of the residents who
are aged 25 years and older hold a graduate degree, 46
percent have earned a bachelor’s degree, and 70 percent
have attended college. The median household income is
$63,412; the median net worth is $44,554. Wages account
for most of the earned income; however, other sources
include interest, dividends, rental properties, and self-
employment business ventures.
Seventy-five percent of these neighborhoods are located on
the West Coast; the other 25 percent are in the Northeast.
Not ready for homeowner responsibilities, sixty-eight
percent rent apartments in upscale, multiunit settlements
in older urban districts. The average gross rent is one-third
higher than the U.S. average. Single-family homes and
townhouses comprise the remainder of the housing types.
Most of the housing was built before 1960. The median
home value is $431,472. Because public transportation is
so readily available, 18 percent of the households don’t own
a vehicle.
Laptops and Lattes. With no homeownership or child-
rearing responsibilities, residents of Laptops and Lattes
neighborhoods enjoy single life in the big city. Most
households are singles who live alone or with a roommate.
The average household size remains constant at 1.8. With
a median age of 38.6 years; these residents are slightly
older than the U.S. median of 36.9 years.
This segment is affluent; the median household income
of $98,606 supports these residents. Laptops and Lattes
residents are highly educated. More than 70 percent of
residents aged 25 years and older hold a bachelor’s or
graduate degree.
Laptops and Lattes residents love city life and prefer to live
in major metropolitan areas. Because of their lifestyle or
locale, they are more likely to rent than own their homes.
The average gross rent is 85 percent higher than the U.S.
level, third highest of the Tapestry segments. The median
home value is $639,896. Typical of city dwellers, 30
percent do not own a vehicle (three times the national level).
Cosmopolitan, connected, and politically liberal, Laptops
and Lattes residents rely on their Web-enabled cell phones
instead of laptops to communicate when they’re on the
go. They go online to check e-mail, trade and track
investments, review the latest news, arrange travel plans,
and shop on sites such as amazon.com, ebay.com, and
barnesandnoble.com. They also order items by phone.
These residents travel, especially abroad, and enjoy a
variety of vacations, such as backpacking, hiking, and
beach trips. They stay at upscale hotels and rent cars when
on vacation. A typical resident owns renter’s insurance
policies and uses dry cleaning services frequently.
Laptops and Lattes residents go to the movies, the theater,

Terminal 91 Development Options Study
Page 54
dance performances, rock concerts, museums, bars,
nightclubs, baseball and football games, and professional
basketball games. They watch foreign films or movie
classics on DVD and news and music channels on cable
TV. Saturday Night Live is a favorite program. They eat out
frequently and take adult education classes. They shop at
Target for essentials and luxuries at high-end department
and home stores.
Residents exercise regularly at a health club and practice
yoga, go downhill skiing, play tennis, jog, and bike. When
they listen to the radio, they have a strong preference for
classical music and all-news programs. They also listen
to public radio and contribute to PBS. They read two or
more daily newspapers; a variety of books such as history,
biographies, and self-help; and travel, epicurean, airline,
fashion, finance, and business magazines. They tend to
buy organic and low fat/high fiber food. They eat nutrition/
energy bars and take vitamins regularly. They get involved in
community activities, write to elected officials, write articles
that are published, and participate in environmental groups.
Retail Potential
There is a total of $836 million in retail expenditures made
annually in the PMA. Of this figure $713 million is in retail
trade and $123 million is in food and drink. The data
suggests there is $600 million in retail leakage in the PMA
representing a leakage factor of over 76%.
Exhibit R-10 shows the retail sales in the area (supply) and
retail potential (demand) for goods and services.
RETAIL LOCATION ANALYSIS
The subject is situated between two of Seattle’s most
affluent neighborhoods; Queen Anne and Magnolia. It is
also located a short distance from Downtown and Ballard.
However, because of several factors, from a retail location
perspective, the subject is isolated and lacks arterial street
frontage.
As depicted on Exhibit R-11, a number of
geographic barriers make access and visibility
to the site challenging. They include the BNSF
Rail Yard to the east, Elliot Bay to the south,
and steep topography abutting the subject on
the west. The barriers stand in the way of easy
access from the key consumer bases located in
the Magnolia and Queen Anne Neighborhoods. Exhibit R-10
Industry Summary Demand(Retail Potential)
Supply(Retail Sales)
Retail Gap(Demand - Supply)
Total Retail Trade and Food & Drink (NAICS 44-45, 722)
$836,153,849 $236,123,051 $600,030,798
Total Retail Trade (NAICS 44-45) $712,871,903 $180,568,817 $532,303,086
Total Food & Drink (NAICS 722) $123,281,946 $55,554,234 $67,727,712
Exhibit R-11

Terminal 91 Development Options Study
Page 55
Vehicular Access and Visibility
Most retailers dearly value visibility and traffic, be it
pedestrian or vehicular. The subject has very little
pedestrian traffic and the geographic barriers substantially
limit visibility from main arterials.
The site is visible, but not obviously accessible from
the Magnolia Bridge which sees daily traffic counts of
approximately 17,000 cars per day. Visibility from 15th
Avenue West, which has a daily traffic volume of almost
40,000 cars per day, is not easy and access is circuitous.
Retail signage located on the site would need to be very
large to alert and attract potential customers.
There are two categories of retail tenants that may not
be as impacted by the access issues associated with the
North Bay property. The first is local retail, such as a deli
or convenience store , that serve the daytime working
population in the immediate area. The second is destination
retailer, like Costco or Walmart, that can draw customers
from long distances to locations where access and visibility
are not ideal. It should be noted, a large format retailers
typically need 10 to 15 acres of land on which to locate
a store. While there may only be a select property or
combination of properties can meet such a requirement
in the area, none are currently available. If for example, a
property or properties were available along 15th Avenue
NW, the location would have superior vehicular access and
visibility.
CONCLUSION
Despite the current economic downturn, the subject’s
Primary Market Area (PMA) remains healthy. Only 2% of
the PMA’s 1.5 million square feet of retail office inventory
is vacant. To put this in perspective, vacancy is currently
4% in Seattle, and market participants generally view 5%
vacancy as an indicator that a market is in equilibrium.
Asking rental rates PMA are $20.31 per square foot, triple
net, by comparison rental rates are currently $20.42 in
Seattle. In space built in the PMA since 2000, rental rates
are currently $30.65 per square foot, triple net.
The population living within the PMA is currently 41,995
and is expected to grow by 1,546, to 43,541 people by
2015. This population has a median household income
of $76,408, more than $12,000 higher than Seattle as a
whole, which has a median household income of $64,294.
Median household income in the PMA is expected to grow
by almost $20,000, to $96,181 by the end of 2015. Of
the total $836 million in annual retail expenditures made
annually in the PMA, $600 million is spent outside the PMA,
representing a leakage factor of more than 76%.
Significant physical barriers including steep topography,
a rail yard, and Elliot Bay isolate the subject from the
surrounding neighborhoods, which limits its ability capture
the retail potential described in the preceding paragraphs.
To mitigate this effective improved signage and increased
ease of access must be incorporated into the site design.
There is significant demand for retail in the immediate area
surrounding the subject, Given the access and visibility
issues associated with the Terminal 91 property the likely
retail users are from two market segments. First, it is
reasonable to suggest that a modest amount of service
retail that caters to the businesses in the immediate area
would be successful; 2,500 to 10,000 square feet of
building area. Secondly, there is substantial demand for
destination retail, in the form of big box stores. There
are multiple operators that would locate in the area if
appropriately zoned land was available.
With the typical store measuring 150,000 square feet
located on 15 acres of land, North Bay has the capacity to
accommodate two or more operators.

Terminal 91 Development Options Study
Page 56
Land The subject property is zoned IG1 U/45 which is the most
restrictive industrial zoning in the City of Seattle. In 2008
a zoning change was enacted that reduced the amount of
office space allowed on IG zoned properties.
LAND VALUE
The King County Assessor suggests that land values
for IG1U/45’ zoned properties have increased from a
few dollars in 1982 to almost $60 per square foot today.
Exhibit L-1 trends the average assessed values based on
a small sampling of IGU/45 zoned properties. Beginning
in 2000, the rate of increase in assessed values changed
dramatically.
Exhibit L-2 is a list of IG sales transactions that are currently
used by market participants to estimate value of similarly
zoned property. As shown, values range from $37 to $71
per square foot.
All of the sales listed above took place prior to the 2008
zoning change which restricted the amount of office space
allowed in IG zones.
It should also be noted that transactions 1,2,3,4 and 6 took
place at the height of the market, mid 2006 through mid
2008. Sale number 1, 5, and 6 are more easily accessible
than the subject due to their proximity to 15th Avenue;
and sites 1, 2, 4, 5, and 6 are have superior zoning to the
subject.
Comparable number two, at $37 per square foot, is closest
in terms of both size and location to the subject, though it
took place before the down zone and market correction.
The most recent sale at Salmon Bay Marine Center is
expected to close in the next few weeks. The site was
permitted and approved for a 30,000 square foot office
building, that the developer decided not to build. The buyer
does not intend to build the building, but apparently hopes
to recover some of the density previously permitted on the
site.
BINMIC ASSESSED VALUES 1982 - 2010
$0
$10
$20
$30
$40
$50
$60
$70
2010
2008
2006
2004
2002
2000
1998
1996
1994
1992
1990
1988
1986
1984
1982
Exhibit L-1
Exhibit L-2
Sale Name/ Location Sale Date
Adj. Sale Price
Site (sf)
$/SF Land
Zoning Use
1 Development Site 1501-1515 NW Leary Way
Listing 05/17/06
$2,200,000 $1,550,000
30,614 prior sale
$71.86 $50.63
IG2 U/65 Vacant
2 Armory Site 1600 W. Armory Way
Listing 08/21/06
N/A $12,500,000
333,670 prior sale
N/A $37.46
IG2 U/45 Proposed mixed use
3 Salmon Bay Marine Center 2330 W Commodore Way
Pending 07/18/07 05/15/06
$1,600,000 $2,130,000 $1,600,000 $3,730,000
30,63345,18135,16580,346
$52.23 $47.14 $45.50 $46.42
IG1 U/45 Verticle WorldDemolish;
Lot
4 Ballard Blocks 5th Avenue W./ NW 46th Street
01/31/06
$5,100,000
83,452
$61.11 IG1 U/65 Demolish; redevelop
5 Tsubota Site 1805-1819 15th Avenue W
04/29/05
$5,500,000
131,834
$41.72 IG2 U/45 Assemblage
6 Nitty Gritty1616 West Bertona Street
3/5/2007 $3,600,000 51,000 $70.59 IG2 U/45 Vacant

Terminal 91 Development Options Study
Page 57
GROUND LEASES
Ground leases come in all shapes and sizes. Most long-
term ground leases in North America have the following
structure. Land is leased by the owner to a tenant usually
for a period of 50 years or longer. That 50 year term is
sometimes comprised of an initial ten or twenty year term
with options for two or three ten year renewals. The lease,
including options to renew, may be as long as 99 years.
Longer leases (over 99 years) are viewed as sales from a
tax perspective in the US and are seldom used as a point of
comparison.
The terms and conditions can vary significantly from
one transaction to another, making comparisons
difficult. The structure of lease terms impact the financial
outcome for each of the parties to the lease; landlord,
tenant, and lenders. The variables include, length of the
lease, mechanisms for adjusting rent, property physical
characteristics, credit risk, subordination, and location.
Land or ground leases lease transactions occur infrequently
and generally are found in four areas;
• Hawaii,
• Densely urbanized downtown areas,
• Suburban strip commercial sites,
• Silicone Valley.
Ground Lease Returns and Alternative Investments
Ground leases are based on the expectation that a return
on the landlord’s investment in its land is appropriate. The
rate of return becomes a matter of agreement between
landlord and tenant. Establishing the market rate of return
by comparing one ground lease to another is difficult at
best.
During the last thirty years of the last century it was not
uncommon to find rates of return for large scale long-term
ground leases in the 8% to 12% range. During the last
decade, interest rates dipped to 40 year lows and returns
on alternative investments dropped. Some argue that the
return a landlord can expect to receive from a ground lease
is lower now than in the past. Others argue that returns for
long-term leases, forty to fifty years in length, need to reflect
returns that are more in line with history. Otherwise the
land owner may come up short as economic times change.
Mechanisms for adjusting the rate of return as times change
may provide a means for creating fairness for both the
landlord and tenant.
Rates of return for alternative investments can provide
some perspective in understanding the current ground
lease market. Investments like government and
high quality corporate bonds offer investors low risk
investment opportunities. Returns for institutional real
estate investments such as office, industrial, apartments,
and regional malls have a higher risk profile and returns,
and represent a reference point at the higher end of the
spectrum. Lending rates for commercial real estate also
provide perspective on the risk return spectrum.
In general, larger credit tenant long-term ground leases
carry a moderate risk profile and the rates of return fall
somewhere between the returns for bonds and institutional
real estate.
The corporate and government bond average yield rates as
of December 8, 2010 are:
30-Year US Treasury Bond 4.40%.
20-Year AA Corporate Bond 4.46%
20-Year A Corporate Bond 5.51%
The overall capitalization rates indicated in the Korpacz
Real Estate Investor Survey, completed in the third quarter
of 2010, of institutional real estate products located in the
United States are presented in the table below:
Overall Capitalization Rates Average Range
CBD Office 8.01% 6.00% to 10.50%
Warehouse 8.38% 6.50% to 12.00%
Apartment 7.12% 4.50% to 11.00%
Regional Mall 7.81% 5.00% to 10.50%
Most investors purchase commercial real estate knowing
that they will receive all of the benefits of owning, including

Terminal 91 Development Options Study
Page 58
cash flow, interest and depreciation tax deductions, and
appreciation. The after tax returns for the institutional real
estate investments are higher than the rates shown in the
table above, depending on the owners tax structure and
loan terms.
Some developer’s who lease land for the purpose of
developing new buildings suggest that if the ground lease
payments are more than the cost to borrow money, they
might as well borrow the money and purchase land for the
development. Landlords would argue that the land they
are leasing is rate and accordingly justifies a premium.
Either way, the lending rate for commercial real estate
if a reference point that can be used to determine the
appropriate rate of return to the land for a ground lease.
Today the cost to borrow money for commercial real estate
investments is in the neighborhood of 6.0%.
Using bonds and institutional real estate investments
to bracket the appropriate rate of return to the land in
a ground lease situation suggest that long-term lease
rates today are negotiated in 6% to 8% range. Where
negotiations will fall within the range depends on the
participant’s long-term perspective of the future; continued
low interest rates or a return to historical norms.
Comparable Ground Lease Data
Comparable ground lease transactions can provide
perspective on establishing market lease terms and
conditions. The tables contained in the addendum to this
report present a broad range of comparable ground lease
data. The data represents groups of different types of
ground leases; Off-Airport, Industrial, Large Retail, Urban
Mixed Use, Office, Retail Pads, and Yard Storage. The data
suggests that rental rates generally fall into the 5% to 10%
range. It is instructive to look at failed leases and some of
the most common deal breakers. Subordination, lease
escalations, and special lender requirements are the most
common source of issues.
Ground Lease Perspective
Ground leases appeal to a select group of real estate
practitioners. Owner/users, most investors, and developers
prefer to own rather than lease. Ground leases are usually
most effective when the landlords property is in a unique
high demand area, such as on an airfield or adjacent to
marine transport facilities. In addition, ground leases
are most often an alternative when real estate markets
have reached their peak. The limited number of market
participants and the retention of the reversionary interest
in the property by the landlord, contribute to diminished
returns for ground leases when compared to a fee simple
disposition.
Ground leases can be attractive when a land owner’s
investment goals seek to maximize long-term cash flow
with the opportunity to regain control of the land in the
future. From the tenants perspective the opportunity
exists to control land, deduct lease payment for income
tax purposes, and possibly partner with the landlord in
improvements to the land.

Terminal 91 Development Options Study
Page 59
Highest and Best UseThe Highest and best use of land or a site as though vacant
is defined as, among all reasonable, alternative uses,
the use that yields the highest present land value, after
payments are made for labor, capital, and coordination. The
use of a property based on the assumption that the parcel
of land is vacant or can be made vacant by demolishing any
improvements.
The four criteria the highest and best use must meet are
legal permissibility, physical possibility, financial feasibility,
and maximum productivity. It is understood that this
study is taking place while one of the largest recessions
in recent history is underway. The work is completed with
the understanding that the recession is currently having a
fundamental effect on the real estate industry that is likely
to last for many years to come. The work is also done with
the understanding that real estate markets are cyclical by
nature and that recovery will occur.
LEGALLY PERMISSIBLE
The uses that are legally permissible are those uses
permitted outright by the current zoning code. The
permitted uses, as shown in Exhibit H-1, are consistent with
the intent of the zoning code to allow industrial uses.
PHYSICALLY POSSIBLE
It is physically possible to develop a wide range of uses on
the property, with a few limitations. The West Yard property
is not large enough to accommodate large format buildings,
such as modern distribution/warehouse buildings and big
box retail stores. The high water table makes constructing
below grade spaces expensive. Soil bearing capacity over
the entire site is an issue requiring foundation upgrades.
FINANCIALLY FEASIBLE
In general it is financially feasible to develop a wide range
of owner user buildings on the property, however, the
soils conditions and low water table put the property at a
competitive disadvantage, when compared to other sites
that do not have these conditions. It would be reasonable
to discount land value expectations by the extraordinary
cost to develop given the soils issues.
The financial feasibility of speculative development hinges
on cost to develop versus the achievable income potential
of a particular use. A test of financial feasibility for a range
of building types can provide perspective about which land
use(s) are maximally productive.
Land Residual Technique
The Land Residual Technique is a technique for estimating
property value. The technique is used to determine the
land value that a proposed development could support
and remain profitable. Estimates are made of the projects
expected income and the resulting value, the cost to
develop, and a given profit margin. When all of these
variables are held constant, the maximum land value that
maintains the profit margin is the achievable land value or
that value a developer can afford to pay for the land. The
results of the land residual technique can be misleading
due to the great number of assumptions that go into the
analysis. The resulting land values can vary significantly with
small changes in the input assumptions.
Agricultural Uses Aquaculture.
Commercial Uses Animal shelters and kennels, eating
establishments, entertainment uses,
food processing, craft work, laboratories,
research, development, medical services,
offices, sales, and services.
Institutions Advanced study, religious, vocational, and
fine arts.
Manufacturing Light and general.
Parks and Open Space
Residential Uses Caretakers quarters.
Storage Uses Mini-warehouses, storage, outdoor,
warehouses.
Transportation
Facilities
Cargo terminals, parking, moorage,
passenger terminals, rail, transit facilities,
vehicle storage and maintenance.
Utility Uses Communication, power plants, recycling,
salvage yards, and solid waste.
Exhibit H-1

Terminal 91 Development Options Study
Page 60
Office
As discussed earlier, the West Yard property
is not subject to the externalities that
influence the North Bay property. It is a
people oriented location and, while success
is not a given, it is a logical location for an
office uses. A scenario is analyzed where an
office building, similar to that shown in Exhibit
H-2 is developed on the West Yard.
The analysis in Exhibit H-3 shows the
expected incomes and costs to build a
4-story, 150,000 square foot office building
and parking for 300 cars. The project utilizes
the entire 3.2 acres site and includes some
structured parking.
The analysis suggests that an office building
could support land value in the range of $56
to $83 per square foot. If compared to other
office building sites that have sold recently
for approximately $100 per square foot, the
analysis appears reasonable. It is prudent to
recognize that there are a number of new empty speculative
office buildings in Seattle that are now valued at half what
they cost to construct.
Office Building
Land Residual Analysis
Income RSF/Stalls Rate Income
Office 150,000 $26.00/sf/yr 3,900,000
Parking 105,000 $0.00/sf/yr -
Gross Effective Income 3,900,000
Vacancy & Credit Loss 5.0% (195,000)
Operating Expenses $0.00, nnn -
Net Operating Income 3,705,000
Capitalized Value 7.00% $352.87/sf 52,930,000
Cost GSF/Stalls Cost/sf Total
Hard Costs
Office 150,000 $153.00 22,950,000
Parking Stalls 300 $20,000 /stall 6,000,000
Subtotal 28,950,000
Soft Costs 30.00% 8,685,000
Total Project Cost(Exclusive of Developer's Profit & Land)
37,635,000
Land
Land Area 139,392 SF
Sensitivity Analysis
Developer'sProfit
Land Residual
$/sf
0.0% $15,295,000 $109.73
5.0% $13,413,250 $96.23
10.0% $11,531,500 $82.73
15.0% $9,649,750 $69.23
20.0% $7,768,000 $55.73
25.0% $5,886,250 $42.23
Exhibit H-3
Exhibit H-2

Terminal 91 Development Options Study
Page 61
Flex
The supply and demand data indicates that there is
demand for competitively priced, low intensity, flex
space in the BINMIC market. The North Bay property
is best suited for lower intensity flex uses, given the
characteristics of the adjoining uses.
The flex scenario, represented by the image of the
building in Exhibit H-4 is developed on the North Bay
property.
Exhibit H-5 presents a scenario where a 100,000
square foot flex building that contains 50,000 square
feet of office space is developed on the site. It is
occupied by light distribution, light manufacturing, and
showroom uses, and is leased at rates that compete
with the Duwamish market. The results indicate that
the project would support land values of between $8
and $13 per square foot.
Flex Building
Land Residual Analysis
Income RSF/Stall Rate Income
Shell 100,000 $0.70/sf/mos $840,000
Office 50,000 $0.85/sf/mos 510,000
Gross Effective Income $1.13 blended 1,350,000
Vacancy & Credit Loss 5.0% (67,500)
Operating Expenses $0.00, nnn -
Net Operating Income 1,282,500
Capitalized Value 7.50% $171.00/sf $17,100,000
Cost GSF/Stall Cost/SF Total
Hard Costs
Shell 100,000 $75.00 $7,500,000
Office 50,000 $50.00 $2,500,000
Subtotal $10,000,000
Soft Costs 25.00% $2,500,000
Total Project Cost (Exclusive of Developer's Profit & Land)
$12,500,000
Land
Site Coverage 40.0% Land Area 250,000 sf
Sensitivity Analysis
Developer'sProfit
Land Residual
$/sf
0.0% $4,600,000 $18.40
5.0% $3,975,000 $15.90
10.0% $3,350,000 $13.40
15.0% $2,725,000 $10.90
20.0% $2,100,000 $8.40
25.0% $1,475,000 $5.90
Exhibit H-5
Exhibit H-4

Terminal 91 Development Options Study
Page 62
Small Industrial Building
The demand for small industrial spaces has been strong in
the BINMIC market for many years, only lessened only by
the sites proximity to work force housing, constraints on
land supply, and difficult access to I-5.
Industrial demand in BINMIC is strongest from small users.
This development scenario offers a product that caters
to this market segment by offering modern facilities with
rental rates that are competitive with the out-of-market
alternatives.
The small industrial building development scenario
assumes a building similar to the one represented in
Exhibit H-6 is constructed on the North Bay property.
The building measures 100,000 square feet, with 10%
or 10,000 square feet of office space. It is a versatile
building that can be divided into spaces that are less than
10,000 square feet. As shown in Exhibit H-7, the building
is feasible if the land is priced between $8 and $12 per
square foot.
Exhibit H-6
Small Industrial Building
Land Residual Analysis
Income Rentable Area
Rate Income
Shell 100,000 $0.70/sf/mos $840,000
Office 10,000 $0.85/sf/mos 102,000
Gross Effective Income $0.79 blended 942,000
Vacancy & Credit Loss 5.0% (47,100)
Operating Expenses $0.00, nnn -
Net Operating Income 894,900
Capitalized Value 7.00% $127.80/sf $12,780,000
Cost Gross SF Cost/SF Total
Hard Costs
Shell 100,000 $75.00 $7,500,000
Office 0 $50.00 Incl. $0
Subtotal $7,500,000
Soft Costs 20.00% $1,500,000
Total Project Cost (Exclusive of Developer's Profit & Land)
$9,000,000
Land
Site Coverage 40.0% Land Area 250,000 sf
Sensitivity Analysis
Developer'sProfit
Land Residual
$/sf
0.0% $3,780,000 $15.12
5.0% $3,330,000 $13.32
10.0% $2,880,000 $11.52
15.0% $2,430,000 $9.72
20.0% $1,980,000 $7.92
25.0% $1,530,000 $6.12
Exhibit H-7

Terminal 91 Development Options Study
Page 63
Industrial Incubator
Demand exists for appropriately priced industrial incubator
space in BINMIC. The North Bay property is well suited for
the use.
This scenario, presented in Exhibit H-8, represents a
50,000 square foot building with 7,500 square feet of
office space. The building creates the opportunity to have
as many as twenty-five spaces, each measuring 2,500
square feet. The spaces each have a small office area,
warehouse/shop space with a roll-up truck door. The
analysis shown in Exhibit H-9 suggests that the project
would support land values in the $8 to $13 range.
Big Box Retail
Principle use retail is not permitted under the current
zoning code, however, it is instructive to understand
the nature of demand for big box retail. The BINMIC
market is surrounded by two of Seattle’s high income
neighborhoods, Queen Anne and Magnolia. Demand for
big box retail is strong in BINMIC and a number of big
box retailers have expressed interest strong interest in the
area. The North Bay property is one of a very few parcels of
land that are large enough to support 150,000 to 180,000
square foot big box stores.
Historical data suggests that the use would support land
values of between $20 and $25 per square foot.
Yard Storage
The data presented in Exhibit H-10 suggests that yard
storage uses can generate between $.10 and $.20 per
square per month or $1.20 to $2.40 per square foot per
year. Unimproved properties are at the low end of the
Exhibit H-10
Yard Storage
Land Area: 435,600 sf (10.00 acres)
Mos Annual 6.00% 7.00% 8.00%
$0.10 $1.20 $20.00 $17.14 $15.00
$0.11 $1.32 $22.00 $18.86 $16.50
$0.12 $1.44 $24.00 $20.57 $18.00
$0.13 $1.56 $26.00 $22.29 $19.50
$0.14 $1.68 $28.00 $24.00 $21.00
$0.15 $1.80 $30.00 $25.71 $22.50
$0.16 $1.92 $32.00 $27.43 $24.00
$0.17 $2.04 $34.00 $29.14 $25.50
$0.18 $2.16 $36.00 $30.86 $27.00
Industrial Incubator Building
Land Residual Analysis
Income Rentable Area
Rate Income
Shell 50,000 $0.75/sf/mos $450,000
Office 7,500 $1.00/sf/mos 90,000
Gross Effective Income $0.90 blended 540,000
Vacancy & Credit Loss 5.0% (27,000)
Operating Expenses $0.00, nnn -
Net Operating Income 513,000
Capitalized Value 7.50% $136.80/sf $6,840,000
Cost Gross SF Cost/SF Total
Hard Costs
Shell 50,000 $80.00 $4,000,000
Office 7,500 $20.00 $150,000
Subtotal $4,150,000
Soft Costs 20.00% $830,000
Total Project Cost (Exclusive of Developer's Profit & Land)
$4,980,000
Land
Site Coverage 45.0% Land Area 111,111 sf
Sensitivity Analysis
Developer'sProfit
Land Residual
$/sf
0.0% $1,860,000 $16.74
5.0% $1,611,000 $14.50
10.0% $1,362,000 $12.26
15.0% $1,113,000 $10.02
20.0% $864,000 $7.78
Exhibit H-9
Exhibit H-8

Terminal 91 Development Options Study
Page 64
spectrum and improved properties with gravel, paving,
fencing and lighting are represented by the higher rental
rates. On a short term basis, a yard storage lease that
provides the landlord a 7% return on its investment
translates to a land value of approximately $25 per
square foot.
MAXIMUM PRODUCTIVITY
The real estate industry defines maximum productivity as
that use(s) that result in the highest land value. The table
below summarizes the range of land values that could
result from each of the uses that have been analyzed,
based on the land residual analysis, and other recent
activity in the market.
Land Use Land Value/sf
Office $56 to $83
Flex $8 to $13
Small Industrial $8 to $12
Industrial Incubator $8 to $12
Big Box Retail $20 to $25
Yard Storage $22 to $30
The analysis suggests that office development represents
the most productive use of the land, a reasonable
conclusion, with two exceptions. The North Bay property
is not a desirable location for pure office development,
given the nature of the adjoining uses. The West Yard
is a desirable location for office development; though it
may take a number of years for the market for speculative
office development to recover and begin to expand as a
result of job growth.
Big box retail is not permitted by the current zoning code,
but is one of the higher uses of the land. Big box retail
creates jobs and generates tax revenue. Average wages
paid by big box retailers range from $10 to $15 per hour
for Home Depot workers to an average wage of over
$16.00 per hour for Costco.
While the demand may not be adequate to absorb all of
the property, yard storage represents one of the highest
uses of the North Bay property.
Thinking about maximum productivity from a different
perspective may lead to a different outcome. If
maximum productivity is measured in the number of
jobs created, then it is possible that those uses that
result in a lower land value are more productive. The
nature of the occupancy is a determining factor. If the
industrial uses are dominated by warehouses that are
sparsely populated, job creation may be minimal. If on
the other hand, the business activity is oriented toward
manufacturing or service, the job creation could be more
robust.

Terminal 91 Development Options Study
Page 65
AddendumSUMMARY OF GROUND LEASE COMPARISONS
OFF-AIRPORT LEASES
No. Building/Address Land Area Acres/Sf
Land ValueTotal/SF
Tenant Start DateTerm Yrs
Years Rent$/Year
Escalation AnnualRate of Return
RenewalOptions
Comments/Confirmation
1 International Commerce ParkDallas/Ft Worth Texas
15.6 679,536
$2,378,376 $3.50
NA 200740
1-56-1011-1516-20
$237,838 $267,686 $301,281 $339,092
12.55%12.55%12.55%
10% None Mark Witte - DFW Airport (972) 973-4657 Reappraisal at 20 years to reestablish land value and resulting rent. Duke Realty did similar deal with the Port and tried to repackage and sell, but could not and holds in a fund with CBRE. Very desirable location w/ a raft of high profile tenants. Enter into the lease and rent starts 275 days later. Foreign trade zone and triple free zone. Major national ten-ants is the draw.
2 O'Hare Express NorthChicago, Il
40.0 1,742,400
$2,378,376 $6.00
NA 2007 1-40 $237,838 CPI 10% 2 - 10 Yr Kurt Little. (312) 228-2381. Jones Lange LaSalle. Two leases done recently and one under negotiation. Tug & cart access to airfield. Participation = 3% to 5% of gross income.
3 Colorado Springs Colorado Springs, CO
50 2,178,000
$326,700 $0.15
NA Pending60
Jan-60 $32,670 CPI 10% None John Faulkner. Rent adjustments each 5 years, based on cumulative CPI. No land reappraisal. After tenant gets a 12% return on equity, airport receives 20% of net profit. Initial land area 50 acres - land take-down option payments equal to 1% of land value per year.
4 Port of OlympiaOlympia, WA
92 4,007,520
FMV Prologis Pending40
1-40 1.25% / yr 7.12%/5.70%
25 years Detailed take down schedule - first phase is 32 acres. Additional phases under op-tion agreement. Retail portion is 7.12% and industrial is 5.7%. Port's hurdle rate is 9.5%. Usable land an issue.
5 Port of Bellingham Bellingham, WA
3.14136,950
$1,027,125 $7.50
Wood Stone
200640
1-5 Land markedto FMV each5 years
9% 5 @ 7 yrs Option to renew at 40 yrs for 7 consecu-tive 5 yr terms. This was a major eco-nomic development undertaking by the local jurisdictions. Land value adjusted to FMV every 5 yrs for first 40 yrs
6 DMCBP Rejected OfferPort of SeattleDes Moines, WA
89.003,876,840
$29,076,300 $7.50
Confiden-tial
200975
1-1011-2021-30
$569,780 $930,935 $865,524
7.50%each 5 yrs
1.96%3.20%2.98%
When buildings are transferred into a fund and after tenant receives 15% on its invested capital, landlord will receive 25% of the after tax value. Stated rents are 10 averages. NPV of 1st 30 years $9.108 million. Maximum rentable area 67 acres.
7 Pending OfferPort of SeattleDes Moines, WA
89.003,876,840
$29,076,300 $7.50
Confiden-tial
200975
1-1011-2021-30
$721,439 $1,349,317 $1,559,304
7.50%each 5 yrs
2.48%4.64%5.36%
Option payments of $20,000 per year, years 1 thru 3. NPV of 1st 30 years $10.499 million. Proposal assumes maxi-mum rentable area is 88 acres.

Terminal 91 Development Options Study
Page 66
INDUSTRIAL LEASES
No. Building/Address
Land Area Acres/Sf
Land ValueTotal/SF
Tenant Start DateTerm Yrs
Years Rent$/Year
Escalation AnnualRate of Return
RenewalOptions
Comments/Confirmation
1 Kalama River Industrial ParkPort of KalamaKalama, WA
12.5 544,500
$1,250,000 $2.30
Cameron 200750
1-10 $125,000 CPILand markedto FMV each10 years
10% 3 @ 10 yrs Mark Wilson, (360) 673-2325. Established land value - appraisal 2 years ago $100,000 per acre. Return set by Commis-sion. Land value lower than market. Rail served. Heavy Industrial. Thinks land is undervalued.
2 SchumanIndustrial ParkPort of WoodlandWoodland, WA
2.0 87,120
$160,000 $1.84
Custom Manuf.
200820
1-20 $16,000 3.00%Land value addressed each 3 yrs.
10% 5 @ 3 yrs Erica Rainford (360) 225-6555. Land value is established by Port staff. Infrastructure in place. No rail access. Lease hold tax is also accessed. Believes land may be undervalued.
3 Grain ElevatorPort of LongviewLongview, WA
100 4,356,000
$18,000,000 $4.13
Bunge & Itochu
Pending 15 $1,080,000 CPI Land markedto FMV each5 years
6% Renewalsto bring term to 50 Yrs.
George Cress (360) 425-3305, Property is rail and water served. The majority of the revenue from the proj-ect comes from other fees. Deal pending rail pending rail line land acquisitions.
LARGE RETAIL LEASES
No. Building/Address Land Area Acres/Sf
Land ValueTotal/SF
Tenant Start DateTerm Yrs
Years Rent$/Year
Escalation AnnualRate of Return
RenewalOptions
Comments/Confirmation
1 Portland RetailPortland, OR
8 348,480
FMV Confidential 200720
NA NA None 6% 10 years Renewal option for 10 years at 10% rate of return at FMV. 100,000 sf credit anchor tenant.
2 Home Depot18000 Kent Kangley RdCovington, WA
9.05394,387
$4,833,333 $12.26
Home Depot
200820
1-20 $580,000 None 12% NA Flat for 20 years, with relatively small increases in option periods.
3 Auto Dealer Site900 Maynard Ave SSeattle
3.0131,609
$9,919,055 $75.37
200660
NA NA CPI 4% 5.4% NA Lessee may purchase in year 3 or year 10. Annual CPI increases, not to exceed 4%.

Terminal 91 Development Options Study
Page 67
URBAN - MIXED USE LEASES
No. Building/Ad-dress
Land Area Acres/Sf
Land ValueTotal/SF
Tenant Start DateTerm Yrs
Years Rent$/Year
Escalation AnnualRate of Return
RenewalOptions
Comments/Confirmation
1 Central Business DistrictBellevue, WA
1.1550,000
FMV Confidential Failed Proposal60
NA NA capped at 3% per yr
6.5% 40 years Apartments and Condos. Lender wants fixed rate - no CPI adjustments. Option to renew additional 40 yrs. Lender OK with nonsubordination. Revaluation - in-use value at 25-30 yrs.
2 Edmonds School DistrictEdmonds, WA
40 1,742,400
See Note Cyprus 99 1-10 NA NA 8% Marla Miller, Edmonds School District (425) 431-7036. Each 10 years rent increases by the greater of 10% or the cumulative participa-tion rent. Participation rent = 10% of NOI. Hotel, office, retail, and residential. Landlord has administrative approval of all subleases.FMV established at the commencement of construction.
3 Suburban Seattle Seattle, WA
Bid $50,000,000 Confidential Failed Proposal99
1-56-1011-15
$2,500,000 $2,813,750 $3,166,876
12.55%12.55%
5% CPI increases not to exceed 3% per year. Revaluation at 25 years.
Ask $50,000,000 99 1-56-1011-15
$3,250,000 $3,657,875 $4,116,938
12.55%12.55%
6.5% Landlord sought revaluation every 15 years. The offer failed because the owner and the bidder could not reach an agreement and because of uncertainties about obtaining a zone reclassification.
OFFICE DEVELOPMENT LEASE
1 South SeattleSeattle, WA
2.15 93,680
$16,862,400 Confidential Failed 200880
$1,011,744 6%/8% Asking The parties involved could not agree on rate of return and escalation schedule -the deal failed. Offer at 6% ask 8%.
RETAIL - PAD LEASES
No. Building/Address Land Area Acres/Sf
Land ValueTotal/SF
Tenant Start DateTerm Yrs
Years Rent$/Year
Escalation AnnualRate of Return
RenewalOptions
Comments/Confirmation
1 Burger KingSWC of Hwy 99 E & Berg ParkwayCanby, OR
0.3917,069
$745,000 $43.65
Burger King 2007 1-56-1011-1516-20
$67,000 $73,700 $81,070 $89,177
10%10%10%
9% 4 - 5 Yr Zoning C-M, Semi-Rectangular all utilities available. Shadow anchors - Safeway, Rite Aid, Walgreens.
2 Arby'sCrossroads at Orenco Station7370 NE Butler St.Hillsboro, OR
0.6528,314
$800,000 $28.25
Arby's 2007 1-56-1011-1516-20
$80,000 $88,000 $96,800 $106,480
10%10%10%
10% 4 - 5 Yr Zoning SCC-MM, Semi-Rectan-gular, Level, all utilities available. Anchors - Kohl's, Winco Foods, OfficeMax, Gig Joes, Joanne's Fabrics, Walgreens.
3 KFC/A&WCanby PlaceSWC of Hwy 99 E & Berg ParkwayCanby, OR
0.5724,880
$700,000 $28.14
KFC/A&W 2007 1-56-1011-1516-20
$63,250 $69,575 $76,533 $84,186
10%10%10%
9% 4 - 5 Yr Zoning C-M, Semi-Rectangular all utilities available. Shadow anchors - Safeway, Rite Aid, Walgreens.
4 Burger KingArgyle Square8699 SW Burns DriveWilsonsville, OR
0.5725,000
$750,000 $30.00
Burger King 2005 1-56-1011-1516-2021-25
$75,000 $82,500 $90,750 $99,825 $109,808
10%10%10%10%
10% Several5 Yr
Zoning PDC, Rectangular, level, all utilities available. Anchors - Target, Costco, Pier 1, Petsmart, Office Depot.

Terminal 91 Development Options Study
Page 68
YARD STORAGE LAND LEASES
No. Name/Location Lease Date Term Mos. Site(sf)
Acres $/sf/mo Escalations Comments
1 VW Car storageTerminal 91201 W. GarfieldSeattle, WA
NA Month ToMonth
21,780 0.50 $0.15 AnnualCPI
Short term lease available only due to redevelopmentAdjacent to subject in Terminal 91 areaAuto storage areas with asphalt paving and fencing
2 1st Student Transportation NA Month ToMonth
129,808 2.98 $0.12 AnnualCPI
Rebecca Schwan, Port of Seattle, (206) 787-3005
3 516 S Monroe St Yard516 S Monroe StSeattle,WA
Jul-10 360 15,000 0.34 $0.15 GVAKM Internal Files
4 Desimone Oxbow2600 S. 106th StTukwila, WA
Apr-09 13 108,900 2.50 $0.10 None Leased to Knight & Nuprecongravel, fencedTed McCaffray, GVAKM, 206.248.7336
5 McKinstry Parking Site5001 1st Ave S.Seattle, WA
Sep-08 24 62,500 1.43 $0.20 None Leased to McKinstry for parking purposesThey have a construction site nearbygravel, partially fencingTed McCaffray, GVAKM, 206.248.7336
6 SeeFreeze Building Site206 SW Michigan StreetSeattle, WA
Sep-08 372 834,684 19.16 $0.10 AnnualCPI
Long term land lease. Site improved with the SeaFreeze build-ing, a freezer storage facilityGVAKM Internal Files