seasonality in fish assemblage structure in an east
TRANSCRIPT

A frica n Jo u rna l o f M arine Science 2013, 35(2): 1 6 3 -1 73 P rin ted in Sou th A frica — A ll righ ts reserved
C opyrigh t © N IS C (P ty) L td
AFRICAN JOURNAL OF MARINE SCIENCE
IS S N 1814-232X E IS S N 1814-2338 http://dx.doi.org/10.2989/1814232X.2013.769904
Seasonality in fish assemblage structure in an East African mangrove creek
MW Wainaina1*, B Kaunda-Arara2 and JM Njiru2
1 K enya M arine a n d F ishe ries Research Institute, PO Box 81651, M om basa, Kenya2 D epartm ent o f F ishe ries and A qua tic Sciences, U n ivers ity o f E ldo re t (fo rm erly M o i University), PO Box 1125, E ldoret, Kenya* C orrespond ing author, e-m ail: m iriam .w aina ina@ yahoo.com
The spatial and seasonal structures of fish assemblages in a tropical mangrove tidal creek, Tudor, Kenya, were analysed from monthly survey data, extending from October 2007 to July 2008, and covering the north-east (NEM; October-March) and south-east (SEM; April-July) monsoon seasons. A total of 2 118 individuals, representing 84 species belonging to 49 families, were caught. Gerres oyena, Terapon jarbua and Lutjanus fulviflamma were the dominant species in all seasons. There was within-creek seasonal variability in species abundance and diversity. Overall, the mean density (individuals n r2) was higher during the SEM season (0.368; SE 0.078) than the NEM season (0.255; SE 0.041). The NEM season had significantly more species (n = 69) than the SEM season (n = 63)(X2 = 317.891, p < 0.0001). Two-way ANOVA indicated the influence of season and habitat on abundance of some species. The abundance of creek-resident species was significantly influenced by site whereas abundance of creek- dependent and transient species was influenced by interaction between seasons and stations. Bray-Curtis cluster analysis defined two species assemblages, reflecting differences in temporal and spatial use of the creek by the fish species. Correspondence analysis indicated that seasonal fish assemblages were only distinct at the mouth of the creek with less clear seasonal structure in the upper region of the creek.
Keywords: conservation, habitat functions, seasons, species abundance
Introduction
M an gro ve tida l c reeks and es tu a rin e ha b ita ts a re h igh ly p ro d u c tiv e tra n s it io n a l z o n e s th a t a re o cc u p ie d by a com bination of b rackish-w ater and m arine species, including m any ju ve n ile s (C la rid ge et al. 1986). T he fac t th a t they support com m ercia l fisheries and serve im portant eco logica l functions as nursery grounds fo r fish and m acro-crustaceans (B la be r 1997) m akes it im portan t to exam ine fac to rs tha t a ffec t the ir assem blage structures. Furtherm ore, variab ility in com m u n ity s truc tu re m ay a ffec t e co lo g ica l se rv ices of ocean system s (W orm et al. 2006), includ ing creeks (Lotze et al. 2006 ). R esearch on es tu a rin e fish com m u n itie s is m ore deve loped in tem pe ra te reg ions, w h e re sa lin ity has been regarded as a key regu la ting fa c to r (H aedrich 1983, P o tte r e t al. 1986, M a rsh a ll and E llio tt 1998, H a rris and Cyrus 2000). However, the factors regulating fish com m unity s truc tu re o f trop ica l es tua rine hab ita ts such as c reeks are poorly docum en ted bu t a re tho ugh t to be m ore com p lex and include a varie ty o f b iotic (Barry et al. 1996) and abiotic fa c to rs such as s a lin ity , tu rb id ity and h a b ita t s tru c tu re (Low e-M cC onne ll 1987, B laber 1997). The exten t to w h ich sp a tia l d im e n s io n s in com m u n ity s tru c tu re in te ra c t w ith seasonality to in fluence fish assem blages has rece ived little a tten tion in the W estern Indian O cean, even though it m ay be sign ificant in structuring estuarine com m unities.
In Kenya, w ork on fish com m un ities o f tida l creeks is lim ited m ain ly to descrip tions of species com position (e.g. L ittle e t al. 1988, K im ani e t al. 1996, O yugi 2005) w ithou t analysing the structure o f fish assem blages and the factors th a t in fluence spec ies com position and d is tribu tion . This
study bridges tha t gap by describ ing the fish assem blage structure of T udor C reek and by exam ining the in fluence of m onsoon seasonality on the distribution and abundance of fish species w ith in the creek. T udor is the la rgest creek in K enya and is an im portan t artisanal fishe ries ground. O ur s tudy a ttem p ts to p rov ide a base line fo r m on ito ring and m anagem ent o f these system s.
Material and methods
Study areaThis study w as carried out in Tudor Creek, M om basa, Kenya (F igu re 1). T h re e sea son a l r ive rs , K om ben i, T sa tu and M tsapuni, flow into the creek on a seasonal basis (W akwabi 1993). F re sh w a te r in pu t occu rs m a in ly th rou gh su rface - w a te r flow from Kom beni R iver and, to a lesser extent, from Tsatu and M tsapuni (Norconsult 1975). The offshore currents and the ou tw ard ebb cu rre n ts ne a r the en tra nce to the creek flow northw ards during both the no rth -east m onsoon (N E M ) and the sou th -eas t m onsoon (SEM ) seasons. The cu rre n ts a t the en trance channe l o f the creek behave like a s tream reve rs ing in d irec tio n w ith floo d ing and ebb ing tid e s and hence c o n d itio n s rem a in m ore m a rine , w h ile the curren ts are w e ake r tow a rds the upper reg ions o f the c ree k (W akw a b i 1993). T he K enyan co a s t is in fluenced by both no rth -eas te rly and sou th -ea s te rly m onsoon w inds (M cC lanahan 1988). The NEM (O c tobe r-M a rch ) is a period o f ca lm w e a th e r, e leva te d te m p e ra tu re s , h igh s a lin itie s and h igh p h y to p la n k to n p ro d u c tio n , w h e re a s th e SEM
African Journal o f Marine Science is copublished by NISC (Pty) Ltd and Taylor & Francis

164 W ainaina, Kaunda-Arara and Njiru
Mombas;
Enlargedarea
KENYA/A FR IC AKENYA
KenyaStudy area INDIAN
OCEAN
TANZANIA
39°38'
- 4 ° S
Tudor C reek
Nyall BridgePort Reitz Mombasa
Island
Sam pling stations
M angroves
M uddy flats IN D IA NO C EAN
10 km
Figure 1: Map of the study area showing Tudor Creek, Kenya, and the sampling stations (1^ t ) within the creek
(A pril—Ju ly ) is cha rac te rised by rough seas, fa s t currents , coo l tem pe ra tu re s and low sa lin itie s (M cC lanahan 1988). T h is seasona lity a ffec ts chem ica l and b io log ica l processes along the coast. For exam ple , spaw ning and recru itm ent o f fish and inverteb ra tes to benth ic popu lations predom inantly occur during the calm NEM season (N zioka 1979, Kaunda- Arara and Ntiba 1997).
Field samplingS am p ling w as done at fo u r s ta tions (1 -4 ) w ith in the creek (F igu re 1). T he s ta tions w e re se lec ted to cove r the upper, m idd le and low er reg ions o f the creek and to be su ffic ien tly w ide a p a rt to be spa tia lly d is tinc t. S ta tion 1 w as ne a r the m outh of the creek on a partia lly exposed sandy beach w ith pa tches o f sea g ra sses ; S ta tio n 2 w as a beach o f m uddy subs tra te backed by a fr in g e o f m angroves; S tation 3 w as a t th e m o u th o f a sm a ll se a so n a l c h a n n e l le a d in g in to the creek, w h ich had a m uddy sub s tra tum w ith a na rrow fring e o f m angroves; S ta tion 4 , the in ne rm o st site, had an e xp o se d beach o f s a n d -m u d d y su b s tra tu m . S ta tio n s 1
and 2 w e re 4 km apart, S ta tio ns 2 and 3 w e re 2 km apart and the d is tance between S tations 3 and 4 w as 3 km.
Sam ples o ff is h were collected once every month, between O c to be r 2007 and Ju ly 2008 , du ring h igh spring tides (norm ally sho rtly a fte r the full o r new m oon). A m otorised rubber boat (3 m long) w as used to access the stations. Sam pling at each station w as conducted using a 25 m x 2 m beach se ine-net o f 3A inch (19 m m ) m esh size. The net was laid perpendicu lar to the shore and then hauled against the current by fou r people pulling from the deepest part o f the station tow ards the shore. Each single haul sw ept an area of approx. 327 m2 (from knowing the mouth area o f the nets and the d is tance tow ed). For each rep lica te sam ple , all the fish caugh t w ere preserved in 5% form alin in the field. In the labora tory, fish w e re identified to species, counted and m easured (standard length to the nearest m illim etre). Species identification fo llowed Sm ith and Heem stra (1991), Randall (1992), A llen (1997) and Lieske and M yers (2001).
A t each sta tion, phys ico -chem ica l variab les investigated inc luded tu rb id ity , tem pera tu re , sa lin ity and w a te r depth, which w ere m easured before sam pling the fish. Four random replicate m easurem ents o f the physico-chem ical param eters w ere taken at d iffe ren t po ints w ith in the stations. Turb id ity was m easured using a Secchi disc, surface w a te r tem peratu re (±0.1 °C) w as m easured using a hand-held m ercury- in -g lass the rm o m e te r and sa lin ity w as de te rm ined using a refractom eter. W ater depth at each station w as recorded using a portable echo sounder (m odel SM-5).
Data analysisFish nu m be rs fo r eve ry rep lica te sam p le a t each s ta tion w e re d iv ided by the area sw e p t to p rov ide an estim a te of spec ies d e ns ity (no. r r r2). P rio r to s ta tis tica l an a lys is , the density da ta w e re fourth -root transform ed to norm alise the ir d is tr ib u tio n (U nde rw ood 1981). T he cho ice o f p a ram e tric te s t w a s m ade a fte r the da ta w e re tes ted fo r h o m og en e ity o f v a ria n ce s us ing L e ve n e ’s tes t (S ha p iro and W ilks 1966). M ean fish density and d iversity ind ices w e re used to de scribe and com pare fish assem blage s truc tu re between s ta tions and seasons. A na lys is o f va riance (A N O V A ) test (S TA TIS T IC A 6 .0 ) w as used to test for d iffe rences in mean fish a b u n d a n ce be tw een s ta tio n s . T u ke y H SD te s t w as then a p p lie d to pa rtition an y ob se rve d s ig n if ic a n t d iffe rences betw een s ta tions (Z ar 1996). T w o-w ay A N O V A was used to tes t the in teraction between stations and seasons in affecting abundance o f the m ain species.
Spatial and seasonal patterns in fish assem blage structure were investigated using m ultivariate correspondence analysis. S pecies occurring in <2% o f the sam ples w ere elim inated from the correspondence ana lys is fo r ea s ie r iden tifica tion o f the pa tte rns o f associa tions. S pecies m ean abundance m atrices w e re com puted us ing Log (x + 1 )-transfo rm ed density data and subjected to c luster analysis. T he species w e re c lus te red fo llow ing the B ray-C urtis s im ila rity index (C la rke and W arw ick 1994) based on th e ir ab un da nce fo llow ing group-average sorting. The m ultivaria te non-m etric m u ltid im e ns iona l sca ling (M D S ) tech n iq ue w a s used to group sta tions based on d istribu tion o f the m ost abundant sp e c ie s fo llo w in g B ra y -C u rtis s im ila r itie s . P R IM E R 6 and C A N O C O 3.1 s ta tis tica l packages w e re used fo r the m ultivaria te analyses.

African Journal o f M arine Science 2013, 35(2): 163-173 165
D ivers ity ind ices w e re de te rm ined from the S hannon- W iener d ive rs ity index (S hannon and W eave r 1949) and M arg a le fs species richness index (M argalef 1968) was used to de term ine species richness. P ie lou ’s index ( J ) (P ie lou 1966) w as used to de te rm ine species evenness a t each station.
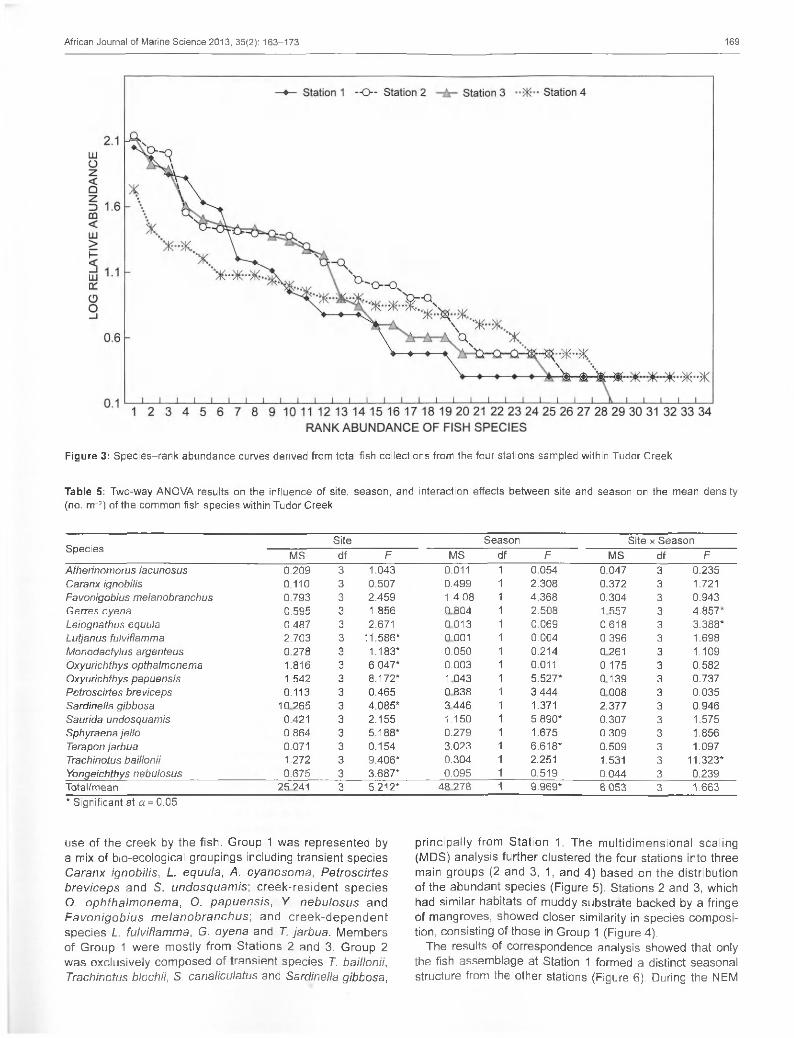
A sp e c ie s -ra nk abundance curve w as plotted to visualise spe c ie s rich ne ss and eve nn ess and to fu rth e r d isp la y re la tive spec ies abundance, a com ponent o f b iod ive rs ity (M agurran 2004). The curve overcom es the shortcom ings of biod iversity indices because they cannot d isp lay the relative role d iffe rent variab les played in the ir calcula tion (M agurran 2004).
S pec ies w e re fu rth e r ca te go rised in to b io -e co lo g ica l groupings depending on the ir tem poral utilisation o f the creek during all o r part o f the ir life -h is to ry stages. T he fo llow ing groupings are m odified from Sm ith and Heem stra (1991) and A lbaret (1999):• C reek res iden ts : p e rm an en t res iden ts th a t spend the ir
entire life (juvenile to adult) w ith in the creek and are highly adapted to estuarine conditions by possessing specia lised physio logical adaptations
• C reek dependent: opportunists or secondary residents that spend only part o f the ir life in the creek, usually as juveniles, and genera lly have few physio logical adapta tions to estuarine conditions
•T ra n s ie n ts : o ften s ten o the rm a l and s ten oha lin e species th a t e n te r the c re e k o n ly o c c a s io n a lly , u s u a lly w h en cond itions the re are very s im ila r to those in the open sea. T rans ien ts gene ra lly have no spec ia lised a d ap ta tion s to estuarine conditions
• Rare: occurrence is very sporad ic in the creek.
Results
Environmental parametersThe physico-chem ical param eters o f Tudor C reek during the study period are presented in Table 1. Mean m onthly surface tem perature varied between 29 .74 (SD 0.30) and 28 .67 °C (SD 0.36), be ing h ighes t in February 2008 and low est in June 2008. T he Secchi d isc depths ranged between 0.93 m (SD 0 .0 2 ) in J u ly 2 0 08 and 0 .98 m (SD 0 .02 ) in M arch 2008 and sa lin ity varied s ligh tly be tw een m onths, ranging be tw een 33 .58 (SD 0 .15 ) in N ovem ber 2007 and 34 .08 (SD 0 .15) in A pril 2008. M ean w a te r depth w as low est in January 2008 (1.17 m, SD 0 .09) and h ighest in M ay 2008 (1.38 m, SD 0.07). T he h ighest and low est m ean tem peratures w ere recorded at S tations 4 and 1 (29.42 °C [SD 0.17] and 28.87 °C [SD 0.21] respectively; Table 2). M ean salinity ranged from 34.00 (SD 0.12) to 33.70 (SD 0.11) at S tations 1 and 4 respective ly . T he h ighest m ean w a te r dep th w as recorded a t Station 1 (1.38 m, SD 0.02) and lowest at Station 3 (1 .23 m, SD 0.04). There w as no s ign ificant d iffe rence in physico-chem ical param eters in the creek between m onths and sam pling stations (Tables 1, 2).
Species distributionIn total, 2 118 fish, be longing to 49 fam ilies and 84 species, w e re ca u g h t in the c ree k (Tab le 3). T he fa m ily w ith the h igh es t nu m be r o f spe c ie s w as G ob iid ae (11 spec ies), con tribu ting 19% o f the to ta l num ber o f fish in the creek.
Table 1: Temporal variation in mean (±SE) physico-chemical parameters within Tudor Creek during the study period
DateTemperature
(°C)Turbidity
(m) Salinity Depth(m)
Oct. 2007 Nov. 2007 Dec. 2007 Jan. 2008 Feb. 2008 Mar. 2008 Apr. 2008 May 2008 Jun. 2008 Jul. 2008
29.46 ± 0.22 29.52 ± 0.30 28.99 ±0.3429.74 ± 0.2829.74 ± 0.3029.46 ± 0.22 28.71 ± 0.31 28.86 ± 0.21 28.67 ± 0.36 28.73 ±0.17
0.94 ± 0.02 0.95 ± 0.02 0.94 ± 0.03 0.97 ±0.01 0.93 ± 0.03 0.98 ± 0.02 0.93 ± 0.03 0.94 ± 0.02 0.93 ± 0.03 0.93 ± 0.02
33.67 ±0.14 33.58 ±0.1533.75 ±0.13 34.00 ± 0.28 33.82 ± 0.23 33.94 ±0.19 34.08 ±0.15 33.87 ±0.14 33.69 ±0.1433.75 ±0.13
1.35 ±0.081.28 ±0.07 1.19 ±0.09 1.17 ± 0.091.38 ±0.06 1.30 ±0.06 1.26 ±0.061.38 ±0.07 1.25 ±0.071.29 ±0.07
ANOVA: F P
1.960.06
0.770.65
0.920.51
1.000.44
Table 2: Spatial variation in mean (±SE) physico-chemical parameters within Tudor Creek, during the study period
Station Temperature(°C)
Turbidity(m) Salinity Depth
(m)1234
28.87 ±0.2129.08 ±0.1829.08 ±0.17 29.42 ±0.17
0.98 ±0.01 0.93 ± 0.02 0.95 ±0.01 0.93 ± 0.02
34.00 ±0.12 33.77 ±0.11 33.73 ± 0.09 33.70 ±0.11
1.38 ±0.03 1.28 ±0.041.23 ±0.041.24 ±0.06
ANOVA: F
P1.500.22
1.820.15
1.550.20
2.280.08
T erapon idae and G erre idae w ere represented by tw o and one species respectively, contributing a lm ost equally in terms of num erical abundance (-10% ). Lutjanidae and Apogonidae were represented by tw o and three species respectively and contributed 9.1% and 7.5% respectively o f the total numerical abundance o f species in the creek (Table 3). T o ta ls o f 53, 46, 44 and 51 species w e re sam pled from S tations 1, 2, 3 and 4 respectively. The species w ith the highest mean catch ra te and num erica l abundance in the creek w e re G erres oyena, Terapon ja rb u a and Lutjanus fu lv iflam m a (Table 3). During the NEM season, the m ost abundant species were S iganus canaliculatus, L. fu lv iflam m a and A eo liscus punctu latus, w hereas T. ja rbua , G. oyena and A pogon cyanosom a dom inated during the SEM season (Table 3). T he num ber o f spec ies in the creek d iffe red s ig n ifica n tly betw een the NEM (n = 69 ) and SEM (n = 63 ) seasons (x 2 = 317.891, p < 0.0001). However, there was no significant d ifference in the overa ll m ean dens ity o f fish (no. r r r2) between seasons (NEM = 921, SEM = 1 197; t = -1 .32 8 , p = 0.186).
Density and diversityT he overall m ean fish density (no. r r r2) w as 0.34 (SE 0.01),0.39 (SE 0.03), 0.34 (SE 0.01) and 0.31 (SE 0.01) a t Stations1, 2, 3 and 4 respective ly (Table 4). The m ean fish density w as s ig n if ic a n tly d iffe re n t be tw ee n s ta tio ns (p < 0 .05). T u ke y ’s HSD test partitioned the be tw een-sta tions density v a ria tio n s to d iffe re nce s be tw een S ta tio ns 4 and 1 and Stations 4 and 2.
The h ighest and low est m ean S hannon-W iener d iversity ind ices (H ’) w e re recorded at S ta tions 2 (1 .96 , SE 0.12)

166 W ainaina, Kaunda-Arara and Njiru
Table 3: Mean fish density of beach-seined fish species at Tudor Creek, during the north-east monsoon (NEM) and south-east monsoon (SEM) seasons. SE denotes standard error of the mean. T = transient, CD = creek dependent, CR = creek resident, R = rare species; dashes denote absence of data
Fish density (no. rrr2)laxurigroup I otai no. 35o
NEM SE SEM SEAcropomatidae
Acropoma japonica R 1 0.05 0.019 0.019 - -
AmbassidaeAmbassis natalensis CD 8 0.39 0.058 0.042 0.145 0.145
ApogonidaeApogon cyanosoma T 148 6.97 0.986 0.418 2.811 2.076Apogon nigripes T 10 0.47 0.039 0.027 0.231 0.230Apogon nigrofasciatus T 1 0.05 0.019 0.019 - -
AtherinidaeAtherinomorus lacunosus CD 36 1.69 0.387 0.347 0.464 0.320
BelonidaeTylosurus acus T 2 0.09 - - 0.261 0.174
BlenniidaePetroscirtes breviceps T 34 1.60 0.309 0.206 0.754 0.361
BothidaeBothus mancus T 1 0.05 0.193 0.088 0.145 0.070
CanthigasteridaeCanthigaster bennetti T 1 0.05 0.039 0.039 0.029 0.029
CarangidaeCaranx ignobilis T 38 1.79 0.599 0.315 0.202 0.146Caranx melampygus T 10 0.47 0.193 0.174 - -
Trachinotus baillonii T 70 3.30 0.367 0.216 1.478 0.868Trachinotus blochii T 48 2.26 0.213 0.158 1.073 0.444
CentriscidaeAeoliscus punctulatus R 102 4.80 1.971 1.089 - -
ChanidaeChanos chanos CD 1 0.05 0.019 0.019 - -
CichlidaeOreochromis mossambicus R 2 0.09 0.058 0.042 - -
ClupeidaeSardinella gibbosa T 54 2.55 0.387 0.241 0.986 0.583
CynoglossidaeParaplagusia bilineata T 1 0.05 0.019 0.019 - -
EngraulidaeStolephorus commersonii T 7 0.34 0.083 0.031 0.026 0.026
EphippidaePlatax orbicularis CD 1 0.05 0.019 0.019 - -
Platax pinnatus CD 3 0.14 0.058 0.042 - -
Platax teira CD 2 0.09 0.039 0.027 0.087 0.087Fistulariidae
Fistularia petimba T 11 0.52 0.193 0.088 0.029 0.029Gerreidae
Gerres oyena CD 204 9.60 1.024 0.301 4.377 2.672Gobiidae
Acentrogobius audax CR 6 0.28 0.116 0.08 - -
Amblygobius spp. CR 1 0.05 0.019 0.019 - -
Callogobius maculipinnis CR 8 0.38 - - 0.087 0.063Favonigobius melanobranchus CR 96 4.53 0541 0.251 1.971 0.799Favonigobius reichei CR 19 0.89 0.213 0.128 0.232 0.127Gobius albimaculatus CR 15 0.72 0.058 0.042 0.261 0.179Oligolepis keiensis CR 43 2.04 0.831 0.579 - -
Oxyurichthys ophthalmonema CR 114 5.37 1.333 0.385 1.305 0.391Oxyurichthys papuensis CR 70 3.51 0.831 0.218 0.783 0.583Yongeichthys nebulosus CR 28 1.33 0.367 0.142 0.261 0.158Goby spp. CR 2 0.09 0 039 0.039 - -
HaemulidaePlectorhinchus gaterinus T 6 0.26 0.116 0.073 - -
Plectorhinchus gibbosus T 2 0.09 - - 0.029 0.029Plectorhinchus plagiodesmus T 3 0.14 0.058 0.032 - -
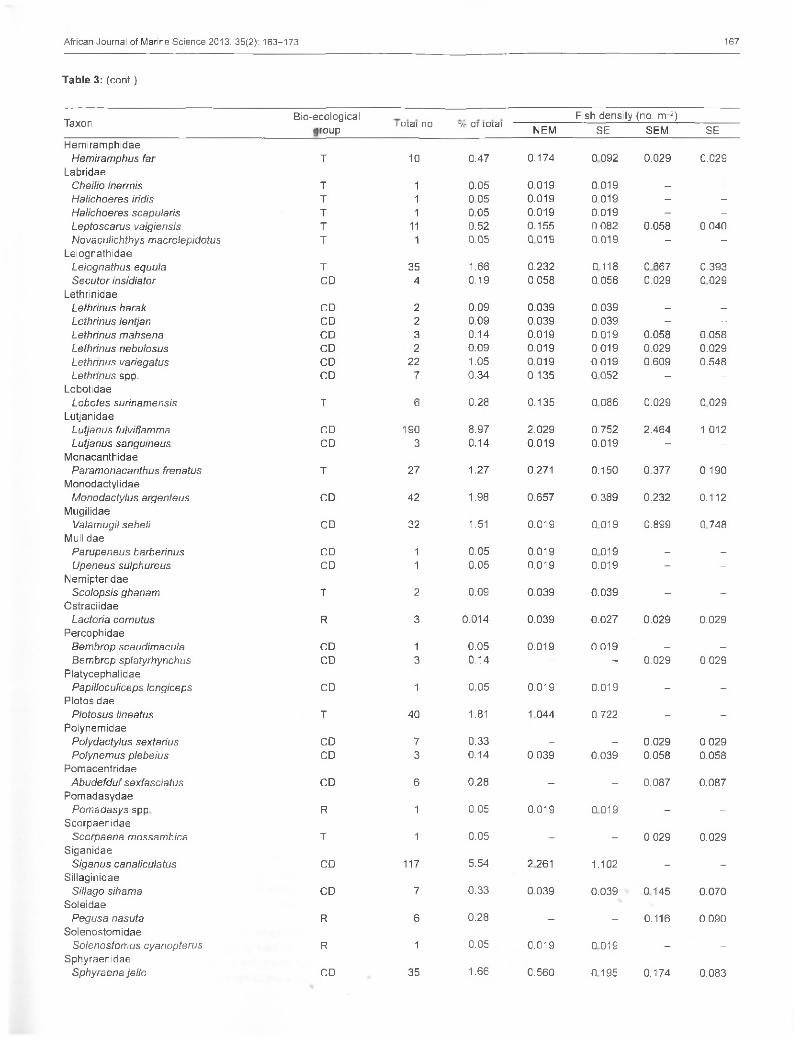
African Journal o f Marine Science 2013, 35(2): 163-173 167
Table 3: (cont.)
TaxonBio-ecological Fish density (no. rrr2)
jroup i u ia i no. 70 OT lo ia i NEM SE SEM SE
T 10 0.47 0.174 0.092 0.029 0.029
T 1 0.05 0.019 0.019 _ _
T 1 0.05 0.019 0.019 - -T 1 0.05 0.019 0.019 - -T 11 0.52 0.155 0.082 0.058 0.040T 1 0.05 0.019 0.019 - -
T 35 1.66 0.232 0.118 0.667 0.393CD 4 0.19 0.058 0.058 0.029 0.029
CD 2 0.09 0.039 0.039 _ _
CD 2 0.09 0.039 0.039 - -
CD 3 0.14 0.019 0.019 0.058 0.058CD 2 0.09 0.019 0.019 0.029 0.029CD 22 1.05 0.019 0.019 0.609 0.548CD 7 0.34 0.135 0.052 - -
T 6 0.28 0.135 0.086 0.029 0.029
CD 190 8.97 2.029 0.752 2.464 1.012CD 3 0.14 0.019 0.019 - -
T 27 1.27 0.271 0.150 0.377 0.190
CD 42 1.98 0.657 0.389 0.232 0.112
CD 32 1.51 0.019 0.019 0.899 0.748
CD 1 0.05 0.019 0.019 _ _
CD 1 0.05 0.019 0.019 - -
T 2 0.09 0.039 0.039 - -
R 3 0.014 0.039 0.027 0.029 0.029
CD 1 0.05 0.019 0.019 _ _
CD 3 0.14 - - 0.029 0.029
CD 1 0.05 0.019 0.019 - -
T 40 1.81 1.044 0.722 - -
CD 7 0.33 _ _ 0.029 0.029CD 3 0.14 0.039 0.039 0.058 0.058
CD 6 0.28 - - 0.087 0.087
R 1 0.05 0.019 0.019 - -
T 1 0.05 - - 0.029 0.029
CD 117 5.54 2.261 1.102 - -
CD 7 0.33 0.039 0.039 0.145 0.070
R 6 0.28 - - 0.116 0.090
R 1 0.05 0.019 0.019 - -
CD 35 1.66 0.560 0.195 0.174 0.083
Hemiramphidae Hemiramphus far
Labridae Cheilio inermis Halichoeres iridis Halichoeres scapularis Leptoscarus vaigiensis Novaculichthys macrolepidotus
Leiognathidae Leiognathus equula Secutor insidiator
Lethrinidae Lethrinus harak Lethrinus lentjan Lethrinus mahsena Lethrinus nebulosus Lethrinus variegatus Lethrinus spp.
Lobotidae Lobotes surinamensis
Lutjanidae Lutjanus fulviflamma Lutjanus sanguineus
Monacanthidae Paramonacanthus frenatus
Monodactylidae Monodactylus argenteus
Mugilidae Valamugil seheli
Mullidae Parupeneus barberinus Upeneus sulphureus
Nemipteridae Scolopsis ghanam
Ostraciidae Lactoria cornutus
Percophidae Bembrop scaudimacula Bembrop splatyrhynchus
Platycephalidae Papilloculiceps longiceps
Plotosidae Plotosus lineatus
Polynemidae Polydactylus sextarius Polynemus plebeius
Pomacentridae Abudefduf sexfasciatus
Pomadasydae Pomadasys spp.
Scorpaenidae Scorpaena mossambica
Siganidae Siganus canaliculatus
Sillaginidae Sillago sihama
Soleidae Pegusa nasuta
Solenostomidae Solenostomus cyanopterus
Sphyraenidae Sphyraena jello

168 W ainaina, Kaunda-Arara and Njiru
Table 3: (cont.)
Taxon Bio-ecologicalTotal no.
Fish density (no. n r2)group % Of t0t3l NEM SE SEM SE
Syngnathidae Syngnathoides biaculeatus T 1 0.05 0.019 0.019 _ _
Synodontidae Saurida undosquamis T 37 1.74 0.135 0.059 0.87 0.429
Teraponidae Pelates quadrilineatus T 12 0.56 0.406 0.293 0.232 0.180Terapon jarbua CD 200 9.39 0.329 0.194 5.305 2.144
Tetraodontidae Arothron immaculatus T 13 0.61 0.174 0.096 0.208 0.028Chelonodon laticeps CD 4 0.19 0.058 0.042 0.029 0.029
Zenarchopteridae Zenarchopterus dispar R 4 0.19 0.289 0.289
Total/mean 2 118 100 0.255 0.041 0.368 0.078
Table 4: Variation (±SE) of mean density, Shannon’s diversity index (/-/’), between stations in Tudor Creek
Margalef’s richness index (D) and Pielou’s evenness index (J’)
Index Station 1 Station 2 Station 3 Station 4 F PFish mean density (no. n r2) Shannon’s diversity index (/-/’) Margalef’s richness index (D) Pielou’s evenness index {J)
0.34 ±0.01 1.69 ±0.10 2.48 ± 0.27 0.75 ± 0.04
0.39 ± 0.03 1.96 ±0.12 2.95 ±0.28 0.79 ±0.04
0.34 ± 0.01 1.79 ±0.12 2.53 ± 0.23 0.78 ± 0.04
0.31 ± 0.01 1.92 ±0.13 2.70 ± 0.26 0.89 ± 0.02
4.170.673.471.11
0.0070.580.360.03
and 1 (1 .69 , SE 0 .10 ) resp ec tive ly (T ab le 4). M a rg a le f’s spec ies richness index (D) fo llow ed the sam e trend as H ’, w ith h igh and low D va lu e s a t S ta tions 2 and 1 resp ective ly . H ow ever, the e ve nn ess index (J ’) w as h ighes t at S ta tio n 4 (0 .89, SE 0 .02) and low est a t S ta tion 1 (0.75, SE 0 .04) (Table 3). H ’ and D indices did no t d iffe r s ign ifican tly between stations, bu t J ’ d iffered s ign ificantly between sta tions (Table 4). On a tem pora l scale, D ranged between 2.15 and 3.19 in M arch and Ju ly 2008 respective ly (F igure 2). G en e ra lly , D va lu e s inc reased du ring th e NEM but de crea sed during th e SEM season . V a lue s o f H ' ranged from 1.99 to 2.11 between June and M arch 2008 respective ly ; how ever, J ’ rem a ined nearly c o n s ta n t ove r tim e, ranging between 0.8 and 0.9 (F igure 2). S ta tions 4 and 1 w e re the m ost d iverse (34 and 32 species ranked respectively), w hereas S tation 3 w as the least d iverse com pared to the o ther stations (29 species ranked) (F igure 3). T he slope o f the cu rves show ed tha t species com position w as m ore even (nu m be r o f in d iv id u a ls eq u ita b ly d is tribu ted am ong spe c ie s ) a t S ta tions 4 and 2, w h ereas S ta tions 3 and 1 had the low est evenness, indicating unequa l d istribu tion of ind iv idua ls per species as the h igher ranked species had m ore ind iv idua ls than the low er ranked ones.
T he m ean tota l catch fo r the com m on fish species w ith in the c ree k varied am ong s ta tions and w ith in season (p < 0 .05 , T a b le 5). T he ab undance o f O xyurich thys op h tha lm o n e m a and Y o n g e ich th ys n e b u lo s u s (c re e k -re s id e n t sp e c ie s ) va ried s ig n if ic a n tly be tw ee n s ta tio n s bu t no t w ith sea son s , w h e re a s th e ab un da nce o f O xyurich th ys pa p u e n s is (a c re e k -re s id e n t spe c ie s ) va ried s ig n ifica n tly be tw een sta tions and seasons (Tab le 5). T he d is tribu tion o f the trans ien t Saurida undosquam is and creek-dependent T. ja rb u a species w as m ore in fluenced by season than by
3
2.5
2
1.5
1
0.5
- - A - H '
J'
w¥ V
- o — o
O ct Nov Dec Jan Feb M ar A p r M ay Jun Jul 2007 2008
M O NTH
Figure 2: Temporal variation in mean Shannon-Wiener diversity (/-/'), Margalefs species richness (D) and Pielou’s evenness (J’) indices for fish assemblages within Tudor Creek. Error bars denote SE
s ta tion loca tion . T he ab un da nce o f the c ree k -de pen de n t G. oye na and the tra n s ie n ts ( T rach ino tu s b a illo n ii and L e io g n a th u s e q u u la ) w e re in flu e n ce d by bo th s ta tio n location and season (Table 5), indicating syne rg is tic e ffects o f both the se fac to rs in de te rm in ing d is tr ibu tion o f som e species in the creek.
Assemblage structureThe B ray-C urtis c lus te r ana lys is de fined tw o m ain groups am ong th e m ost abundant spec ies in the creek (F igure 4). The group ing appears to represent the tem pora l and spatial
African Journal o f Marine Science 2013, 35(2): 163-173 169
Station 1 --O-- Station 2 -¿ r - Station 3 Station 4
lo uiOzâzDCÛ<LU>H
LUerüO—I
0.6
9 10 11 12 13 14 15 16 17 18 19 20 21 22 23 24 25 26 27 28 29 30 31 32 33 34 RA N K A B U N D A N C E O F FISH SPECIES
Figure 3: Species-rank abundance curves derived from total fish collections from the four stations sampled within Tudor Creek
Table 5: Two-way ANOVA results on the influence of site, season, and interaction effects between site and season on the mean density (no. rrr2) of the common fish species within Tudor Creek
SpeciesSite Season Site x Season
MS df F MS df F MS df FAtherinomorus lacunosus 0.209 3 1.043 0.011 1 0.054 0.047 3 0.235Caranx ignobilis 0.110 3 0.507 0.499 1 2.308 0.372 3 1.721Favonigobius melanobranchus 0.793 3 2.459 1.4.08 1 4.368 0.304 3 0.943Gerres oyena 0.595 3 1.856 0.804 1 2.508 1.557 3 4.857*Leiognathus equula 0.487 3 2.671 0.013 1 0.069 0.618 3 3.388*Lutjanus fulviflamma 2.703 3 11.586* 0.001 1 0.004 0.396 3 1.698Monodactylus argenteus 0.278 3 1.183* 0.050 1 0.214 0.261 3 1.109Oxyurichthys opthalmonema 1.816 3 6.047* 0.003 1 0.011 0.175 3 0.582Oxyurichthys papuensis 1.542 3 8.172* 1.043 1 5.527* 0.139 3 0.737Petroscirtes breviceps 0.113 3 0.465 0.838 1 3.444 0.008 3 0.035Sardinella gibbosa 10.265 3 4,085* 3.446 1 1.371 2.377 3 0.946Saurida undosquamis 0.421 3 2.155 1.150 1 5.890* 0.307 3 1.575Sphyraena jello 0.864 3 5.188* 0.279 1 1.675 0.309 3 1.856Terapon jarbua 0.071 3 0.154 3.023 1 6.618* 0.509 3 1.097Trachinotus baillonii 1.272 3 9.406* 0.304 1 2.251 1.531 3 11.323*Yongeichthys nebulosus 0.675 3 3.687* 0.095 1 0.519 0.044 3 0.239Total/mean 25.241 3 5.212* 48.278 1 9.969* 8.053 3 1.663* Significant at a = 0.05
use o f the creek by the fish. G roup 1 w as rep resen ted by a m ix o f b io-ecologica l group ings including transient species C a ran x ig no b ilis , L. equu la , A. cyanosom a, P e tro sc irte s b re v ic e p s and S. u n d o squ am is ] c re e k -re s id e n t sp e c ie s O. o p h th a lm o n e m a , O. p a p u e n s is , Y. n e b u lo s u s and F a v o n ig o b iu s m e la n o b ra n c h u s ; and c re e k -d e p e n d e n t species L. fu lv iflam m a, G. oyena and T. ja rbu a . M em bers o f G roup 1 w e re m ostly from S ta tio ns 2 and 3. G roup 2 w as exc lus ive ly com posed o f trans ien t species T. ba illon ii, Trachinotus blochii, S. canaliculatus and Sard inella gibbosa,
p rin c ip a lly from S ta tio n 1. T he m u ltid im e n s io n a l sca ling (M DS) analys is fu rthe r clustered the fou r s ta tions into three m ain groups (2 and 3, 1, and 4 ) based on the d is tribu tion o f the abundant species (F igure 5). S tations 2 and 3, which had s im ila r habita ts o f m uddy substra te backed by a fringe o f m angroves, showed c loser s im ila rity in species com position, consisting o f those in G roup 1 (F igure 4).
The results o f correspondence analysis showed tha t only the fish assem blage at Station 1 form ed a d istinct seasonal structure from the other stations (Figure 6 ). During the NEM

170 W ainaina, Kaunda-Arara and Njiru
F. melanobranchus L. fulviflammaS. undosquamis O. ophthalmonema T. jarbua P. breviceps O. papuensis S. jello Y. nebulosus A. cyanosoma L. equula C. ignobilisG. oyenaA. lacunosus T. baillonii S. canaliculatus T. blochii S. gibbosa
G R O U P 1
G R O U P 2
70S IM ILAR ITY (% )
100
Figure 4: A correlation dendrogram for species based on Bray-Curtis similarities of the most abundant species sampled within Tudor Creek
2D Stress: 0.01
Station 4
Station 1
Station 3 statlon 2
Figure 5: MDS ordination plot based on Bray-Curtis similarities of the most abundant species at stations within Tudor Creek
season, S tation 1 w as dom ina ted by S. cana licu la tus, G. oyena and C. ignob ilis , w h ere as S ard ine lla g ibbosa and T. b a illon ii dom inated th is station during the SEM season (F igure 6). Fish assem blages were poorly separated between the seasons a t S tation 4; however, NEM season appeared to be dom inated by P. breviceps, L equu la and A therinom orus lacunosus in th is s ta tion (F igure 6 ). T he fish assem blage s truc tu re o f S ta tion 4 w as d is tinc t from th a t o f S ta tions 2 and 3 on ly during the SEM season . Fish assem blage structure at S tations 2 and 3 w as indistinct between the two seasons and consisted o f F. m elanobranchus, Y. nebulosus, T. ja rb u a and L. fu lv iflam m a (F igure 6).
Discussion
T he b io d iv e rs ity fo u n d a t T u d o r C reek is typ ica l o f tida l creeks and trop ica l es tu a rin e com m un ities , w h e re a sm all num ber o f spec ies con tribu te a la rge proportion o f the fish com m unity (Little e t al. 1988, K im ani e t al. 1996, V idy 2000, R ueda and D efeo 2003). The fish assem b lages w ith in the creek d iffe red cons iderab ly be tw een stations and m onsoon seasons. T he fam ilies S igan idae, C arangidae and C lupeidae dom ina ted the o ce an ic s ta tion a t the m ou th o f the creek, w hereas G erre idae, T erapon idae , G ob iidae and Lutjan idae w ere m ost dom inant in the m ore inland stations in the creek. L ittle e t al. (19 88 ) fo u n d a s im ila r d is tr ib u tio n du ring an ea rlie r s tudy in T udo r C reek; however, w e found an in land sh ift in the d is tribu tion o f G erre idae w h ich w as not reported in th is e a r lie r s tud y . It is lik e ly th a t a n th ro p o g e n ic and clim atic in fluences have affected distribution o f f is h in Tudor Creek, as has been observed in o ther s im ila r system s (Lotze et al. 2006 ). W here as G ob iidae , G erre idae , T erapon idae , Lu tjan idae and A po go n id ae w ere found to dom ina te T udo r Creek, Le iognathidae, Syngnath idae, G erreidae, A therin idae and o th e r g ro up s have been repo rted to do m in a te o the r tida l creeks in Kenya (K im ani e t al. 1996, O yug i 2005) and e ls e w h e re (B la b e r and M ilto n 1990), in d ica tin g b io g e o g raph ic va ria tio n in fa c to rs a ffec ting com m u n ity s tructure . T he p re sen ce o f a d ive rs ity o f su b s tra te types , inc lud ing m angrove fringed sections, cou ld exp la in the high spec ies d ive rs ity w ith in T u d o r C reek. H ow ever, be cau se o f d iffe rences in sam p lin g te c h n iq u e s and e ffo rt, it is d iff ic u lt to com pare species d iversity and abundance between d ifferent habita ts studied.
T he fish assem b lage s tru c tu re seem ed to correspond to both hab ita t va riab ility w ith in the creek and to seasonality. Fish com position at the ocean ic sta tion w as affected

African Journal o f Marine Science 2013, 35(2): 163-173 171
-1
-2
-3
Apogon cyanosoma
Sphyraena jello
Saurida undosquamis
Favonigobius melanobranchus Yongeichthys nebulosus
Terapon jarbua
Lutjanus fulviflamma
Oxyurichthys papuensis Oxyurichthys ophthalmonema
□ Station, SEM O Station, NEM
Trachinotus baillonii
Sardinella gibbosa
Stn 3 Stn 2
Stn 2
Stn 3Petroscirtes breviceps g^n 4 Leiognathus equula
Atherinomorus lacunosus
Gerres oyena
Caranxdgnobilis
O Stn 1
Siganus canaliculatus
_____ I_______-2 .5 -1 .5 -0 .5 0.5 1.5 2.5 3.5
Figure 6 : Multivariate correspondence analysis of the association of fish species with stations and seasons at Tudor Creek, for species with catch rates >2%
m ore by season than those in the upper region o f the creek. On the con tra ry, L ittle e t al. (1988) reported s im ila rity o f assem blage structure between stations in the creek. O ther stud ies have docum ented the influence o f salin ity variations in structuring estuarine populations (Spach e t al. 2004, Sanja et al. 2005); however, lack o f significant seasonal variation in sa lin ity in T udor C reek indicates tha t o ther factors (e.g. hyd rodynam ics, p roductiv ity and b io log ica l in te rreactions) w ere involved in influencing fish d istribution and abundance. S ite and seasona l fac to rs seem to in te ract w ith species behaviour in in fluencing distribu tion and abundance o f fish species in the creek. The distribution o f transient and creek- dependent species (e.g. G. oyena, T. ba illon ii and L. equula) w as s ign ificantly a ffected by both station and season (see a lso N age lkerken et. al. 2001). H ow ever, the abundance o f the c reek-res iden t species (e.g. O. ophtha lm onem a , Y. nebu losus and O. papuens is ) w as m ore affected by station w ith in the creek than seasonality. S im ilar distribution patterns tha t are not seasonal have been reported fo r creek-resident spe c ie s e lsew h e re (B la be r and M ilton 1990), pe rhaps reflecting evolutionary acclim atisation o f species to seasonal in fluences w ith in creeks.
In the present study, eco logica l d iversity indices showed little spatial variability, and variation in species evenness is
like ly related to differences In habitat quality within the creek (G ratw icke and Speight 2005). Furtherm ore, the dom inance o f som e fam ilies (e.g. Siganidae, Lutjanidae and Gerreidae) a t s ta tions like ly affected the species d ive rs ity w ith in the creek, as im plied by the species rank abundance curves. The high species evenness and d ivers ity in the in land stations was like ly associated w ith the structural com plexity caused by m angroves at these s ta tions. W ith in -c reek varia tion in d ive rs ity and evenness appears to cha rac te rise m any m angrove tida l creeks and estuarine habita ts (A llen 1982, Robertson and Duke 1987). The higher values in the ecological d iversity indices observed during the NEM season concur w ith those reported in an earlier study in Tudor Creek (Little e t al. 1988). Seasonal changes in species d ivers ity w ith in the creek are likely caused by m ovem ent o f fish between the creek and offshore areas (Day 1974). The calm conditions and high productivity during the NEM season (M cClanahan 1988, O bura 2001) likely contributed to species m ovem ent into the creek during tha t period.
O ur s tudy has show n ev ide nce o f ch a ng es in fish com m unity structure in the creek since the earlier investigation by L ittle et al. (1988). Species evenness in the creek has decreased and species richness has reduced since the ea rlie r study. However, w e found the creek still has a high

172 W ainaina, Kaunda-Arara and Njiru
diversity o f fish, m ore than 80 species, which is com parable to o ther tropical m angrove tidal creeks (B laber 2000). High spe c ie s evenness occu rred on m angrove-lined sections o f the creek (S ta tions 2 and 4). T he fish assem blage at the m ore ocean ic sta tion seem ed to form a m ore d is tinct seasona l s truc tu re than at the o the r in land stations. A lso d iffe re n t spec ies dom ina ted the s ta tions during d iffe ren t seasons. T he creek also serves as an im portant habitat fo r G ob iidae and provides a favourab le hab ita t to the creek- dependen t (e.g. Lu tjan idae, G erre idae, T e rapon idae and A po go n id ae ) and trans ien t fish groups (e.g. C arangidae, Hem iram phidae, Chanidae and Leiognathidae).
O ur results underscore the need fo r continuous monitoring o f these system s in order to determ ine w hether they are able to susta in the ir eco log ica l and econom ic niche in the face o f esca la ting anthropogen ic and c lim ate change in fluences (B la b e r 1997, Lo tze et al. 2006). Inves tiga tions on the anthropogenic im pacts and long-term clim ate change effects on the s truc tu re and fun c tion o f c reek com m un ities are required. W e have shown that salin ity gradients m ay not be im portant in structuring creek com m unities in system s with weak runoff, but seasonality and habitat heterogeneity likely play im portan t roles in structuring bio-ecological fish groups in East A frican creek system s.
Acknowledgements — We thank Mr S Nunguti and Mr E Wairangu of the Ministry of Fisheries Development for granting permission to work within the creek. We also thank the director, Kenya Marine and Fisheries Research Institute, for logistic support. We are grateful to Messrs Rashid Anam, Boaz Orembo, Dickson Odongo for their help in taxonomy and laboratory work and Messrs Charles Njaya, Pius Omondi, Gaya Chibundi, Karisa Katana and Mwendwa Mbaluka for their assistance in the field. This study was supported by a Canadian International Development Agency, with funding through Moi University’s Department of Fisheries and Aquatic Sciences.
References
Albaret J, 1999. Les peuplements des estuaires et des lagunes. In: Lévêque C, Paugy D (eds), Les poissons des eaux continentales Africaines: diversité, ecologie, utilisation pa r l ’homme. Paris: l’IRD Éditions, pp 325-349.
Allen G. 1997 Marine fishes of the Great Barnier Reef and South-East Asia - a field guide for anglers and divers. Perth: Western Australia Museum.
Allen G. 1982. Seasonal abundance, composition, and productivity of the littoral fish assemblage in upper Newport Bay, California. Fishery Bulletin 80: 769-790.
Barry P, Yoklavich M, Cailliet G, Ambrose D, Antrim B. 1996. Trophic ecology of the dominant fishes in Elkhorn Slough, California. Estuaries 19: 115-138.
Blaber SJM. 1997. Fish and fisheries of tropical estuaries. London: Chapman and Haii.
Blaber SJM. 2000. Tropical estuarine fishes: ecology, exploitation and conservation. Queensland: Blackwell Science.
Blaber SJM, Milton DA. 1990. Species composition, community structure and zoogeography of fishes of mangrove estuaries in the Solomon Islands. Marine Biology 105: 259-267.
Claridge N, Potter C, Hardisty W. 1986. Seasonal changes in movements, abundance, size composition and diversity o f the fish fauna of the Severn Estuary. Journal o f Marine Biology Association o f the United Kingdom 66: 229-258.
Clarke M, Warwick. 1994. Change in marine communities: an approach
to statistical analysis and interpretation. Plymouth, UK: Natural Environment Research Council.
Day JH. 1974. The ecology of Morrumbene estuary, Mozambique. Transactions o f the Royal Society o f Africa 41: 42-94.
Gratwicke B, Speight S. 2005. The relationship between habitat complexity and fish species richness and abundance in shallow tropical marine habitats. Journal o f Fish Biology 66: 650-667.
Haedrich L. 1983. Estuarine fishes. In: Ketchum H (eds), Estuaries and enclosed seas. Ecosystems o f the world 26. Amsterdam: Elsevier, pp 183-207.
Harris A, Cyrus P. 2000. Comparison of larval fish assemblages in three large estuarine systems, KwaZulu-Natal, South Africa. Marine Biology 137: 527-541.
Kaunda-Arara B, Ntiba MJ. 1997. The reproductive biology of Lutjanus fulviflamma (Pisces: Lutjanidae) from Kenyan inshore marine waters. Hydrobiologia 353: 153-160.
Kimani EN, Mwatha GK, Wakwabi EO, Ntiba MJ, Okoth BK. 1996. Fishes of a shallow tropical mangrove estuary, Gazi, Kenya. Marine and Freshwater Research 47: 857-868.
Lieske W, Myers R. 2001. Coral ree f fishes o f Indo-Pacific and Caribbean. London: Harper Collins publishers.
Little MC, Reay PC, Grove SJ. 1988. The fish community of an East African mangrove creek. Fish Biology 32: 729-747.
Lotze HK, Lenihan HS, Bourque BJ, Bradbury RH, Peterson CH, Jackson BC. 2006. Depletion, degradation, and recovery potential of estuaries and coastal seas. Fisheries Science 312: 1806-1809.
Lowe-McConnell RH. 1987. Ecological studies in tropical fish communities. Cambridge: Cambridge University Press.
Magurran AE. 2004. Measuring biological diversity. Oxford: Blackwell Publishing.
Margalef R. 1968. Perspectives in ecological theory. Chicago: University of Chicago Press.
Marshall S, Elliott M. 1998. Environmental influences on the fish assemblages of the Humber Estuary, U.K. Estuarine, Coastal and Shelf Science 46: 175-184.
McClanahan TR. 1988. Seasonality in East Africa’s coastal waters. Marine Ecology Progress Series 44: 191-199.
Nagelkerken I, Kleijnen S, Klop T, van den Brand RACJ, Cocheret de la Morinière E, van der Velde G. 2001. Dependence of Caribbean reef fishes on mangroves and seagrass beds as nursery habitats: a comparison of fish faunas between bays with and without mangroves/seagrass beds. Marine Ecology Progress Series 214: 225-235.
Nzioka RM. 1979. Observations on the spawning seasons of East African reef fishes. Journal o f Fish Biology 14: 329-342.
Norconsult AS (Consulting Engineers, Architects & Economists). 1975. Mombasa water pollution and waste disposal study, VI. Marine Investigations. Nairobi: Ministry of Local Government.
Obura D. 2001. Participatory monitoring of shallow tropical marine fisheries by artisanal fishers in Diani, Kenya. Bulletin o f Marine Science 69: 777-791.
Oyugi D. 2005. Preliminary investigations on the ichthyodiversity of Kilifi Creek, Kenya. Western Indian Ocean Journal o f Marine Science. 1: 11-20.
Pielou EC. 1966. The measurement of diversity in different types of biological collections. Journal o f Theoretical Biology 13: 13-14.
Potter IC, Claridge PN, Warwick RM. 1986. Consistency of seasonal changes in an estuarine fish assemblages. Marine Ecology Progress Series 32: 217-228.
Randall JE. 1992. Divers’ guide to fishes of Maldives. London: Immel Publishing.
Robertson A, Duke N. 1987. Mangrove as nursery sites: comparison of the abundance and species composition of fish and crustaceans in mangroves and other near shore habitats in tropical. Australia Marine Biology 96: 193-205.

African Journal o f M arine Science 2013, 35(2): 163-173 173
Rueda M, Defeo O. 2003. Spatial structure of fish assemblages in a tropical estuarine lagoon: combining multivariate and geostatistical techniques. Journal o f Experimental Marine Biology and Ecology 296: 93-112.
Sanja MA, Melita PE, Armin PA, Marijana F. 2005. Species composition, seasonal fluctuations, and residency of inshore fish assemblages in the Pantan estuary of the eastern middle Adriatic. Acta Adriatica 46: 201-212.
Shannon CE, Weaver W. 1949. The mathematical theory of communication. Urbana: University of Illinois Press.
Shapiro SS, Wilks M. 1966. An analysis of variance test for normality. Biometrika 52: 59-141.
Smith MM, Heemstra PC. 1991. Smith’s sea fishes. Johannesburg: Southern Book Publishers.
Spach HL, Santos C, Godefroid RS, Nardi M, Cunha F. 2004. A study of the fish community structure in a tidal creek. Brazilian
Journal o f Biology 64: 337-351.Underwood AJ. 1981. Techniques of analysis o f variance in
experimental marine biology and ecology. Journal o f Marine Biology 19: 513-605.
Vidy G. 2000. Estuarine and mangrove systems and the nursery concept: which is which? The case of the Sine Saloum system (Senegal). Wetland Ecology and Management 8 : 37-51.
Wakwabi EO. 1993. The distribution and abundance of planktonic penaeid larvae in Tudor creek, Mombasa, Kenya. Hydrobiologia 264: 185-192.
Worm B, Barbier EB, Beaumont N, Duffy JM, Folke C, Halpern BS, Jeremy BC, Lotze HK, Michel F, Palumbi SR, Sala E, Selkoe KA, Stachowicz J J, Watson R. 2006. Recent biodiversity loss undermines ocean ecosystem services at all scales. Science 314: 787-790.
Zar JH. 1996. Biostatistics analysis. New Jersey: Prentice Haii.
Manuscript received May 2012, revised November 2012, accepted November 2012
