seasonal summer rainfall prediction in bermejo river basin
TRANSCRIPT
7
Seasonal Summer Rainfall Prediction in Bermejo River Basin in Argentina
Marcela H. González and Ana María Murgida Universidad de Buenos Aires
Argentina
1. Introduction
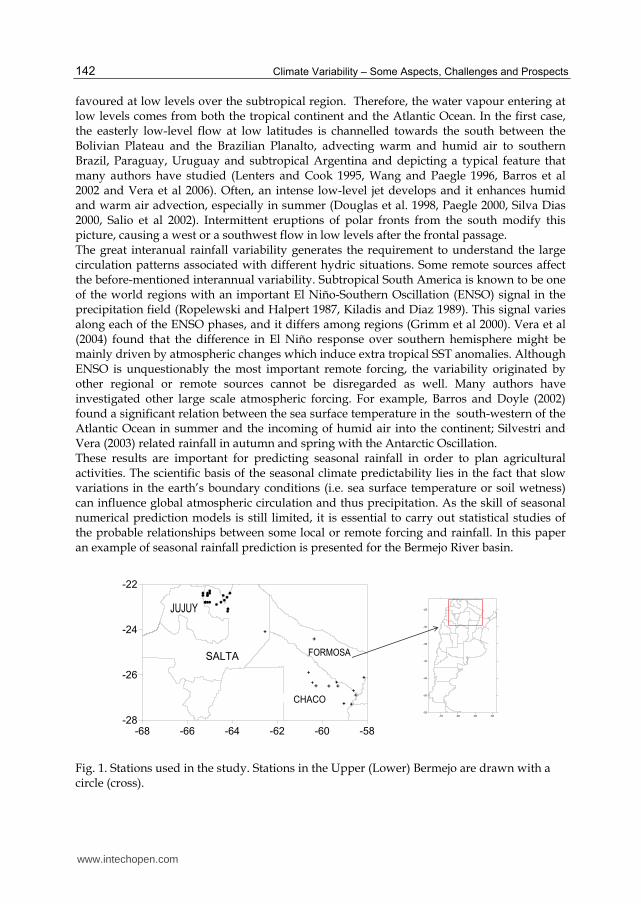
Bermejo River Basin is located in the Chaco Plains in northern Argentina (Fig 1). The river has an extension of 1,450 km and the basin area covers 16,048 km2, comprising the north of Salta and the Formosa and Chaco provinces. Its principal tributary is San Francisco River which carries mountain waters. Two different sections can be detected in Bermejo River: the upper and the middle-low Bermejo. Vegetation is wooded with more plains to the east and with the presence of isolated yungas. Vast areas have been historically inhabited by indigenous communities with extensive farming practice. Not taking into account further agricultural colonization, traditional productive activities in the dry Chaco were based on the supply of forest resources and rivers: timber and firewood, cattle grazing and goats, hunting and commercial and subsistence fishing, and harvesting of fruits (carob, mistol), fibers (chaguar) and honey. Nowadays, economic activity is typically agricultural and it is located in two main centres separated by a large plain: east of Salta and east of Chaco. Moreover, historical data show that the region has been the scene of frequent hydro-meteorological disasters (floods and droughts) and the impacts of these events have had a strong impact on the welfare of the population, productive activities and infrastructure. Fifty years ago, agricultural enterprises were risky. Today they are a tool for development and a forcing factor for vulnerabilization of productive instruments and traditional living. There is ample evidence that climate change impacts are already being observed today and that policies that seek the best ways to meet them are essential for the development and welfare of the community. Therefore, the Argentinean Chaco is a region that, as a result of the change in land use, presents “hotspot "or critical areas for the period 1982-1999 (Baldi et al 2008; http://lechusa.unsl.edu.ar /). They are the result of the implementation of deforestation for the advancement of agriculture and intensive farming. In this region the climate is subtropical with a mean annual rainfall cycle showing a minimum in winter, which is more pronounced in the west, with dry conditions prevailing from May to September (González and Barros 1998, Reboita et al 2010). The Andes chain lies along the west of Argentina and prevents the access of humidity from the Pacific Ocean. Therefore, the flow is governed by the South Atlantic High and as a consequence, winds prevail from the north and the east. An intermittent low pressure system, whose origin could be a combination of thermal and dynamical effects, is located between 20º and 30ºS, in a dry and relatively high area east of the Andes. This system is observed all year long, though it is deeper in summer than in winter. When this low is present, northerly flow is
www.intechopen.com
Climate Variability – Some Aspects, Challenges and Prospects 142
favoured at low levels over the subtropical region. Therefore, the water vapour entering at low levels comes from both the tropical continent and the Atlantic Ocean. In the first case, the easterly low-level flow at low latitudes is channelled towards the south between the Bolivian Plateau and the Brazilian Planalto, advecting warm and humid air to southern Brazil, Paraguay, Uruguay and subtropical Argentina and depicting a typical feature that many authors have studied (Lenters and Cook 1995, Wang and Paegle 1996, Barros et al 2002 and Vera et al 2006). Often, an intense low-level jet develops and it enhances humid and warm air advection, especially in summer (Douglas et al. 1998, Paegle 2000, Silva Dias 2000, Salio et al 2002). Intermittent eruptions of polar fronts from the south modify this picture, causing a west or a southwest flow in low levels after the frontal passage. The great interanual rainfall variability generates the requirement to understand the large circulation patterns associated with different hydric situations. Some remote sources affect the before-mentioned interannual variability. Subtropical South America is known to be one of the world regions with an important El Niño-Southern Oscillation (ENSO) signal in the precipitation field (Ropelewski and Halpert 1987, Kiladis and Diaz 1989). This signal varies along each of the ENSO phases, and it differs among regions (Grimm et al 2000). Vera et al (2004) found that the difference in El Niño response over southern hemisphere might be mainly driven by atmospheric changes which induce extra tropical SST anomalies. Although ENSO is unquestionably the most important remote forcing, the variability originated by other regional or remote sources cannot be disregarded as well. Many authors have investigated other large scale atmospheric forcing. For example, Barros and Doyle (2002) found a significant relation between the sea surface temperature in the south-western of the Atlantic Ocean in summer and the incoming of humid air into the continent; Silvestri and Vera (2003) related rainfall in autumn and spring with the Antarctic Oscillation. These results are important for predicting seasonal rainfall in order to plan agricultural activities. The scientific basis of the seasonal climate predictability lies in the fact that slow variations in the earth’s boundary conditions (i.e. sea surface temperature or soil wetness) can influence global atmospheric circulation and thus precipitation. As the skill of seasonal numerical prediction models is still limited, it is essential to carry out statistical studies of the probable relationships between some local or remote forcing and rainfall. In this paper an example of seasonal rainfall prediction is presented for the Bermejo River basin.
Fig. 1. Stations used in the study. Stations in the Upper (Lower) Bermejo are drawn with a circle (cross).
-70 -65 -60 -55
-55
-50
-45
-40
-35
-30
-25
-68 -66 -64 -62 -60 -58-28
-26
-24
-22
JUJUY
SALTA FORMOSA
CHACO
www.intechopen.com
Seasonal Summer Rainfall Prediction in Bermejo River Basin in Argentina 143
The objective of this paper is to show the statistical prediction of summer rainfall in the Bermejo River Basin. The paper is organized as follows: Section 2 describes the dataset and the methodology; Section 3 presents the general rainfall features in Bermejo River Basin; Section 4 details the linkage between rainfall over the basin and atmospheric circulation, between rainfall and SST anomaly patterns, and the building of regression models to estimate summer rainfall in the basin; Section 5 presents the main conclusions.
2. Data and methodology
Monthly rainfall data derive from 33 stations from different sources: the National Meteorological Service (SMN), the Secretary of Hydrology of Argentina (SRH), the Regional Commission of the Bermejo River (COREBE) and the Provincial Water Administration of Chaco (APA). The area of study is the Bermejo River Basin, encompassing the Argentinean provinces of Salta, Chaco and Formosa (see Fig 1). Stations have different data records over 1968-2007. All the selected stations have less than 20% of missing monthly rainfall data and their quality has been carefully proved. Precipitation low frequency variability was analyzed using a linear trend method of minimum squares, and statistics significance was tested using a T-Student test. There were also used: monthly sea surface temperature (SST), 500 HPa (G500), 1000 Hpa (G1000) and 200Hpa (G200) geopotential height, zonal (U) and meridional (V) wind at 850 Hpa and 925 Hpa specific humidity (HE) from National Centre of Environmental Prediction (NCEP) reanalysis (Kalnay et al, 1996). Monthly anomalies were determined removing the climatological monthly means from the original values. The analysis in the Bermejo River Basin concentrates on southern summer rainfall. Although it is a small area, some differences were detected all over the basin. Therefore, two mean rainfall series were constructed as the average of monthly precipitation in nineteen stations in the upper Bermejo river basin (UB) during the period 1982-2007 and fourteen stations in the lower and middle Bermejo River Basin (LB) during the period 1968-2007. Such rainfall series are representative of the precipitation over each one of the basin sub-regions (see Fig 1). Different records were considered for each sub-basin regarding data availability. Simultaneous (summer rainfall with summer circulation variable) and one month lagged (summer rainfall with December circulation variable) correlations were calculated to find the existing relation between summer rainfall and SST and G1000, G500, G200, U and V. Summer rainfall was defined as precipitation accumulated from January to March (hereinafter JFM). The derived correlations allowed defining some predictors which were used to develop a statistical forecast model using the forward stepwise regression method (Wilks 1995). This method retained only the variables, correlated with a 95% significance level. Forward stepwise regression is a model-building technique that finds subsets of predictor variables that most adequately predict responses on a dependent variable by linear regression (Darlington 1990). The basic procedures involve the initial model identification, then predictors are added one-by-one with the remaining candidate predictor that reduces the size of the errors, and this process continues until the errors cannot be significantly reduced. It is important to notice that all the predictors used in the models are variables observed in December (a month prior to rain), averaged in areas where the correlation between these variables and JFM rainfall was high. To validate the results, it was applied a cross-validation (Wilks 1995) where n-1 years were used for calibration and the remaining year was used to validate the model. This process was repeated several times with a different year as the validation target in each case. This
www.intechopen.com
Climate Variability – Some Aspects, Challenges and Prospects 144
method is generally strong in the presence of long-term climate variability and is used specially, when the number of data is not so large. To prove the skill of scheme a contingency table between observed and forecast rainfall was designed using three equiprobable categories labelled below- normal (BS), above normal (AN) and normal (N), referring to the driest, wetter and normal third of cases respectively. Besides, some measures of accuracy were calculated. The most direct and intuitive measure of the accuracy of the categorized forecast (Wilks 1995) is the hit rate or the right proportion. It is the fraction of all the cases whenever the categorical forecast correctly anticipates the subsequent event. The probability of detection is defined as the fraction of those occasions when the forecast events occurred as they had been forecast. The false alarm ratio is the proportion of forecast events that failed to happen. Additionally, empirical estimated and observed rainfall probability functions were calculated using frequency distributions and a chi-square test was used to prove that they did not differ significantly.
3. General rainfall features in Bermejo river basin
To better study the Bermejo River basin the general rainfall features of UB and LB were
analyzed. The mean annual rainfall cycle in the common period 1982-2007 was calculated
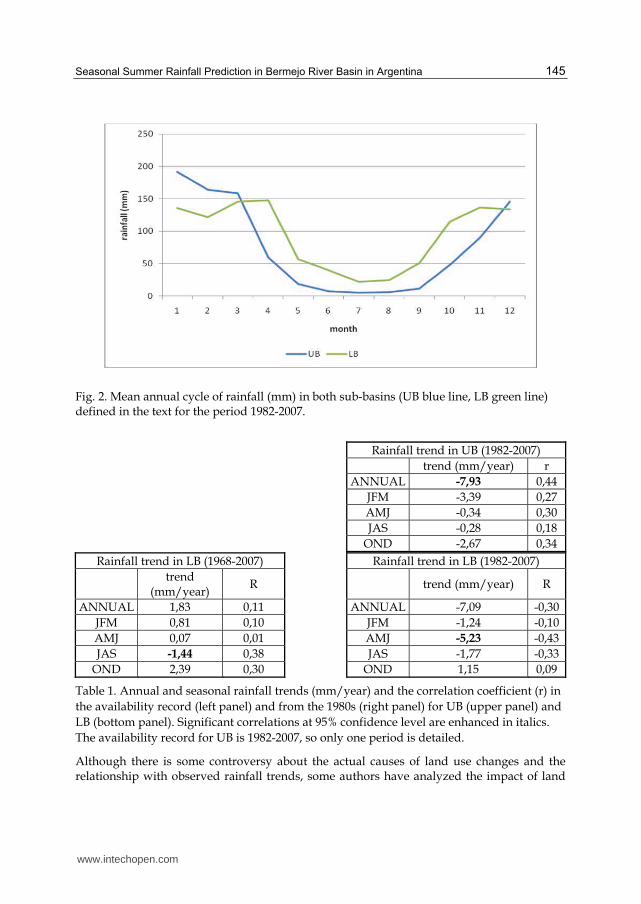
for both sub-basins (Fig 2) and shows an important annual cycle with maximum rainfall
in summer (JFM) that increases westwards. Maximum monthly rainfall is greater than
190 mm in January and minimum is around 5 mm in July in UB. The amplitude decrease
in LB where minimum rainfall is 21,7 mm in July and maximum reaches only 136 mm in
January.
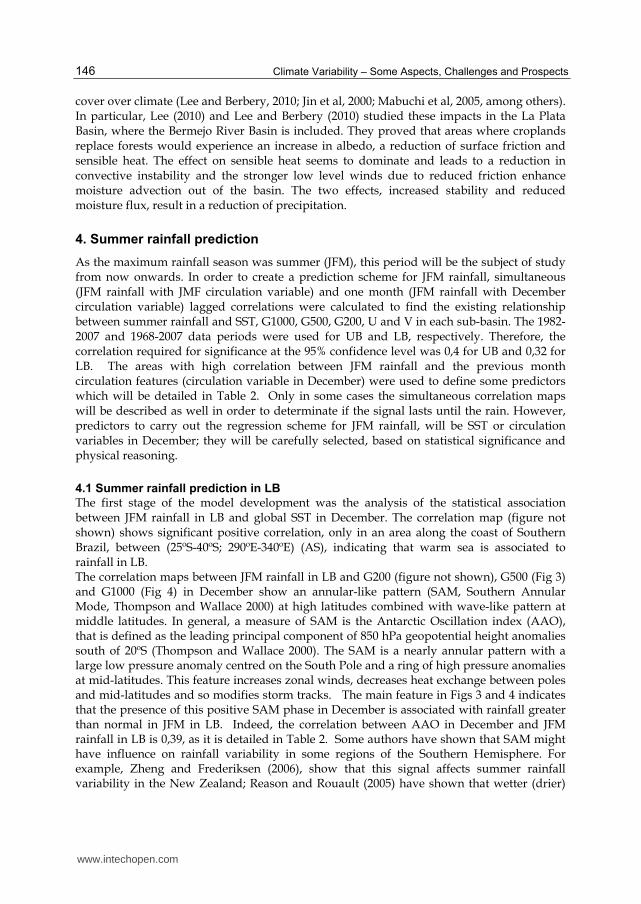
The annual and seasonal rainfall trends (Table 1) were calculated for each sub-basin during
the period 1982-2007 in UB and 1968-2007 and 1982-2007 periods in LB. Negative trends
were observed as from 1980s, which were significant regarding annual rainfall in UB (-7,93
mm/year) and autumn rainfall in LB (-5,23 mm/year). Seasonal trends are all negative in
UB for the period 1982-2007. In the case of LB the annual trend was 1,83 mm/year in 1968-
2007 and decreased to -7,09 m/year in 1982-2007, both not significant. In LB, all seasonal
trends were positive during 1968-2007, except southern winter trend (-1,44 mm/year).
However, when considering the 1982-2007 period, all seasonal trends became negative,
although only autumn trend resulted significant. Therefore, there is evidence that rainfall
tended to decrease from the1980s. In LB, where data are available, a relevant change in the
behaviour of trends could be detected. It is important to mention that rainfall has increased
all over the northeast and central Argentina during the last century (Barros et al, 2008 and
2000; Liebmann et al, 2004; Gonzalez et al, 2005) but there is some evidence that these trends
could be reversing in the Chaco plain region of Argentina (Flores and Gonzalez, 2009) in
recent times. So, it would be great to determine the possible causes which are related to
these observed changes. For example, LechuSA programme (Land Ecosystem change utility
for South America, http://lechusa.unsl.edu.ar/) (Baldi et al 2008) is an enterprise whose
main objective is to understand the changes of ecosystems in South America, specially, those
derived from changes in land uses. They identified “hotspots” with satellite information
which is representative of intense changes. One of these “hotspots” is located in the Bermejo
River Basin due to the deforestation and intensification of agricultural activities. Also,
Minetti et al (2010) have shown an upward trend in the occurrence of droughts from 2003 in
Argentina, including the area analyzed in this paper.
www.intechopen.com
Seasonal Summer Rainfall Prediction in Bermejo River Basin in Argentina 145
Fig. 2. Mean annual cycle of rainfall (mm) in both sub-basins (UB blue line, LB green line) defined in the text for the period 1982-2007.
Rainfall trend in UB (1982-2007)
trend (mm/year) r
ANNUAL -7,93 0,44
JFM -3,39 0,27
AMJ -0,34 0,30
JAS -0,28 0,18
OND -2,67 0,34
Rainfall trend in LB (1968-2007) Rainfall trend in LB (1982-2007)
trend
(mm/year) R
trend (mm/year) R
ANNUAL 1,83 0,11 ANNUAL -7,09 -0,30
JFM 0,81 0,10 JFM -1,24 -0,10
AMJ 0,07 0,01 AMJ -5,23 -0,43
JAS -1,44 0,38 JAS -1,77 -0,33
OND 2,39 0,30 OND 1,15 0,09
Table 1. Annual and seasonal rainfall trends (mm/year) and the correlation coefficient (r) in
the availability record (left panel) and from the 1980s (right panel) for UB (upper panel) and
LB (bottom panel). Significant correlations at 95% confidence level are enhanced in italics.
The availability record for UB is 1982-2007, so only one period is detailed.
Although there is some controversy about the actual causes of land use changes and the relationship with observed rainfall trends, some authors have analyzed the impact of land
www.intechopen.com
Climate Variability – Some Aspects, Challenges and Prospects 146
cover over climate (Lee and Berbery, 2010; Jin et al, 2000; Mabuchi et al, 2005, among others). In particular, Lee (2010) and Lee and Berbery (2010) studied these impacts in the La Plata Basin, where the Bermejo River Basin is included. They proved that areas where croplands replace forests would experience an increase in albedo, a reduction of surface friction and sensible heat. The effect on sensible heat seems to dominate and leads to a reduction in convective instability and the stronger low level winds due to reduced friction enhance moisture advection out of the basin. The two effects, increased stability and reduced moisture flux, result in a reduction of precipitation.
4. Summer rainfall prediction
As the maximum rainfall season was summer (JFM), this period will be the subject of study from now onwards. In order to create a prediction scheme for JFM rainfall, simultaneous (JFM rainfall with JMF circulation variable) and one month (JFM rainfall with December circulation variable) lagged correlations were calculated to find the existing relationship between summer rainfall and SST, G1000, G500, G200, U and V in each sub-basin. The 1982-2007 and 1968-2007 data periods were used for UB and LB, respectively. Therefore, the correlation required for significance at the 95% confidence level was 0,4 for UB and 0,32 for LB. The areas with high correlation between JFM rainfall and the previous month circulation features (circulation variable in December) were used to define some predictors which will be detailed in Table 2. Only in some cases the simultaneous correlation maps will be described as well in order to determinate if the signal lasts until the rain. However, predictors to carry out the regression scheme for JFM rainfall, will be SST or circulation variables in December; they will be carefully selected, based on statistical significance and physical reasoning.
4.1 Summer rainfall prediction in LB
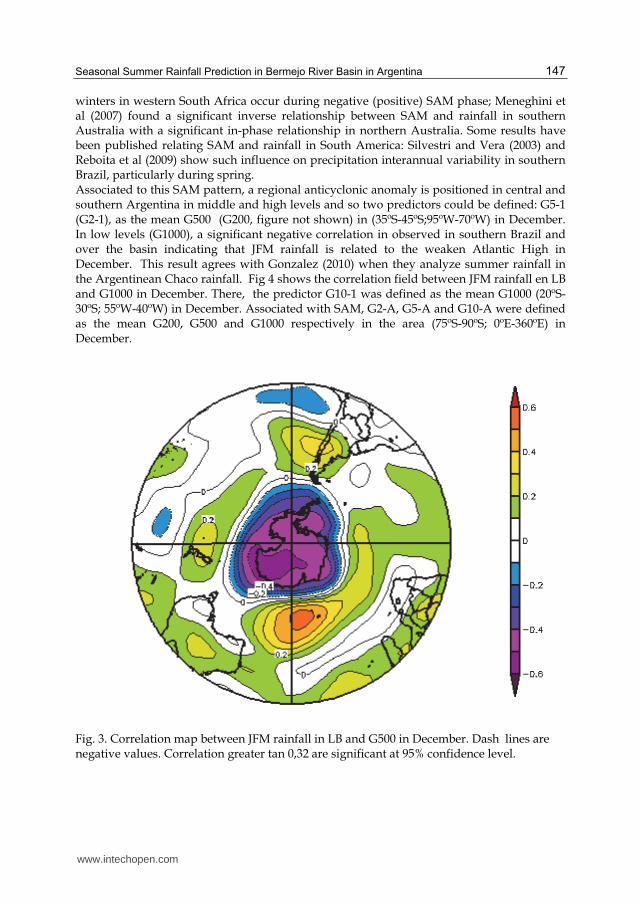
The first stage of the model development was the analysis of the statistical association between JFM rainfall in LB and global SST in December. The correlation map (figure not shown) shows significant positive correlation, only in an area along the coast of Southern Brazil, between (25ºS-40ºS; 290ºE-340ºE) (AS), indicating that warm sea is associated to rainfall in LB. The correlation maps between JFM rainfall in LB and G200 (figure not shown), G500 (Fig 3) and G1000 (Fig 4) in December show an annular-like pattern (SAM, Southern Annular Mode, Thompson and Wallace 2000) at high latitudes combined with wave-like pattern at middle latitudes. In general, a measure of SAM is the Antarctic Oscillation index (AAO), that is defined as the leading principal component of 850 hPa geopotential height anomalies south of 20ºS (Thompson and Wallace 2000). The SAM is a nearly annular pattern with a large low pressure anomaly centred on the South Pole and a ring of high pressure anomalies at mid-latitudes. This feature increases zonal winds, decreases heat exchange between poles and mid-latitudes and so modifies storm tracks. The main feature in Figs 3 and 4 indicates that the presence of this positive SAM phase in December is associated with rainfall greater than normal in JFM in LB. Indeed, the correlation between AAO in December and JFM rainfall in LB is 0,39, as it is detailed in Table 2. Some authors have shown that SAM might have influence on rainfall variability in some regions of the Southern Hemisphere. For example, Zheng and Frederiksen (2006), show that this signal affects summer rainfall variability in the New Zealand; Reason and Rouault (2005) have shown that wetter (drier)
www.intechopen.com
Seasonal Summer Rainfall Prediction in Bermejo River Basin in Argentina 147
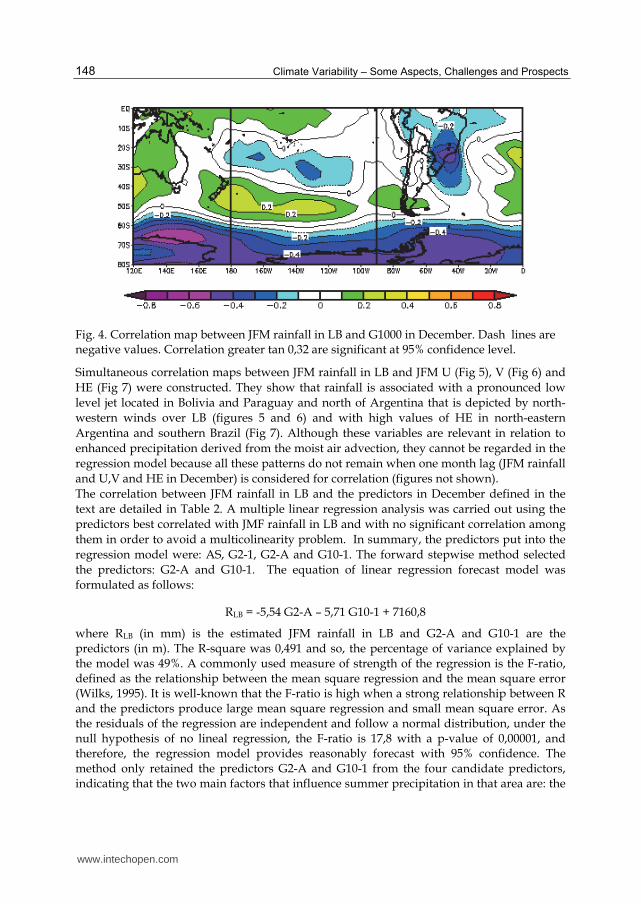
winters in western South Africa occur during negative (positive) SAM phase; Meneghini et al (2007) found a significant inverse relationship between SAM and rainfall in southern Australia with a significant in-phase relationship in northern Australia. Some results have been published relating SAM and rainfall in South America: Silvestri and Vera (2003) and Reboita et al (2009) show such influence on precipitation interannual variability in southern Brazil, particularly during spring. Associated to this SAM pattern, a regional anticyclonic anomaly is positioned in central and southern Argentina in middle and high levels and so two predictors could be defined: G5-1 (G2-1), as the mean G500 (G200, figure not shown) in (35ºS-45ºS;95ºW-70ºW) in December. In low levels (G1000), a significant negative correlation in observed in southern Brazil and over the basin indicating that JFM rainfall is related to the weaken Atlantic High in December. This result agrees with Gonzalez (2010) when they analyze summer rainfall in the Argentinean Chaco rainfall. Fig 4 shows the correlation field between JFM rainfall en LB and G1000 in December. There, the predictor G10-1 was defined as the mean G1000 (20ºS-30ºS; 55ºW-40ºW) in December. Associated with SAM, G2-A, G5-A and G10-A were defined as the mean G200, G500 and G1000 respectively in the area (75ºS-90ºS; 0ºE-360ºE) in December.
Fig. 3. Correlation map between JFM rainfall in LB and G500 in December. Dash lines are negative values. Correlation greater tan 0,32 are significant at 95% confidence level.
www.intechopen.com
Climate Variability – Some Aspects, Challenges and Prospects 148
Fig. 4. Correlation map between JFM rainfall in LB and G1000 in December. Dash lines are negative values. Correlation greater tan 0,32 are significant at 95% confidence level.
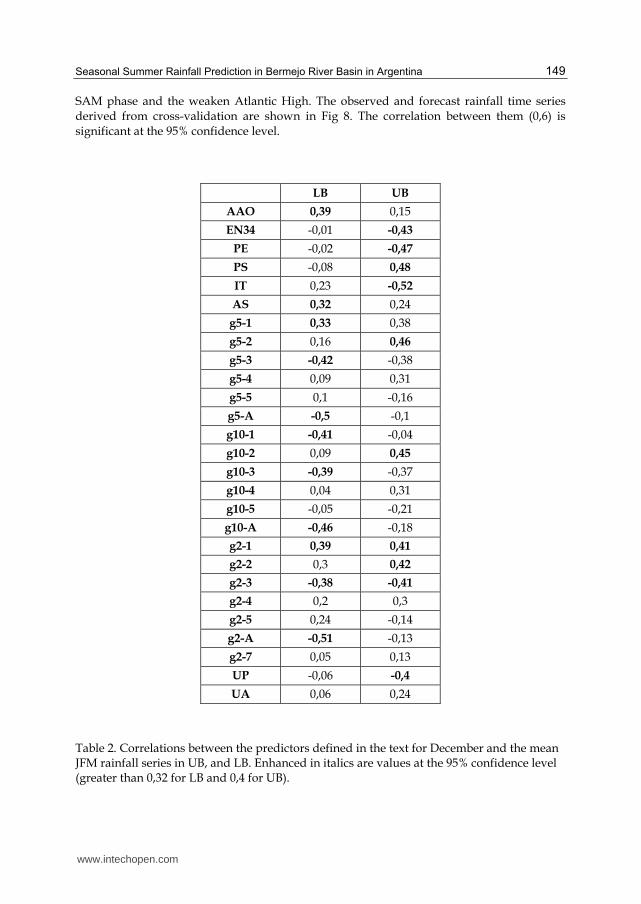
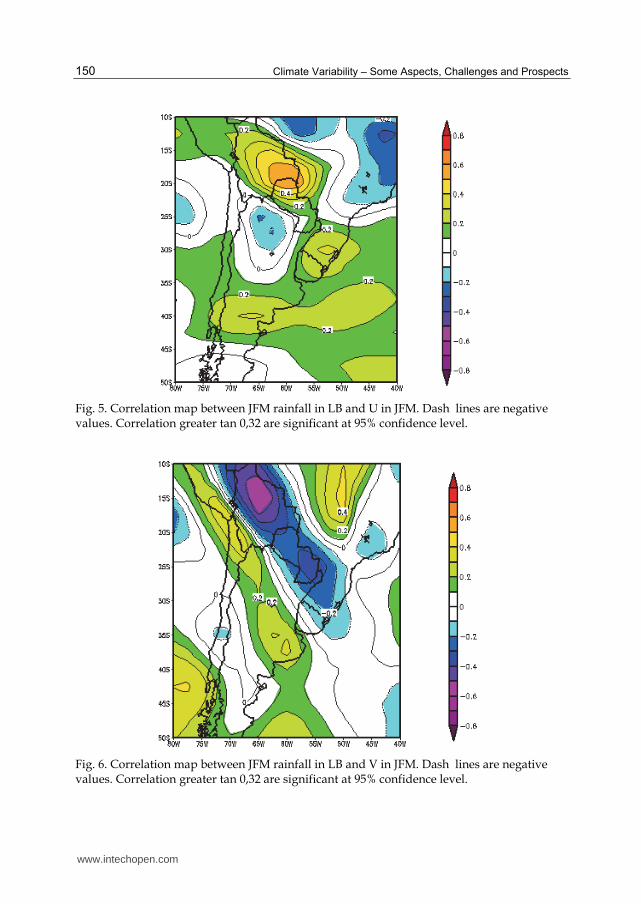
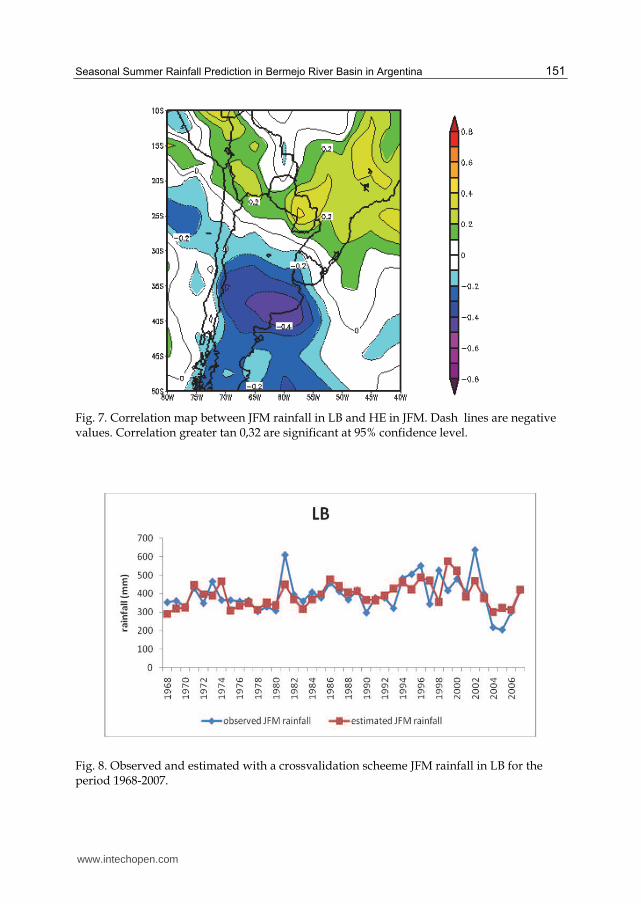
Simultaneous correlation maps between JFM rainfall in LB and JFM U (Fig 5), V (Fig 6) and
HE (Fig 7) were constructed. They show that rainfall is associated with a pronounced low
level jet located in Bolivia and Paraguay and north of Argentina that is depicted by north-
western winds over LB (figures 5 and 6) and with high values of HE in north-eastern
Argentina and southern Brazil (Fig 7). Although these variables are relevant in relation to
enhanced precipitation derived from the moist air advection, they cannot be regarded in the
regression model because all these patterns do not remain when one month lag (JFM rainfall
and U,V and HE in December) is considered for correlation (figures not shown).
The correlation between JFM rainfall in LB and the predictors in December defined in the
text are detailed in Table 2. A multiple linear regression analysis was carried out using the
predictors best correlated with JMF rainfall in LB and with no significant correlation among
them in order to avoid a multicolinearity problem. In summary, the predictors put into the
regression model were: AS, G2-1, G2-A and G10-1. The forward stepwise method selected
the predictors: G2-A and G10-1. The equation of linear regression forecast model was
formulated as follows:
RLB = -5,54 G2-A – 5,71 G10-1 + 7160,8
where RLB (in mm) is the estimated JFM rainfall in LB and G2-A and G10-1 are the predictors (in m). The R-square was 0,491 and so, the percentage of variance explained by the model was 49%. A commonly used measure of strength of the regression is the F-ratio, defined as the relationship between the mean square regression and the mean square error (Wilks, 1995). It is well-known that the F-ratio is high when a strong relationship between R and the predictors produce large mean square regression and small mean square error. As the residuals of the regression are independent and follow a normal distribution, under the null hypothesis of no lineal regression, the F-ratio is 17,8 with a p-value of 0,00001, and therefore, the regression model provides reasonably forecast with 95% confidence. The method only retained the predictors G2-A and G10-1 from the four candidate predictors, indicating that the two main factors that influence summer precipitation in that area are: the
www.intechopen.com
Seasonal Summer Rainfall Prediction in Bermejo River Basin in Argentina 149
SAM phase and the weaken Atlantic High. The observed and forecast rainfall time series derived from cross-validation are shown in Fig 8. The correlation between them (0,6) is significant at the 95% confidence level.
LB UB
AAO 0,39 0,15
EN34 -0,01 -0,43
PE -0,02 -0,47
PS -0,08 0,48
IT 0,23 -0,52
AS 0,32 0,24
g5-1 0,33 0,38
g5-2 0,16 0,46
g5-3 -0,42 -0,38
g5-4 0,09 0,31
g5-5 0,1 -0,16
g5-A -0,5 -0,1
g10-1 -0,41 -0,04
g10-2 0,09 0,45
g10-3 -0,39 -0,37
g10-4 0,04 0,31
g10-5 -0,05 -0,21
g10-A -0,46 -0,18
g2-1 0,39 0,41
g2-2 0,3 0,42
g2-3 -0,38 -0,41
g2-4 0,2 0,3
g2-5 0,24 -0,14
g2-A -0,51 -0,13
g2-7 0,05 0,13
UP -0,06 -0,4
UA 0,06 0,24
Table 2. Correlations between the predictors defined in the text for December and the mean JFM rainfall series in UB, and LB. Enhanced in italics are values at the 95% confidence level (greater than 0,32 for LB and 0,4 for UB).
www.intechopen.com
Climate Variability – Some Aspects, Challenges and Prospects 150
Fig. 5. Correlation map between JFM rainfall in LB and U in JFM. Dash lines are negative values. Correlation greater tan 0,32 are significant at 95% confidence level.
Fig. 6. Correlation map between JFM rainfall in LB and V in JFM. Dash lines are negative values. Correlation greater tan 0,32 are significant at 95% confidence level.
www.intechopen.com
Seasonal Summer Rainfall Prediction in Bermejo River Basin in Argentina 151
Fig. 7. Correlation map between JFM rainfall in LB and HE in JFM. Dash lines are negative values. Correlation greater tan 0,32 are significant at 95% confidence level.
Fig. 8. Observed and estimated with a crossvalidation scheeme JFM rainfall in LB for the period 1968-2007.
www.intechopen.com
Climate Variability – Some Aspects, Challenges and Prospects 152
4.2 Summer rainfall prediction in UB
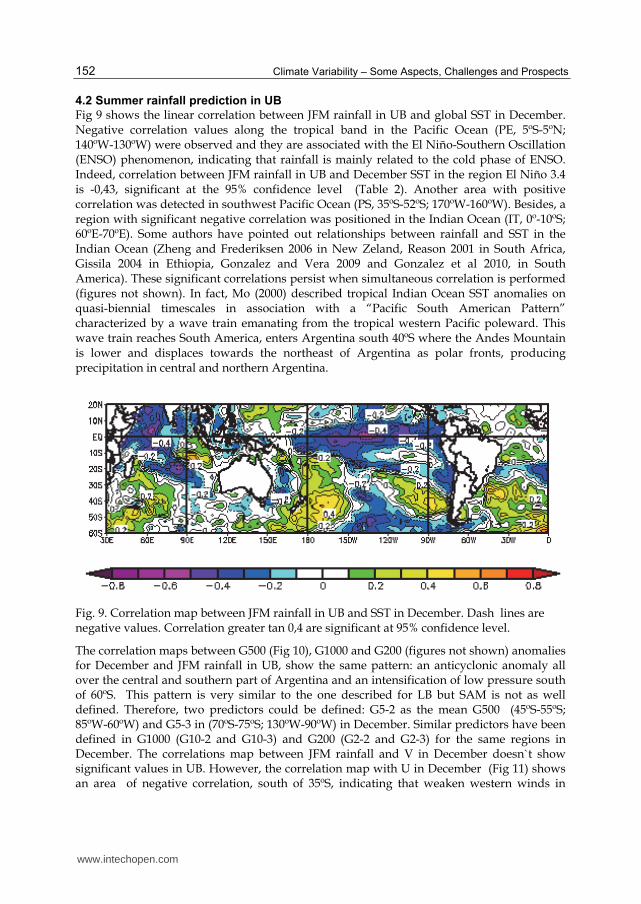
Fig 9 shows the linear correlation between JFM rainfall in UB and global SST in December. Negative correlation values along the tropical band in the Pacific Ocean (PE, 5ºS-5ºN; 140ºW-130ºW) were observed and they are associated with the El Niño-Southern Oscillation (ENSO) phenomenon, indicating that rainfall is mainly related to the cold phase of ENSO. Indeed, correlation between JFM rainfall in UB and December SST in the region El Niño 3.4 is -0,43, significant at the 95% confidence level (Table 2). Another area with positive correlation was detected in southwest Pacific Ocean (PS, 35ºS-52ºS; 170ºW-160ºW). Besides, a region with significant negative correlation was positioned in the Indian Ocean (IT, 0º-10ºS; 60ºE-70ºE). Some authors have pointed out relationships between rainfall and SST in the Indian Ocean (Zheng and Frederiksen 2006 in New Zeland, Reason 2001 in South Africa, Gissila 2004 in Ethiopia, Gonzalez and Vera 2009 and Gonzalez et al 2010, in South America). These significant correlations persist when simultaneous correlation is performed (figures not shown). In fact, Mo (2000) described tropical Indian Ocean SST anomalies on quasi-biennial timescales in association with a “Pacific South American Pattern” characterized by a wave train emanating from the tropical western Pacific poleward. This wave train reaches South America, enters Argentina south 40ºS where the Andes Mountain is lower and displaces towards the northeast of Argentina as polar fronts, producing precipitation in central and northern Argentina.
Fig. 9. Correlation map between JFM rainfall in UB and SST in December. Dash lines are negative values. Correlation greater tan 0,4 are significant at 95% confidence level.
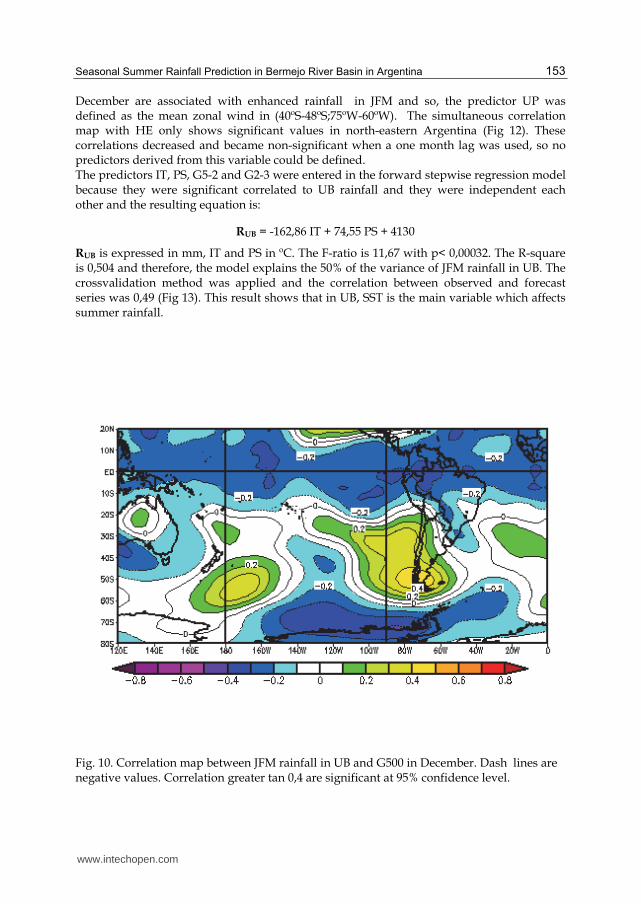
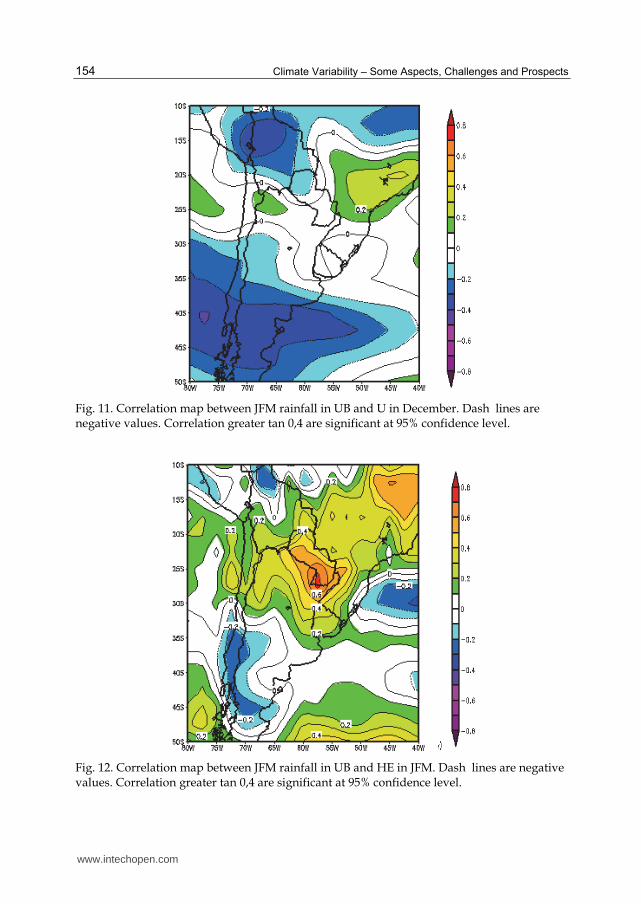
The correlation maps between G500 (Fig 10), G1000 and G200 (figures not shown) anomalies for December and JFM rainfall in UB, show the same pattern: an anticyclonic anomaly all over the central and southern part of Argentina and an intensification of low pressure south of 60ºS. This pattern is very similar to the one described for LB but SAM is not as well defined. Therefore, two predictors could be defined: G5-2 as the mean G500 (45ºS-55ºS; 85ºW-60ºW) and G5-3 in (70ºS-75ºS; 130ºW-90ºW) in December. Similar predictors have been defined in G1000 (G10-2 and G10-3) and G200 (G2-2 and G2-3) for the same regions in December. The correlations map between JFM rainfall and V in December doesn`t show significant values in UB. However, the correlation map with U in December (Fig 11) shows an area of negative correlation, south of 35ºS, indicating that weaken western winds in
www.intechopen.com
Seasonal Summer Rainfall Prediction in Bermejo River Basin in Argentina 153
December are associated with enhanced rainfall in JFM and so, the predictor UP was defined as the mean zonal wind in (40ºS-48ºS;75ºW-60ºW). The simultaneous correlation map with HE only shows significant values in north-eastern Argentina (Fig 12). These correlations decreased and became non-significant when a one month lag was used, so no predictors derived from this variable could be defined. The predictors IT, PS, G5-2 and G2-3 were entered in the forward stepwise regression model because they were significant correlated to UB rainfall and they were independent each other and the resulting equation is:
RUB = -162,86 IT + 74,55 PS + 4130
RUB is expressed in mm, IT and PS in ºC. The F-ratio is 11,67 with p< 0,00032. The R-square is 0,504 and therefore, the model explains the 50% of the variance of JFM rainfall in UB. The crossvalidation method was applied and the correlation between observed and forecast series was 0,49 (Fig 13). This result shows that in UB, SST is the main variable which affects summer rainfall.
Fig. 10. Correlation map between JFM rainfall in UB and G500 in December. Dash lines are negative values. Correlation greater tan 0,4 are significant at 95% confidence level.
www.intechopen.com
Climate Variability – Some Aspects, Challenges and Prospects 154
Fig. 11. Correlation map between JFM rainfall in UB and U in December. Dash lines are negative values. Correlation greater tan 0,4 are significant at 95% confidence level.
Fig. 12. Correlation map between JFM rainfall in UB and HE in JFM. Dash lines are negative values. Correlation greater tan 0,4 are significant at 95% confidence level.
www.intechopen.com
Seasonal Summer Rainfall Prediction in Bermejo River Basin in Argentina 155
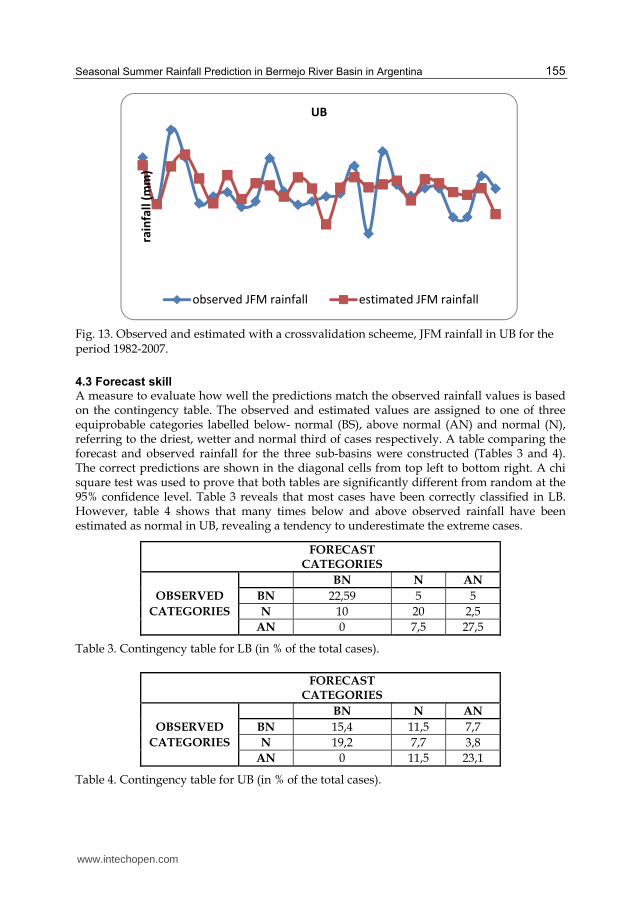
Fig. 13. Observed and estimated with a crossvalidation scheeme, JFM rainfall in UB for the period 1982-2007.
4.3 Forecast skill A measure to evaluate how well the predictions match the observed rainfall values is based on the contingency table. The observed and estimated values are assigned to one of three equiprobable categories labelled below- normal (BS), above normal (AN) and normal (N), referring to the driest, wetter and normal third of cases respectively. A table comparing the forecast and observed rainfall for the three sub-basins were constructed (Tables 3 and 4). The correct predictions are shown in the diagonal cells from top left to bottom right. A chi square test was used to prove that both tables are significantly different from random at the 95% confidence level. Table 3 reveals that most cases have been correctly classified in LB. However, table 4 shows that many times below and above observed rainfall have been estimated as normal in UB, revealing a tendency to underestimate the extreme cases.
FORECAST
CATEGORIES
BN N AN
OBSERVED BN 22,59 5 5
CATEGORIES N 10 20 2,5
AN 0 7,5 27,5
Table 3. Contingency table for LB (in % of the total cases).
FORECAST
CATEGORIES
BN N AN
OBSERVED BN 15,4 11,5 7,7
CATEGORIES N 19,2 7,7 3,8
AN 0 11,5 23,1
Table 4. Contingency table for UB (in % of the total cases).
rain
fall
(m
m)
UB
observed JFM rainfall estimated JFM rainfall
www.intechopen.com
Climate Variability – Some Aspects, Challenges and Prospects 156
To evaluate the accuracy of the categorized forecast, the hit rate (H), the probability of detection (POD) and the false alarm relation (FAR) were calculated for each category. Table 5 shows these accuracy measures for the events “BN” and “AN”. They were calculated collapsing the 3x3 contingency table into two 2x2 tables. Each one was constructed by considering the “forecast event” (BN and AN) in distinction to the complementary “non forecast event” (non-BN or non-AN). The values in Table 5 indicate that the method detects some cases of extreme rainfall, improving the climatology. Results in LB are better than in UB. The probability to detect above normal rainfall events is in general, better than the probability to detect below normal rainfall ones. The probability to give a false alarm in a below normal rainfall event is greater than in the above normal cases.
LB UB
BN AN BN AN
H 0,8 0,85 0,62 0,77
POD 0,69 0,79 0,44 0,67
FAR 0,31 0,21 0,56 0,33
Table 5. Measures of accuracy for above-normal rainfall events (AN) and for below normal rainfall events (BN) for each one of the sub-basins (LB and UB).
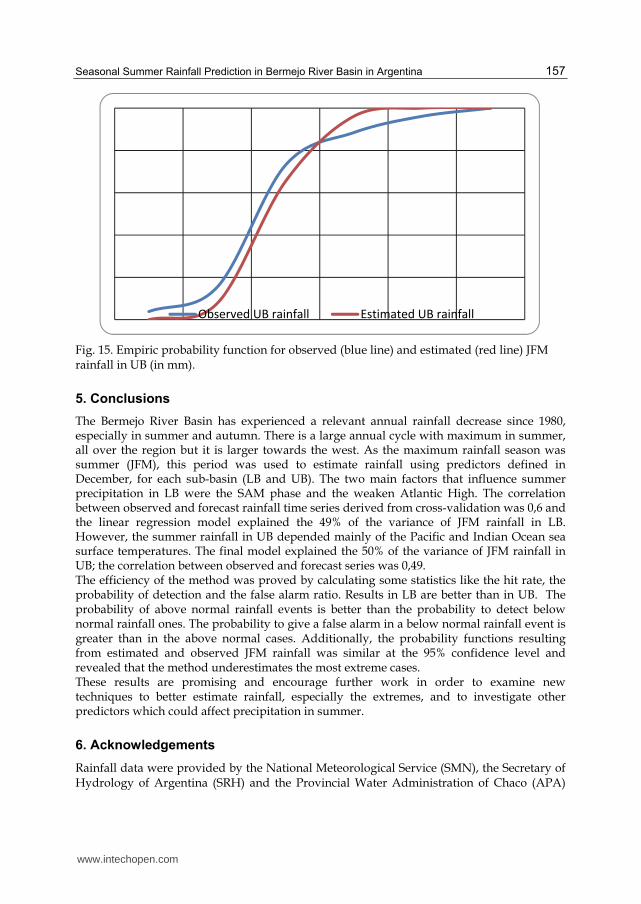
In order to convert the individual estimations in a probabilistic forecast, the accumulated frequencies were calculated for the observed and forecast rainfall values and the empiric probability functions were drawn for each sub-basin (Fig 14 and 15). A chi square test was used for each pair of probability functions and in all cases they resulted significantly similar each other at the 95% confidence level. These figures reveal that, in both LB and UB, the derived prediction schemes tend to underestimate the extremes. However in LB sub-basin, cases of precipitation greater than 300 mm and lower than 400mm, were well detected.
Fig. 14. Empiric probability function for observed (blue line) and estimated (red line) JFM rainfall in LB (in mm).
Observed LB rainfall Estimated LB rainfall
www.intechopen.com
Seasonal Summer Rainfall Prediction in Bermejo River Basin in Argentina 157
Fig. 15. Empiric probability function for observed (blue line) and estimated (red line) JFM rainfall in UB (in mm).
5. Conclusions
The Bermejo River Basin has experienced a relevant annual rainfall decrease since 1980, especially in summer and autumn. There is a large annual cycle with maximum in summer, all over the region but it is larger towards the west. As the maximum rainfall season was summer (JFM), this period was used to estimate rainfall using predictors defined in December, for each sub-basin (LB and UB). The two main factors that influence summer precipitation in LB were the SAM phase and the weaken Atlantic High. The correlation between observed and forecast rainfall time series derived from cross-validation was 0,6 and the linear regression model explained the 49% of the variance of JFM rainfall in LB. However, the summer rainfall in UB depended mainly of the Pacific and Indian Ocean sea surface temperatures. The final model explained the 50% of the variance of JFM rainfall in UB; the correlation between observed and forecast series was 0,49. The efficiency of the method was proved by calculating some statistics like the hit rate, the probability of detection and the false alarm ratio. Results in LB are better than in UB. The probability of above normal rainfall events is better than the probability to detect below normal rainfall ones. The probability to give a false alarm in a below normal rainfall event is greater than in the above normal cases. Additionally, the probability functions resulting from estimated and observed JFM rainfall was similar at the 95% confidence level and revealed that the method underestimates the most extreme cases. These results are promising and encourage further work in order to examine new techniques to better estimate rainfall, especially the extremes, and to investigate other predictors which could affect precipitation in summer.
6. Acknowledgements
Rainfall data were provided by the National Meteorological Service (SMN), the Secretary of Hydrology of Argentina (SRH) and the Provincial Water Administration of Chaco (APA)
Observed UB rainfall Estimated UB rainfall
www.intechopen.com
Climate Variability – Some Aspects, Challenges and Prospects 158
and the Regional Commission of Bermejo River (COREBE). Images from figures 3 to 7, 9 to 12 were provided by the NOAA/ESRL Physical Sciences Division, Boulder Colorado from their web site: http://www.cdc.noaa.gov. This research was supported by UBACyT CC02, UBACyT 1028 (2011-2014) and CONICET PIP 112-200801-00195.
7. References
Baldi, G.; Nosetto, M. & Jobbagy, E. (2008). The effect of tree plantations on south American ecosystems functioning. Ambiencia, Vol. 4, pp. 23-34, ISSN 1808-0251.
Barros, V.; Castañeda, M.E. & Doyle, M. (2000). Precipitation trends in Southern South America, east of the Andes: An indication of climate variability, In: Southern Hemisphere Paleo-and Neoclimates: Key Sites, Methods, Data and Models, Peter Smolka and Wolfgang Volkheimer, pp 187-208, Springer.
Barros, V.; Doyle, M.; González, M.H.; Camilloni, I.; Bejarán, R. and Caffera, M. (2002). Revision of the south american monsoon system and climate in subtropical South America south of 20°S. Meteorologica, Vol. 27, pp. 33-58, ISSN 1325 187X.
Barros, V. and Doyle, M. (2002). Mid-summer low level circulation and precipitation in subtropical South America and related sea surface temperature anomalies in the South Atlantic. J Climate, Vol. 15, pp. 3394-3410, ISSN 0894 8755.
Barros, V.; Doyle, M. and Camilloni, I. (2008). Precipitation trends in southeastern South America: relationship with ENSO phases and the low-level circulation. Theoretical and Appl Climatology, Vol. 93 1-2, pp. 19-33, ISSN 0177-798X
Darlington, R.B. (1990). Regression and linear models. McGraw-Hill, ISBN 0070153728, New York.
Flores, O.K. and González, M.H. (2009). Análisis de la precipitación en la llanura chaqueña argentina y su relación con el comportamiento de la circulación atmosférica y las temperaturas de la superficie del mar. Proceeding of CONGREMET X - CLIMET XIII, ISBN 978-987-22411-1-7, Buenos Aires Argentina, October 2009.
Gissila, T.; Black, E.; Grime, D.I.F. and Slingo, J.M. (2004). Seasonal forecasting of the Ethiopian summer rains. Int J Climatol, Vol. 24, pp. 1345-1358, ISSN 0899-8418.
González, M.H. and Barros, V. (1998). The relation between tropical convection in South America and the end of the dry period in subtropical Argentina. Int J Climatol, Vol. 18 No. 15, pp.1669-1685, ISSN 0899-8418.
González, M.H. ; Castañeda, M.E. and Texeira Neri, J. (2005). Evolución de la precipitación en el noreste de Argentina y sur de Brasil. Proceeding Congremet IX , ISBN 987-22411-0-4, Buenos Aires Argentina, October 2005.
González, M.H. and Vera, C.S. (2010). On the interannual winter rainfall variability in Southern Andes. Int J Climatol, Vol. 30, pp. 643-657, ISSN 0899-8418.
González, M.H., Skansi, M.M. and Losano, F. (2010). A statistical study of seasonal winter rainfall prediction in the Comahue region (Argentine), ATMOSFERA, Vol. 23, No. 3, pp. 277-294, ISSN 0187-6236.
González, M.H. (2010). Los cambios observados en la precipitación en el Chaco Argentino. Proceeding II Congreso venezolano de Agrometeorología, El Tigre Venezuela, May 2010.
Grimm, A.; Barros, V. and Doyle, M. (2000). Climate variability in Southern South America associated with El Niño and La Niña events. J Climate, Vol. 13, pp. 35-58, ISSN 0894 8755.
www.intechopen.com
Seasonal Summer Rainfall Prediction in Bermejo River Basin in Argentina 159
Jin, J.; Lu, S.; Li, S. and Miller, N.L. (2000). Impact of Land Use Change on the Local Climate over the Tibetan Plateau. Advances in Meteorology, doi:10.1155/2010/837480, ISSN 1687-9309.
Lee, S.J. and Berbery, E.H. (2010). On the effects of land cover change on the climate of La Plata Basin. J Hydrometeor, submitted, ISSN 1525-755X.
Liebmann, B.; Vera, C.; Carvalho, L.; Camilloni, I.; Hoerling, M.; Allured, D.; Barros, V; Báez, J. and Bidegain, M. (2004). An Observed Trend in Central South American Precipitation. J Climate, Vol. 17, No. 22, pp. 4357-4367, ISSN 0894 8755.
Kalnay, E; Kanamitsu, M.; Kistler, R.; Collins, W.; Deaven, D.; Gandin, L.; Iredell, M.; Saha, S.; White, G.; Woollen, J.; Zhu, I.; Chelliah, M.; Ebisuzaki, W.; Higgings, W.; Janowiak, J.; Mo, K.C.; Ropelewski, C.; Wang, J.; Leetmaa, A.; Reynolds, R.; Jenne, R. and Joseph, D. (1996). The NCEP/NCAR Reanalysis 40 years- project. Bull Amer Meteor Soc, Vol. 77, pp. 437-471, ISSN 1520-0477.
Kiladis, G. and Diaz, H. (1989). Global Climatic Anomalies associated with extremes in the Southern Oscillation. J Climate, Vol. 2, pp. 1069-1090, ISSN 0894 8755.
Lenters, J.D. and Cook, K.H. (1997). On the origin of Bolivian High and related circulation feature of the South American Climate. J Atmos Sci, Vol. 54, pp. 656-677, ISSN 0022-4928.
Mabuchi, K.; Sato, Y. and Kida, H. (2005). Climatic Impact of Vegetation Change in the Asian Tropical Region. Part I: Case of the Northern Hemisphere Summer. J Climate, Vol. 18, pp. 410-428, ISSN 0894 8755.
Minetti, J.L.; Vargas, W.M.; Poblete, A.G.; De la Zerda, L.R. and Acuña, L.R. (2010). Regional rought in Southern South America. Theor Appl Climatol. DOI 10.1007/s00704-010-0271-1, ISSN 0177-798X.
Mo, K.C. (2000). Relationships between low frequency variability in the Southern Hemisphere and sea surface temperature anomalies. J Climate, Vol. 13, pp. 3599-3610, ISSN 0894 8755.
Reason, C. (2001). Subtropical Indian Ocean SST dipole events and Southern Africa rainfall. Geophys Res Lett, Vol. 28, pp. 2225-2227, ISSN 0094-8276.
Reason , C. and Rouault, M. (2005). Links between the Antartic Oscillation and winter rainfall over western South Africa. Geophys Res Lett, Vol. 32, DOI: 10.1029/2005GL022419, ISSN 0094-8276.
Reboita, M.S.; Gan, M.A.; Da Rocha, R.P. and Ambrizzi, T. (2010) Regimes de Precipitacao na America Do Sul. Revista Brasilera de Meteorologia, Vol. 25, No. 2, pp. 185-204, ISSN 0102-7786.
Ropelewski, C. and Halpert, M. (1987). Global and Regional scale precipitation patterns associated with El Niño. Mon Wea Rev, Vol. 110, pp. 1606-1626, ISSN 0027-0644.
Silvestri, G. and Vera, C.S. (2003). Antarctic Oscillation signal on precipitation anomalies over southeastern South America. Geophys Res Lett, Vol. 30, No. 21, pp. 21-15, ISSN 0094-8276.
Thompson, D.W. and Wallace, J.M. (2000). Annular modes in the extratropical circulation. Part I: month-to-month variability. J Climate, Vol. 13, pp. 1000-1016, ISSN 0894 8755.
Vera, C.S.; Silvestri, G.; Barros, V. and Carril, A. (2004). Differences in El Niño response in Southern Hemisphere. J Climate, Vol. 17, No. 9, pp. 1741-1753, ISSN 0894 8755.
Vera, C.S.; Higgins, W.; Amador, J.; Ambrizzi, T.; Garreaud, R.; Gochis, D.; Gutzler, D.; Lettenmaier, D.; Marengo, J.; Mechoso, C.R.; Nogues-Paegle, J.; Silva Dias, P.L. and
www.intechopen.com

Climate Variability – Some Aspects, Challenges and Prospects 160
Zhang, C. (2006). Toward a unified view of the American Monsoon Systems. J Climate, Vol. 19, No. 20, pp. 4977-5000, ISSN 0894 8755.
Wang , M. and Paegle, J. (1996). Impact of analysis uncertainty upon regional atmospheric moisture flux. J Geophys Res, Vol. 101, pp. 7291–7303, ISSN 0148-0227.
Wilks, D.S. (1995) Statistical methods in the atmospheric sciences (An introduction), Academic Press, ISBN 0127519653, California USA.
Zheng, X. and Frederiksen, C. (2006). A study of predictable patterns for seasonal forecasting of New Zealand rainfall. J Climate, Vol. 19, pp. 3320-3333, ISSN 0894 8755.
www.intechopen.com

Climate Variability - Some Aspects, Challenges and ProspectsEdited by Dr. Abdel Hannachi
ISBN 978-953-307-699-7Hard cover, 192 pagesPublisher InTechPublished online 18, January, 2012Published in print edition January, 2012
InTech EuropeUniversity Campus STeP Ri Slavka Krautzeka 83/A 51000 Rijeka, Croatia Phone: +385 (51) 770 447 Fax: +385 (51) 686 166www.intechopen.com
InTech ChinaUnit 405, Office Block, Hotel Equatorial Shanghai No.65, Yan An Road (West), Shanghai, 200040, China
Phone: +86-21-62489820 Fax: +86-21-62489821
This book provides a general introduction to the popular topic of climate variability. It explores various aspectsof climate variability and change from different perspectives, ranging from the basic nature of low-frequencyatmospheric variability to the adaptation to climate variability and change. This easy and accessible book canbe used by professionals and non professionals alike.
How to referenceIn order to correctly reference this scholarly work, feel free to copy and paste the following:
Marcela H. Gonza lez and Ana Maria Murgida (2012). Seasonal Summer Rainfall Prediction in Bermejo RiverBasin in Argentina, Climate Variability - Some Aspects, Challenges and Prospects, Dr. Abdel Hannachi (Ed.),ISBN: 978-953-307-699-7, InTech, Available from: http://www.intechopen.com/books/climate-variability-some-aspects-challenges-and-prospects/seasonal-summer-rainfall-prediction-in-bermejo-river-basin-in-argentina

© 2012 The Author(s). Licensee IntechOpen. This is an open access articledistributed under the terms of the Creative Commons Attribution 3.0License, which permits unrestricted use, distribution, and reproduction inany medium, provided the original work is properly cited.