seasonal effects of water quality: the hidden costs ... - igc · 2nd igc annual south asia growth...
TRANSCRIPT

Seasonal Effects of Water Quality: The Hidden
Costs of the Green Revolution to Infant and Child
Health in India
Elizabeth Brainerd
Nidhiya Menon
2nd IGC Annual South Asia Growth Conference
July 2013
Motivation
• Green Revolution (1965-late 1970s)
– increased agricultural production and helped achieve food security
– exacted a toll on the country’s environment: contamination of water
– technologies: HYV seeds, “double-cropping”, irrigation, pesticides,
and nitrogenous fertilizer
– HYV seeds need more fertilizer and water than do indigenous seeds
• Synthetic nitrogen based fertilizers such as Urea and
Nitrogen-Phosphate-Potassium (NPK)
– heavily over-used
– seepage into surface and ground water through soil run-offs

Trend in consumption of NPK fertilizer in India
0
50
10
015
0
NP
K fe
rtili
zer
use
, kg
pe
r h
ect
are
1960 1970 1980 1990 2000 2010
kg per hectare of cropped area
Consumption of NPK Fertilizer,
Motivation
• Goal of study: evaluate the infant and child health implications
of exposure to fertilizer agrichemicals
– focus on fertilizers because they have relatively clear application times
– concentrations of agrichemicals in water vary seasonally
– water contamination also varies regionally (northern India plants winter
crops; southern India plants summer crops)
– focus on agrichemicals in water as it is considered a reliable measure of
human exposure
Why is this relevant?
• In rural India, women are at the forefront of farming activities
– 55-60 percent of the labor force, so directly exposed
– their children are exposed both in utero and after birth to toxins
– rates of stunting and wasting among Indian children are higher than
predicted given per capita income and infant mortality rates (Deaton
and Dreze, 2009)
• Negative externalities of motile agrichemical-contaminated
water
Why is this relevant?
• Seasonal exposure to water toxins can have inter-generational
effects
– documented link in biomedical studies between low-birth weight and
coronary heart disease which is inheritable
– transmission occurs even without any additional exposure to chemical
contaminants in water
– Behrman and Rosenzweig (2004) note importance of fetal
health/nutrition

Preview of results
• Presence of agrichemicals in water in month of conception
significantly increases infant and neo-natal mortality
– 10 percent increase leads to rise in infant mortality by about 4.6 percent
– 10 percent increase leads to rise in neo-natal mortality by about 6.2
percent
• Agrichemicals in month of conception have significant
negative impacts on height-for-age and weight-for-age z scores
as of age 5
• Negative effects are most evident for vulnerable populations
– children of uneducated poor women in rural India

Preview of results
• Some evidence that exposure beyond the first month matters
(first, second and third trimester exposure)
• Results robust to checks on instruments and omitted variables
such as rainfall, temperature, diseases, timing of conception
and parental characteristics
Previous literature
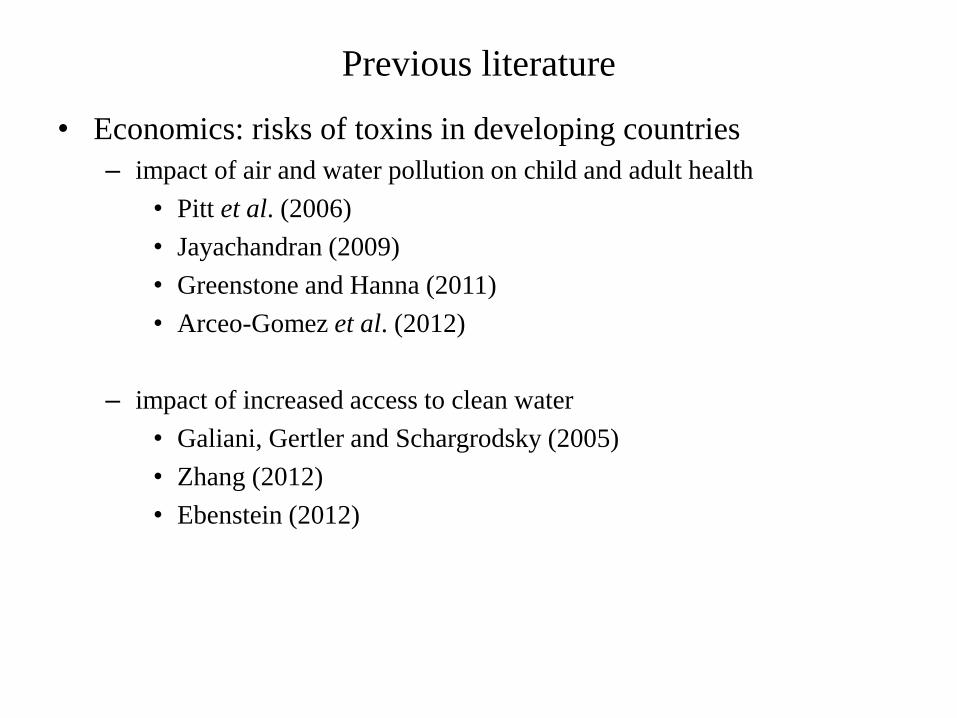
• Economics: risks of toxins in developing countries
– impact of air and water pollution on child and adult health
• Pitt et al. (2006)
• Jayachandran (2009)
• Greenstone and Hanna (2011)
• Arceo-Gomez et al. (2012)
– impact of increased access to clean water
• Galiani, Gertler and Schargrodsky (2005)
• Zhang (2012)
• Ebenstein (2012)
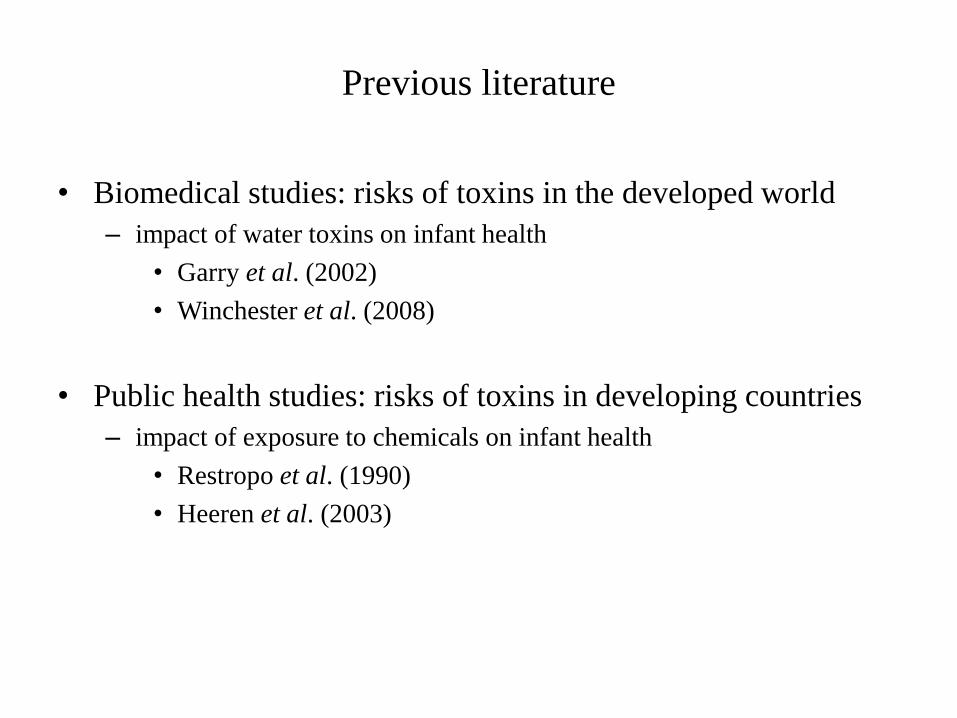
Previous literature
• Biomedical studies: risks of toxins in the developed world
– impact of water toxins on infant health
• Garry et al. (2002)
• Winchester et al. (2008)
• Public health studies: risks of toxins in developing countries
– impact of exposure to chemicals on infant health
• Restropo et al. (1990)
• Heeren et al. (2003)
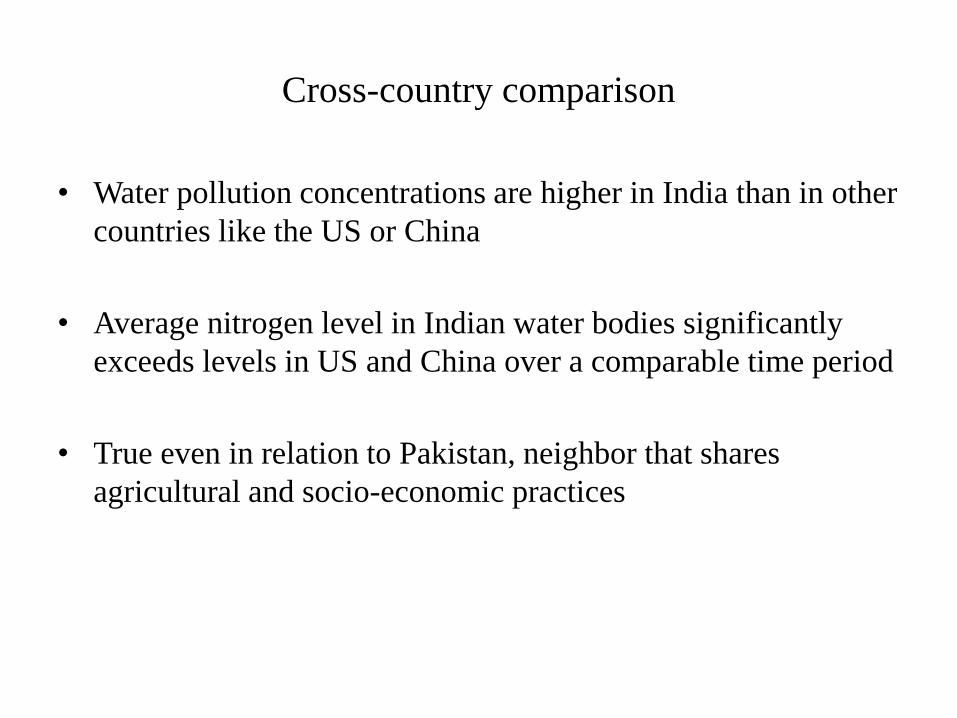
Cross-country comparison
• Water pollution concentrations are higher in India than in other
countries like the US or China
• Average nitrogen level in Indian water bodies significantly
exceeds levels in US and China over a comparable time period
• True even in relation to Pakistan, neighbor that shares
agricultural and socio-economic practices
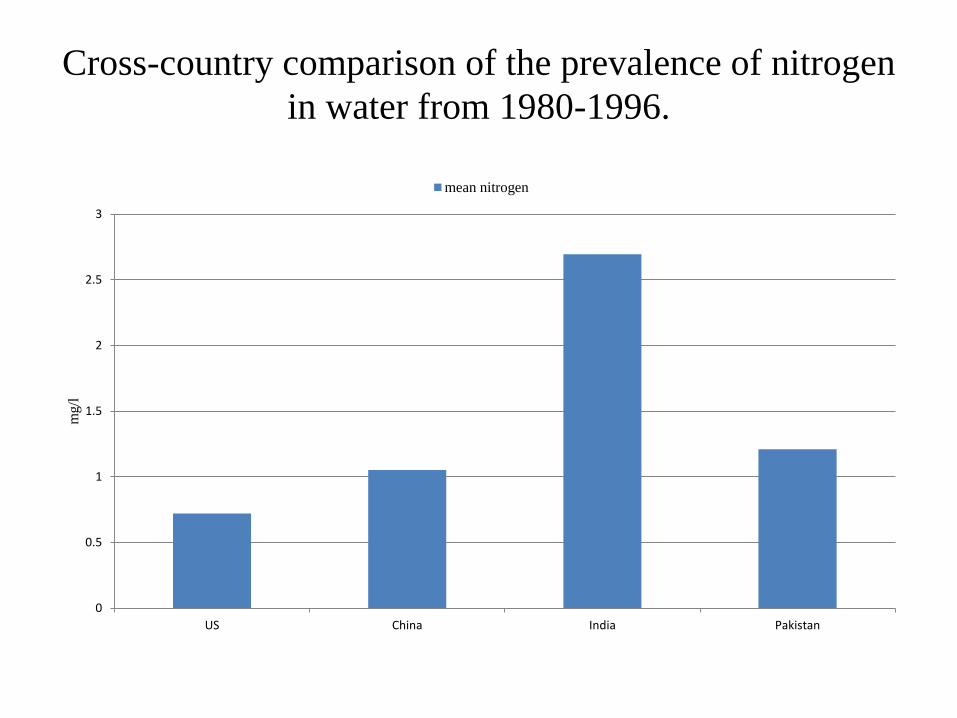
Cross-country comparison of the prevalence of nitrogen
in water from 1980-1996.
0
0.5
1
1.5
2
2.5
3
US China India Pakistan
mg/l
mean nitrogen
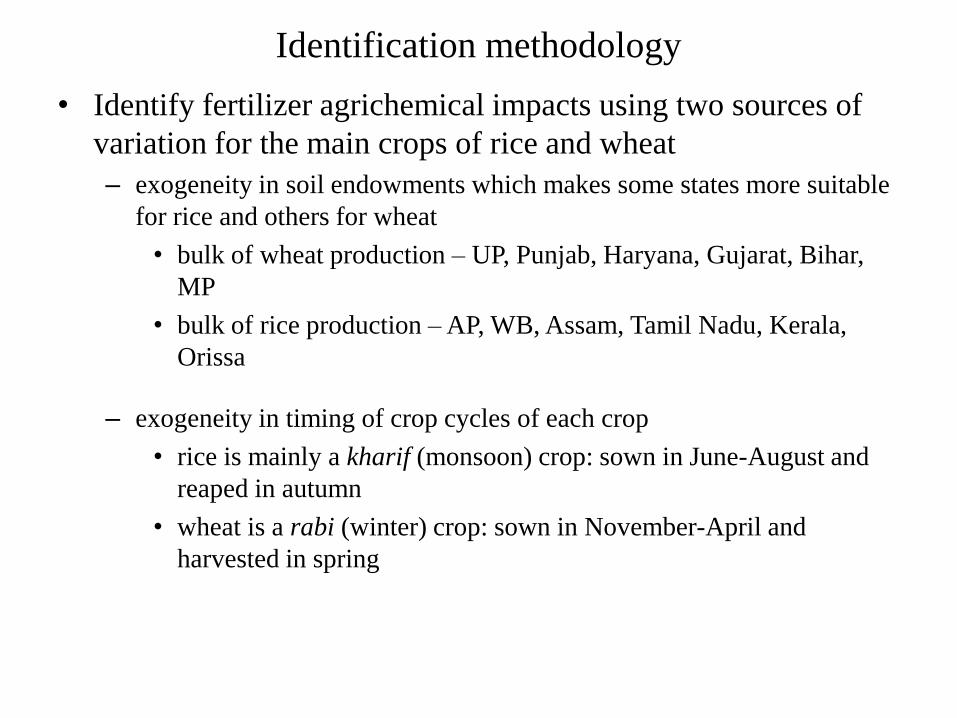
Identification methodology
• Identify fertilizer agrichemical impacts using two sources of
variation for the main crops of rice and wheat
– exogeneity in soil endowments which makes some states more suitable
for rice and others for wheat
• bulk of wheat production – UP, Punjab, Haryana, Gujarat, Bihar,
MP
• bulk of rice production – AP, WB, Assam, Tamil Nadu, Kerala,
Orissa
– exogeneity in timing of crop cycles of each crop
• rice is mainly a kharif (monsoon) crop: sown in June-August and
reaped in autumn
• wheat is a rabi (winter) crop: sown in November-April and
harvested in spring
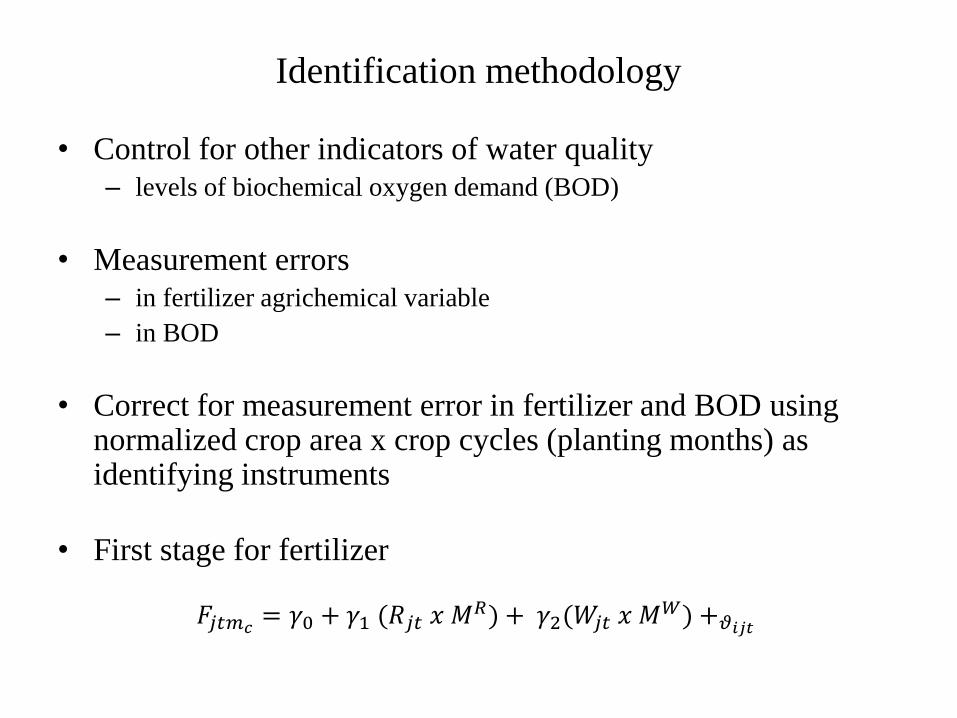
Identification methodology
• Control for other indicators of water quality
– levels of biochemical oxygen demand (BOD)
• Measurement errors
– in fertilizer agrichemical variable
– in BOD
• Correct for measurement error in fertilizer and BOD using normalized crop area x crop cycles (planting months) as identifying instruments
• First stage for fertilizer
𝐹𝑗𝑡𝑚𝑐= 𝛾0 + 𝛾1 (𝑅𝑗𝑡 𝑥 𝑀𝑅) + 𝛾2(𝑊𝑗𝑡 𝑥 𝑀𝑊) +𝜗𝑖𝑗𝑡
Water data
• Central Pollution Control Board (CPCB) of India:
– established by the Water Act of 1974
– GEMS and MINARS programs to monitor water quality
• Location of monitoring stations:
– major rivers/tributaries, wells, lakes, creeks, ponds, canals, and tanks
throughout India
– 870 stations as of 2005

Water data
• CPCB collects statistics on:
– microbiology, nutrients, organic matter, major ions, metals, and
physical/ chemical characteristics of water
• Sources of our water data:
– UNEP/GEMS (1978 to 2005 data – subset of monitoring stations)
– CPCB electronic files (2005 only)
– Greenstone and Hanna (1986 to 2005 data – 489 stations in 424 cities)
– CPCB year books (annual data from 1978 to 2005)
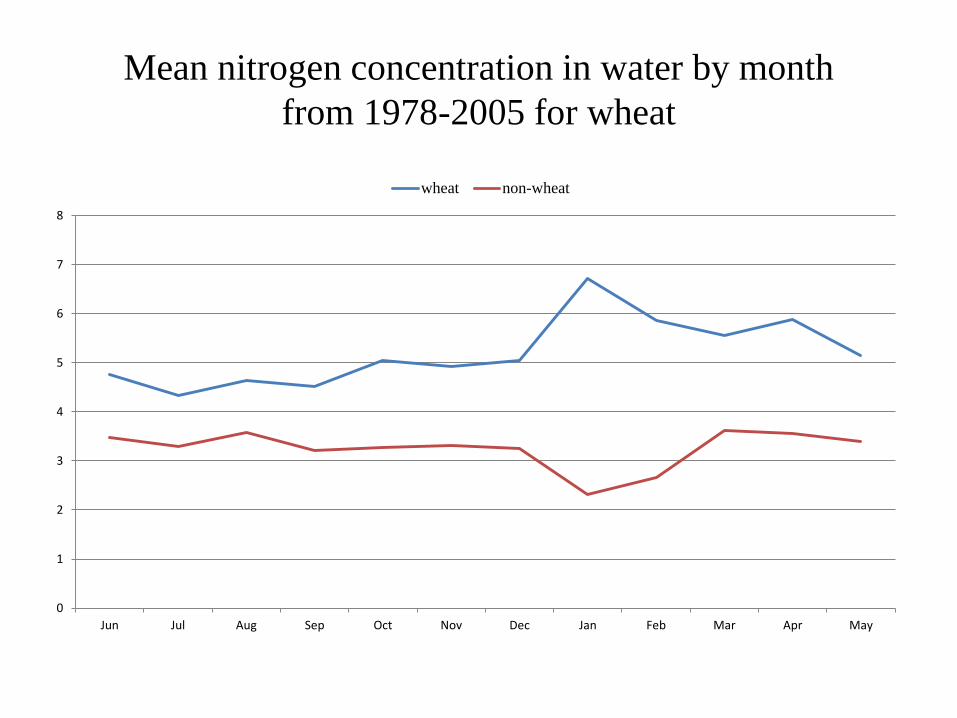
Mean nitrogen concentration in water by month
from 1978-2005 for wheat
0
1
2
3
4
5
6
7
8
Jun Jul Aug Sep Oct Nov Dec Jan Feb Mar Apr May
wheat non-wheat
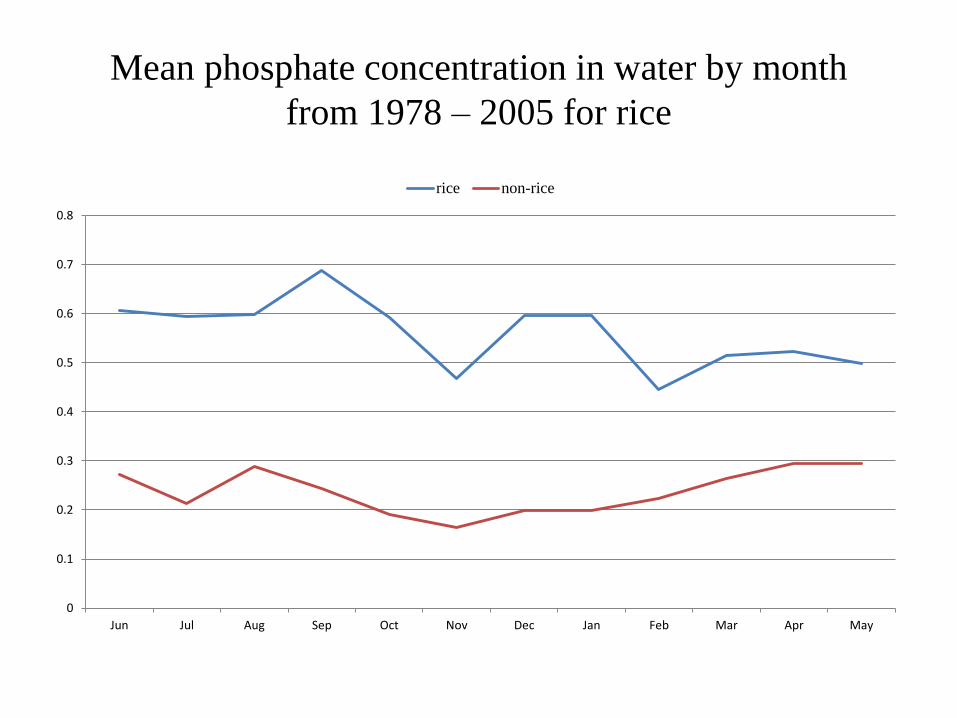
Mean phosphate concentration in water by month
from 1978 – 2005 for rice
0
0.1
0.2
0.3
0.4
0.5
0.6
0.7
0.8
Jun Jul Aug Sep Oct Nov Dec Jan Feb Mar Apr May
rice non-rice
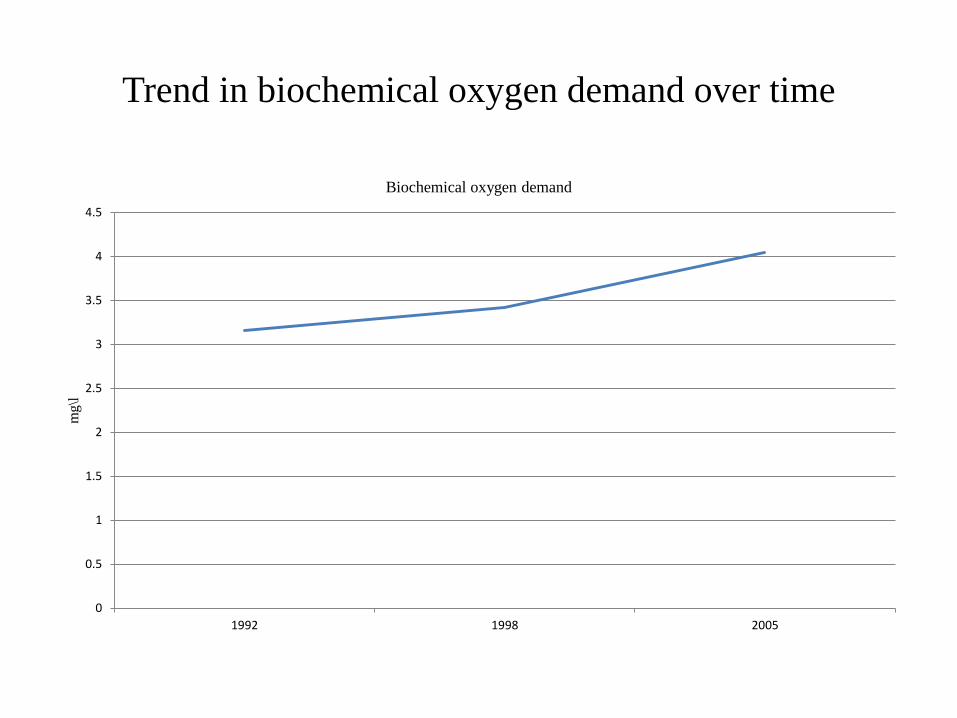
Trend in biochemical oxygen demand over time
0
0.5
1
1.5
2
2.5
3
3.5
4
4.5
1992 1998 2005
mg\l
Biochemical oxygen demand

Trend in presence of fertilizer agrichemicals in water
over time
0
0.1
0.2
0.3
0.4
0.5
0.6
1992 1998 2005
mea
n o
f th
e d
um
my f
or
pre
sence
of
fert
iliz
er a
gri
chem
ical
s
Fertilizer agrichemicals
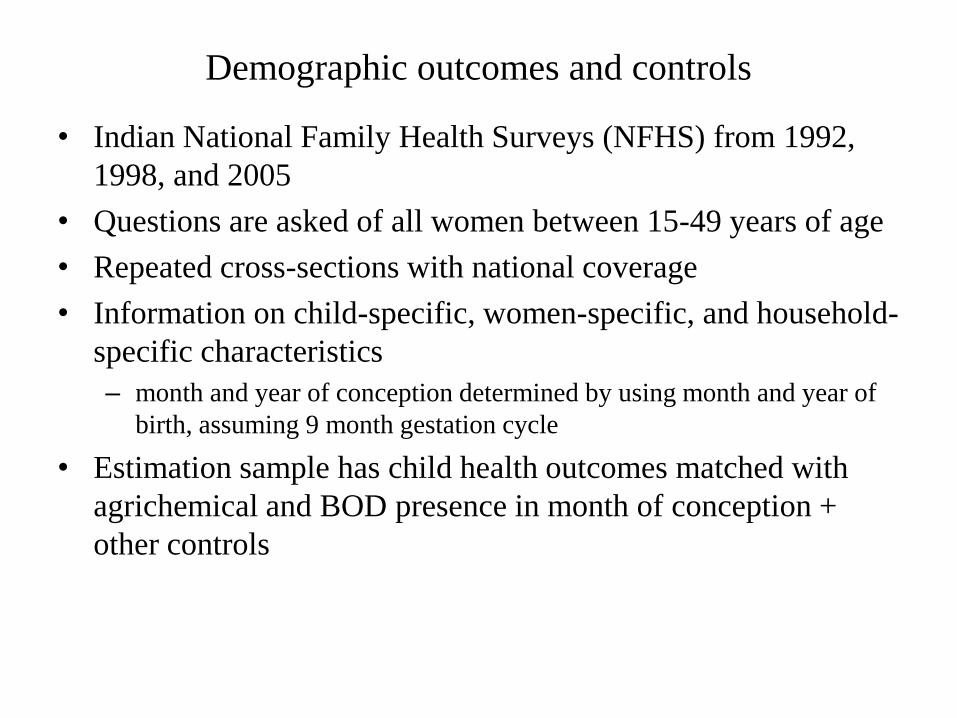
Demographic outcomes and controls
• Indian National Family Health Surveys (NFHS) from 1992,
1998, and 2005
• Questions are asked of all women between 15-49 years of age
• Repeated cross-sections with national coverage
• Information on child-specific, women-specific, and household-
specific characteristics
– month and year of conception determined by using month and year of
birth, assuming 9 month gestation cycle
• Estimation sample has child health outcomes matched with
agrichemical and BOD presence in month of conception +
other controls

Demographic outcomes and controls
• Use additional information on variables for robustness checks
from
– Economic Organization Public Policy Program database (EOPP at
LSE)
– Vital Statistics of India, various years
– Statistical Abstract of India, various years
– Directorate of Economics and Statistics, Department of Agriculture

Summary statistics for key variables All areas Wheat areas Rice areas
Variables Mean SD Mean SD Mean SD
Water Pollutants
Level of BOD in conception month 0.004 (0.007) 0.004 (0.010) 0.002 (0.002)
Dummy for agrichemicals in con. month 0.452 (0.498) 0.390 (0.488) 0.461 (0.499)
Child-specific
Order of birth 2.942 (1.969) 3.255 (2.124) 2.550 (1.693)
Dummy for child was nursed 0.947 (0.225) 0.960 (0.195) 0.929 (0.257)
Male child 0.513 (0.500) 0.501 (0.500) 0.510 (0.500)
Age of child 2.579 (1.667) 2.637 (1.673) 2.453 (1.609)
Women-specific
Women’s age 31.89 (7.193) 32.553 (7.192) 31.08 (7.078)
Dummy for woman is literate 0.348 (0.476) 0.269 (0.444) 0.445 (0.497)
Dummy for woman is currently working 0.390 (0.488) 0.334 (0.472) 0.401 (0.490)
Woman’s body mass index 20.22 (3.680) 20.102 (3.481) 20.44 (3.861)
Dummy for woman consumes fruits 0.317 (0.465) 0.247 (0.431) 0.362 (0.481)
Dummy for woman consumes veges. 0.970 (0.170) 0.971 (0.167) 0.958 (0.201)
Dummy for woman consumes eggs 0.278 (0.448) 0.145 (0.352) 0.513 (0.500)
Dummy for wom. con. chicken/meat/fish 0.247 (0.431) 0.106 (0.307) 0.492 (0.500)
Dummy for woman smokes 0.026 (0.160) 0.040 (0.195) 0.015 (0.120)
Dummy for had care with doctor 0.118 (0.323) 0.074 (0.262) 0.187 (0.390)
Husband’s age 37.96 (8.816) 37.974 (9.104) 37.92 (8.460)
Dummy for husband has no education 0.338 (0.473) 0.359 (0.480) 0.342 (0.474)

Summary statistics for key variables Household-specific Mean SD Mean SD Mean SD
Dummy for rural household 0.743 (0.437) 0.781 (0.413) 0.746 (0.436)
Dummy for household has male head 0.936 (0.244) 0.932 (0.252) 0.928 (0.259)
Dummy for household religion is Hinduism 0.813 (0.390) 0.823 (0.381) 0.794 (0.404)
Dummy for household religion is Islam 0.148 (0.356) 0.151 (0.358) 0.159 (0.366)
Dummy for household belongs to SC/ST 0.270 (0.444) 0.270 (0.444) 0.272 (0.445)
Dummy for household owns a television 0.327 (0.469) 0.281 (0.450) 0.339 (0.473)
Dummy for household owns a refrigerator 0.090 (0.286) 0.083 (0.276) 0.082 (0.274)
Dummy for household owns a motorcycle 0.121 (0.326) 0.116 (0.320) 0.103 (0.304)
Dummy for household has electricity 0.569 (0.495) 0.467 (0.499) 0.615 (0.487)
Source of drinking water: piped water 0.329 (0.470) 0.198 (0.398) 0.381 (0.486)
Source of drinking water: ground water 0.434 (0.496) 0.557 (0.497) 0.375 (0.484)
Source of drinking water: well water 0.203 (0.402) 0.221 (0.415) 0.203 (0.403)
Source of drinking water: surface water 0.024 (0.153) 0.018 (0.134) 0.029 (0.168)
State-specific
Per capita net state domestic product (base 1980) 2.388 (1.094) 2.174 (1.169) 2.138 (0.523)
Rainfall in millimeters (x10-2) 1.009 (1.404) 0.702 (1.029) 1.136 (1.136)
Average air temperature in degrees Celsius 25.411 (4.644) 24.028 (5.793) 27.46 (3.585)
Number of malaria/TB deaths norm. by state pop. 0.001 (0.002) 0.001 (0.001) 0.001 (0.002)
Average elevation in meters (x10-2) 3.482 (1.152) 3.753 (1.450) 2.624 (0.568)

Outcomes studied
• Considered to be most impacted in the first trimester:
– infant mortality
– neonatal mortality
– post-natal mortality
• Most impacted in other trimesters:
– height-for-age z score (stunting)
– weight-for-age z score (underweight)

Means and standard deviations of outcomes
All areas Wheat areas Rice areas
Variables Mean Std. dev. Mean Std. dev. Mean Std. dev.
Outcomes
Born alive but died before 11 months (infant mort.) 0.074 (0.034) 0.088 (0.031) 0.059 (0.034)
Born alive but died in first month (neonatal mort.) 0.048 (0.024) 0.056 (0.022) 0.039 (0.025)
Born alive but died b/w 1-11 mths. (post-natal
mort.) 0.026 (0.017) 0.032 (0.016) 0.020 (0.016)
Height-for-age z score -1.861 (1.521) -2.035 (1.546) -1.636 (1.561)
Weight-for-age z score -1.958 (1.136) -2.049 (1.149) -1.849 (1.141)
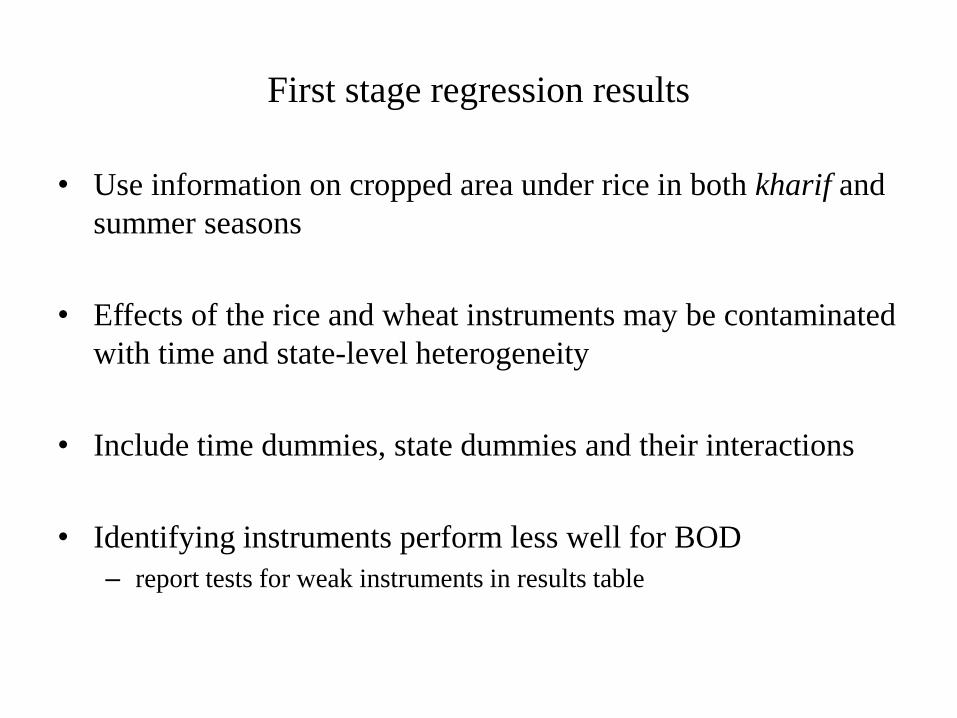
First stage regression results
• Use information on cropped area under rice in both kharif and
summer seasons
• Effects of the rice and wheat instruments may be contaminated
with time and state-level heterogeneity
• Include time dummies, state dummies and their interactions
• Identifying instruments perform less well for BOD
– report tests for weak instruments in results table

First stage regression results Endogenous variable: Average of the Endogenous variable: Log of the
dummy for presence of fertilizer biochemical oxygen demand in
in month of conception month of conception
Autumn rice crop area x Autumn rice 0.834* 0.881* 0.445 1.095
sowing months (0.452) (0.503) (0.493) (0.689)
Summer rice crop area x Summer rice 3.636** 5.038*** 1.654 4.138
sowing months (1.711) (1.495) (1.161) (2.699)
Wheat crop area x Wheat sowing 0.868*** 0.698*** 0.249* 0.166
months (0.198) (0.208) (0.144) (0.178)
Includes measures of crop area and YES YES YES YES
crop sowing months
Includes month and year dummies, NO YES NO YES
region dummies, and their interactions
R-squared 0.093 0.259 0.061 0.167
F-statistic 6.450 12.160 1.330 1.140
[0.003] [0.0001] [0.292] [0.356]
Observations 12201 12201 12201 12201

Sample size and results
• Until a child exits the hazard period, not possible to know
whether she/he will die before the cut-off age => sample sizes
differ for infant mortality and its components
• Results:
– For a 10 percent rise in level of agro-toxins, average infant mortality
rises by about 5 percent
– For a similar magnitude increase, average neo-natal mortality rises by 6
percent
– Significant impact even on HFA and WFA z scores

Main instrumental variables results Infant Neo-natal Post-natal HFA WFA
mortality mortality mortality z score z score
Average of the dummy for the presence 0.078** 0.068* 0.001 -1.453* -0.606*
of agrichemicals in month of conception (0.031) (0.013) (0.008) (0.809) (0.360)
Log of the level of biochemical oxygen -0.037 -0.029 0.007 -0.579 -0.241
demand in month of conception (0.068) (0.078) (0.028) (1.084) (1.656)
Anderson-Rubin Wald test 21.200 13.160 0.370 11.910 7.810
[0.0001] [0.004] [0.946] [0.008] [0.050]
Includes measures of crop area and crop YES YES YES YES YES
sowing months
Includes child, woman and husband YES YES YES YES YES
characteristics, and state-specific chars.
Includes month and year dummies, region YES YES YES YES YES
dummies, and their interactions
Number of observations 10497 12201 11046 10402 10526
Heterogeneity in impact of agrichemicals
• Disaggregate neo-natal mortality for the following sub-
samples:
– uneducated versus educated women
– rural versus urban areas
– poor versus rich households
• Negative consequences most evident among children of
– uneducated poor women living in rural India
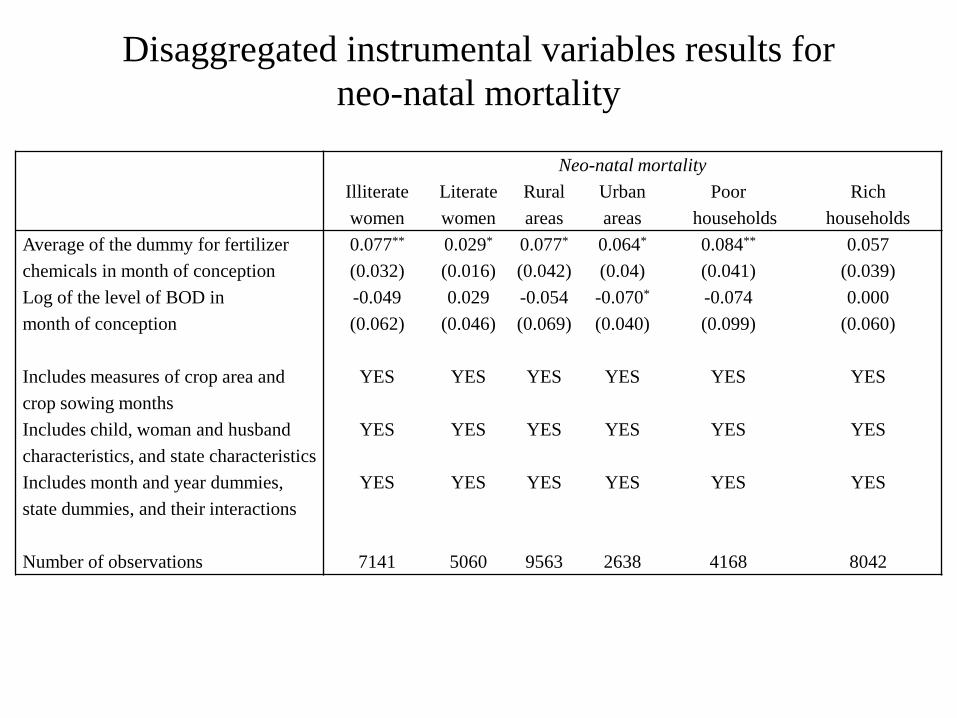
Disaggregated instrumental variables results for
neo-natal mortality
Neo-natal mortality
Illiterate Literate Rural Urban Poor Rich
women women areas areas households households
Average of the dummy for fertilizer 0.077** 0.029* 0.077* 0.064* 0.084** 0.057
chemicals in month of conception (0.032) (0.016) (0.042) (0.04) (0.041) (0.039)
Log of the level of BOD in -0.049 0.029 -0.054 -0.070* -0.074 0.000
month of conception (0.062) (0.046) (0.069) (0.040) (0.099) (0.060)
Includes measures of crop area and YES YES YES YES YES YES
crop sowing months
Includes child, woman and husband YES YES YES YES YES YES
characteristics, and state characteristics
Includes month and year dummies, YES YES YES YES YES YES
state dummies, and their interactions
Number of observations 7141 5060 9563 2638 4168 8042
Trimester impacts
• Consider effects of long-term exposure beyond the month of conception
• Infant mortality is affected by exposure in all trimesters; but largest impact is in the first trimester
• Neo-natal mortality is significantly affected by exposure in the third trimester; exposure impacts in first and second trimesters are on the borderline of significance
• Summary: an additional modest effect from prolonged exposure to water toxins for some of the child health outcomes
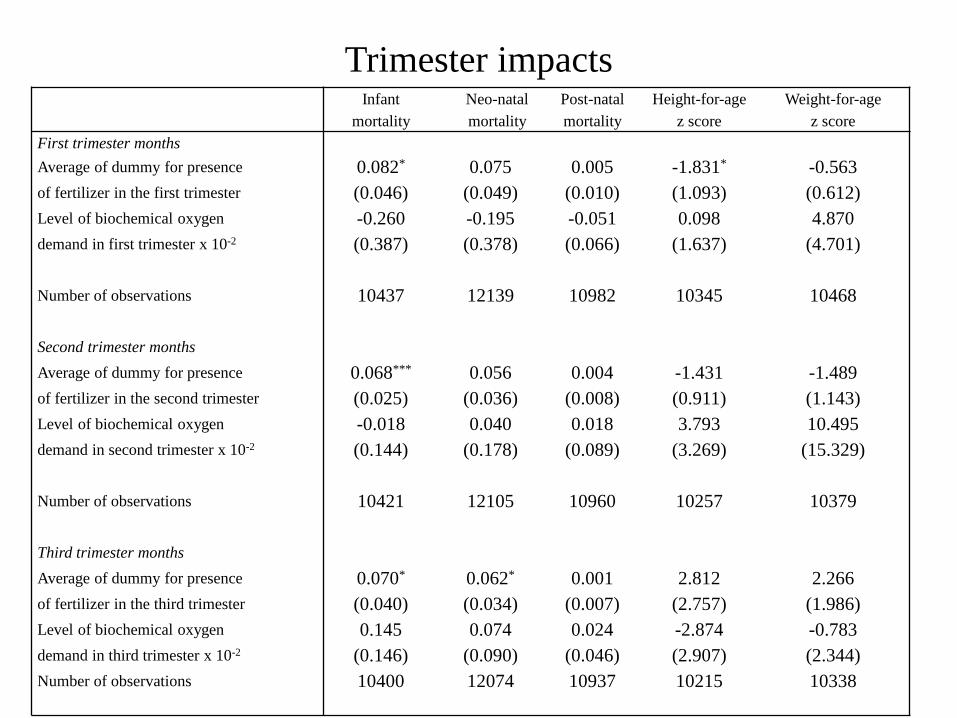
Trimester impacts Infant Neo-natal Post-natal Height-for-age Weight-for-age
mortality mortality mortality z score z score
First trimester months
Average of dummy for presence 0.082* 0.075 0.005 -1.831* -0.563
of fertilizer in the first trimester (0.046) (0.049) (0.010) (1.093) (0.612)
Level of biochemical oxygen -0.260 -0.195 -0.051 0.098 4.870
demand in first trimester x 10-2 (0.387) (0.378) (0.066) (1.637) (4.701)
Number of observations 10437 12139 10982 10345 10468
Second trimester months
Average of dummy for presence 0.068*** 0.056 0.004 -1.431 -1.489
of fertilizer in the second trimester (0.025) (0.036) (0.008) (0.911) (1.143)
Level of biochemical oxygen -0.018 0.040 0.018 3.793 10.495
demand in second trimester x 10-2 (0.144) (0.178) (0.089) (3.269) (15.329)
Number of observations 10421 12105 10960 10257 10379
Third trimester months
Average of dummy for presence 0.070* 0.062* 0.001 2.812 2.266
of fertilizer in the third trimester (0.040) (0.034) (0.007) (2.757) (1.986)
Level of biochemical oxygen 0.145 0.074 0.024 -2.874 -0.783
demand in third trimester x 10-2 (0.146) (0.090) (0.046) (2.907) (2.344)
Number of observations 10400 12074 10937 10215 10338
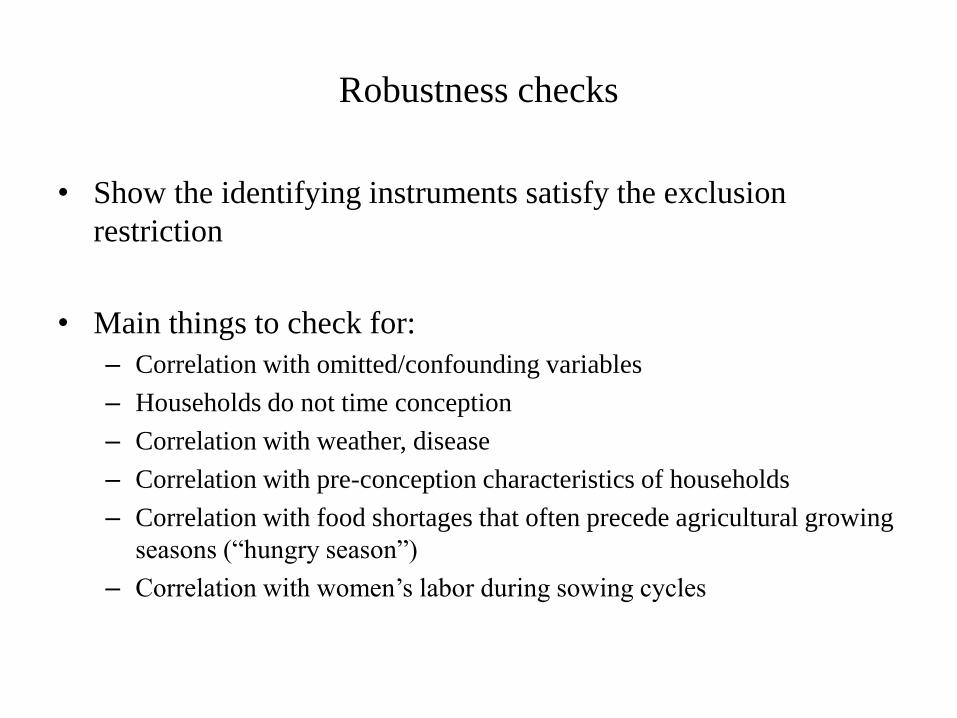
Robustness checks
• Show the identifying instruments satisfy the exclusion
restriction
• Main things to check for:
– Correlation with omitted/confounding variables
– Households do not time conception
– Correlation with weather, disease
– Correlation with pre-conception characteristics of households
– Correlation with food shortages that often precede agricultural growing
seasons (“hungry season”)
– Correlation with women’s labor during sowing cycles

Robustness checks I Log of number Acc. to pre- Log of the number Rich Rainfall Air
Identifying instruments of accidental or antenatal of conceptions household temperature
deaths doctor in a month
Autumn rice crop area x Autumn 0.001 -0.052 9.447 0.003 0.619 -0.355
rice sowing months (0.001) (0.155) (8.153) (0.050) (1.064) (0.283)
Summer rice crop area x Summer 0.004 0.049 22.407 -0.091 0.536 -1.343***
rice sowing months (0.003) (0.289) (25.268) (0.089) (1.491) (0.392)
Wheat crop area x Wheat sowing -0.0001 -0.186 -1.416 0.018 1.846*** -0.916***
months (0.0003) (0.115) (2.985) (0.015) (0.537) (0.219)
Includes measures of crop area YES YES YES YES YES YES
and crop sowing months
Includes child, woman and husb.- YES YES YES YES YES YES
specific characteristics, and state-
specific characteristics
Includes month and year dumm., YES YES YES YES YES YES
region dummies, and their
interactions
R-squared 0.718 0.336 0.693 0.143 0.719 0.971
F-statistic 0.68 1.090 0.050 2.080 5.300 13.440
[0.576] [0.373] [0.686] [0.131] [0.006] [0.0004]
Number of observations 8350 12979 6743 12979 12979 11574
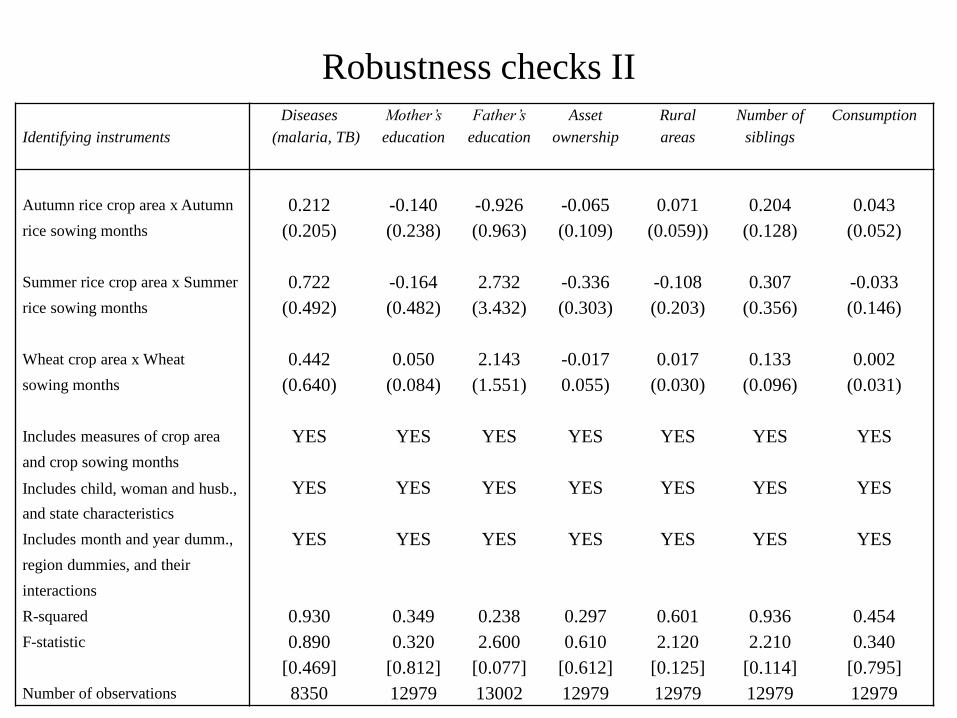
Robustness checks II Diseases Mother’s Father’s Asset Rural Number of Consumption
Identifying instruments (malaria, TB) education education ownership areas siblings
Autumn rice crop area x Autumn 0.212 -0.140 -0.926 -0.065 0.071 0.204 0.043
rice sowing months (0.205) (0.238) (0.963) (0.109) (0.059)) (0.128) (0.052)
Summer rice crop area x Summer 0.722 -0.164 2.732 -0.336 -0.108 0.307 -0.033
rice sowing months (0.492) (0.482) (3.432) (0.303) (0.203) (0.356) (0.146)
Wheat crop area x Wheat 0.442 0.050 2.143 -0.017 0.017 0.133 0.002
sowing months (0.640) (0.084) (1.551) 0.055) (0.030) (0.096) (0.031)
Includes measures of crop area YES YES YES YES YES YES YES
and crop sowing months
Includes child, woman and husb., YES YES YES YES YES YES YES
and state characteristics
Includes month and year dumm., YES YES YES YES YES YES YES
region dummies, and their
interactions
R-squared 0.930 0.349 0.238 0.297 0.601 0.936 0.454
F-statistic 0.890 0.320 2.600 0.610 2.120 2.210 0.340
[0.469] [0.812] [0.077] [0.612] [0.125] [0.114] [0.795]
Number of observations 8350 12979 13002 12979 12979 12979 12979

Robustness checks III Infant mortality Neo-natal mortality
Average of the dummy for the presence of 0.075** 0.077** 0.035** 0.075** 0.075** 0.067* 0.061** 0.037*** 0.079** 0.067*
fertilizer chemicals in month of conception (0.031) (0.041) (0.014) (0.034) (0.031) (0.040) (0.027) (0.014) (0.035) (0.041)
Log of the level of biochemical oxygen -0.036 -0.017 -0.019 -0.044** -0.035 -0.030 0.004 0.020 -0.035 -0.029
demand in month of conception (0.066) (0.051) (0.027) (0.022) (0.070) (0.081) (0.034) (0.023) (0.023) (0.084)
Rainfall 0.002 0.001
(0.002) (0.002)
Air temperature -0.017 -0.006
(0.011) (0.006)
Log number of malaria cases and -0.007 -0.005
TB deaths (0.010) (0.011)
Log of wheat yield -0.003 -0.002
(0.005) (0.007)
Log of rice yield -0.001 -0.001
(0.001) (0.001)
Woman is currently working 0.001 0.001
(0.002) (0.002)
Woman works in agriculture 0.001 0.001
(0.001) (0.001)
Woman works for family member -0.001 -0.001
(0.006) (0.006)
Woman works for someone else -0.002 -0.002
(0.002) (0.002)
Includes measures of crop area and YES YES YES YES YES YES YES YES YES YES
crop sowing months
Includes child, woman and husband-spec. YES YES YES YES YES YES YES YES YES YES
characteristics, and state-specific charact.
Includes month and year dummies, region YES YES YES YES YES YES YES YES YES YES
dummies, and their interactions

Other falsification tests
• Show that child health outcomes not affected by agrichemicals
and BOD in water in
– trimester before conception
– six months preceding conception
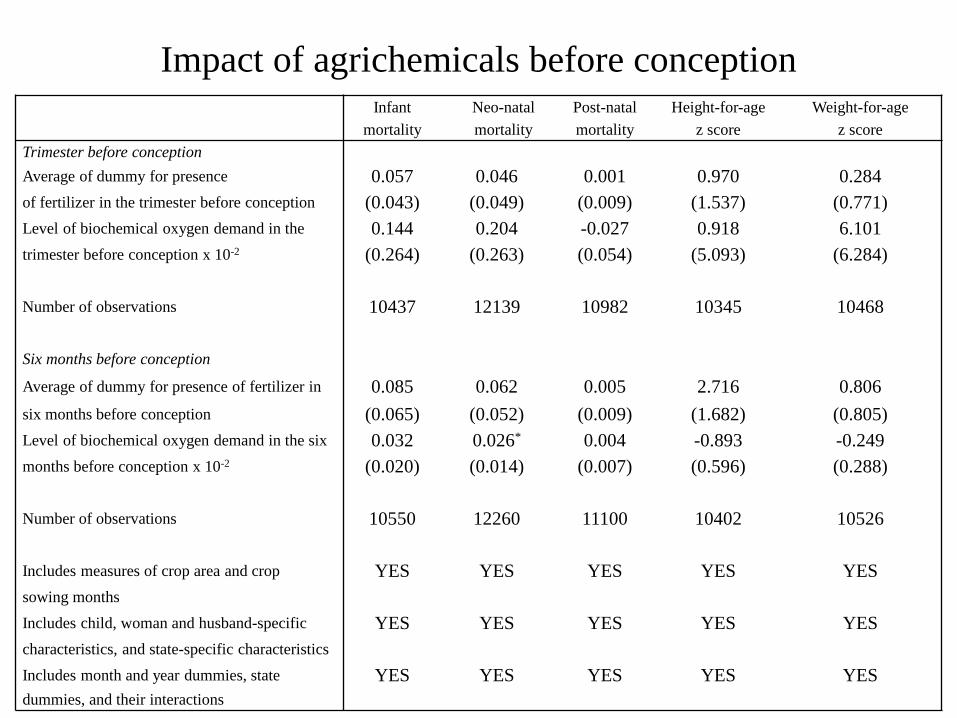
Impact of agrichemicals before conception Infant Neo-natal Post-natal Height-for-age Weight-for-age
mortality mortality mortality z score z score
Trimester before conception
Average of dummy for presence 0.057 0.046 0.001 0.970 0.284
of fertilizer in the trimester before conception (0.043) (0.049) (0.009) (1.537) (0.771)
Level of biochemical oxygen demand in the 0.144 0.204 -0.027 0.918 6.101
trimester before conception x 10-2 (0.264) (0.263) (0.054) (5.093) (6.284)
Number of observations 10437 12139 10982 10345 10468
Six months before conception
Average of dummy for presence of fertilizer in 0.085 0.062 0.005 2.716 0.806
six months before conception (0.065) (0.052) (0.009) (1.682) (0.805)
Level of biochemical oxygen demand in the six 0.032 0.026* 0.004 -0.893 -0.249
months before conception x 10-2 (0.020) (0.014) (0.007) (0.596) (0.288)
Number of observations 10550 12260 11100 10402 10526
Includes measures of crop area and crop YES YES YES YES YES
sowing months
Includes child, woman and husband-specific YES YES YES YES YES
characteristics, and state-specific characteristics
Includes month and year dummies, state YES YES YES YES YES
dummies, and their interactions
Conclusions and policy
• This study broadens our understanding of the health effects of fertilizer use on a vulnerable population – infants and young children in a developing country
• Noteworthy that month of conception exposure to agrichemicals in water has effects on short-term and long-term outcomes
• Relatively large negative impacts on infant and neo-natal mortality; this is in keeping with others studies
– Cutler and Miller 2005
– Galiani et al. 2005
• Findings highlight the tension between greater use of fertilizers to improve yields and the negative health effects from such use
Conclusions and policy
• Possible ameliorative strategies:
– reliance on organic fertilizers
– alternative farming techniques to improve soil productivity
– programs to improve nutrition of mothers who are most exposed
– early health intervention programs for low-birth weight babies
– programs to raise consciousness

