seasonal distribution of trace metals in ground and surface water of golaghat...
TRANSCRIPT
ISSN: 0973-4945; CODEN ECJHAO
E-Journal of Chemistry
http://www.e-journals.net 2010, 7(S1), S465-S473
Seasonal Distribution of Trace Metals in Ground and
Surface Water of Golaghat District, Assam, India
M. BOARH* and A. K. MISRA
Department of Chemistry, Gauhati University, Guwahati-781014, India
Received 8 February 2010; Accepted 20 April 2010
Abstract: A study has been carried out on the quality of ground and surface
water with respect to chromium, manganese, zinc, copper, nickel, cadmium and
arsenic contamination from 28 different sources in the predominantly rural
Golaghat district of Assam (India). The metals were analysed by using atomic
absorption spectrometer. Water samples were collected from groundwater and
surface water during the dry and wet seasons of 2008 from the different
sources in 28 locations (samples). The results are discussed in the light of
possible health hazards from the metals in relation to their maximum
permissible limits. The study shows the quality of ground and surface water in
a sizeable number of water samples in the district not to be fully satisfactory
with respect to presence of the metals beyond permissible limits of WHO. The
metal concentration of groundwater in the district follows the trend
As>Zn>Mn>Cr>Cu>Ni>Cd in both the seasons.
Keywords: Trace metals, Groundwater, Surface water, Assam.
Introduction
Groundwater has been used as a source of drinking water for millions of rural and urban
families in India. Heavy metal contamination of groundwater more often than not goes
unnoticed and remains hidden from the public view. Presently, it has raised wide spread
concerns in different parts of the world and results reported by various agencies have been
alarming1-2
. The concentration of toxic metal ions has increased beyond environmentally and
ecologically sustainable levels due to natural phenomenon as well as anthropogenic impact.
The poisoning effect of toxic metals from contaminated drinking water has evolved as one
of the major health hazards in the 21st century3,4
. There is also evidence of prevailing heavy
metal contamination of groundwater in many areas of India5,6
. Recent studies show that the
levels of trace metals present in drinking water could seriously affect human health7-11
.In
the third world countries, the common people and sometimes even in the highly educated

S466 M. BOARH et al.
people are not aware of the dangers of contamination of drinking water sources. Therefore, it
is utmost importance to determine the quality of drinking water with respect to all
constituents and take proper remedial measures, if required, to ensure quality criteria as
formulated by WHO and other regulating bodies12
. Of all the contaminants present in water,
metals are very important in governing drinking water quality. The presence of some metals
in drinking water is desirable to certain extents for proper maintenance of human health.
Above these limits, they behave as pollutants and toxicants causing serious health hazards.
Again, some metals should not be present in water even in trace amounts because of their
high degree of toxicity.
The present study area lies between 93o
49′8″ to 94o12′22″N and 26
o 41′15″ to 26
o5′E .It is
the Golaghat subdivision of northeast part of Golaghat district (source: office of deputy director,
economics and statistics, Golaghat district). The Golaghat sub-division having an area of 1838
km2 has total population of 591924, as per 2001 census (Source: Office of deputy director,
economics and statistics, golaghat district).The most widely used sources of drinking water in
the Golaghat district are ring well and tube wells and sometimes pond water and river water
also. The urban water supply scheme is inadequate and supply water only in some locations in
Golaghat town. A large section of the people even in urban areas has to depend on tube wells
and ring wells for their water needs and in the areas, these are the only sources for the people.
The objective of the present work is to study the quality of ground and surface water in the
district with respect to a few important metals Cr, Mn, Fe, Co, Ni, Cu, Zn , Pb and As.
Experimental
After thorough study of the topographic and climatic conditions of the study area, it was
decided to collect twenty eight ground and surface water samples from tube wells, ring wells,
rivers, pond and lake and supply water from Golaghat sub-division of Golaghat district during
dry and wet season of 2008. The sampling stations, the type of sources, Cr, Mn, Fe, Co, Ni,
Cu, Zn and Pb and As concentrations (ppm) for both dry and wet seasons are listed in Table 1.
The water samples were collected in pre-cleaned plastic containers of 5 L capacity. The
samples were preheated and reserved properly and analysis for heavy metals was carried out
following standard procedure (APHA, 1995). To determine the amount of metals, 100 mL of
each sample was acidified with conc. HNO3 and was then allowed to evaporate in an oven at
temperature 60 - 50 oC for reducing the volume to 20-30 mL. Then volume was made up to
100 mL by the addition of doubled distilled water. Finally the resulting samples were then
analyzed using atomic absorption spectrophotometer (Variant spectra AA220).
Results and Discussion
Water sampling locations and sources are presented in Table 1. The experimental results are
presented in Table 2. To look into the seasonal variations and distribution patterns of the
metal contents in groundwater, data were exposed to several statistical treatments.
Descriptive statistics based on normal distribution has been summarised for both dry and
wet season in Table 3 & 4 respectively. Seasonal distributions of various metals in
groundwater are graphically presented in Figures 1-7.
In the present study chromium content in groundwater are found to be above the
permissible limit (in dry season) of WHO with a mean value of 0.0612 ppm and 0.04386 ppm
respectively in dry and wet season. It may be seen from Table II that some of the water
samples contain chromium at toxic levels. The skewness and kurtosis values for chromium
in both the seasons indicate that its distribution in the study area is not uniform.

Seasonal Distribution of Trace Metals in Groundwater S467
Table 1. Water sampling locations and sources
S. No Sampling stations Source S. No Sampling stations Source
TW1 Mission patty, Golaghat Tube well RW1 Kamarbandha Ring well
TW2 Errangapara, Golaghat Tube well RW2 Merapani Ring well
TW3 Tatalital, Golaghat Tube well RW3 Sagunpara, Golaghat Ring well
TW4 Sagunpara, Golaghat Tube well RW4 Jamuguri, Golaghat Ring well
TW5 Jamuguri, Golaghat Tube well RW5 Pulibor, Golaghat Ring well
TW6 Puspaban, Golaghat Tube well RIW1 Dhansiri, Golaghat River water
TW7 Fatual, Furkating Tube well RIW2 Doyang River water
TW8 Ghilaghary H.S. School Tube well RIW3 Rangma River water
TW9 Bahbari Tube well RIW4 Kakodonga River water
TW10 Athkhelia Tube well RIW5 Nambor River water
TW11 Dhekial Tube well RIW6 Doigrong River water
TW12 Silonijan Tube well PW Tenpur pond Pond water
TW13 Purabangla Tube well LW Sankar lake Lake water
TW14 Latakujan tea estate Tube well SW Golaghat Town Supply water
Table 2. Metal content in ground and surface water of Golaghat district at 20 different
stations
Cr Mn Zn Cu Ni Cd As Sample
No. Season
in ppm in ppm in ppm in ppm in ppm in ppm in ppb
Dry 0.022 0.206 0.886 0.026 0.020 0.003 8 TW1
Wet BDL 0.194 0.775 0.031 0.019 BDL 5
Dry 0.117 0.117 0.624 0.024 0.022 0.002 38 TW2
Wet 0.112 0.112 0.534 0.035 BDL BDL 12
Dry 0.125 0.119 0.622 0.023 0.028 0.012 16 TW3
Wet 0.134 0.104 0.586 0.033 0.018 BDL 12
Dry 0.021 0.125 1.122 BDL 0.025 0.005 7 TW4
Wet BDL 0.091 0.962 0.021 0.022 0.002 3
Dry 0.098 0.134 1.144 0.322 0.036 BDL 9 TW5
Wet 0.113 0.095 0.966 0.122 0.022 BDL 4
Dry 0.120 0.114 0.675 0.031 0.026 BDL 9 TW6
Wet 0.040 0.083 0.314 BDL 0.013 BDL 7
Dry 0.122 0.013 1.065 0.221 0.018 0.003 202 TW7
Wet 0.076 0.006 0.752 0.128 0.028 0.004 164
Dry 0.032 0.114 1.175 0.032 0.018 BDL 26 TW8
Wet BDL 0.088 0.878 0.024 BDL BDL 14
Dry 0.028 0.211 0.222 0.034 0.031 0.007 200 TW9
Wet 0.041 0.162 0.144 0.021 0.024 0.004 162
Dry 0.032 0.151 1.123 0.036 0.016 BDL 192 TW10
Wet BDL 0.123 1.077 0.017 0.024 BDL 162
Dry 0.130 0.211 1.534 0.008 0.032 0.002 22 TW11
Wet 0.077 0.124 0.988 0.024 0.022 BDL 18
TW12 Dry 0.211 0.084 1.087 0.017 BDL BDL 22
Wet 0.163 0.073 0.843 0.012 0.011 BDL 18
Dry 0.014 0.063 0.843 0.028 0.024 0.003 9 TW13
Wet BDL 0.043 0.655 0.021 0.024 0.002 6 Contd…

S468 M. BOARH et al.
Dry BDL 0.172 0.746 0.018 0.025 BDL 8 TW14
Wet BDL 0.115 0.462 0.015 0.017 BDL 7
Dry 0.102 0.213 0.634 0.041 0.018 0.004 35 RW1
Wet 0.100 0.085 0.248 0.012 0.015 0.002 8
Dry 0.028 0.089 0.988 0.016 0.018 0.012 36 RW2
Wet BDL 0.089 0.655 0.012 0.029 0.002 24
Dry 0.016 0.093 1.122 0.047 0.024 0.003 9 RW3
Wet 0.023 0.063 0.938 0.017 BDL 0.007 6
Dry 0.162 0.085 0.845 0.046 0.062 0.36 8 RW4
Wet 0.184 0.075 0.948 0.035 0.028 0.36 4
Dry 0.117 1.023 1.787 0.032 0.045 0.004 153 RW5
Wet 0.115 0.462 1.132 0.017 0.016 0.004 102
Dry 0.012 0.068 0.574 BDL 0.028 0.015 12 RIW1
Wet 0.004 0.034 0.438 0.026 0.014 0.011 8
Dry 0.011 0.077 1.642 0.022 0.037 0.021 8 RIW2
Wet 0.006 0.037 0.849 0.021 0.038 0.015 11
Dry 0.011 0.102 1.322 0.014 0.024 BDL 9 RIW3
Wet BDL 0.042 0.676 BDL BDL BDL 5
Dry 0.015 0.094 0.865 0.022 0.024 0.004 6 RIW4
Wet BDL 0.046 0.434 0.012 0.022 0.002 3
Dry 0.017 0.077 1.246 0.022 0.018 BDL 3 RIW5
Wet 0.006 0.046 0.574 0.011 BDL BDL BDL
Dry 0.022 0.034 1.023 0.026 BDL 0.003 BDL RIW6
Wet BDL 0.072 0.324 0.018 BDL BDL BDL
Dry 0.056 0.096 1.034 0.014 0.028 BDL 9 PW
Wet 0.016 0.082 0.764 BDL BDL BDL BDL
Dry 0.058 0.26 1.442 0.015 0.022 0.014 2 LW
Wet 0.018 0.112 0.798 0.014 BDL BDL 2
Dry 0.016 0.093 1.027 0.027 BDL 0.001 7 SW
Wet BDL 0.071 0.964 0.013 0.024 BDL 6
Table 3. Comparison of statistical data of different metals in dry season
Statistics Cr Mn Zn Cu Ni Cd As
Minimum BDL 0.034 0.222 BDL BDL BDL BDL
Maximum 0.221 0.113 1.787 0.322 0.062 0.36 202
Mean 0.0612 0.1513 1.0149 0.04157 0.02389 0.01707 38.03571
Standard
error 0.0105 0.0334 0.0642 0.0125 0.00234 0.0125 11.7082
Median 0.03 0.108 0.781 0.025 0.024 0.003 9
mode 0.011 0.077 0.655 0.022 0.018 0.000 9
Standard
deviation 0.05607 0.1771 0.3399 0.0661 0.0124 0.0662 61.9524
Variance 0.0031 0.0055 0.1155 0.0043 0.00015 0.0043 3838.0998
Coefficient
of variance 0.916 1.170 0.3349 1.590 0.5190 3.8781 1.6287
Skewness 7.4833 1.6385 0.136312 7.5498 5.46156 0.00000 5.68035
Kurtosis 56.0000 0.90678 0.344704 57.0000 29.7752 -3.16767 34.8610
Range 0.221 0.079 1.565 0.322 0.062 0.36 202
sum 1.7149 4.2379 28.4189 1.1640 0.6690 0.4780 1065
Sample station
Cr
in p
pb
Mn i
n p
pb
Sample station
Sample station
Zn
in p
pb
Seasonal Distribution of Trace Metals in Groundwater S469
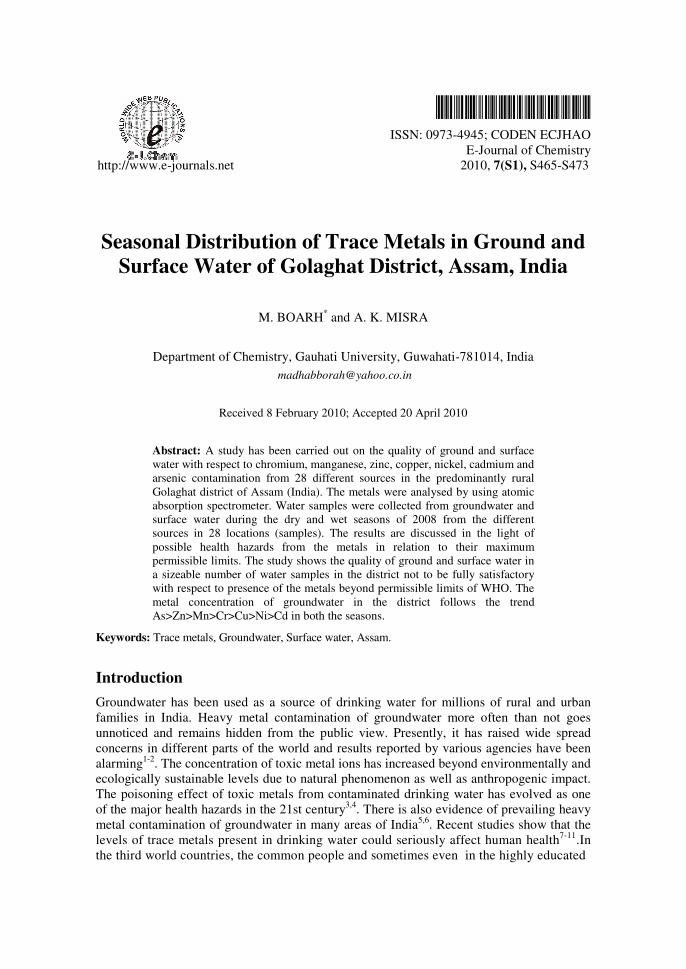
Table 4. Comparison of statistical data of different metals in wet season
Statistics Cr Mn Zn Cu Ni Cd As Minimum BDL BDL 0.144 BDL BDL BDL BDL Maximum 0.184 0.184 1.132 0.128 0.038 0.36 164 Mean 0.04386 0.09746 0.70279 0.02543 0.01536 0.01482 27.60714
Standard error 0.01066 0.82290 0.04917 0.005501 0.002090 0.0125 9.49722 Median 0.011 0.084 0.758 0.0175 0.0175 0 7 mode 0.000 0.046 0.655 0.012 0 0 0 Standard deviation
0.05645 0.0802 0.2602 0.02911 0.01106 0.06652 50.25459
Variance 0.0031 0.0064 0.0677 0.00084 0.000121 0.00442 2525.52 Coefficient of variance
1.2870 0.8234 0.3702 1.1447 0.72005 4.48852 1.82034
Skewness 1.10861 0.00000 5.29150 0.00000 -0.19653 5.26768 2.25124 Kurtosis -0.04424 -3.3646 28.0000 -3.35042 -1.00196 27.82308 3.61477 Range 0.184 0.184 0.988 0.128 0.038 0.36 164 sum 1.228 2.7289 19.6780 0.7120 0.4300 0.4150 773
Figure 1. Seasonal variations of Cr(ppb) in the study area
Figure 2. Seasonal variations of Mn(ppb) in the study area
Figure 3. Seasonal variations of Zn(ppb) in the study area

Sample station
Cu i
n p
pb
Ni
in p
pb
Sample station
Cd i
n p
pb
Sample station
As
in p
pb
Sample station
S470 M. BOARH et al.
Figure 4. Seasonal variations of Cu(ppb) in the study area
Figure 5. Seasonal variations of Ni(ppb) in the study area
Figure 6. Seasonal variations of Cd(ppb) in the study area
Figure 7. Seasonal variations of As (ppb) in the study area
Manganese concentration in groundwater was found to be within the range of
0.034-0.113 ppm during dry season and BDL-0.184 ppm during wet season. It is seen from
Table 2 and 3 that mean manganese contents exceed the permissible level of 0.1 ppm
(WHO, 2004)13
in 53.5% sampling points in dry season and 32.1% in wet season.
Significant Standard deviations in case of manganese in dry season and wet season are likely
to bias the normal distribution statistic.

Seasonal Distribution of Trace Metals in Groundwater S471
Manganese is a vital micronutrient for both plant and animals. It is found in various salts
and minerals, frequently in association with iron compounds. The concentration of zinc in
sampling sources is in the range of 0.222-1.787 in dry season and 0.144-1.132 in wet season.
Zinc is a nutritionally essential element. It is necessary for growth and is involved in several
physiological functions. In all the samples under investigation, the zinc contents are much
below the guideline value of 3 ppm. Positive kurtosis and skewness value for zinc in both
dry and wet season is indicative of its sharp asymmetric distribution with a long right tail
from its median.
It has been found that copper levels are low with few of samples being below detection
limits. Where the metal concentrations are above detection limits, they still fall below the
WHO guidelines value of 1 ppm. Copper is an essential micronutrient, but in high
concentration causes physiological effects in human. Water containing 3 mg copper/L was
associated with gastrointestinal disturbance in adults, whereas water containing 1 mg/L was
not14
. Copper shows higher concentration during dry season. Positive kurtosis and skewness
value for copper in dry season is indicative of its sharp asymmetric distribution with a long
right tail from its median. Again in wet season the distribution (negative kurtosis) of data are
platykurtic (lower peak than a normal distribution) having no longer tail with symmetrical
distribution (zero skewness).
It has been observed that nickel content of some of the sampling sites is high with
compared to WHO guideline value 0.02 mg/L. Average nickel contents in dry season
fall outside the maximum permissible limit of 0.02 ppm as set by WHO whereas the
average Ni contents in wet season fall below permissible limit of WHO. The maximum
value is obtained at sampling point RW4 during dry season. Positive kurtosis and
skewness value for nickel in dry season is indicative of its sharp asymmetric distribution
with a long right tail from its median. Again in wet season the distribution is negatively
skewed with a tail in negative direction and platykurtic with a lower peak than a normal
distribution.
It has been observed that the average cadmium content in dry season is 0.01707 and
in wet season 0.01482 whereas WHO guideline value is 0.005 ppm and ISI limit is 0.01 ppm.
So average cadmium contents in both dry and wet season fall outside the maximum
permissible limit of ISI and fall below the permissible limit of WHO. The maximum
cadmium content was found in RW4 (0.36 ppm) in both dry and wet season. In dry
season the distribution of data is negatively skewed with a tail in negative direction and
platykurtic with a lower peak than a normal distribution. Positive kurtosis and skewness
value for cadmium in wet season is indicative of its sharp asymmetric distribution with
a long right tail from its median. Cadmium is not biodegradable, can accumulate in
human vital organs, producing progressive toxicity. Source of occurrence (naturally) is
the type soil.
Arsenic concentration in groundwater and surface was found to be within the range of BDL–
202 ppb during dry season and BDL–164 ppb during wet season. It is observed that groundwater
samples of Golaghat district fall under alert category with respect to arsenic as some of the
samples exceed and some are approaching the WHO (2004) and USEPA (2001) guideline value
10 ppb (Table 2). Positive kurtosis and skewness value for arsenic in both the season is indicative
of its sharp asymmetric distribution with a long right tail from its median. Wide data range and
high standard deviation in case of arsenic in both dry and wet season are likely to bias the normal
distribution statistic. Significant differences among mean, median and mode along with
significant skewness and kurtosis values observed for arsenic in both the seasons are indicative of

S472 M. BOARH et al.
departure of sample frequency distribution curve from normal. Mean arsenic contents exceeds the
permissible level of 10 ppb (WHO, 2004)13
in 42.8% sampling points in dry season and 39.2% in
wet season. The highest arsenic content was found in TW7 (202 ppb). So people should not drink
water from this tube well.
During the study, seasonal variations are also observed for all the trace metals under
investigation. By comparing the average values of all the trace metals, it is observed that the
metal content of groundwater and surface in the district follows the trend
As>Zn>Mn>Cr>Cu>Ni>Cd in both the seasons. It has been noticed that average arsenic
concentrations in both the season fall in high alert category. Although, arsenic contents
beyond the guideline value (10 ppb) of WHO and USEPA have been found in a large
number of samples, no report of Arsenocosis from the areas has been known till date.
Conclusion
Statistical observations on chromium, manganese, zinc, copper and nickel in ground and
surface waters of Golaghat district, Assam show that all these metals exhibit a non-uniform
distribution.
Comparing the water content of trace metals with the recommended maximum values
for drinking purposes, it is found that a sizeable number of ground and surface samples
contain chromium, manganese, nickel, cadmium and arsenic at an alert level. The
concentrations of copper and zinc in the groundwater of the area are either low or moderate
and within the guideline values of WHO.
Keeping in view of the unusually high concentrations of the harmful metals specially for
arsenic at some of the sampling sites, it is concluded that regular monitoring of water
sources should be ensured by the concerned authorities to prevent the outbreak of water
borne diseases in the area.
Acknowledgments
The senior author acknowledges the assistance of the NEIST, Jorhat, in analysis of the water
samples with ASS. Author is also grateful to Dr. K.G. Bhattacharjee for giving the
opportunity to test the samples with ASS. The author is remaining thankful to the Rural
Water Testing Laboratory conducted by Pragjyotika, Titabor, and Jorhat. The author is also
thankful to PHE Department (Golaghat Division) of Golaghat district for providing
important data for this work. The author also thanks his friends and seniors who help him
during the course of this study.
References
1. Friberg L, Nordberg G F and Vouk V B, Ed., Handbook of the Toxicology of Metals,
Elsevier, Amsterdam, 1986, 2, 130-184.
2. WHO/UNEP G E M S, Global Fresh Water Quality; Published on Behalf of the
World Health Organization/United Nations Environment Programme, Oxford,
Blackwell Reference, 1989.
3. Bagla P and Kaiser J, Science, 1996, 274, 174-175.
4. Lepkowski W, Arsenic Crisis in Bangladesh, C&EN News, 1998, 27, November 16.
5. Sharma A, Sharma D K, Jangir J P and Gupta C M, Indian J Environ Protect, 1989,
9(4), 294-296.
6. Bhattacharya P, Chatterjee D and Jacks G, Water Resources Development, 1997,
13, 79-92.

Seasonal Distribution of Trace Metals in Groundwater S473
7. Chi-Man L and Jiu J J, Water Res., 2006, 40(4), 753-767.
8. Demirel Z, Environ Monit Assess., 2007, 132 (1-3), 15-23.
9. Nganje N, Edet A E and Ekwere S J, Environmental Geosciences (DEG), 2007,
14(1), 15- 29.
10. Yasuhiro S, Duong V T, Daigo S, Doan C and Yoshito K, J Health Sci., 2007,
53,.344-346.
11. Dixit R C, Varma S R, Notnaware V and Thacker N P, Indian J Environ Health,
2004, 45(2), 107-112.
12. Sarma B C, Misra A K and Bhattacharyya K G, Indian J Environ Protect., 2000,
21(4), 316-322.
13. WHO, Guidelines for Drinking water Quality, 3rd
Edition. Geneva: World Health
Organization, 2004.
14. Pizarro F, Olivares M, Uauy R, Contreras P, Rebelo A and Gidi V, Environ Health
Perspectives, 1999, 107, 117-121.

Submit your manuscripts athttp://www.hindawi.com
Hindawi Publishing Corporationhttp://www.hindawi.com Volume 2014
Inorganic ChemistryInternational Journal of
Hindawi Publishing Corporation http://www.hindawi.com Volume 2014
International Journal ofPhotoenergy
Hindawi Publishing Corporationhttp://www.hindawi.com Volume 2014
Carbohydrate Chemistry
International Journal of
Hindawi Publishing Corporationhttp://www.hindawi.com Volume 2014
Journal of
Chemistry
Hindawi Publishing Corporationhttp://www.hindawi.com Volume 2014
Advances in
Physical Chemistry
Hindawi Publishing Corporationhttp://www.hindawi.com
Analytical Methods in Chemistry
Journal of
Volume 2014
Bioinorganic Chemistry and ApplicationsHindawi Publishing Corporationhttp://www.hindawi.com Volume 2014
SpectroscopyInternational Journal of
Hindawi Publishing Corporationhttp://www.hindawi.com Volume 2014
The Scientific World JournalHindawi Publishing Corporation http://www.hindawi.com Volume 2014
Medicinal ChemistryInternational Journal of
Hindawi Publishing Corporationhttp://www.hindawi.com Volume 2014
Chromatography Research International
Hindawi Publishing Corporationhttp://www.hindawi.com Volume 2014
Applied ChemistryJournal of
Hindawi Publishing Corporationhttp://www.hindawi.com Volume 2014
Hindawi Publishing Corporationhttp://www.hindawi.com Volume 2014
Theoretical ChemistryJournal of
Hindawi Publishing Corporationhttp://www.hindawi.com Volume 2014
Journal of
Spectroscopy
Analytical ChemistryInternational Journal of
Hindawi Publishing Corporationhttp://www.hindawi.com Volume 2014
Journal of
Hindawi Publishing Corporationhttp://www.hindawi.com Volume 2014
Quantum Chemistry
Hindawi Publishing Corporationhttp://www.hindawi.com Volume 2014
Organic Chemistry International
Hindawi Publishing Corporationhttp://www.hindawi.com Volume 2014
CatalystsJournal of
ElectrochemistryInternational Journal of
Hindawi Publishing Corporation http://www.hindawi.com Volume 2014