seasonal changes in the d h ratio of fatty acids of ... · pdf filethe community structure...
TRANSCRIPT

Biogeosciences, 13, 5527–5539, 2016www.biogeosciences.net/13/5527/2016/doi:10.5194/bg-13-5527-2016© Author(s) 2016. CC Attribution 3.0 License.
Seasonal changes in the D / H ratio of fatty acids of pelagicmicroorganisms in the coastal North SeaSandra Mariam Heinzelmann1, Nicole Jane Bale1, Laura Villanueva1, Danielle Sinke-Schoen1, Catharina JohannaMaria Philippart2,3, Jaap Smede Sinninghe Damsté1,4, Stefan Schouten1,4, and Marcel Teunis Jan van der Meer1
1Department of Marine Microbiology and Biogeochemistry, NIOZ Royal Netherlands Institute for Sea Research and UtrechtUniversity, P.O. Box 59, 1790 AB Den Burg, the Netherlands2Department of Coastal Systems Sciences, NIOZ Royal Netherlands Institute for Sea Research and Utrecht University,P.O. Box 59, 1790 AB Den Burg, the Netherlands3Utrecht University, Faculty of Geosciences, Department of Physical Geography, Coastal Processes, P.O. Box 80.115, 3508TC Utrecht, the Netherlands4Utrecht University, Faculty of Geosciences, Department of Earth Sciences, Geochemistry, P.O. Box 80.021, 3508 TAUtrecht, the Netherlands
Correspondence to: Sandra Mariam Heinzelmann ([email protected])
Received: 4 April 2016 – Published in Biogeosciences Discuss.: 20 April 2016Revised: 29 August 2016 – Accepted: 22 September 2016 – Published: 6 October 2016
Abstract. Culture studies of microorganisms have shownthat the hydrogen isotopic composition of fatty acids dependson their metabolism, but there are only few environmentalstudies available to confirm this observation. Here we studiedthe seasonal variability of the deuterium-to-hydrogen (D /H)ratio of fatty acids in the coastal Dutch North Sea and com-pared this with the diversity of the phyto- and bacterioplank-ton. Over the year, the stable hydrogen isotopic fractionationfactor ε between fatty acids and water (εlipid/water) rangedbetween −172 and −237 ‰, the algal-derived polyunsatu-rated fatty acid nC20:5 generally being the most D-depleted(−177 to −235 ‰) and nC18:0 the least D-depleted fattyacid (−172 to −210 ‰). The in general highly D-depletednC20:5 is in agreement with culture studies, which indi-cates that photoautotrophic microorganisms produce fattyacids which are significantly depleted in D relative to water.The εlipid/water of all fatty acids showed a transient shift to-wards increased fractionation during the spring phytoplank-ton bloom, indicated by increasing chlorophyll a concen-trations and relative abundance of the nC20:5 polyunsatu-rated fatty acids, suggesting increased contributions of pho-toautotrophy. Time periods with decreased fractionation (lessnegative εlipid/water values) can potentially be explained byan increased contribution of heterotrophy to the fatty acidpool. Our results show that the hydrogen isotopic composi-
tion of fatty acids is a promising tool to assess the communitymetabolism of coastal plankton potentially in combinationwith the isotopic analysis of more specific biomarker lipids.
1 Introduction
The hydrogen isotopic composition of fatty acids of mi-croorganisms has been shown to depend on different fac-tors like metabolism, salinity, biosynthetic pathways, growthphase and temperature (Dirghangi and Pagani, 2013; Fanget al., 2014; Heinzelmann et al., 2015a, b; X. N. Zhang etal., 2009; Z. Zhang et al., 2009). While most of these fac-tors lead to relatively small variations in the deuterium-to-hydrogen (D /H) ratio of fatty acids (10–20 ‰), differencesin the central metabolism of microorganisms have a muchmore pronounced effect (X. N. Zhang et al., 2009). Bothphoto- and chemoautotrophs produce fatty acids depleted inD compared to growth water with the stable hydrogen iso-topic fractionation factor ε between the nC16:0 fatty acid,the most commonly occurring fatty acid in microorganisms,and water (εlipid/water) ranging between −160 to −220 ‰and −250 and −400 ‰, respectively (Campbell et al., 2009;Chikaraishi et al., 2004; Heinzelmann et al., 2015a, b; Ses-sions et al., 2002; Valentine et al., 2004; X. N. Zhang et al.,
Published by Copernicus Publications on behalf of the European Geosciences Union.

5528 S. M. Heinzelmann et al.: Fatty acid D /H ratio of coastal microbial communities
2009; Zhang and Sachs, 2007). In contrast, heterotrophs pro-duce nC16:0 fatty acid with either a relatively minor deple-tion or an enrichment in D compared to the growth waterwith εlipid/water values ranging between −150 and +200 ‰(Dirghangi and Pagani, 2013; Fang et al., 2014; Heinzelmannet al., 2015a, b; Sessions et al., 2002; X. N. Zhang et al.,2009). It has been speculated that the differences in hydrogenisotopic composition of fatty acids produced by organismsexpressing different core metabolisms (i.e. heterotrophy andphoto- and chemoautotrophy) are mainly due to the D /Hratio of the H added to nicotinamide adenine dinucleotidephosphate (NADP+) and the hydrogen isotope fractionationassociated with the reduction of NADP+ to NADPH, whichis used during fatty acid biosynthesis (X. N. Zhang et al.,2009). NADP+ is reduced to NADPH during a number ofdifferent reactions in multiple different metabolic pathways(each associated with different hydrogen isotopic fractiona-tions) and is subsequently used as a major source of hydrogenin lipid biosynthesis (Robins et al., 2003; Saito et al., 1980;Schmidt et al., 2003).
Although the metabolism of a microorganism in pure cul-ture is reflected by the D /H ratio of its fatty acids, it isnot clear whether the D /H ratio of fatty acids from en-vironmental microbial communities can be used to assessthe “community-integrated” core metabolisms and changestherein in nature. Culture conditions rarely represent envi-ronmental conditions since cultures are typically axenic anduse a single substrate; they do not take into account microbialinteractions, which have been shown to affect the hydrogenisotopic composition of lipids (Dawson et al., 2015) and theytest a limited number of potential substrates, energy sourcesand core metabolisms. Previous studies of environmentalsamples observed a wide range in the D /H ratio of lipidsin both the marine water column and sediment (Jones et al.,2008; Li et al., 2009), suggesting inputs of organisms witha variety of metabolisms. Osburn et al. (2011) showed thatdifferent microbial communities from various hot springs inYellowstone National Park produce fatty acids with hydro-gen isotopic compositions in line with the metabolism ex-pressed by the source organism. The D /H ratio of specificfatty acids, which could be attributed to microorganisms ex-pressing a specific core metabolism, was within the range ex-pected for that metabolism. On the other hand, the D /H ratioof common or general fatty acids (e.g. nC16:0) allowed forassessing the metabolism of the main contributors of thesemore general fatty acid, but not necessarily the metabolismof the dominant community members (Osburn et al., 2011).These first environmental results indicate the applicability ofthis new method, which clearly indicates the limitation oflooking only at general occurring fatty acids.
Here, we studied the seasonal variability of the hydrogenisotopic composition of fatty acids from coastal North Seawater sampled from the jetty at the Royal Netherlands Insti-tute for Sea Research (NIOZ) in order to examine the re-lationship between hydrogen isotope fractionation in fatty
acids and the general metabolism of the microbial commu-nity. Time series studies have been previously performedat the NIOZ jetty to determine phytoplankton and prokary-otic abundances and composition (Alderkamp et al., 2006;Brandsma et al., 2012; Brussaard et al., 1996; Philippart etal., 2000, 2010; Pitcher et al., 2011; Sintes et al., 2013), lipidcomposition (Brandsma et al., 2012; Pitcher et al., 2011), andchlorophyll a concentration (Philippart et al., 2010). Typi-cally, the spring bloom in the coastal North Sea is predom-inantly comprised of Phaeocystis globosa, followed directlyby a bloom of various diatom species, a second moderate di-atom bloom of Thalassiosira spp. and Chaetoceros socialisthat occurs in early summer. An autumn bloom is formed byThalassiosira spp., C. socialis, cryptophytes and cyanobac-teria (Brandsma et al., 2012; Cadée and Hegeman, 2002).However the autumn bloom seems to have weakened over thelast years (Philippart et al., 2010). The abundance of bacte-ria increases following the algal blooms and the bacteria aredominated by heterotrophs, e.g. bacteria belonging to Bac-teroidetes (Alderkamp et al., 2006), using released organicmatter from declining phytoplankton blooms as carbon, ni-trogen and phosphate sources. The intact polar lipid (IPL)composition of the microbial community was shown to becomposed mainly of phospholipids, sulfoquinovosyldiacyl-glycerol and betaine lipids with a limited taxonomic poten-tial (Brandsma et al., 2012). The main source of those lipidswas assumed to be the eukaryotic plankton.
This well-studied site should allow us to trace the shiftfrom an environment dominated by photoautotrophs duringmajor phytoplankton blooms, towards an environment witha higher abundance of heterotrophic bacteria following theend of the bloom (Brandsma et al., 2012). These shifts inthe community structure should be reflected in the D /H ra-tio of fatty acids. We, therefore, analysed the D /H ratio ofpolar-lipid-derived fatty acids (PLFAs) over a seasonal cy-cle and compared this with phytoplankton composition dataand abundance and information on the bacterial diversity ob-tained by 16S rRNA gene amplicon sequencing.
2 Material and methods
2.1 Study site and sampling
From September 2010 until December 2011 water sampleswere taken from the NIOZ sampling jetty in the Marsdiepat the western entrance of the North Sea into the WaddenSea near the island of Texel (53◦00′06′′ N, 4◦47′21′′ E). Sur-face water samples (depth max ± 50 cm below surface) werecollected for suspended particulate matter (SPM) biweeklyduring high tide to ensure that water sampled was from theNorth Sea.
For lipid analysis measured volumes of water (ca. 9–11 L)were filtered consecutively, without pre-filtration, throughpre-ashed 3 and 0.7 µm pore size glass fibre filters (GF/F,
Biogeosciences, 13, 5527–5539, 2016 www.biogeosciences.net/13/5527/2016/
S. M. Heinzelmann et al.: Fatty acid D /H ratio of coastal microbial communities 5529
Whatman; 142 mm diameter) and stored at−20 ◦C until lipidextraction. For DNA analysis approximately 1 L seawaterwas filtered through a polycarbonate filter (0.2 µm pore size;142 mm diameter; Millipore filters) and stored at−80 ◦C un-til extraction.
Salinity measurements were done during the time of sam-pling with either an Aanderaa conductivity/temperature sen-sor 3211 connected to an Aanderaa data logger DL3634(Aanderaa Data Instruments AS, Norway) or a refractome-ter/salinometer Endeco type 102 handheld (Endeco, USA).
For chlorophyll a measurements 500 mL sea water was fil-tered through a 47 mm GF/F filter (0.7 µm pore size, What-man, GE Healthcare Life Sciences, Little Chalfont, UK)and immediately frozen in liquid nitrogen. Samples werethawed and homogenized with glass beads and extracted withmethanol. Chlorophyll a concentration was measured witha Dionex high-performance liquid chromatograph (HPLC)(Philippart et al., 2010).
Water samples for salinity versus δDwater calibration (seebelow) were sampled weekly between March and Septem-ber 2013 at high tide. Salinity was determined using a con-ductivity meter (VWR EC300) calibrated to IAPSO standardseawater of salinities 10, 30, 35 and 37.
2.2 Polar-lipid-derived fatty acids
Filters were extracted for IPLs and eventually fatty acid anal-ysis. The 0.7 µm filters did not yield enough total lipid extractfor analysis. Therefore, only fatty acids obtained from the3 µm filters were analysed. Due to fast clogging of the fil-ters and a corresponding decrease of the pore size (Sørensenet al., 2013), the 3 µm filters will most likely contain mostof the microorganisms present in North Sea water, althoughit cannot be excluded that the microorganisms retained onthe filter are biased towards a larger cell size. Freeze-driedfilters were extracted via a modified Bligh–Dyer method(Bligh and Dyer, 1959; Rütters et al., 2002) with methanol(MeOH) / dichloromethane (DCM) / phosphate buffer (2 :1 : 0.8, v/v/v) using ultrasonication (Heinzelmann et al.,2014). Approximately 0.5–1 mg of the Bligh–Dyer extract(BDE) was separated into a neutral and polar lipid frac-tion using silica column chromatography (Heinzelmann etal., 2014). The BDE was added onto a DCM pre-rinsed sil-ica column (0.5 g; activated for 3 h at 150 ◦C) and elutedwith 7 mL of DCM and 15 mL of MeOH. The resulting frac-tions were dried under nitrogen and stored at−20 ◦C. PLFAswere obtained via saponification of the MeOH fraction with1 N KOH in MeOH (96 %). The samples were refluxed at140 ◦C for 1 h. Afterwards the pH was adjusted to 5 with 2 NHCl /MeOH (1/1); bidistilled H2O and DCM were added.The MeOH /H2O layer was washed twice with DCM, theDCM layers combined and water removed using Na2SO4.The sample was dried under nitrogen and stored in the fridge.The PLFAs were methylated with boron trifluoride-methanol(BF3-MeOH) for 5 min at 60 ◦C. Afterwards H2O and DCM
were added. The H2O /MeOH layer was washed three timeswith DCM, and potential traces of water were removed over asmall Na2SO4 column after which the DCM was evaporatedunder a stream of nitrogen. In order to obtain a clean PLFAfraction for isotope analysis, the methylated extract was sep-arated over an aluminium oxide (Al2O3) column, elutingthe methylated PLFAs with three column volumes of DCM.For identification of the position of double bonds in unsatu-rated fatty acids, the methylated PLFAs were derivatized withdimethyldisulfide (DMDS) (Nichols et al., 1986). Hexane,DMDS and I2 / ether (60 mg mL−1) were added to the fattyacids and incubated at 40 ◦C overnight. After adding hex-ane, the iodine was deactivated by addition of a 5 % aqueoussolution of Na2S2O3. The aqueous phase was washed twicewith hexane. The combined hexane layers were cleaned overNa2SO4 and dried under a stream of nitrogen. The dried ex-tracts were stored at 4 ◦C.
2.3 Fatty acid and hydrogen isotope analysis
The fatty acid fractions were analysed by gas chromatog-raphy (GC) using an Agilent 6890 GC with a flame ion-ization detector (FID) using a fused silica capillary col-umn (25 m× 320 µm) coated with CP Sil-5 (film thickness0.12 µm) with helium as carrier gas. The temperature pro-gramme was as follows: initial temperature 70 ◦C, increase oftemperature to 130 ◦C with 20 ◦C min−1, and then to 320 ◦Cwith 4 ◦C min−1, which was kept for 10 min. Individual com-pounds and double bond positions (see above) were iden-tified using GC–mass spectrometry (MS) (Schouten et al.,1998).
Hydrogen isotope analysis of the fatty acid fraction wasperformed by GC thermal conversion (TC) isotope ratiomonitoring (ir) MS using an Agilent 7890 GC connectedvia Thermo GC Isolink and Conflo IV interfaces to aThermo Delta V MS according to Chivall et al. (2014). Sam-ples were injected onto an Agilent CP-Sil 5 CB column(25 m× 0.32 mm ID; 0.4 µm film thickness; He carrier gas,1.0 mL min−1). The GC temperature programme was 70 to145 ◦C at 20 ◦C min−1, then to 320 ◦C at 4 ◦C min−1, whereit was kept for 15 min. Eluting compounds were convertedto H2 at 1420◦C in an Al2O3 tube before introduction intothe mass spectrometer. The H3+ correction factor was deter-mined daily and was constant at 5.3± 0.2. A set of standardn-alkanes with known isotopic composition (Mixture B pre-pared by Arndt Schimmelmann, University of Indiana) wasanalysed daily prior to analysing samples in order to mon-itor the system performance. Samples were only analysedwhen the n-alkanes in Mix B had an average deviation fromtheir offline determined value of < 5 ‰. An internal stan-dard, squalane (δD=−170 ‰), was co-injected with eachfatty acid sample fraction in order to monitor the accuracy ofthe measurements over time with δD=−164± 4 ‰. The δDof the individual fatty acids was measured in duplicates andcorrected for the added methyl group (Heinzelmann et al.,
www.biogeosciences.net/13/5527/2016/ Biogeosciences, 13, 5527–5539, 2016

5530 S. M. Heinzelmann et al.: Fatty acid D /H ratio of coastal microbial communities
2015b). δD of water samples was determined by elementalanalysis (EA)/TC/irMS according to Chivall et al. (2014).
2.4 Phytoplankton abundance and diversity
Phytoplankton samples were preserved with acid Lugol’s io-dine, and cells were counted with a Zeiss inverted micro-scope using 3 mL counting chambers. Most photoautotrophicmicroorganisms were identified to species level, but somewere clustered into taxonomic and size groups (Philippart etal., 2000). For each sampling date in the period from Septem-ber 2010 to December 2011, the densities of the most abun-dant phytoplankton species or species’ groups were calcu-lated. The three most dominant phytoplankton species (orgroups) together comprised, on average, more than 60 % ofthe total numbers of marine phytoplankton in the Marsdiepduring this study period.
2.5 DNA extraction
The 0.2 µm polycarbonate filters were defrosted and cutinto small pieces with sterile scissors and then transferredinto a 50 mL falcon tube. Filter pieces were lysed bybead-beating with ∼ 1 g of sterile 0.1 mm zirconium beads(Biospec, Bartlesville, OK) in 10 mL RLT buffer (Qiagen)and 100 µL β-mercaptoethanol for 10 min; 1/60 volumeRNase A (5 µg µL−1) was added to the lysate, incubated for30 min at 37 ◦C and afterwards cooled down for 5 min onice. The lysate was purified with the DNeasy Blood and Tis-sue Kit (Qiagen, Hilden). DNA was eluted with 3× 100 µLAE buffer, the eluates pooled and reconcentrated. DNA qual-ity and concentration was estimated by NanoDrop (ThermoScientific, Waltham, MA) quantification.
2.6 16S rRNA gene amplicon sequencing and analysis
The general bacterial diversity was assessed by 16S rRNAgene amplicon pyrotag sequencing. The extracted DNA wasquantified fluorometrically with Quant-iT™ PicoGreen® ds-DNA Assay Kit (Life Technologies, the Netherlands).
PCRs were performed with the universal (Bacte-ria and Archaea) primers S-D-Arch 0519-a-S-15 (5′-CAGCMGCCGCGGTAA-3′) and S-D-Bact-785-a-A-21 (5′-GACTACHVGGGTATCTAATCC-3′) (Klindworth et al.,2012) adapted for pyrosequencing by the addition of se-quencing adapters and multiplex identifier (MID) sequences.To minimize bias three independent PCRs were performedcontaining the following: 16.3 µL H2O, 6 µL HF Phusionbuffer, 2.4 µL dNTP (25 mM), 1.5 µL forward and reverseprimer (10 µM; each containing an unique MID tail), 0.5 µLPhusion Taq and 2 µL DNA (6 ng µL−1). The PCR conditionswere the following: 98 ◦C, 30 s; 25× [98 ◦C, 10 s; 53 ◦C,20 s; 72 ◦C, 30 s]; 72 ◦C, 7 min and 4 ◦C, 5 min.
The PCR products were loaded on a 1 % agarose gel andstained with SYBR® Safe (Life Technologies, the Nether-lands). Bands were excised with a sterile scalpel and puri-
fied with Qiaquick Gel Extraction Kit (QIAGEN, Valencia,CA) following the manufacturer’s instructions. PCR puri-fied products were quantified with Quant-iT™ PicoGreen®
dsDNA Assay Kit (Life Technologies, the Netherlands).Equimolar concentrations of the barcoded PCR productswere pooled and sequenced on GS FLX Titanium platform(454 Life Sciences) by Macrogen Inc., South Korea.
Samples were analysed using the QIIME pipeline (Capo-raso et al., 2010). Raw sequences were demultiplexed andthen quality-filtered with a minimum quality score of 25,length between 250 and 350 bp, and allowing a maximumof two errors in the barcode sequence. Sequences were thenclustered into operational taxonomic units (OTUs, 97 % sim-ilarity) with UCLUST (Edgar, 2010). Reads were aligned tothe Greengenes Core reference alignment (DeSantis et al.,2006) using the PyNAST algorithm (Caporaso et al., 2010).Taxonomy was assigned based on the Greengenes taxon-omy and a Greengenes reference database (version 12_10)(McDonald et al., 2012; Werner et al., 2012). Represen-tative OTU sequences assigned to the specific taxonomicgroups were extracted through classify.seqs and get.lineagein Mothur (Schloss et al., 2009) by using the Greengenesreference and taxonomy files. The 16S rRNA gene ampliconreads (raw data) were deposited in the NCBI Sequence ReadArchive (SRA) under BioProject number PRJNA293285.
2.7 Phylogenetic analyses
The phylogenetic affiliation of the 16S rRNA gene sequenceswas compared to release 119 of the Silva NR SSU Refdatabase (http://www.arb-silva.de/; Quast, 2012) using theARB software package (Ludwig et al., 2004). Sequenceswere added to the reference tree supplied by the Silvadatabase using the ARB Parsimony tool.
3 Results
3.1 Chlorophyll a concentration and phytoplanktonabundance and diversity
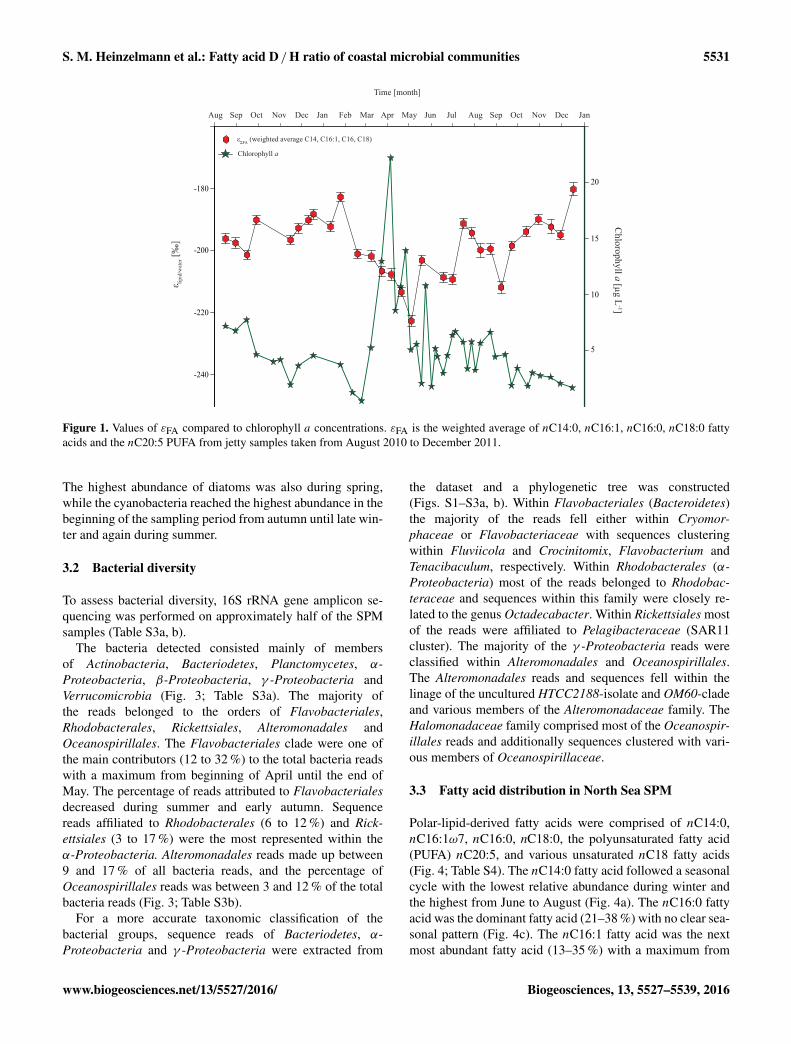
Chlorophyll a concentrations ranged between 0.4 and22.2 µg L−1 (Fig. 1; Table S1 in the Supplement). Duringlate autumn, winter and early spring concentrations werelow at ∼ 4 µg L−1. A peak in the chlorophyll a concentra-tion occurred in the beginning of April and values stayedrelatively high during this month, indicative of the springbloom. Subsequently, the chlorophyll a concentration de-creased again, reaching pre-bloom levels and stayed rela-tively constant thereafter.
Phytoplankton diversity and abundance was determinedusing light microscopy, and the two to three most abun-dant phytoplankton species were identified and counted (Ta-ble S2). The majority of the phytoplankton was composedof Phaeocystis globosa, diatoms and cyanobacteria (Fig. 2),with the spring bloom primarily being made up of P. globosa.
Biogeosciences, 13, 5527–5539, 2016 www.biogeosciences.net/13/5527/2016/
S. M. Heinzelmann et al.: Fatty acid D /H ratio of coastal microbial communities 5531
-240
-220
-200
-180
εΣFA (weighted average C14, C16:1, C16, C18)
ε lipid
/wat
er [‰
]
5
10
15
20
Chlorophyll a
Chlorophyll a [µg L
-1]
Time [month]
Aug MarNovSep FebJanDec JulJunMayAprOct Aug NovSep DecOct Jan
Figure 1. Values of εFA compared to chlorophyll a concentrations. εFA is the weighted average of nC14:0, nC16:1, nC16:0, nC18:0 fattyacids and the nC20:5 PUFA from jetty samples taken from August 2010 to December 2011.
The highest abundance of diatoms was also during spring,while the cyanobacteria reached the highest abundance in thebeginning of the sampling period from autumn until late win-ter and again during summer.
3.2 Bacterial diversity
To assess bacterial diversity, 16S rRNA gene amplicon se-quencing was performed on approximately half of the SPMsamples (Table S3a, b).
The bacteria detected consisted mainly of membersof Actinobacteria, Bacteriodetes, Planctomycetes, α-Proteobacteria, β-Proteobacteria, γ -Proteobacteria andVerrucomicrobia (Fig. 3; Table S3a). The majority ofthe reads belonged to the orders of Flavobacteriales,Rhodobacterales, Rickettsiales, Alteromonadales andOceanospirillales. The Flavobacteriales clade were one ofthe main contributors (12 to 32 %) to the total bacteria readswith a maximum from beginning of April until the end ofMay. The percentage of reads attributed to Flavobacterialesdecreased during summer and early autumn. Sequencereads affiliated to Rhodobacterales (6 to 12 %) and Rick-ettsiales (3 to 17 %) were the most represented within theα-Proteobacteria. Alteromonadales reads made up between9 and 17 % of all bacteria reads, and the percentage ofOceanospirillales reads was between 3 and 12 % of the totalbacteria reads (Fig. 3; Table S3b).
For a more accurate taxonomic classification of thebacterial groups, sequence reads of Bacteriodetes, α-Proteobacteria and γ -Proteobacteria were extracted from
the dataset and a phylogenetic tree was constructed(Figs. S1–S3a, b). Within Flavobacteriales (Bacteroidetes)the majority of the reads fell either within Cryomor-phaceae or Flavobacteriaceae with sequences clusteringwithin Fluviicola and Crocinitomix, Flavobacterium andTenacibaculum, respectively. Within Rhodobacterales (α-Proteobacteria) most of the reads belonged to Rhodobac-teraceae and sequences within this family were closely re-lated to the genus Octadecabacter. Within Rickettsiales mostof the reads were affiliated to Pelagibacteraceae (SAR11cluster). The majority of the γ -Proteobacteria reads wereclassified within Alteromonadales and Oceanospirillales.The Alteromonadales reads and sequences fell within thelinage of the uncultured HTCC2188-isolate and OM60-cladeand various members of the Alteromonadaceae family. TheHalomonadaceae family comprised most of the Oceanospir-illales reads and additionally sequences clustered with vari-ous members of Oceanospirillaceae.
3.3 Fatty acid distribution in North Sea SPM
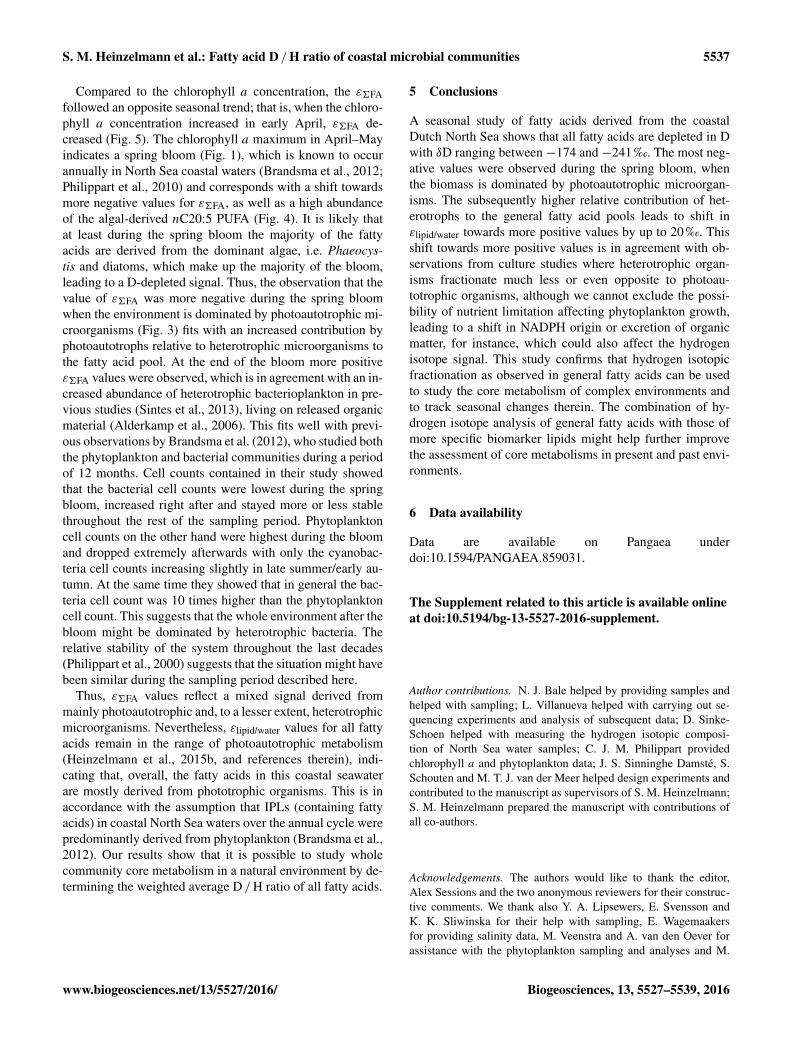
Polar-lipid-derived fatty acids were comprised of nC14:0,nC16:1ω7, nC16:0, nC18:0, the polyunsaturated fatty acid(PUFA) nC20:5, and various unsaturated nC18 fatty acids(Fig. 4; Table S4). The nC14:0 fatty acid followed a seasonalcycle with the lowest relative abundance during winter andthe highest from June to August (Fig. 4a). The nC16:0 fattyacid was the dominant fatty acid (21–38 %) with no clear sea-sonal pattern (Fig. 4c). The nC16:1 fatty acid was the nextmost abundant fatty acid (13–35 %) with a maximum from
www.biogeosciences.net/13/5527/2016/ Biogeosciences, 13, 5527–5539, 2016

5532 S. M. Heinzelmann et al.: Fatty acid D /H ratio of coastal microbial communities
Cyanobacteria
Cryptophyta
Chlorophyta
Diatoms
Phaeocystis globosa
Sep 2010 Oct Nov Dec Jan Feb AprMar May Jun Jul Aug Sep Oct Nov Dec 2011
Winter Spring Summer Autumn
0.5
1.5
2.5
3.5
3
2
1
4
cells
L-1 [*
107 ]
Figure 2. Phytoplankton diversity and abundance (measured in cells L−1) observed in the coastal North Sea between August 2010 andDecember 2011.
March to April (Fig. 4b). Various unsaturated nC18:× fattyacids were observed throughout the season. Due to low abun-dance of the individual fatty acids and co-elutions the doublebond positions could not be determined. These unsaturatedfatty acids made up 9–30 % of all fatty acids (Fig. 4d). ThenC18:0 fatty acid had relative abundances varying between2 and 18 % with the highest relative abundance during au-tumn months (10–18 %) and the lowest during spring, 2–6 %(Fig. 4e). A nC20:5 PUFA (Fig. 4f) was observed in mostsamples with the highest relative abundance during Marchand April (11–14 %) and early August (18 %). Trace amountsof nC15:0, iC15:0 and aiC15:0 fatty acids were also de-tected.
3.4 Hydrogen isotopic composition of fatty acids
δD values of nC14:0, nC16:1ω7, nC16:0, nC18:0 andnC20:5 fatty acids were obtained for most of the samples(Table S5). The D /H ratio of the other fatty acids could notbe determined with sufficient accuracy due to either incom-plete separation or low abundance.
In general, nC14:0 and nC20:5 were the most depletedfatty acids with δD values ranging between−198 to−241 ‰and −180 to −241 ‰, respectively. The nC18:0 was typi-cally the fatty acid with the highest δD values ranging be-tween −175 and −212 ‰ (Table S5).
4 Discussion
4.1 Hydrogen isotopic fractionation expressed in fattyacids
For the proper assessment of the impact of metabolism onthe hydrogen isotopic composition of fatty acids, the hydro-gen isotopic fractionation of the fatty acids versus water isrequired (εlipid/water). For this, the δD of the water (δDwater) atthe time of sampling is needed. However, at the time of sam-pling of the SPM unfortunately no water samples were takenand preserved for δD analysis. Therefore, we used an alter-native approach to estimate δDwater using the salinity of thewater measured at the time of sampling. A strong correlationbetween salinity and δDwater is generally observed in marineenvironments since both parameters depend on evaporation,precipitation and freshwater influx (Craig and Gordon, 1965;Mook, 2001). To establish a local salinity – δDwater correla-tion, water samples were collected weekly during high tide(March to September 2013) and salinity and δDwater weremeasured. Indeed, a strong correlation between salinity andδDwater is observed (R2
= 0.68; Fig. S4). Using this corre-lation and the salinities measured, we reconstructed δDwatervalues at the time of sampling of the biomass (Table 1). Theerror in the estimate of δDwater values resulting from this ap-proach is approximately 1.5 ‰, which is less than the errorin the determination of δD of the fatty acids (1–12 ‰) and
Biogeosciences, 13, 5527–5539, 2016 www.biogeosciences.net/13/5527/2016/

S. M. Heinzelmann et al.: Fatty acid D /H ratio of coastal microbial communities 5533
0%
10 %
20 %
30 %
40 %
50 %
60 %
70 %
80 %
90 %
100 %
VerrucomicrobialesPuniceicoccalesThiotrichalesOceanospirillalesAlteromonadalesRhodocyclalesMethylophilalesRickettsialesRhodobacteralesPirellulalesSphingobacterialesFlavobacterialesMicrococcalesAcidimicrobialesOther
28/09
/10
26/11
/10
10/01
/11
23/03
/11
08/03
/11
05/04
/11
19/04
/11
03/05
/11
18/05
/11
17/06
/11
30/06
/11
15/07
/11
22/08
/11
06/09
/11
21/09
/11
28/10
/11
% o
f tot
al b
acte
ria re
ads
Winter AutumnSpring Summer
Time [dd/mm/yy]
}}
}}
}}
Actinobacteria
Bacteroidetes
α-Proteobacteria
β-Proteobacteria
γ-Proteobacteria
Verrucomicrobia
Planctomycetes
Figure 3. Order-level bacterial diversity and abundance in North Sea water based on the 16S rRNA gene sequence.
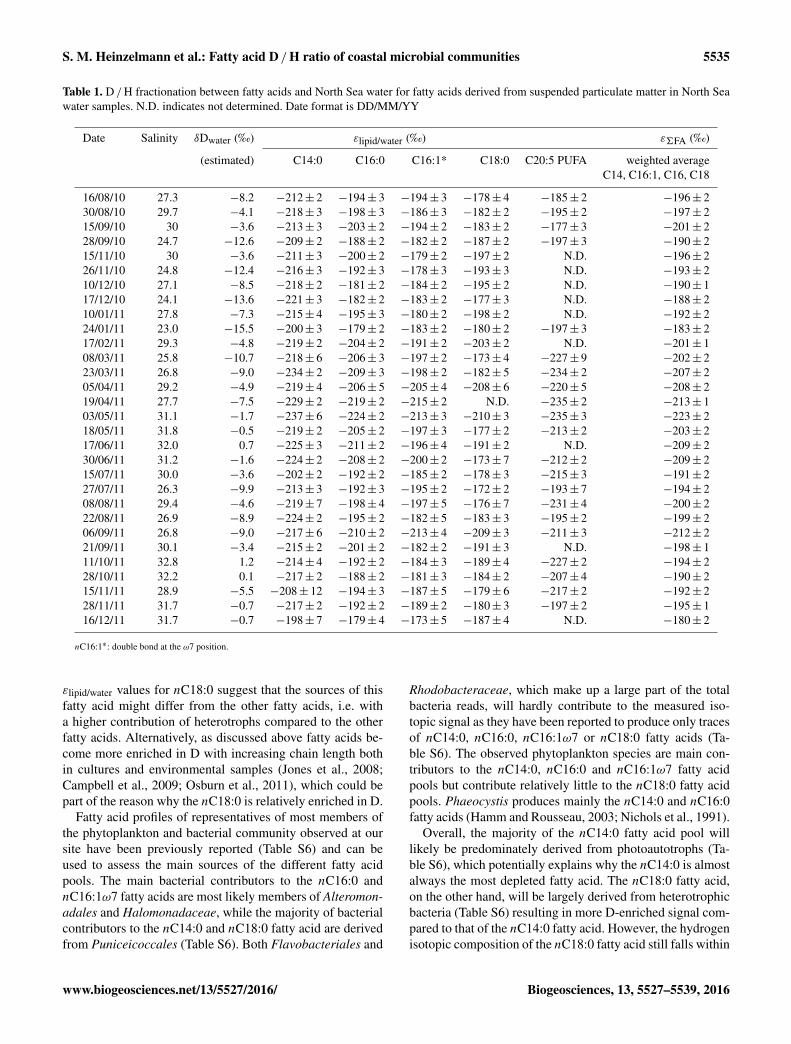
minor compared to the entire range in fatty acid δD (−174 to−241 ‰) and εlipid/water (−173 to −237 ‰).
All fatty acids were depleted in D compared to waterwith the fractionation factor εlipid/water ranging from −173to −237 ‰, all following a similar seasonal trend with thehighest degree of fractionation during spring to early sum-mer, and early autumn (Fig. 5; Table 1). The lowest degreeof fractionation (most positive εlipid/water values) was in gen-eral during late autumn and the winter months.
4.2 Source affects the hydrogen isotopic composition ofindividual fatty acids
The nC20:5 PUFA is the most specific fatty acid detectedin North Sea SPM and is exclusively produced by algae(Carrie et al., 1998). Here the nC20:5 PUFA is gener-ally one of the most D-depleted fatty acids (Fig. 5), whichis in agreement with culture studies that show that pho-toautotrophic microorganisms produce fatty acids that aredepleted in D with εlipid/water values between −160 and−220 ‰ (Heinzelmann et al., 2015b, and references therein),while heterotrophic microorganisms on the other hand pro-duce fatty acids with εlipid/water values ranging between−150and +200 ‰ (Heinzelmann et al., 2015b, and referencestherein). Furthermore, its concentration increased at the timeof the phytoplankton bloom (Fig. 4). Interestingly, after thephytoplankton bloom, when the abundance of pelagic algae
had decreased (Fig. 4), it became more enriched in D (Fig. 5).This enrichment might be due to changes in the relative con-tribution of source organisms. In diatoms nC20:5 PUFA canbe one of the most abundant fatty acids, while Phaeocystisproduces it in minor amounts only (Table S6). During thespring bloom both organisms will contribute to the fatty acidpool, while afterwards diatoms are the main source (Fig. 2;Table S2). A changing contribution from different speciescould potentially affect the hydrogen isotopic compositionof a fatty acid even if the source organisms are all pho-toautotrophic phytoplankton. For instance, colony-formingalgae such as Eudorina unicocca and Volvox aureus havebeen shown to fractionate much less against D than otheralgae (Zhang et al., 2007; Heinzelmann et al., 2015b). In-deed, Phaeocystis, although belonging to a different phylum,is also a colony-forming algae. However, if this were the rea-son for the changing D content of the nC20:5 PUFA follow-ing the spring bloom, it would then be expected to becomemore D-depleted with a reduced contribution from Phaeo-cystis, not D-enriched. A potential reason for the relativelyD-enriched Phaeocystis lipids could be excretion of largeamounts of D-depleted organic matter, leading directly or in-directly, through the isotopic composition of cell water, to D-enriched lipids (Sachs et al., 2016), as has been observed forcolony-forming algae. Increased organic matter excretion byphytoplankton at the end of the bloom could therefore be an-other mechanism explaining the D enrichment of the nC20:5
www.biogeosciences.net/13/5527/2016/ Biogeosciences, 13, 5527–5539, 2016

5534 S. M. Heinzelmann et al.: Fatty acid D /H ratio of coastal microbial communities
0
10
20
30
40
0
10
20
30
40
0
10
20
30
40
0
10
20
30
40
0
10
20
30
40
0
10
20
30
40
Aug Sep Oct Nov Dec Jan Feb Mar Apr May Jun Jul Aug Sep Oct Nov Dec Jan Aug Sep Oct Nov Dec Jan Feb Mar Apr May Jun Jul Aug Sep Oct Nov Dec Jan
Rel
ativ
e ab
unda
nce
[%]
Rel
ativ
e ab
unda
nce
[%]
Rel
ativ
e ab
unda
nce
[%]
(a) (b)
(c) (d)
(e) (f)
C14:0 C16:1ω7
C16:0
C18:x
C18:0
Chlorophyll a
C20:5 PUFA
2010 2011 2010 2011
10
20
Chl
orop
hyll
a [µ
g L
-1]
Figure 4. Relative abundance of fatty acids and chlorophyll a concentration in North Sea SPM. (a) nC14:0, (b) nC16:1, (c) nC16:0,(d) nC18:x, (e) nC18:0, (f) nC20:5 PUFA and chlorophyll a.
PUFA. Another possible reason could be that after the bloomand due to nutrient limitation, phytoplankton hypotheticallymight use more storage products potentially leading to an in-creased production of NADPH via other pathways than pho-tosynthesis. The NADPH produced by photoautotrophs viaphotosystem I is depleted in D (X. N. Zhang et al., 2009),while NADPH produced via the pentose phosphate (OPP)pathway and the tricarboxylic acid (TCA) cycle is relativelyenriched in D (Heinzelmann et al., 2015b; X. N. Zhang etal., 2009). The utilization of storage products would lead toan increased reduction of NADP+ to NADPH via both theOPP pathway and the TCA cycle leading to more positiveεlipid/water values of the nC20:5 PUFA after the bloom. Inbatch culture with increasing nutrient limitation fatty acids
of algae became enriched in D with increasing age of theculture (Heinzelmann et al., 2015b) potentially due to a shiftin the origin of NADPH or the excretion of organic matter ora combination of multiple factors.
Of all other fatty acids nC14:0 was generally the most D-depleted fatty acid, possibly suggesting a higher contributionof photoautotrophic organisms to this fatty acid. However, ithas been reported that fatty acids in general seem to becomemore enriched in D with chain length both in cultures and inenvironmental samples, which might play a minor role hereas well (Jones et al., 2008; Campbell et al., 2009; Osburnet al., 2011). The quite similar εlipid/water values of nC16:0(−179 to −224 ‰) and nC16:1 (−173 to −215 ‰) suggestsimilar sources for the two fatty acids. The least negative
Biogeosciences, 13, 5527–5539, 2016 www.biogeosciences.net/13/5527/2016/
S. M. Heinzelmann et al.: Fatty acid D /H ratio of coastal microbial communities 5535
Table 1. D /H fractionation between fatty acids and North Sea water for fatty acids derived from suspended particulate matter in North Seawater samples. N.D. indicates not determined. Date format is DD/MM/YY
Date Salinity δDwater (‰) εlipid/water (‰) ε6FA (‰)
(estimated) C14:0 C16:0 C16:1* C18:0 C20:5 PUFA weighted averageC14, C16:1, C16, C18
16/08/10 27.3 −8.2 −212± 2 −194± 3 −194± 3 −178± 4 −185± 2 −196± 230/08/10 29.7 −4.1 −218± 3 −198± 3 −186± 3 −182± 2 −195± 2 −197± 215/09/10 30 −3.6 −213± 3 −203± 2 −194± 2 −183± 2 −177± 3 −201± 228/09/10 24.7 −12.6 −209± 2 −188± 2 −182± 2 −187± 2 −197± 3 −190± 215/11/10 30 −3.6 −211± 3 −200± 2 −179± 2 −197± 2 N.D. −196± 226/11/10 24.8 −12.4 −216± 3 −192± 3 −178± 3 −193± 3 N.D. −193± 210/12/10 27.1 −8.5 −218± 2 −181± 2 −184± 2 −195± 2 N.D. −190± 117/12/10 24.1 −13.6 −221± 3 −182± 2 −183± 2 −177± 3 N.D. −188± 210/01/11 27.8 −7.3 −215± 4 −195± 3 −180± 2 −198± 2 N.D. −192± 224/01/11 23.0 −15.5 −200± 3 −179± 2 −183± 2 −180± 2 −197± 3 −183± 217/02/11 29.3 −4.8 −219± 2 −204± 2 −191± 2 −203± 2 N.D. −201± 108/03/11 25.8 −10.7 −218± 6 −206± 3 −197± 2 −173± 4 −227± 9 −202± 223/03/11 26.8 −9.0 −234± 2 −209± 3 −198± 2 −182± 5 −234± 2 −207± 205/04/11 29.2 −4.9 −219± 4 −206± 5 −205± 4 −208± 6 −220± 5 −208± 219/04/11 27.7 −7.5 −229± 2 −219± 2 −215± 2 N.D. −235± 2 −213± 103/05/11 31.1 −1.7 −237± 6 −224± 2 −213± 3 −210± 3 −235± 3 −223± 218/05/11 31.8 −0.5 −219± 2 −205± 2 −197± 3 −177± 2 −213± 2 −203± 217/06/11 32.0 0.7 −225± 3 −211± 2 −196± 4 −191± 2 N.D. −209± 230/06/11 31.2 −1.6 −224± 2 −208± 2 −200± 2 −173± 7 −212± 2 −209± 215/07/11 30.0 −3.6 −202± 2 −192± 2 −185± 2 −178± 3 −215± 3 −191± 227/07/11 26.3 −9.9 −213± 3 −192± 3 −195± 2 −172± 2 −193± 7 −194± 208/08/11 29.4 −4.6 −219± 7 −198± 4 −197± 5 −176± 7 −231± 4 −200± 222/08/11 26.9 −8.9 −224± 2 −195± 2 −182± 5 −183± 3 −195± 2 −199± 206/09/11 26.8 −9.0 −217± 6 −210± 2 −213± 4 −209± 3 −211± 3 −212± 221/09/11 30.1 −3.4 −215± 2 −201± 2 −182± 2 −191± 3 N.D. −198± 111/10/11 32.8 1.2 −214± 4 −192± 2 −184± 3 −189± 4 −227± 2 −194± 228/10/11 32.2 0.1 −217± 2 −188± 2 −181± 3 −184± 2 −207± 4 −190± 215/11/11 28.9 −5.5 −208± 12 −194± 3 −187± 5 −179± 6 −217± 2 −192± 228/11/11 31.7 −0.7 −217± 2 −192± 2 −189± 2 −180± 3 −197± 2 −195± 116/12/11 31.7 −0.7 −198± 7 −179± 4 −173± 5 −187± 4 N.D. −180± 2
nC16:1∗: double bond at the ω7 position.
εlipid/water values for nC18:0 suggest that the sources of thisfatty acid might differ from the other fatty acids, i.e. witha higher contribution of heterotrophs compared to the otherfatty acids. Alternatively, as discussed above fatty acids be-come more enriched in D with increasing chain length bothin cultures and environmental samples (Jones et al., 2008;Campbell et al., 2009; Osburn et al., 2011), which could bepart of the reason why the nC18:0 is relatively enriched in D.
Fatty acid profiles of representatives of most members ofthe phytoplankton and bacterial community observed at oursite have been previously reported (Table S6) and can beused to assess the main sources of the different fatty acidpools. The main bacterial contributors to the nC16:0 andnC16:1ω7 fatty acids are most likely members of Alteromon-adales and Halomonadaceae, while the majority of bacterialcontributors to the nC14:0 and nC18:0 fatty acid are derivedfrom Puniceicoccales (Table S6). Both Flavobacteriales and
Rhodobacteraceae, which make up a large part of the totalbacteria reads, will hardly contribute to the measured iso-topic signal as they have been reported to produce only tracesof nC14:0, nC16:0, nC16:1ω7 or nC18:0 fatty acids (Ta-ble S6). The observed phytoplankton species are main con-tributors to the nC14:0, nC16:0 and nC16:1ω7 fatty acidpools but contribute relatively little to the nC18:0 fatty acidpools. Phaeocystis produces mainly the nC14:0 and nC16:0fatty acids (Hamm and Rousseau, 2003; Nichols et al., 1991).
Overall, the majority of the nC14:0 fatty acid pool willlikely be predominately derived from photoautotrophs (Ta-ble S6), which potentially explains why the nC14:0 is almostalways the most depleted fatty acid. The nC18:0 fatty acid,on the other hand, will be largely derived from heterotrophicbacteria (Table S6) resulting in more D-enriched signal com-pared to that of the nC14:0 fatty acid. However, the hydrogenisotopic composition of the nC18:0 fatty acid still falls within
www.biogeosciences.net/13/5527/2016/ Biogeosciences, 13, 5527–5539, 2016

5536 S. M. Heinzelmann et al.: Fatty acid D /H ratio of coastal microbial communities
Aug Sep Oct Nov Dec Jan Feb Mar Apr May Jun Jul Aug Sep Oct Nov Dec Jan
-240
-220
-200
-180
-160
(a) C14:0
Aug Sep Oct Nov Dec Jan Feb Mar Apr May Jun Jul Aug Sep Oct Nov Dec Jan
-240
-220
-200
-180
-160
(b) C16:1ω7
-240
-220
-200
-180
-160
ε lipid
/wat
er [‰
]
(c)
C16:0
ε lipid
/wat
er [‰
]ε lip
id/w
ater [‰
]
-240
-220
-200
-180
-160(d)
C18:0
-240
-220
-200
-180
-160(e)
C20:5 PUFA
Figure 5. The D /H fractionation between fatty acids and North Sea water for fatty acids derived from suspended particulate matter in NorthSea water samples. Plotted are the εlipid/water values of nC14:0, nC16:1, nC16:0, nC18:0 fatty acids and nC20:5 PUFA.
the range for photoautotrophic organisms, albeit at the higherend, suggesting that although it is only produced in minoramounts by phytoplankton, a relatively high abundance ofphytoplankton could still determine its isotopic composition.
None of the fatty acids measured in the North Sea SPMhave εlipid/water values which fall in the range of those pre-dicted for chemoautotrophs (−264 to−345 ‰; Heinzelmannet al., 2015b, and references therein). This fits with the ob-servation that sequence reads of chemoautotrophic bacteriaaccounted for < 3 % of the total bacterial reads (Fig. 3; Ta-ble S3a, b), and thus it is unlikely that this metabolism playsan important role in this environment.
4.3 Linking seasonal changes of hydrogen isotopefractionation to changes in community metabolism
In general most fatty acids showed a similar seasonal trendwith the most negative ε values in spring and the most pos-itive ε values in the winter (Fig. 5). In order to assess thedominant metabolism of the whole microbial community wecalculated a weighted average ε of all measured fatty acidsapart from the specific nC20:5 PUFA. The weighted aver-age εlipid/water (ε6FA) followed the same seasonal trend asthe εlipid/water values of the individual fatty acids (Figs. 1, 5)and ranged between −180 and −225 ‰ with an average of−199 ‰.
Biogeosciences, 13, 5527–5539, 2016 www.biogeosciences.net/13/5527/2016/
S. M. Heinzelmann et al.: Fatty acid D /H ratio of coastal microbial communities 5537
Compared to the chlorophyll a concentration, the ε6FAfollowed an opposite seasonal trend; that is, when the chloro-phyll a concentration increased in early April, ε6FA de-creased (Fig. 5). The chlorophyll a maximum in April–Mayindicates a spring bloom (Fig. 1), which is known to occurannually in North Sea coastal waters (Brandsma et al., 2012;Philippart et al., 2010) and corresponds with a shift towardsmore negative values for ε6FA, as well as a high abundanceof the algal-derived nC20:5 PUFA (Fig. 4). It is likely thatat least during the spring bloom the majority of the fattyacids are derived from the dominant algae, i.e. Phaeocys-tis and diatoms, which make up the majority of the bloom,leading to a D-depleted signal. Thus, the observation that thevalue of ε6FA was more negative during the spring bloomwhen the environment is dominated by photoautotrophic mi-croorganisms (Fig. 3) fits with an increased contribution byphotoautotrophs relative to heterotrophic microorganisms tothe fatty acid pool. At the end of the bloom more positiveε6FA values were observed, which is in agreement with an in-creased abundance of heterotrophic bacterioplankton in pre-vious studies (Sintes et al., 2013), living on released organicmaterial (Alderkamp et al., 2006). This fits well with previ-ous observations by Brandsma et al. (2012), who studied boththe phytoplankton and bacterial communities during a periodof 12 months. Cell counts contained in their study showedthat the bacterial cell counts were lowest during the springbloom, increased right after and stayed more or less stablethroughout the rest of the sampling period. Phytoplanktoncell counts on the other hand were highest during the bloomand dropped extremely afterwards with only the cyanobac-teria cell counts increasing slightly in late summer/early au-tumn. At the same time they showed that in general the bac-teria cell count was 10 times higher than the phytoplanktoncell count. This suggests that the whole environment after thebloom might be dominated by heterotrophic bacteria. Therelative stability of the system throughout the last decades(Philippart et al., 2000) suggests that the situation might havebeen similar during the sampling period described here.
Thus, ε6FA values reflect a mixed signal derived frommainly photoautotrophic and, to a lesser extent, heterotrophicmicroorganisms. Nevertheless, εlipid/water values for all fattyacids remain in the range of photoautotrophic metabolism(Heinzelmann et al., 2015b, and references therein), indi-cating that, overall, the fatty acids in this coastal seawaterare mostly derived from phototrophic organisms. This is inaccordance with the assumption that IPLs (containing fattyacids) in coastal North Sea waters over the annual cycle werepredominantly derived from phytoplankton (Brandsma et al.,2012). Our results show that it is possible to study wholecommunity core metabolism in a natural environment by de-termining the weighted average D /H ratio of all fatty acids.
5 Conclusions
A seasonal study of fatty acids derived from the coastalDutch North Sea shows that all fatty acids are depleted in Dwith δD ranging between −174 and −241 ‰. The most neg-ative values were observed during the spring bloom, whenthe biomass is dominated by photoautotrophic microorgan-isms. The subsequently higher relative contribution of het-erotrophs to the general fatty acid pools leads to shift inεlipid/water towards more positive values by up to 20 ‰. Thisshift towards more positive values is in agreement with ob-servations from culture studies where heterotrophic organ-isms fractionate much less or even opposite to photoau-totrophic organisms, although we cannot exclude the possi-bility of nutrient limitation affecting phytoplankton growth,leading to a shift in NADPH origin or excretion of organicmatter, for instance, which could also affect the hydrogenisotope signal. This study confirms that hydrogen isotopicfractionation as observed in general fatty acids can be usedto study the core metabolism of complex environments andto track seasonal changes therein. The combination of hy-drogen isotope analysis of general fatty acids with those ofmore specific biomarker lipids might help further improvethe assessment of core metabolisms in present and past envi-ronments.
6 Data availability
Data are available on Pangaea underdoi:10.1594/PANGAEA.859031.
The Supplement related to this article is available onlineat doi:10.5194/bg-13-5527-2016-supplement.
Author contributions. N. J. Bale helped by providing samples andhelped with sampling; L. Villanueva helped with carrying out se-quencing experiments and analysis of subsequent data; D. Sinke-Schoen helped with measuring the hydrogen isotopic composi-tion of North Sea water samples; C. J. M. Philippart providedchlorophyll a and phytoplankton data; J. S. Sinninghe Damsté, S.Schouten and M. T. J. van der Meer helped design experiments andcontributed to the manuscript as supervisors of S. M. Heinzelmann;S. M. Heinzelmann prepared the manuscript with contributions ofall co-authors.
Acknowledgements. The authors would like to thank the editor,Alex Sessions and the two anonymous reviewers for their construc-tive comments. We thank also Y. A. Lipsewers, E. Svensson andK. K. Sliwinska for their help with sampling, E. Wagemaakersfor providing salinity data, M. Veenstra and A. van den Oever forassistance with the phytoplankton sampling and analyses and M.
www.biogeosciences.net/13/5527/2016/ Biogeosciences, 13, 5527–5539, 2016

5538 S. M. Heinzelmann et al.: Fatty acid D /H ratio of coastal microbial communities
Verweij for assistance with the GC-MS measurements. M. van derMeer was funded by the Dutch Organisation for Scientific Research(NWO) through a VIDI grant.
Edited by: K. SuzukiReviewed by: A. Sessions and two anonymous referees
References
Alderkamp, A. C., Sintes, E., and Herndl, G. J.: Abundance andactivity of major groups of prokaryotic plankton in the coastalNorth Sea during spring and summer, Aquat. Microb. Ecol., 45,237–246, 2006.
Bligh, E. G. and Dyer, W. J.: A rapid method of total lipid extractionand purification, Can. J. Biochem. Physiol., 37, 911–917, 1959.
Brandsma, J., Hopmans, E. C., Philippart, C. J. M., Veldhuis, M.J. W., Schouten, S., and Sinninghe Damsté, J. S.: Low tem-poral variation in the intact polar lipid composition of NorthSea coastal marine water reveals limited chemotaxonomic value,Biogeosciences, 9, 1073–1084, 10.5194/bg-9-1073-2012, 2012.
Brussaard, C. P. D., Gast, G. J., van Duyl, F. C., and Riegman, R.:Impact of phytoplankton bloom magnitude on a pelagic micro-bial food web, Mar. Ecol. Prog. Ser., 144, 211–221, 1996.
Cadée, G. C. and Hegeman, J.: Phytoplankton in the Marsdiep atthe end of the 20th century; 30 years monitoring biomass, pri-mary production, and Phaeocystis blooms, J. Sea Res., 48, 97–110, 2002.
Campbell, B. J., Li, C., Sessions, A. L., and Valentine, D. L.: Hydro-gen isotopic fractionation in lipid biosynthesis by H2-consumingDesulfobacterium autotrophicum, Geochim. Cosmochim. Acta,73, 2744–2757, 2009.
Caporaso, J. G., Kuczynski, J., Stombaugh, J., Bittinger, K., Bush-man, F. D., Costello, E. K., Fierer, N., Pena, A. G., Goodrich,J. K., Gordon, J. I., Huttley, G. A., Kelley, S. T., Knights,D., Koenig, J. E., Ley, R. E., Lozupone, C. A., McDonald,D., Muegge, B. D., Pirrung, M., Reeder, J., Sevinsky, J. R.,Turnbaugh, P. J., Walters, W. A., Widmann, J., Yatsunenko, T.,Zaneveld, J., and Knight, R.: QIIME allows analysis of high-throughput community sequencing data, Nat. Methods, 7, 335–336, 2010.
Chikaraishi, Y., Suzuki, Y., and Naraoka, H.: Hydrogen isotopicfractionations during desaturation and elongation associated withpolyunsaturated fatty acid biosynthesis in marine macroalgae,Phytochemistry, 65, 2293–2300, 2004.
Chivall, D., M’Boule, D., Sinke-Schoen, D., Sinninghe Damsté,J. S., Schouten, S., and van der Meer, M. T. J.: The effects ofgrowth phase and salinity on the hydrogen isotopic compositionof alkenones produced by coastal haptophyte algae, Geochim.Cosmochim. Acta, 140, 381–390, 2014.
Craig, H. and Gordon, L. I.: Deuterium and oxygen 18 variationsin the ocean and the marine atmosphere, in: Stable Isotopes inOceanographic Studies and Paleotemperatures, edited by: Ton-giogi, E., Consiglio Nazionale Delle Ricerche, Laboratorio DiGeologia Nucleare, Pisa, 9–130, 1965.
Dawson, K. S., Osburn, M. R., Sessions, A. L., and Orphan, V. J.:Metabolic associations with archaea drive shifts in hydrogen iso-topic fractionation in sulfate-reducing bacterial lipids in cocul-tures and methane seeps, Geobiology, 13, 462–477, 2015
DeSantis, T. Z., Hugenholtz, P., Larsen, N., Rojas, M., Brodie, E.L., Keller, K., Huber, T., Dalevi, D., Hu, P., and Andersen, G.L.: Greengenes, a chimera-checked 16S rRNA gene database andworkbench compatible with ARB, Appl. Environ. Microbiol., 72,5069–5072, 2006.
Dirghangi, S. S. and Pagani, M.: Hydrogen isotope fractionationduring lipid biosynthesis by Tetrahymena thermophila, Org.Geochem., 64, 105–111, 2013.
Edgar, R. C.: Search and clustering orders of magnitude faster thanBLAST, Bioinformatics, 26, 2460–2461, 2010.
Fang, J., Li, C., Zhang, L., Davis, T., Kato, C., and Bartlett, D.H.: Hydrogen isotope fractionation in lipid biosynthesis by thepiezophilic bacterium Moritella japonica DSK1, Chem. Geol.,367, 34–38, 2014.
Hamm, C. E. and Rousseau, V.: Composition, assimilation anddegradation of Phaeocystis globosa-derived fatty acids in theNorth Sea, J. Sea Res., 50, 271–283, 2003.
Heinzelmann, S. M., Bale, N. J., Hopmans, E. C., SinningheDamsté, J. S., Schouten, S., and van der Meer, M. T. J.: Criti-cal assessment of glyco- and phospholipid separation by usingsilica chromatography, Appl. Environ. Microbiol., 80, 360–365,2014.
Heinzelmann, S. M., Chivall, D., M’Boule, D., Sinke-Schoen,D., Villanueva, L., Damsté, J. S. S., Schouten, S., and vander Meer, M. T. J.: Comparison of the effect of salinity onthe D /H ratio of fatty acids of heterotrophic and photoau-totrophic microorganisms, FEMS Microbiol. Lett., 362, fnv065,doi:10.1093/femsle/fnv065, 2015a.
Heinzelmann, S. M., Villanueva, L., Sinke-Schoen, D., SinningheDamsté, J. S., Schouten, S., and van der Meer, M. T. J.: Im-pact of metabolism and growth phase on the hydrogen isotopiccomposition of microbial fatty acids, Front. Microbiol., 6, 1–11,doi:10.3389/fmicb.2015.00408, 2015b.
Jones, A. A., Sessions, A. L., Campbell, B. J., Li, C., and Valentine,D. L.: D /H ratios of fatty acids from marine particulate organicmatter in the California Borderland Basins, Org. Geochem., 39,485–500, 2008.
Klindworth, A., Pruesse, E., Schweer, T., Peplies, J., Quast, C.,Horn, M., and Glöckner, F. O.: Evaluation of general 16S ribo-somal RNA gene PCR primers for classical and next-generationsequencing-based diversity studies, Nucleic Acids Res., 41, 1–11, doi:10.1093/nar/gks808, 2012.
Li, C., Sessions, A. L., Kinnaman, F. S., and Valentine, D. L.:Hydrogen-isotopic variability in lipids from Santa Barbara Basinsediments, Geochim. Cosmochim. Acta, 73, 4803–4823, 2009.
Ludwig, W., Strunk, O., Westram, R., Richter, L., Meier, H., Yad-hukumar, Buchner, A., Lai, T., Steppi, S., Jobb, G., Förster, W.,Brettske, I., Gerber, S., Ginhart, A. W., Gross, O., Grumann, S.,Hermann, S., Jost, R., König, A., Liss, T., Lüßmann, R., May, M.,Nonhoff, B., Reichel, B., Strehlow, R., Stamatakis, A., Stuck-mann, N., Vilbig, A., Lenke, M., Ludwig, T., Bode, A., andSchleifer, K. H.: ARB: a software environment for sequence data,Nucleic Acids Res., 32, 1363–1371, 2004.
McDonald, D., Price, M. N., Goodrich, J., Nawrocki, E. P., DeSan-tis, T. Z., Probst, A., Andersen, G. L., Knight, R., and Hugen-holtz, P.: An improved Greengenes taxonomy with explicit ranksfor ecological and evolutionary analyses of bacteria and archaea,ISMEJ, 6, 610–618, 2012.
Biogeosciences, 13, 5527–5539, 2016 www.biogeosciences.net/13/5527/2016/

S. M. Heinzelmann et al.: Fatty acid D /H ratio of coastal microbial communities 5539
Mook, W.: Estuaries and the sea, in: Volume III: Surface Water,Rozanski, K., Froehlich, K., and Mook, W. G., UNESCO, Paris,49–56, 2001.
Nichols, P. D., Guckert, J. B., and White, D. C.: Determination ofmonosaturated fatty acid double-bond position and geometry formicrobial monocultures and complex consortia by capillary GC-MS of their dimethyl disulphide adducts, J. Microbiol. Meth., 5,49–55, 1986.
Nichols, P. D., Skerratt, J. H., Davidson, A., Burton, H., andMcMeekin, T. A.: Lipids of cultured Phaeocystis pouchetii: Sig-natures for food-web, biogeochemical and environmental studiesin Antarctica and the Southern ocean, Phytochemistry, 30, 3209–3214, 1991.
Osburn, M. R., Sessions, A. L., Pepe-Ranney, C., and Spear, J.R.: Hydrogen-isotopic variability in fatty acids from YellowstoneNational Park hot spring microbial communities, Geochim. Cos-mochim. Acta, 75, 4830–4845, 2011.
Philippart, C., van Iperen, J., Cadée, G., and Zuur, A.: Long-termfield observations on seasonality in chlorophyll-a concentrationsin a shallow coastal marine ecosystem, the Wadden Sea, Estuar.Coast., 33, 286–294, 2010.
Philippart, C. J. M., Cadee, G. C., van Raaphorst, W., and Riegman,R.: Long-term phytoplankton-nutrient interactions in a shallowcoastal sea: Algal community structure, nutrient budgets, anddenitrification potential, Limnol. Oceanogr., 45, 131–144, 2000.
Pitcher, A., Wuchter, C., Siedenberg, K., Schouten, S., and Sin-ninghe Damsté, J. S.: Crenarchaeol tracks winter blooms ofammonia-oxidizing Thaumarchaeota in the coastal North Sea,Limnol. Oceanogr., 56, 2308–2318, 2011.
Quast, C., Pruesse, E., Yilmaz, P., Gerken, J., Schweer, T., Yarza,P., Peplies, J., and Glöckner, F. O.: The SILVA ribosomal RNAgene database project: improved data processing and web-basedtools, Nucleic Acids Res., 41, D590-6, doi:10.1093/nar/gks1219,2012.
Robins, R. J., Billault, I., Duan, J.-R., Guiet, S., Pionnier, S., andZhang, B.-L.: Measurement of 2H distribution in natural prod-ucts by quantitative 2H NMR: An approach to understandingmetabolism and enzyme mechanism, Phytochem. Rev., 2, 87–102, 2003.
Rütters, H., Sass, H., Cypionka, H., and Rullkotter, J.: Phospholipidanalysis as a tool to study complex microbial communities inmarine sediments, J. Microbiol. Meth., 48, 149–160, 2002.
Sachs, J. P., Maloney, A. E., Gregersen, J., and Paschall, C.: Ef-fect of salinity on 2H / 1H fractionation in lipids from continu-ous cultures of the coccolithophorid Emiliania huxleyi, Geochim.Cosmochim. Acta, 189, 96–109, 2016.
Saito, K., Kawaguchi, A., Okuda, S., Seyama, Y., and Yamakawa,T.: Incorporation of hydrogen atoms from deuterated water andstereospecifically deuterium labeled nicotinamide nucleotidesinto fatty acids with the Escherichia coli fatty acid synthetasesystem, Biochim. Biophys. Acta, 618, 202–213, 1980.
Schloss, P. D., Westcott, S. L., Ryabin, T., Hall, J. R., Hartmann,M., Hollister, E. B., Lesniewski, R. A., Oakley, B. B., Parks, D.H., Robinson, C. J., Sahl, J. W., Stres, B., Thallinger, G. G., VanHorn, D. J., and Weber, C. F.: Introducing mothur: Open-source,platform-independent, community-supported software for de-scribing and comparing microbial communities, Appl. Environ.Microbiol., 75, 7537–7541, 2009.
Schmidt, H.-L., Werner, R. A., and Eisenreich, W.: Systematics of2H patterns in natural compounds and its importance for the elu-cidation of biosynthetic pathways, Phytochem. Rev., 2, 61–85,2003.
Schouten, S., Klein Breteler, W. C. M., Blokker, P., Schogt, N., Rijp-stra, W. I. C., Grice, K., Baas, M., and Sinninghe Damsté, J. S.:Biosynthetic effects on the stable carbon isotopic compositionsof algal lipids: Implications for deciphering the carbon isotopicbiomarker record, Geochim. Cosmochim. Acta, 62, 1397–1406,1998.
Sessions, A. L., Jahnke, L. L., Schimmelmann, A., and Hayes, J.M.: Hydrogen isotope fractionation in lipids of the methane-oxidizing bacterium Methylococcus capsulatus, Geochim. Cos-mochim. Acta, 66, 3955–3969, 2002.
Sintes, E., Witte, H., Stodderegger, K., Steiner, P., and Herndl, G. J.:Temporal dynamics in the free-living bacterial community com-position in the coastal North Sea, FEMS Microbiol. Ecol., 83,413–424, 2013.
Sørensen, N., Daugbjerg, N., and Richardson, K.: Choice of poressize can introduce artefacts when filtering picoeukaryotes formolecular biodiversity studies, Microb. Ecol., 65, 964–968,2013.
Valentine, D. L., Sessions, A. L., Tyler, S. C., and Chidthaisong,A.: Hydrogen isotope fractionation during H2 /CO2 acetogene-sis: hydrogen utilization efficiency and the origin of lipid-boundhydrogen, Geobiology, 2, 179–188, 2004.
Werner, J. J., Koren, O., Hugenholtz, P., DeSantis, T. Z., Walters,W. A., Caporaso, J. G., Angenent, L. T., Knight, R., and Ley, R.E.: Impact of training sets on classification of high-throughputbacterial 16s rRNA gene surveys, ISMEJ, 6, 94–103, 2012.
Zhang, X. N., Gillespie, A. L., and Sessions, A. L.: Large D /Hvariations in bacterial lipids reflect central metabolic pathways,P. Natl. Acad. Sci. USA, 106, 12580–12586, 2009a.
Zhang, Z. and Sachs, J. P.: Hydrogen isotope fractionation infreshwater algae: I. Variations among lipids and species, Org.Geochem., 38, 582–608, 2007.
Zhang, Z., Sachs, J. P., and Marchetti, A.: Hydrogen isotope frac-tionation in freshwater and marine algae: II. Temperature and ni-trogen limited growth rate effects, Org. Geochem., 40, 428–439,2009b.
www.biogeosciences.net/13/5527/2016/ Biogeosciences, 13, 5527–5539, 2016