seasonal and hydrological control of phytoplankton
TRANSCRIPT

MARINE ECOLOGY PROGRESS SERIES Mar. Ecol. Prog. Ser.
Published September 11
Seasonal and hydrological control of phytoplankton nutrient limitation in the lower
Neuse River Estuary, North Carolina
Joseph Rudek, Hans W. Paerl, Michael A. Mallin, Paul W. Bates
Institute of Marine Sciences. University of North Carolina at Chapel Hill, 3407 Arendell Street, Morehead City, North Carolina 28557, USA
ABSTRACT: Nutrient limitation of phytoplankton production was assessed monthly from 1987 through 1990 in the lower Neuse River Estuary, North Carolina, USA, a well-mixed, mesotrophic system. Nutrient addition bioassays indicated that the lower estuary experienced a general state of nitrogen limitation, with especially pronounced limitation during summer months, a period of high phytoplank- ton productivity. Bioassays conducted during spring months showed significantly greater stimulation of algal productivity with the addition of nitrogen and phosphorus than that found with nitrogen addition alone. This CO-stimulation occurred during periods when surface-water dissolved inorganic nitro- gen : dissolved inorganic phosphorus ratios were elevated above typical values of < 5. Seasonal patterns in ambient nutrient concentrations revealed nitrogen maxima associated with spring, fall, and winter runoff events, with summer minima Hydrologically driven nitrogen loading exerted a strong, year- round influence on primary production and nutrient limitation characteristics. High-flow events acted to oversaturate the upper estuarine nutrient filtering capacity, resulting in increased delivery of nitrogen to the lower estuarine environment. The phytoplankton community responded to increased flow and concomitant nutrient loadings by increasing production and b~omass levels, often very rapidly. In this regard, hydrologic factors influencing nitrogen loading (terrigenous runoff, point source inputs, and wet and dry atmospheric deposition) are key determinants of the trophic state of this estuary.
INTRODUCTION
The Neuse River Estuary comprises the southern- most part of the Albemarle-Pamlico estuarine system (APES), by area the second largest estuarine system in the continental United States (Epperly & Ross 1986). Draining 12 % of North Carolina, the Neuse River watershed stretches over 16 000 km2, two-thirds of which is wetlands and forests (Christian et al. 1991). Despite the largely rural location of its drainage basin, the APES is receiving ever-increasing loads of both nitrogen and phosphorus as North Carolina's agricul- tural, industrial and urban sectors grow and diversify. Annual loading of total nitrogen and total phosphorus to the Neuse River has been estimated to have increased by about 60 to 70% over the past century (Stanley 1988). Most of this increase has occurred du- ring the past 40 yr, largely due to increased effluent from point source discharges. The Neuse River has experienced a 650% increase in sewage treatment plant discharge since 1950 and now carries the greatest
O Inter-Research/Pnnted in Germany
total wastewater flow of any river in the state, averag- ing 200 million gallons (7.6 X 10⁵ m3) per day (US Geological Survey 1990).
Current N and P loading has resulted in periods of very high phytoplankton biomass in the freshwater portion of the Neuse River, including periodic blooms of the toxic blue-green alga Microcystis aeruginosa (Paerl 1987). Chlorophyll a (chl a ) concentrations ranged from winter lows of 1 to 2 pg 1-' to summer concentrations averaging around 20 kg I-', ranging as high as 1500 to 2000 pg l-' in blue-green algal surface scums (Paerl 1987).
Estuaries are generally considered sinks for dis- solved inorganic nitrogen and phosphorus (DIN and DIP), acting as filters for downstream coastal systems (Fisher et al. 1988a). Dissolved nutrients are assimi- lated by the nutrient-limited phytoplankton com- munities in the upper estuary and incorporated into particulate fractions. This filtering capability normally reduces the very high DIN and DIP concentrations in the Neuse River by as much as 2 orders of magnitude as

134 Mar. Ecol. Prog. Ser.
water flows into the lower estuary (Christian et al. 1989). However, high-flow events can exceed the filter- ing capacity and deliver large amounts of nutrients from nutrient-enriched rivers to their receiving estuaries. Winter-to-spring maxima in freshwater dis- charge, and resulting high flows, are characteristic of mid-latitude river systems (Malone e t al. 1988). In the Neuse River, 60 to 85 % of the annual N load has been reported to discharge into the estuary during high flow in late winter and early spring months (Paerl 1987, Christian et al. 1989). Similarly, in the nearby Pamlico River (Kuenzler et al. 1982) and in the Chesapeake Bay (Malone e t al. 1988), the majority of nutrient loading has been found to occur during the winter-spring high- flow periods. This winter-spring high-flow, high- nutrient-loading phenomenon, combined with increas- ing nutrient loading, may represent the greatest threat to the assimilative capacity of estuarine systems as a protective mechanism against eutrophication and associated problems (Nixon 1986, Copeland & Gray 1989, Nowiclu & Oviatt 1990).
The lower Neuse River Estuary (LNRE) was found to exhibit an annual primary productivity cycle typical of temperate estuaries: winter minima and summer maxi- ma, in concert with temperature and irradiance pat- terns (Mallin et al. 1991). However, DIN concentration was found to be strongly correlated with phytoplankton productivity, leading to off-season algal blooms coinci- dent with nitrogen input (Mallin et al. 1991). Surface- water nitrate concentrations were found to be inversely correlated with salinity, attesting to the importance of freshwater input as a nutrient loading source (Mallin et al. 1991). Here we present the results of a 3 yr study in the LNRE focusing on variations in nutrient limitation of phytoplankton primary production and biomass, and on the seasonal and hydrological factors controlling them.
The nutrient addition bioassay techniques used in this study measure limitation of the potential rate of net production (Howarth 1988). Measurement of potential net production is appropriate if the primary interest is in the effects of eutrophication. It is in this context that the term nutrient limitation is used in the present paper.
METHODS
Field trips were conducted at 1 to 1.5 mo intervals at Stns 1, 5, and 6 (Fig. l ) , located near the mouth of the LNRE. Stn 1 is at channel marker 1 at the confluence of the South River and the LNRE. Stn 5 is ca 1 km N-NE of Stn 1. Stn 6 is across the LNRE, ca 6 km N-NE, at channel marker 6, southwest of the confluence of Broad Creek and the LNRE. These stations form a transect
BOGUE' 'BEAUFORT SOUND
Fig. 1. Sampling locations (Stns 1, 5, and 6) in the lower Neuse River Estuary, North Carolina, USA
from a segment of the estuary where freshwater input from the South Rver can exert a large influence (Stn 1) to a segment more characteristic of the vast meso- to euhaline component of the APES (Stn 6).
Salinity, dissolved oxygen, temperature, and photo- synthetically active radiation (PAR, 400 to 700 nm) depth profiles were measured at each station. Salinity was measured with a YSI Model 33 salinorneter. Dis- solved oxygen and temperature were measured with a YSI Model 54 DO meter. PAR was measured with a LI- COR LI-193SB Spherical Quantum Sensor.
Surface samples were collected at all stations for measurement of dissolved nutrient content and chl a concentrations. Samples were transported on ice, in darkness, back to the Institute of Marine Sciences (IMS), where they were filtered under gentle vacuum (200 torr). Both filtrate and filters were stored frozen (-20°C) until analyses. Nutrient analyses on the filtrate included NH4+, NO3-, and P043- content, utilizing colo- rimetric techniques (Strickland & Parsons 1972). Chl a concentrations were measured on 300 m1 samples, fil- tered onto Whatman 934 AH glass fiber filters (-1 pm porosity). Chl a was extracted with 90 % acetone (MgC03-buffered), and analyzed using a trichromatic equation (Parsons et al. 1984).
Nutrient addition bioassays were conducted on water transported from Stn 6 to the IMS in 25 1 car- boys, except in December 1988 and October 1989, when Stn 5 water was used. Three Liters of sample were placed in 4 1 Cubitainers (95 % transparent to PAR) on the day of collection. The following nutrient addition treatments were conducted in triplicate: (1) control - no nutrient addition; (2) 14.3 FM No3- amendment; (3) 28.6 WM No3- amendment; (4) 14.3 pM NO3- + 3.2 PM ~ 0 ~ ~ - amendment; (5) 3.2 pM ~ 0 ~ ~ - amendment; (6) trace metals amendment, consisting of 2 yg 1-' each of

Rudek et al.: Control of nut1 -ient hmitation in an estuary 135
Fe, Mn, Cu, Zn, CO, and MO; (7) 14.3 pM NO3- + 3.2 pM P043- + trace metals amendment. A 10 pCi aliquot of 14C-NaHC03 was added to each Cubitainer to allow measurement of photosynthetic 14C02 assimi- lation as an estimator of microalgal growth (Paerl 1983). A silica amendment (1.5 pg I-') was substituted for the trace metals amendment [Treatment (6) above] in bioassays from April 1989 through October 1989.
Cubitainers were floated in a 1 m deep cement pond at IMS. Bogue Sound water was pumped through the pond to maintain ambient water temperatures. For 4 d , daily subsamples were collected for chl a and '*C con- tent. Chl a was measured as above. Assimilation of I4CO2 was measured on 50 m1 subsamples filtered through Whatman 934 AH glass fiber filters. Filters were fumed with HC1 vapors for 30 min to remove abiotically precipitated I4C, dried, and treated with Ecolume fluor. I4C content was determined using a liquid scintillation counter (Beckman TD 5000 or LS 7000).
Statistical analyses of bioassay data were performed on the 4 d average of each replicate. An ANOVA pro- cedure with an LSD multiple comparison technique (SAS/STAT 1987, Day & Quinn 1989) was conducted to determine significance of difference between treat- ments (a = 0.05) within each bioassay experiment.
To facilitate display of the bioassay data set (see Figs. 4 & 5), biomass stimulation (estimated as chl a minus control) and primary productivity stimulation (estimated as 14C assimilation minus control) were averaged for each treatment over the 4 d of each bio- assay. Plotted error bars for bioassay biomass stimula- tion (see Fig.4) and primary productivity stimulation (see Fig. 5) represent pooled sample standard errors of the mean.
RESULTS
The LNRE (Stns 1, 5, and 6; Fig. 1) typified a shallow, temperate estuary during the 1987-1990 study period. Low winter temperatures ranged from 3 to ?'C and high summer temperatures were near 29 "C.
Maximum salinities occurred during the winters of 1987-88 (19 ppt) and 1988-89 (21 ppt) and during late summer and fall 1990 (19 ppt) (Fig. 2). Minimum salinities generally occurred in spring (12 ppt in 1988, 5 ppt in 1989,6 ppt in 1990). Variations in salinity were strongly dependent on river flow (Fig. 2) and local rainfall (measured at IMS; Fig.2), although winds are very important in moving water in and out of this estuary (Wells & Kim 1989). Winds out of the north to west tend to push mesohaline Pamlico Sound water into the estuary, while winds out of the south to east tend to move water out of the estuary, allowing
NEUSE RIVER
----
- 2 5 0 E E - 200 J a
1 5 0 5 CL 100
50
0 N D I F M A M J J A S O N D I F M A M J J A S O N D I F M A M J J A S O N
Fig. 2. (Top) Neuse River mean monthly flows ( X 1000 ft3 S-',
or X 28.3 m-' S-'), at the US Geological Survey gauging station in finston, North Carolina. Dashed line represents 60 yr average flow (J. D. Bales, US Dept of Interior, Geological Survey, Water Resources Division, Raleigh, North Carolina). (Middle) Surface measurements of salinity at Stns 1. 5, and 6 (see Fig. l). Continuous line represents means of stations measured. (Bottom) Monthly rainfall totals at the Institute of Marine Sciences, Morehead City, North Carolina. Dashed line represents average monthly precipitation for the southern section of the Albemarle-Pamlico estuarine system area (118.5 mm mo-') (H. Porter, University of North Carolina
Institute of Marine Sciences, Morehead City)
replacement by oligohaline Neuse River water. While hydrologic flow data are not available for the LNRE, the US Geological Survey (Raleigh regional office) pro- vided us with mean monthly flows in the Neuse River at Kinston, North Carolina (Fig. 2). Although Kinston is ca 100 km upstream of our sampling sites, discharge a t Kinston represents a major portion of the discharge into the LNRE (Christian e t al. 1989, US Geological Survey 1990).

Mar. Ecol. Prog. Ser 75: 133-142, 1991
Low monthly mean flows at Kinston prevailed from November 1987 through February 1989 (Fig. 2). Mean flow was only 53 % of the 60 yr average during this 16 mo period. This reflects the abnormally low rainfall experienced in the Neuse River watershed during this period. Monthly mean flows increased dramatically in March 1989 and continued at high rates through May 1989. In this 3 mo period, 50 % of the annual flow was discharged. Monthly mean flows subsequently decreased through summer to a low in September 1989. After September 1989, monthly mean flows gen- erally increased to moderate levels by winter. Overall mean flow in 1989 was 195% of the 60 yr average. Moderate flow continued through April 1990 and then decreased to low levels in summer 1990. Overall mean flow in 1990 (to 29 September 1990) was 129% of the 60 yr average, although 84 % of this was discharged by the end of April.
Salinity levels in the LNRE dropped sharply during the spring 1989 flood period, reflecting increased fresh- water input (Fig. 2). Low salinities during winter/early spring 1990 CO-occurred with increased monthly mean flows at Kinston, the result of heavy rainfall upstream in the Neuse River watershed. There was little precipi- tation during the remainder of 1990, and increased salinities reflected this (Fig. 2). The decrease in salinity during spring 1988 was not as great as that measured during the spring periods of 1989 and 1990 (Fig. 2). Mean monthly flows at Kinston only increased slightly during spring 1988 (Fig. 2). Increased rainfall at IMS during May and August 1988 also appeared to corres- pond with decreases in salinity (Fig. 2).
The LNRE appeared well mixed during this study. Temperature and dissolved oxygen vertical profiles revealed a general absence of stratification (data not shown). While dissolved oxygen concentrations declined with depth during some warm periods, bot- tom-water anoxia was not measured during the study period.
Ammonium concentrations, [NH,+], were generally low, with the majority of values ranging from below detection (0.07 pM) to < 3 PM. Six samples having [NH4+] values ranging from 4.7 to 8.2 1,iM were meas- ured from September 1989 to May 1990. No seasonal- ity or hydrologically related patterns were detected (Fig. 3). Nitrate concentrations, [NO3-], were generally low, with concentrations ranging from below detection (<0.05 yM) to ca 1.2 yM (Fig. 3). Relatively higher [NO3-] (0.3 to 11.4 pM) were measured coincident with high flow in spring 1989, in late September 1989, and again in January, February and May 1990 (Figs. 2 & 3).
DIP concentrations, [PO,"], seemed to vary on a seasonal basis but also showed dependence on hydro- logic conditions. The general seasonal pattern observed was one of very low from late winter
N D J F M A M J J A S O N D J F M A M J J A S O N D J F M A M J J A S O N 1987 1988 1989 1990
Fig. 3. Nitrate, ammonium, and phosphate concentrations in surface waters at Stns 1, 5, and 6 (see Fig. 1). Continuous line
represents means among stations
through spring, increasing to higher levels from sum- mer through fall. Summer maximum were higher in 1989 and 1990 (3.9 and 3.8 ,uM respectively) when compared to those in summer 1988 (2.9 PM). In winter 1989-90, however, hydrologic factors overrode the seasonal influences on [PO,~-]. The [PO,~-] meas- ured in December 1989 was the highest measured over the entire study period (8.2 pM). High [ P O ~ ~ - ] continued in January and February 1990, ranging from 1.5 to 4.8 PM. During spring and summer 1990 the seasonal [pod3-] pattern was re-established, with typi- cal spring lows and summer highs.
Bioassay results indicated that nitrogen availability was clearly a dominant factor controlling phytoplank- ton production and biomass. Algal biomass and pri- mary production were strongly stimulated (p < 0.05) by the addition of NO3- (when compared to controls in

Rudek et al.. Control of nutrient limitation in an estuary
individual bioassay experiments) in spring, summer and fall (Figs. 4 & 5). In bioassays conducted from July through October 1988, 1989, and 1990, addition of 28.6 yM NO3- resulted in increased stimulation of bio- mass and primary production (p < 0.05) when com- pared to the lower 14.3 +M NO3- addition treatments, indicating more severe constraints on nitrogen avail- ability during these months.
During the winter and early spring months between November 1987 and May 1989, NO3- additions con- tinued to stimulate biomass and primary production
DJFMAMJ JASONDJFMAMJ J A S O NDJFMAMJ J A S O 5 0 - : n : : : : : ' : : : : ; ' : : : : : ' ; : : ; ! ; : : : : : a : ~ :
X D i i
0 I I , A
.-m
NDJ F M A M J JASONDJFMAMJ J A S O N D J F M A M J J A S O N
1987 1988 1989 1990 ERROR RARS=POOLED SAMPLE SEM (n.3)
Fig. 4. (Top and middle) Chlorophyll a concentration of selected nutrient addition treatments minus controls, aver- aged over the 4 d of each bioassay. N(14.3) and N(28.6) respectively indicate addition of 14.3 and 28.6 vm NO3- P(3.2) indicates addition of 3.2 pm P O , ~ - . Error bars not visible are smaller than symbol. (Bottom) Dissolved inorganic nitro- gen . dissolved inorganic phosphorus (DIN : DIP) ratio (by
atoms). No error bars plotted
ERROR BARS-POOLED SAMPLE SEM (n=J)
Fig. 5. (Top and middle) 14C assimilation of selected nutrient addition treatments minus controls, averaged over the 4 d of each bioassay. Symbols as in Fig. 4. (Bottom) Nitrate, ammonium, and phosphate concentrations in surface waters at Stn 6 (see Fig. 1). Data are compiled from Fig. 3 and pre-
sented here for comparative purposes
(p < 0.05, except in December 1988 and March 1989), though less so than during respective summer and fall months. High NO3- additions during these winter and spring months showed no additional stimulation of biomass and primary production when compared to the low NO3- addition treatment.
During the winter and early spring months of 1989-90, however, high NO3- additions continued to yield additional stimulation of biomass (p < 0.05) when compared to lower NO3- addition (except in December). Stimulation of primary production by the low NOs- addition appeared greater in winter 1989-90 when compared to the previous 2 winters, but no addi-
Mar. Ecol. Prog. Ser. 75: 133-142, 1991
tional stimulation in response to the high NO3- addi- tion was detected.
Addition of P043- alone stimulated primary produc- tion relative to controls (p < 0.05) in only 1 bioassay (March 1989), but failed to enhance biomass relative to controls, when averaged over the 4 d bioassay period (Figs. 4 & 5). However, during the spring months of 1988, 1989 and 1990 when P043- was added together with NO3-, biomass and primary production were stimulated over levels found when NO3- was added alone (p < 0.05). The CO-stimulation of phytoplankton biomass and production by N and P appeared to be associated with periods of relatively high DIN: DIP ratios in the water column (Fig. 4), which occurred during spring months.
Trace metals, added either alone or in combination with nitrogen and phosphorus, failed to exhibit any impacts on algal growth potentials (data not shown); we therefore conclude that natural availability of these metals exceeds phytoplankton growth requirements in the LNRE.
Silica (1.5 kg 1-l) was added as a bioassay treatment from April 1989 through October 1989. Limitation of diatoms by silica depletion may occur in systems that are nutrient-enriched (Oviatt et al. 1989). Our bioassay results indicated that silica was not limiting phyto- plankton biomass or production in the LNRE, at least during spring, summer, and fall 1989.
DISCUSSION
Bioassay results suggest a nutrient limitation pattern in phase with estuarine phytoplankton biomass con- centrations and production rates. Severe nitrogen limi- tation occurred in summer when algal biomass and production were high. There was a somewhat less pronounced nitrogen limitation in fall and winter, when biomass and primary production rates were at annual minima. Nitrogen and phosphorus CO-stimulation occurred in spring. With the exception of winter 1989-90, these patterns recurred in years when flow and hence loading were low (1988), near average (1990), and high (1989).
During penods when DIN: DIP ratios were > 10, phosphorus enrichment often played a synergistic role with N in stimulating phytoplankton growth potentials (Fig. 4). Stimulation of phytoplankton biomass and productivity by N and P relative to N alone, but not by P alone, at these times was likely related to water- column [P043-] which was not far in excess of phyto- plankton demands. The [NO3-] at Stn 6 in March 1989, for example, was 4.4 yM (Fig. 5), which only neces- sitates a [P043-] of 0.3 FM to supply nutrients to the phytoplankton if we assume that requirements approx-
imated the Redfield ratio. Bioassay ~ 0 ~ ~ - enrichments were made at 3.2 FM, resulting in exhaustion of N supplied in the experimental vessels with P043- enrich- ment alone.
Other estuaries have been found to exhibit seasonal variations in nutrient limitation. In the Patuxent Rver estuary, a tributary of the Chesapeake Bay, USA, algal growth was found to be N-limited during the summer, low-flow season, and P-limited during the late winter, high-flow season (D'Elia et al. 1986). As in the LNRE, DIN: DIP ratios were elevated during P limitation. Graneli et al. (1990) also found P limitation in winter, and N limitation in spring and summer, in the coastal areas of the southern Baltic Sea. In the nearby shallow estuaries around Beaufort (Fig. l) , Thayer (1974) found that photosynthesis was limited at times by both nitro- gen and phosphorus but that nitrogen was most often the key limiting nutrient.
The nutrient addition bioassay technique is an attempt to model, on a small scale, certain functions of the ecosystem under investigation. As with all models, their relationship to the natural system has limits. In bioassays, limitations are generally related to the enclosure of a volume of water in a bottle of some kind. Bottle effects include growth of organisms on the walls of the bottle, alterations of the natural food web, and isolation of the enclosed community from lateral or sediment nutrient fluxes. Other experimental artifacts include light regimes which differ from in situ exposures, or exclusion of long-term physiological responses (Hecky & l l h a r n 1988, Howarth 1988).
While these are all valid criticisms of the methodol- ogy, it is likely that the most critical of these in the study of a system dependent on nutrient recycling are the questions raised regarding isolation from nutrient fluxes, particularly of nitrogen. Research conducted in the LNRE has suggested that nitrogen flux from the sediments supplies 10 to 50 % of phytoplankton requirements (Fisher et al. 1982, Matson et al. 1983). However, much of this flux is from short-term pulses due to rapid degradation of newly sedimented materi- als at the sediment surface (as discussed below; Fisher et al. 1982, Matson & Brinson 1990). On average, water-column nutrient recycling has been considered to be of as great or greater importance than sediment regeneration in the LNRE (Matson et al. 1983). Hetero- trophic grazing is considered an important pathway in water-column nutrient recychng. In the present study, zooplankton were contained in the water used to fill the bioassay Cubitainers and were readily visible in filter towers as subsamples were concentrated onto filters. The principal crustacean grazer species found in the estuarine water collected include Acartia tonsa, Para- calanus crassirostris, Oithona colcarva, Podon poly- phemoides, and Evadne nordmanni (Mallin 1991).
Rudek et al.: Control of nutrient limitation in an estuary 139
While we recognize that the bioassay technique used included unavoidable experimental artifacts, we believe that the presented results reflect an accurate assessment of the limitation of the potential rate of net production, the stated goal of these experiments. This conclusion is supported by the complimentary nature of the bioassay results and the field and productivity results also discussed in this report, and in Mallin et al. (1991) and Paerl et al. (1990).
The LNRE exhibited an underlying pattern of sum- mer productivity peaks which were associated with the contemporaneous interaction of increased light and water temperature (Mallin et al. 1991). Additional pro- ductivity peaks in any season of a given year can be stimulated by nitrogen loading pulses, which, in turn, are driven by meteorological/hydrological forcing in the form of increased rainfall and subsequent runoff (Mallin et al. 1991). As important as these high-flow events were to nutrient delivery, disruptions were rela- tively short-lived (1 to 3 mo), as seasonal patterns of phytoplankton biomass, primary production, and sur- face-water nutrient concentrations were subsequently re-established.
The impact and duration of hydrologically driven nutrient loading in the LNRE is best illustrated by
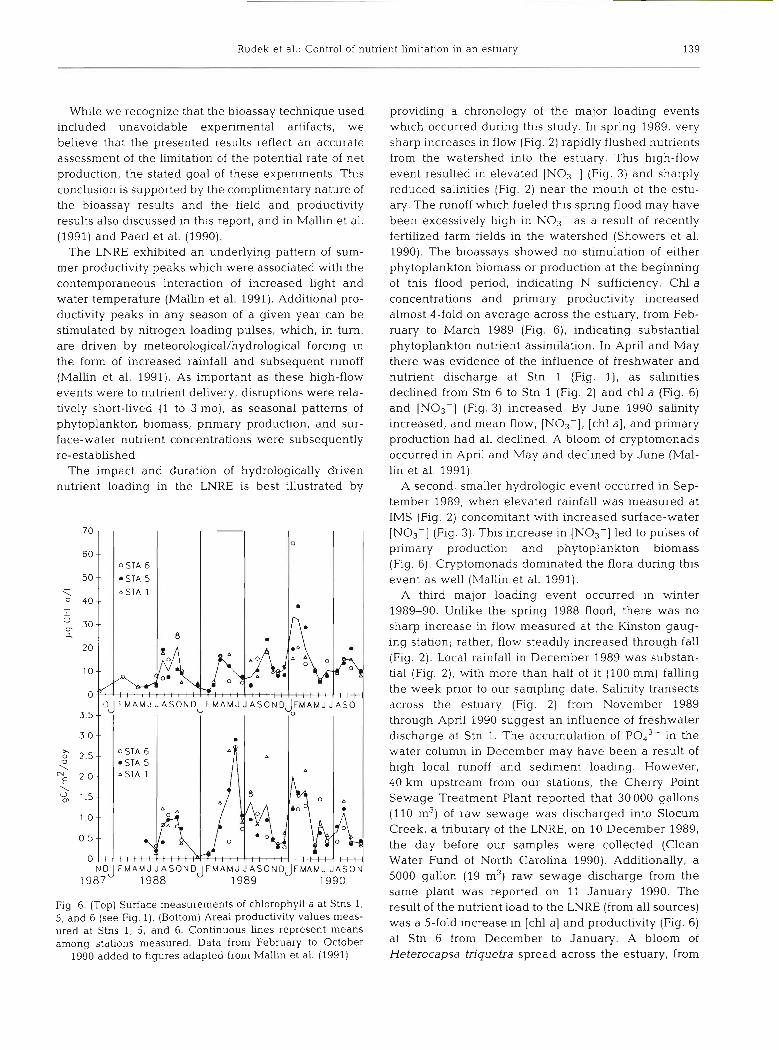
Fig. 6. (Top) Surface measurements of chlorophyll a at Stns 1, 5, and 6 (see Fig. 1). (Bottom) Area1 productivity values meas- ured at Stns 1, 5, and 6. Continuous lines represent means among stations measured. Data from February to October
1990 added to figures adapted from Mallin et al. (1991)
providing a chronology of the major loading events which occurred during this study. In spring 1989, very sharp increases in flow (Fig. 2) rapidly flushed nutrients from the watershed into the estuary. This high-flow event resulted in elevated [NO3-] (Fig. 3) and sharply reduced salinities (Fig. 2) near the mouth of the estu- ary. The runoff which fueled this spring flood may have been excessively high in NOs- as a result of recently fertilized farm fields in the watershed (Showers et al. 1990). The bioassays showed no stimulation of either phytoplankton biomass or production at the beginning of this flood period, indicating N sufficiency. Chl a concentrations and primary productivity increased almost 4-fold on average across the estuary, from Feb- ruary to March 1989 (Fig. 6), indicating substantial phytoplankton nutrient assimilation. In April and May there was evidence of the influence of freshwater and nutrient discharge at Stn 1 (Fig. l), as salinities declined from Stn 6 to Stn 1 (Fig. 2) and chl a (Fig. 6) and [NO3-] (Fig. 3) increased. By June 1990 salinity increased, and mean flow, [NO3-], [chl a], and primary production had all declined. A bloom of cryptomonads occurred in April and May and declined by June (Mal- lin et al. 1991).
A second, smaller hydrologic event occurred in Sep- tember 1989, when elevated rainfall was measured at IMS (Fig. 2) concomitant with increased surface-water [NO3-] (Fig. 3). This increase in [NO3-] led to pulses of primary production and phytoplankton biomass (Fig. 6). Cryptomonads dominated the flora during this event as well (Mallin et al. 1991).
A third major loadmg event occurred in winter 1989-90. Unlike the spring 1988 flood, there was no sharp increase in flow measured at the Kinston gaug- ing station; rather, flow steadily increased through fall (Fig. 2). Local rainfall in December 1989 was substan- tial (Fig. 2), with more than half of it (100 mm) falling the week prior to our sampling date. Salinity transects across the estuary (Fig. 2) from November 1989 through April 1990 suggest an influence of freshwater discharge at Stn 1. The accumulation of P043- in the water column in December may have been a result of high local runoff and sediment loading. However, 40 km upstream from our stations, the Cherry Point Sewage Treatment Plant reported that 30 000 gallons (110 m3) of raw sewage was discharged into Slocum Creek, a tributary of the LNRE, on 10 December 1989, the day before our samples were collected (Clean Water Fund of North Carolina 1990). Additionally, a 5000 gallon (19 m3) raw sewage discharge from the same plant was reported on 11 January 1990. The result of the nutrient load to the LNRE (from all sources) was a 5-fold increase in [chl a] and productivity (Fig. 6) at Stn 6 from December to January. A bloom of Heterocapsa triquetra spread across the estuary, from
Mar. Ecol. Prog. Ser 75: 133-142, 1991
Stn 6 in January to Stns 1 and 5 in February (Mallin et al. 1991). By April and May, [chl a] decreased to levels observed during the previous 2 springs.
The bioassays showed a progression from severe N limitation in fall 1989 (high NO3- stimulation) to no stimulation in December (loading event), to N limita- tion during the bloom, and to N and P CO-stimulation of the algal community in April and May, after the bloom declined. The phytoplankton community in April and May may have been dependent on nutrients regener- ated from the organic matter previously sedimented to the bottom as a result of the bloom decline in March. While no decline in bottom-water dissolved oxygen was detected during this period, there are several lines of evidence to suggest heterotrophic nutrient remin- eralization. The DIN: DIP ratio (Fig. 4) in May 1990 was 13.2, close to the Redfield ratio for phytoplankton and therefore expected if remineralization were operating. Additionally, [NH4+] showed an increase in May 1990 at all stations (Fig. 3), suggesting that ammonification rates were high. After a bloom decline and rapid sedimentation in the Aarhus Bight, Denmark, Jensen et al. (1990) measured a sharp 7.5- fold increase in NH4+ sediment flux, which lasted ca 1 mo. Bottom waters remained oxic during reminerali- zation in the Aarhus Bight but did decline to 60 % saturation. Interestingly, Jensen et al. (1990) also sug- gested that an increase in denitrification may have accompanied the remineralization of the sedimented bloom. The soft, gel-like muds found in the LNRE are indicative of rapid-sedimentation environments (Wells & Kirn 1989). Work done by Benninger & Martens (1983) and Matson et al. (1983) suggests rapid remineralization of sedimented organic matter in the LNRE, with little or no sediment accumulation. Lastly, the N + P CO-stimulation observed in the bioassays preferentially stimulated algal production, showing less stimulation of biomass. This is indicative of a com- munity dependent on nutrient recycling, fixing carbon with little net gain in biomass. The release of nutrients from sediments has been shown to be important in supplying nutrients for phytoplankton assimilation in the LNRE (Christian et al. 1991) as well as in neigh- boring estuarine systems of the APES (Stanley & Hob- bie 1977, Kuenzler et al. 1979, 1982, 1984, Fisher et al. 1982) and the Chesapeake Bay (Malone et al. 1988). Grazing can also be an important component of nu- trient recycling in algal communities dependent on regenerated nutrients (Litaker et al. 1988).
The series of events from fall 1989 through spring 1990 illustrates how the LNRE is dependent on acute loading events to supply nutrients eventually needed for chronic nutrient recycling. However, despite the inter-annual variations in hydrologic and nutrient load- ing events during our study, it is striklng how similar
phytoplankton production and biomass levels were after the high-flow season, when compared among years. The summer production and chl a levels from 1988 to 1990 were quite similar, with estuarine average ranging from 1.0 to 1.4 g C m-' d-l and from 15.4 to 20.6 vg chl a 1-' (Fig. 6). The fate of the algal biomass produced in the winter-spring floods of 1989 and 1990 is not known, although some was likely converted to increased zooplankton biomass (Mallin unpubl.).
Malone et al. (1988) have suggested that partially stratified estuaries, like the Chesapeake, are particu- larly responsive to nutrient enrichment. They found that spring flood nutrients were retained in bottom waters after the spring bloom declined, subsequently supporting a summer productivity maximum season- ally out of phase with loading. In contrast, the LNRE is well mixed. Nutrient loading, primary production, and [chl a] cycles are all in phase, perhaps suggesting a limited nutrient storage capability. Flushing of nutrients through the Chowan River (Stanley & Hobbie 1977) and the Pamlico h v e r Estuary (Harrison & Hob- bie 1974) have been recognized as important factors in preserving the water quality of those systems under large nutrient loads. Nowicki & Oviatt (1990) refuted the estuarine filter concept, suggesting that most of the N and P load to well-mixed estuaries is transported offshore as dissolved organic and particulate matter. However, the sounds of the APES have extremely limited tidal exchange with offshore waters. Wells & Kim (1989) speculated that very little sediment is likely to escape the sounds through the 3-inlet system which links the APES to the Atlantic Ocean. Given this, it would not bode well for the future of Albemarle and Pamlico Sounds if the system's tnbutary estuaries were being flushed or transporting their nutrient load as dissolved and particulate organic matter downstream. Current flow data presented by Wells & Kim (1989), however, suggest the strong potential for upstream transport of sediments in the Neuse and Pamlico River estuaries. Significant trends of increasing [chl a] in the LNRE since 1970 coupled with decreasing trends in NO3- and NH4+ plus organic nitrogen since 1980 (US Geological Survey 1990) suggest that the estuary may be retaining some of the nutrient load it is receiving through the incorporation of dissolved nutrients into the particulate fraction. An investigation of the struc- ture and function of plankton communities in the Pam- lico Sound proper would be desirable as a means of assessing trophic state and eutrophication potential, and of determining whether the sound functions as a 'catch basin'.
When considering nitrogen loading sources and their specific inputs, atmospheric wet and dry deposition should receive increased attention (Paerl 1985, Duce 1986). This source appears to be of quantitative import-

Rudek et al.: Control of nu trient limitation in an estuary 141
ance (20 to 30 % of total external N loading; Placit et al. 1986, Fisher et al. 1986, Copeland & Gray 1989). In addition, bioassay results (Paerl et al. 1990) revealed a strong stimulatory impact (on phytoplankton produc- tion) of atmospheric N deposition at natural dilution levels in LNRE. Atmospheric N inputs can occur down- streams of regions where terrigenous point and non- point N inputs are usually stripped out of the water column by upstream phytoplankton. Atmospheric sources may therefore constitute a unique source of nitrogenous nutrients in the lower estuarine and open sound components of APES (Paerl et al. 1990).
Acknowledgements. The authors thank H. Porter for rainfall data and J. D. Bales for data from the USGS Neuse h v e r at I n s t o n , NC, gauging station. Support was provided by the US EPA/State of North Carolina Albemarle Parnlico Estuarine Study (Grant No. EPA-CE 00470601); the Office of Sea Grant, NOAA, US Department of Commerce (Grant No. NA86AA-D- SG046), University of North Carolina Sea Grant College (Pro- ject RIMER-10); and the USGS/University of North Carolina Water Resource Research Institute (Project No. 20157).
LITERATURE CITED
Benninger, L. K., Martens, C. S. (1983). Sources and fates of sedimentary organic matter in the White Oak and Neuse River Estuaries. Water Resources Research Institute Report No. 194, Univ. of North Carolina, Raleigh
Christian, R. R., Boyer, J. N., Stanley, D. W. (1991). Multi-year distribution patterns of nutrients within the Neuse k v e r Estuary, North Carolina. Mar. Ecol. Prog. Ser. 71: 259-274
Christian, R. R., Rzzo, W. M., Stanley, D. W. (1989). Influence of nutrient loading on the Neuse River Estuary, North Carolina. NOAA. National Undersea Research Prog., Res. Rep. 89-2. Washington, D.C., p. 1 9 4 0
Clean Water Fund of North Carolina, N. C. Sierra Club and Neuse River Foundation (1990). Trouble on the Neuse: a review of the 23 major dischargers in the Neuse River basin. Clean Water Fund of North Carolina, PO Box 1008, Raleigh, NC, 27602
Copeland, B. J . , Gray, J. (1989). Albemarle-Pamlico Estuarine System: preliminary technical analysls of status and trends. Albemarle-Pamlico Study Report 89-13A, North Carolina Dept of Environmental Health and Natural Resources, Raleigh
Day. R. W., Quinn. G. P. (1989). Comparisons of treatment after an analysis of vanance in ecology. Ecol. Monogr. 59: 433-463
D'Elia, C. F., Sanders, J. G., Boynton, W R. (1986). Nutrient enrichment studles in a coastal plain estuary: phytoplank- ton growth in large scale, continuous cultures. Can. J. Fish. Aquat. Sci. 43: 3 9 7 4 0 6
Duce, R. A. (1986). The impact of atmospheric nitrogen, phos- phorus, and iron species on marine biological productivity. In: Buat-Menard. P. (ed.) The role of air-sea exchange in geochemical cycling. D. Reidel Publishing Co., Dordrecht, p. 497-529
Epperly, S. P,, Ross, S. W. (1986). Characterization of the North Carolina Pamlico-Albemarle estuarine complex. Technical Memorandum NMFS-SEFC-175, National Marine Fisheries Service, NOAA, Washington, D.C.
Fisher, D., Ceraso, J. , Oppenheimer, M (198813). Polluted coastal waters: the role of acid rain. Environmental Defense Fund, New York
Fisher, T R.. Carlson, P. R., Barber, R. T. (1982). Sediment nutrient regeneration in three North Carolina estuaries. Estuar. coast. Shelf Sci. 14: 101-116
Fisher, T R., Harding, L. H., Stanley, D. W., Ward, L. G. (1988a). Phytoplankton, nutrients, and turbidity in the Chesapeake, Delaware and Hudson estuaries. Estuar. coast. Shelf Sci. 27 61-93
Graneli, E., Wallstrom, K . , Larsson, U , Graneli, W., Elmgren, R. (1990). Nutrient limitation of primary production in the Baltic Sea area. Ambio 19: 142-151
Hecky, R. E., Kilham, P. (1988). Nutrient limitation of phyto- plankton in freshwater and marine environments: a review of recent evidence of the effects of enrichment. Limnol. Oceanogr. 33. 776-795
Harrison, W G. , Hobbie, J. E. (1974). Nitrogen budget of a North Carolina estuary. Water Resources Research Insti- tute Report No. 86, Univ. of North Carolina, Raleigh
Howarth, R. W. (1988). Nutrient limitation of net primary productivity in marine systems. A. Rev. Ecol. 19: 89-110
Jensen, M. H., Lomstein, E., Ssrensen, J. (1990). Benthic NH,+ and No3- flux following sedimentation of a spring phyto- plankton bloom in Aarhus Bight, Denmark. Mar. Ecol. Prog. Ser. 61: 87-96
Kuenzler, E. J . , Albert, D. B., Allgood, G S., Cabaniss, S.E., Wanat, C. G (1984). Benthic nutrient cycling in the Pam- lico k v e r . Water Resources Research Institute Report No. 215, Univ. of North Carolina, Raleigh
Kuenzler, E. J., Stanley, D. W., Koenings, J. P. (1979). Nutrient kinetics of phytoplankton in the Pamlico River, North Carolina. Water Resources Research Institute Report No. 139, Univ. of North Carolina, Raleigh
Kuenzler, E. J . , Stone, K. L., Albert, D. B. (1982). Phytoplank- ton uptake and sediment release of nitrogen and phos- phorus in the Chowan k v e r , North Carolina. Water Resources Research Institute Report No. 186, Univ. of North Carolina, Raleigh
Litaker, W., Duke, C. S., Kenney, B. E., Ramus, J. (1988). Die1 chl a and phaeopigment cycles in a shallow tidal estuary: potential role of microzooplankton grazing. Mar Ecol. Prog. Ser 47 259-270
Mallin, M. A. (1991). Zooplankton abundance and community structure in a mesohaline North Carolina estuary. Estuaries 32: 609-623
Mallin, M. A., Paerl, H. W., Rudek, J. (1991). Seasonal phyto- plankton composition, productivity, and biomass in the Neuse River Estuary, North Carolina. Estuar coast. Shelf Sci. (in press)
Malone, T C., Crocker, L. H., Pike, S. E.. Wendler, B. M'. (1988). Influences of river flow in the dynamlcs of phyto- plankton production in a partially stratified estuary. Mar. Ecol. Prog. Ser 48: 235-249
Matson, E. A., Brinson, M. M. (1990). Stable carbon isotopes and the C : N ratio in the estuaries of the Pamlico and Neuse Rivers. North Carolina. Limnol. Oceanogr. 35: 1290-1300
Matson, E. A., Brinson, M. M, , Cahoon, D. D.. Davis, G. J. (1983). Biogeochemistry of the sediments of the Pamlico and Neuse h v e r Estuaries, North Carolina. Water Resour- ces Research Institute Report No. 191. Univ. of North Carolina, Raleigh
Nixon. S. W. (1986). Nutrient dynamics and the productivity of marine coastal waters. In: Halwagy, R., Clayton, D.. Behbehani, M. (eds.) Marine environment and pollution. The Alden Press, Oxford, p. 97-1 15

Mar. Ecol. Prog. Ser. 75: 133-142, 1991
Nowick, B. L., Oviatt, C. A. (1990). Are estuaries traps for anthropogenic nutrients? Evidence from estuarine meso- cosms. Mar. Ecol. Prog. Ser. 66: 131-146
Oviatt, C. A., Lane, P., French, F., Donaghay, P. (1989). Phyto- plankton species and abundance in response to eutrophi- cation in coastal marine mesocosms. J. Plankton Res. 11. 1223-1244
Paerl, H. W. (1983). Factors regulating nuisance blue-green algal bloom potentials in the lower Neuse River, N.C. Water Resources Research Institute Report No. 188, Univ. of North Carolina, Raleigh
Paerl, H. W. (1985). Enhancement of marine primary produc- tion by nitrogen-ennched acid rain. Nature. Lond. 316: 747-749
Paerl, H. W. (1987). Dynamics of blue-green algal (M~crocystis aeruginosa) blooms in the lower Neuse River: causative factors and potential controls. Water Resources Research Institute Report No. 229, Univ. of North Carolina, Raleigh
Paerl, H. W., Mallin, M. A., Rudek, J., Bates, P. W. (1990). The potential for eutrophication and nulsance algal blooms in the lower Neuse h v e r Estuary. Albemarle-Pamlico Estuarine Study Project No. 90-15. North Carolina Dept. of Natural Resources and Community Development, Raleigh
Paerl, H. W., Rudek, J., Mallin, M. A. (1990). Stimulation of phytoplankton production in coastal waters by natural rainfall inputs: nutritional and trophic implications. Mar. Biol. 107: 247-254
Parsons, T. R., Maita, Y., Lalll, C. M. (1984). A manual of chemical and biological methods for seawater analysis. Pergamon Press, New York
Placit, M., Streets, D. G., Williams, E. R. (1986). Environmental trends associated with the 5th National Energy Policy Plan.
This article was presented by G. W. Thayer, Beaufort, N. Carolina, USA
Prepared for Argonne National Laboratory. ANL-EES-TM- 323. National Acid Precipitation Assessment Program, Washington, D.C.
SAS/STAT (1987). Guide for personal computers. 6th edn. USA SAS Institute, Inc., Cary, North Carolina
Showers, W. J., E~senste~n. D. M., Paerl, H. W., Rudek, J. (1990). Stable isotope tracers of nitrogen sources to the Neuse River, North Carolina. Water Resources Research Institute Report No. 253, Univ. of North C a r o h a , Raleigh
Stanley, D. W. (1988). Historical trends in nutrient loading to the Neuse River Estuary, North Carolina. In: Lyke, W. H., Hoban. T. J. (eds.) Proc. symposium on coastal water resources. American Water Resources Association, Wil- mington, p. 155-164
Stanley, D. W., Hobbie, J. E. (1977). Nitrogen cycling in the Chowan fiver. Water Resources Research Institute Report No. 121, Univ. of North Carolina, Raleigh
Strickland, J. D., Parsons, T. R. (1972). A practical handbook of seawater analysis, 2nd edn. Bull. Fish. Res. Bd Can. 167: 1-310
Thayer, G. W. (1974). Identity and regulation of nutrients limiting phytoplankton production in the shallow estuaries near Beaufort, N.C. Oecologia (Berl.) 14: 75-92
US Geological Survey (1990). Water-quahty trends and basin activities and characteristics for the Albemarle-Pamlico estuarine system, North Carolina and Virginia. APES Report no. 89-11. U.S. Geolog~cal Survey Open-file Report 90-398 NC Dept of Environmental Health and Natural Resources, Raleigh
Wells, J. T., k m , S. (1989). Sedimentation in the Albemarle- Pamlico lagoonal system: synthesis and hypothesis. Mar. Geol. 88: 263-284
Manuscript first received: February 22, 1991 Revised version accepted: May 28, 1991