searching for em counterparts to gravitational waves with ... · grb 161228b/ iptf17cw follow-up of...
TRANSCRIPT

Searching for EM Counterparts to Gravitational Waves with the Fermi Gamma-ray Burst Monitor
Adam GoldsteinUniversities Space Research Association
On behalf of the Fermi GBM Science Team

The Fermi Gamma-ray Burst Monitor
2
Large Area Telescope (LAT 30 MeV -> 300 GeV
Gamma-ray Burst Monitor (GBM) NaI and BGO Detectors
8 keV -> 40 MeV
KEY FEATURES • Huge field of view
–whole unocculted sky at any time (~70%)
•Operating nearly continuously (85%)
• Low detection dead time 2.6 μs
•GBM+LAT: Total of >7 energy decades!
Goals of sub-threshold targeted search in GBM
• Un-triggered events likely to be low counts, need to dig into Gaussian noise (use multiple detectors, full spectrum)
• Exploit information from GW (timing and sky location)
• Be able to characterize result (automated analysis, model)
6
The axes of the NaI detectors are oriented such that the positions of GRBs can be derived
from the measured relative counting rates, a technique previously employed by Konus
and BATSE. A table of the direction angles of the NaI crystals in spacecraft coordinates
are given in Table 1. The zenith angle is measured from the spacecraft +Z axis,
(nominally aligned with the maximum effective area of the LAT), and the azimuth is
measured clockwise from the +X (sun-facing) side of the spacecraft. The locations and
orientations of the detectors are illustrated in Figure 4.
Detector ID # Azimuth (deg) Zenith (deg.)
0 45.9 20.6
1 45.1 45.3
2 58.4 90.2
3 314.9 45.2
4 303.2 90.3
5 3.4 89.8
6 224.9 20.4
7 224.6 46.2
8 236.6 90.0
9 135.2 45.6
10 123.7 90.4
11 183.7 90.3
Table 1. NaI detector measured orientations in spacecraft coordinates (see Fig. 4)
Figure 4. Locations and orientations of the GBM detectors.

Why GBM? Short GRBs, of course!
Short GRBs -> NS-NS, NS-BH
GBM: ~40 triggered short GRBs/year
potentially ~30-40 sub-threshold
(Swift: ~9 short GRBs/year)
~0.2-200 BNS/year within 200 Mpc
(unknown collimation)
– 19 –
0
50
100
150
Num
ber o
f bur
sts
0
50
100
150
Num
ber o
f bur
sts
0.01 0.10 1.00 10.00 100.00 1000.00T50 [s]
0
50
100
150
Num
ber o
f bur
sts
0
50
100
150
Num
ber o
f bur
sts
0.01 0.10 1.00 10.00 100.00 1000.00T90 [s]
Fig. 5.— Distribution of GRB durations in the 50–300 keV energy range. The upper plot shows
T50 and the lower plot shows T90.
~17% of GRBs detected by GBM
3
Short GRB/CBC Association
4
SGRB / CBC association
NASA and A. Feild (STScI)
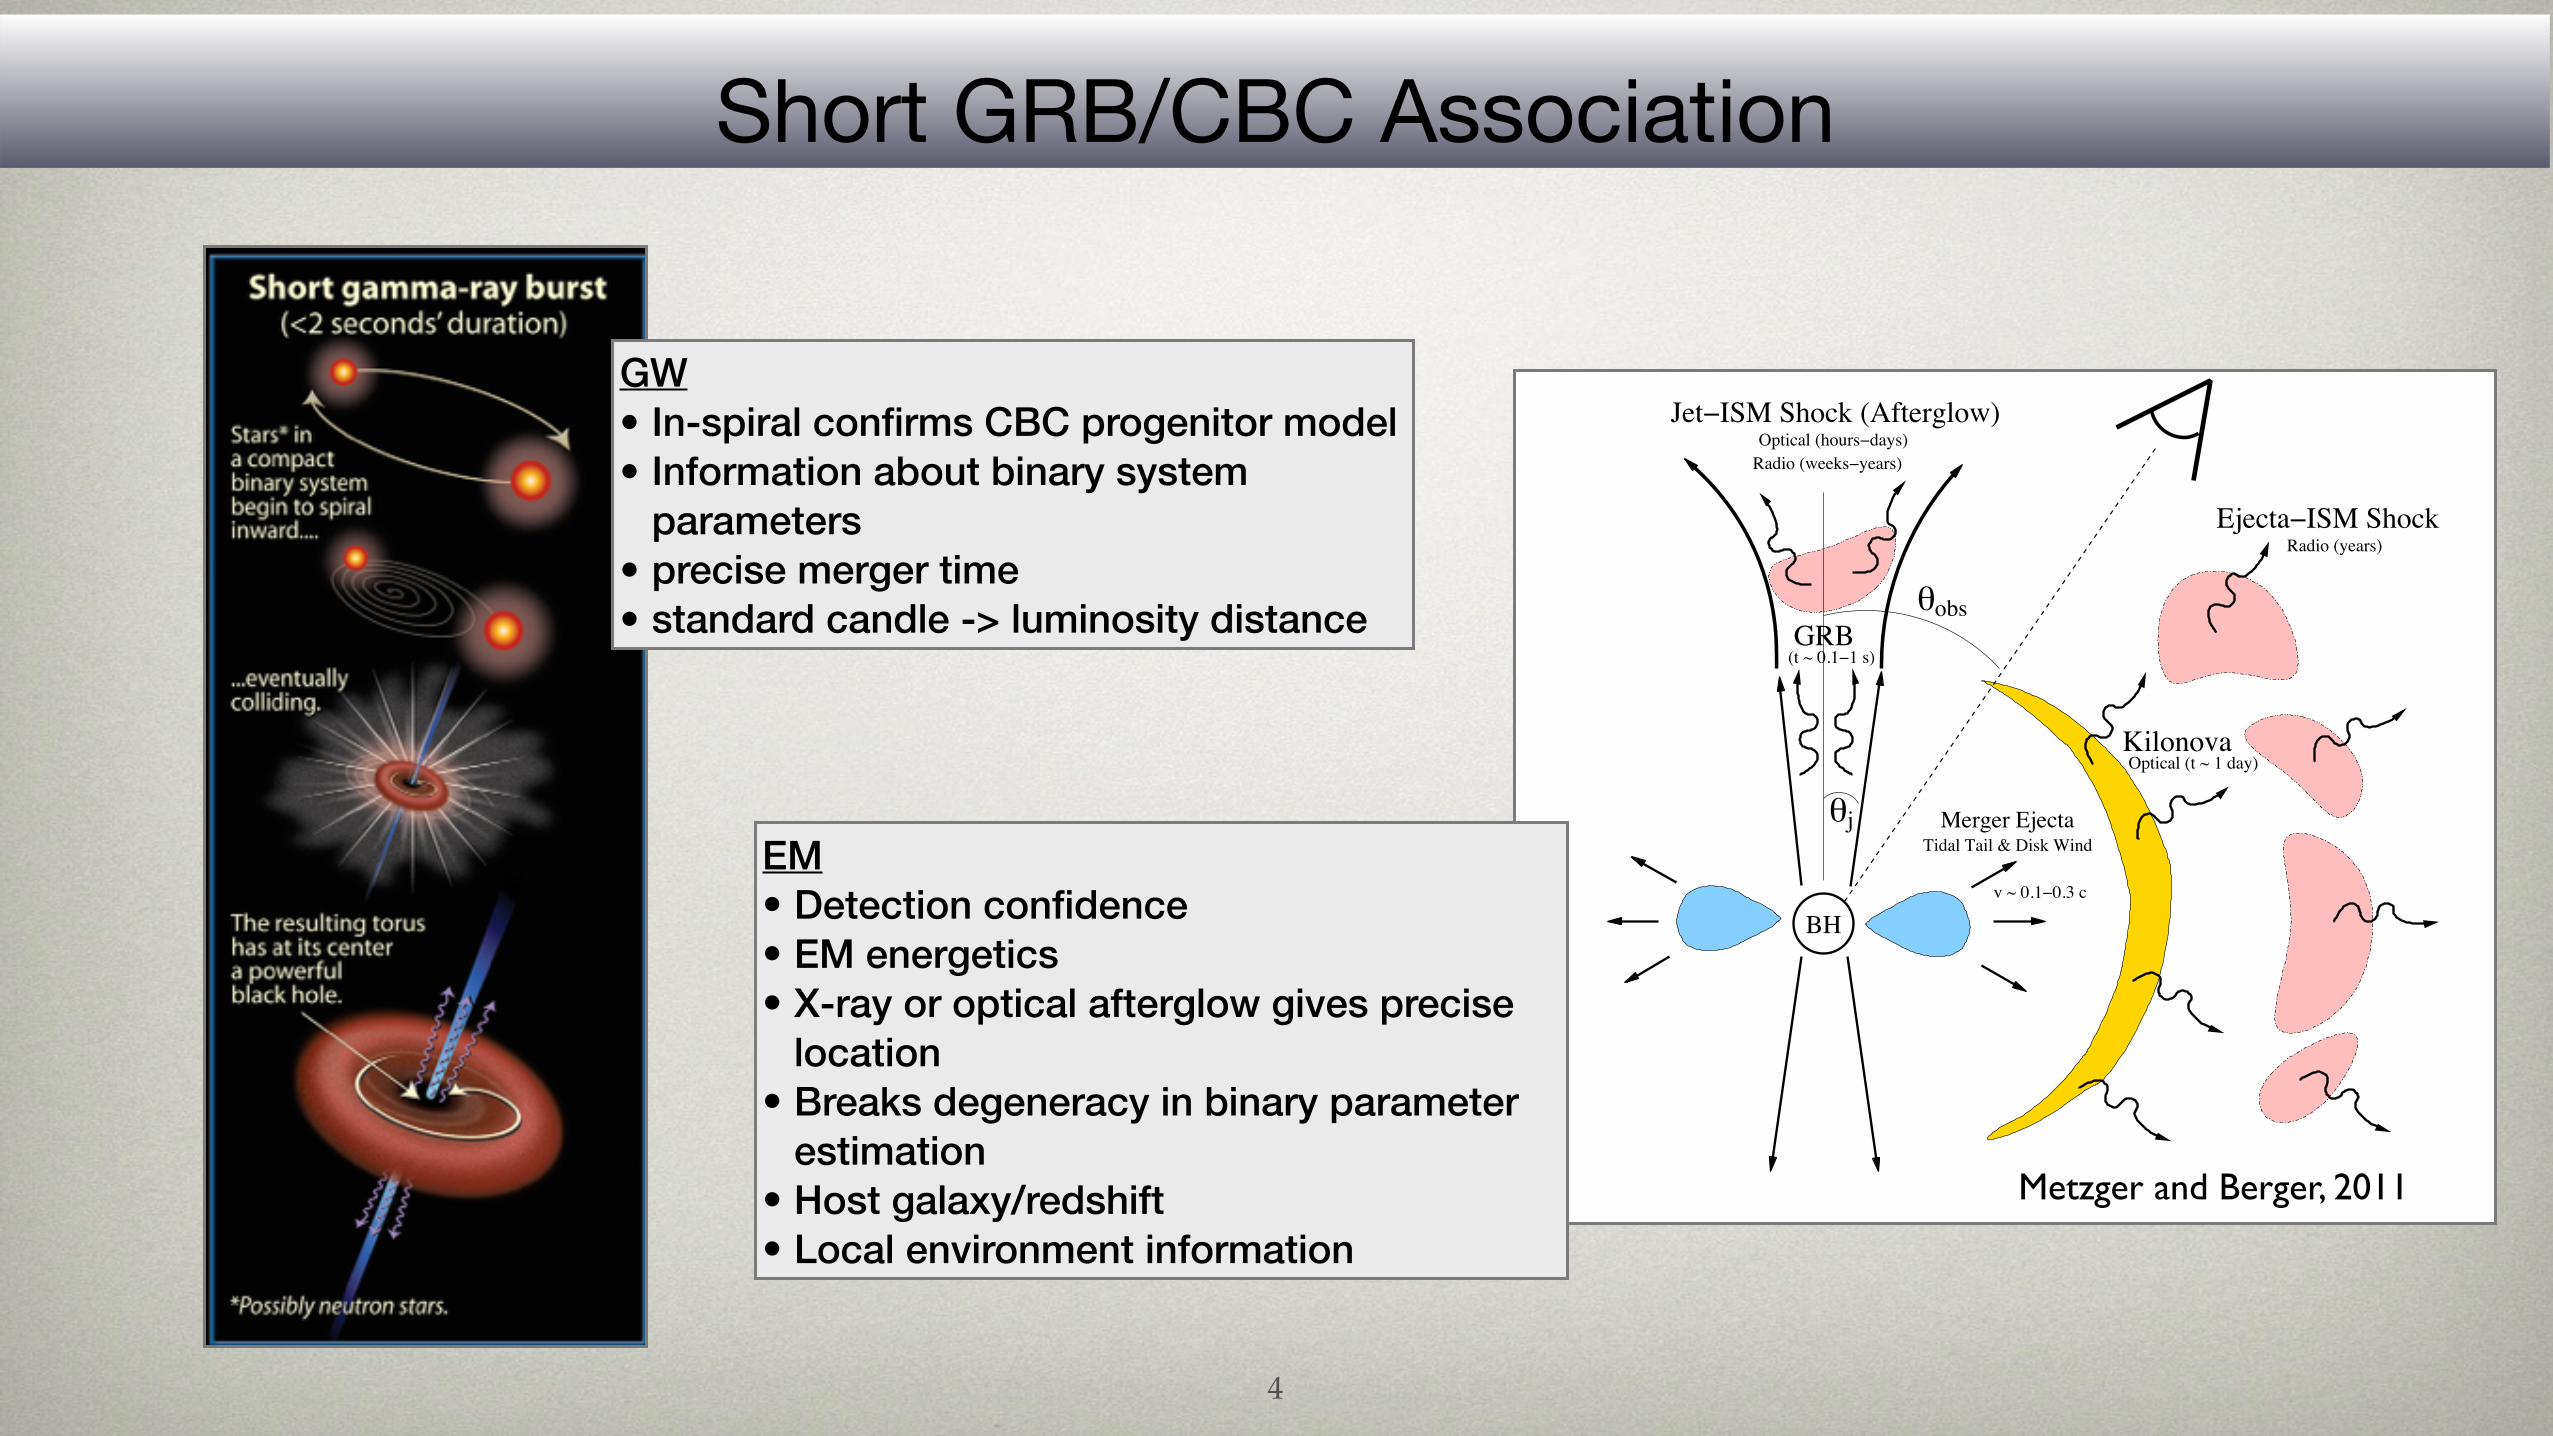
NS-NS merger is a leading candidate for SGRB progenitor‣ Expect coincident SGRB+GW observation for nearby events
Synergy between GW and EM observation:!GW‣ inspiral signature confirms compact binary coalescence (CBC)
progenitor model‣ information about binary system parameters‣ precise merger time‣ standard candle → luminosity distance!
EM‣ detection confidence‣ EM energetics‣ x-ray or optical afterglow gives precise location‣ breaks degeneracies in binary parameter estimation‣ host galaxy / redshift‣ local environment
SGRB emission
BH
eobs
ejTidal Tail & Disk Wind
EjectaïISM Shock
Merger Ejecta
v ~ 0.1ï0.3 c
Optical (hoursïdays)
KilonovaOptical (t ~ 1 day)
JetïISM Shock (Afterglow)
GRB(t ~ 0.1ï1 s)
Radio (weeksïyears)
Radio (years)
optical off-axisθobs = 2θj
x-ray
Camp et al, 2013
Metzger and Berger, 2011
Metzger and Berger, 2011
HETE
LSST
ISS-Lobster
EM • Detection confidence • EM energetics • X-ray or optical afterglow gives precise
location • Breaks degeneracy in binary parameter
estimation • Host galaxy/redshift • Local environment information
GW • In-spiral confirms CBC progenitor model • Information about binary system
parameters • precise merger time • standard candle -> luminosity distance

What Does GBM See?
5
GBM$Trigger$History$Lots of stuff (aside from GRBs)
Terrestrial Gamma-ray Flashes Solar Flares
Soft Gamma Repeaters
X-ray Binaries

GRB 161228B/ iPTF17cw
Follow-up of GBM GRBs
• 8 detections by iPTF from 35 follow-ups (campaign during 2013-2014)• 2 confirmed Master OT counterparts found from the ground automated location• iPTF17cw found searching for EM counterpart to GW170104 — Core-Collapse SN likely to
be associated with GRB 161228B (a GBM trigger!) with very interesting properties. FAR estimated to be ~1 per 2 years.
Example: GRB 140620A
6
Singer+ 2015, ApJL, 806, 52 Corsi+ 2017, arXiv:1706.00045

GBM Offline Searches
7
• GBM Un-targeted Search (Michael S. Briggs) • Developed to find un-triggered short GRBs (below triggering threshold)• Improved spline background can also find some un-triggered long GRBs• Uses all 12 NaI detectors and flags candidates that meet a pre-defined count rate threshold in
“legal” detector pairs in 50-300 keV• Follow-up vetting using the standard GBM localization technique• Fast, efficient, runs over a complete hour of data as it is downlinked• Can trigger follow-up observations
• GBM Targeted Search (Blackburn+ 2015; Goldstein+ 2016) • Seeded with a time of interest and optionally a sky map (prior)• Search employs detector-coherent search:• Assume spectral templates• Convolve assumed spectrum with detector responses, calculated over the entire sky• Expected signal in count rate compared to observed count rate
• Very powerful but expensive• Intended to be follow-up search for multi-messenger events

GBM Un-targeted Search
8
• Producing GCN notices with reliability scores (low, medium, high)• More info: https://gcn.gsfc.nasa.gov/fermi.html
• Expected rate is ~70/month total• Notices contain links to a HealPix sky map, a quick-look localization
plot (below), and the lightcurves for each detector• Data must be downlinked — notice latency will be 0.5-6 hours• Archival candidates dating back to January 2013 • https://gammaray.nsstc.nasa.gov/gbm/science/sgrb_search.html

The Curious Case of GW150914-GBM
9
• ~0.4 s after the GW signal, ~1 s duration• Did not trigger GBM• Found with the targeted search• Raw summed lightcurve SNR ~6 sigma above 50 keV• 2.9 sigma FAP - inconclusive + no emission expected
from a BBH merger.
– 11 –
Fig. 4.— Count rates detected as a function of time relative to the detection time of GW150914,
summed over all 14 GBM detectors. NaI data are summed over 50 - 980 keV and BGO data over
420 keV – 4.7 MeV. Time bins are 1.024 s wide and the red line indicates the background level. The
blue lightcurve was constructed from CTTE data, rebinned to optimize the signal-to-noise ratio. In
the top panel, the 0.256 s CTIME binning is overplotted on the 1.024 s lightcurve. lightcurve. The
dip before the spike associated with GW150914-GBM is not significant. Such dips are common in
stretches of GBM data, as can be seen in the longer stretch of data on the bottom panel. A 1600 s
stretch of data centered on GW150914-GBM, with 1.024 s binning, shows 100 runs each of positive
and negative dips lasting 3 s or longer relative to a third-order polynomial fit background over the
1600 s time interval, with 55 (38) negative (positive) excursions lasting 4 s or longer.
– 8 –
Fig. 2.— Model-dependent count rates detected as a function of time relative to the start of
GW150914-GBM, ⇠0.4 s after the GW event. The raw count rates are weighted and summed to
maximize signal-to-noise for a modeled source. CTIME time bins are 0.256 s wide. The teal data
points are used in the background fit. The mustard points are the counts in the time period that
shows significant emission, the grey points are outside this time period, and the blue point shows
the 1.024 s average over the mustard points. For a single spectrum and sky location, detector counts
for each energy channel are weighted according to the modeled rate and inverse noise variance due
to background. The weighted counts from all NaI and BGO detectors are then summed to obtain
a signal-to-noise optimized light curve for that model. Each model is also assigned a likelihood by
the targeted search based on the foreground counts (in the region of time spanned by the mustard
points), and this is used to marginalize the light curve over the unknown source location and
spectrum.
Model-weighted count rate
Connaughton+ 2016, ApJL, 826, L6

Joint Sub-threshold Search
10
GBM has a special MOU with LIGO/Virgo — Access to all LIGO sub-threshold triggers.
In all cases, the presence of a signal in GBM or LIGO, can raise the significance of the signal being real in the other instrument.
A confident gamma-ray signal allowing a fainter gravitational wave signal, would push the LIGO detection distance limit further, in turn increasing the event rate by a factor of distance cubed
Ideal Scenario Bright GBM Bright LIGO
GW150914 Scenario Sub-threshold GBM
Bright LIGO
Typical more distant short GRB
Bright GBM Sub-threshold LIGO
Both Sources Faint Sub-threshold GBM
Sub-threshold LIGO
GBM LIGO

All-O1 Offline Follow-up Analysis
11
4
10-12
10-11
10-10
10-9
10-8
10-7
10-6
10-5
10-4
10-3
10-2
0 20 40 60 80 100 120 140 160
FAR
GW
t - tstart (days)
Figure 1. Time series of CBC triggers relative to the start ofO1. The horizontal line denotes the inverse live-time for the O1campaign (∼55 days). The joint GBM/LIGO analyses used theblue points as the background sample, with FARGW > 10−3 Hz.The silver points correspond to the search sample, with FARGW
< 10−5 Hz, or approximately fewer than one per day. These col-ors and marker style are preserved throughout this article. Thered and orange downward-pointing triangles correspond to the up-per limits on FARGW for GW150914 and GW151226, respectively.The yellow diamond correspond to LVT151012.
The ranking statistic Λ for the targeted search is de-344
rived from a log likelihood ratio formalism that mea-345
sures the GBM signal strength relative to a polynomial346
fit to the background count rate. A detailed discussion of347
the search’s methodology can be found Blackburn et al.348
(2015).349
Figure 1 shows times relative to the start of O1 for350
the combined CBC triggers found by the GstLAL and351
PyCBC pipelines. Intervals with no triggers correspond to352
times when one or both detectors were unable to produce353
science data, or when the data were vetoed due to well-354
understood instrumental or environmental disturbances.355
With the exception of the two high-confidence detec-356
tions GW150914 (red diamond) (Abbott et al. 2016a)357
and GW151226 (yellow square) (Abbott et al. 2016d),358
and the low-significance candidate LVT151012 (orange359
triangle) (Abbott et al. 2016e), no CBC triggers were360
more significant than the inverse of the O1 live-time of361
∼2 × 10⁻⁷ Hz (black horizontal line). For the targeted362
GBM search, the candidates with FARGW < 10−5 Hz (<363
1 day−1) marked by gray circles were used as the search364
sample, while the blue dots (FARGW > 10−3 Hz) served365
as the background sample.366
3. SEARCH RESULTS367
3.1. Triggered and Un-targeted Search368
For the joint analysis, events found in the GBM trig-369
gered and un-targeted searchs during O1 are combined370
and correlated with the combined list of CBC candidates,371
searching for coincident events in the two observatories.372
The GBM trigger list includes 115 GRBs, about half of373
which are SGRBs. The search statistic is the shortest374
absolute time offset between a GRB and any CBC can-375
didate, allowing for the possibility that the EM signal376
can precede or follow the compact binary merger event.377
The three closest coincidences came from the GBM un-378
targeted search, which recorded SGRBs 5, 11, and 28 s379
0
0.1
0.2
0.3
0.4
0.5
0.6
0.7
0.8
0.9
1
102 103 104 105
c.d.
f.
|∆T| (s)
backgroundsearch
Figure 2. Cumulative distribution function of minimum absoluteoffset time between a GRB found by the triggered or untargetedGBM searches and a CBC candidate. The search sample (gray solidline) is consistent with the background distribution (blue dottedline), indicating that there are no significant coincidences betweenindependently identified GBM and CBC triggers during O1.
prior to a CBC candidate. All three of the CBC candi-380
dates had FARGW ! 10−4 Hz. The triggered GBM event381
closest in time to a CBC trigger was GRB 151222340382
which occurred ∼20 seconds before a CBC trigger with383
FARGW > 10−4 Hz. Due to the large time offset and the384
high FARGW this is likely a random coincidence.385
Using CBC candidates with FARGW > 10−3 Hz as a386
background sample (blue dots in Figs. 2) and FARGW387
< 10−5 as the search sample, we find the 90th percentile388
of the absolute offset time to the closest GRB in our389
sample to be ∼104 s. Approximately 10% of the search390
sample are closer in time to a GRB, as expected for a null391
result based on the background sample. The agreement392
between cumulative distribution functions of the absolute393
time offset |∆T | for the background sample (blue dotted394
line) and the search sample (gray solid line) is shown in395
Figure 2.396
3.2. Targeted Search397
During O1, the targeted search was used to follow-up398
CBC coincident triggers with FARGW < 10−5 Hz (" 1399
day−1). Triggers that occurred within a 1 s window in400
both pipelines were considered duplicate detections of the401
same candidate, and the trigger with the highest FARGW402
was removed by the sample. By this procedure, there403
were 17 times that a trigger was found by both pipelines:404
9 triggers with no offset (|∆T | < 0.01 s), 7 triggers with405
offset of |∆T | ∼ 0.01 s, and one occurrence with an offset406
of |∆T | ∼ 0.02 s. Triggers with FARGW > 10−3 Hz407
were used as the background sample to measure the false408
alarm rate for the GBM follow-up, FARGBM.409
Figure 3 shows the cumulative event rate of the back-410
ground (blue dotted lines) and search (gray solid lines)411
samples. The panels in the figure from left to right corre-412
spond to results from the soft, normal, and hard template413
spectra. The distribution of the search samples is largely414
consistent with that of the background.415
FARGBM for coincidences in the targeted follow-up416
of CBC candidates with FARGBM < 10−3 Hz can be417
mapped to a false alarm probability (FAP) as explained418
in Connaughton et al. (2016). The FAP is proportional419
LIGO triggers • PyCBC & GstLAL offline triggers • Search sample: FAR < ~1/day • Background sample: FAR > 1/(15 min) • Overlapping triggers with higher FAR
discarded
Comparison with GBM triggers • Time offset between triggered and sub-threshold GRBs
(untargeted) and nearest CBC trigger • No discernible difference between background and search • No candidates from search sample occurred within O(100)
s of a triggered or sub-threshold GRB (untargeted)
Preliminary GBM-LIGO-VIRGO results
GBM-LVC Joint Result
GBM Analysis led by Eric Burns

Targeted Search Follow-up
12
5
10-4
10-3
10-2
100 101 102Cum
ulat
ive
even
t rat
e (H
z)
Λ
Soft Spectrum
backgroundsearch
Solar flare
10-4
10-3
10-2
100 101 102
Λ
Normal Spectrum
backgroundsearch
10-4
10-3
10-2
100 101 102
Λ
Hard Spectrum
backgroundsearch
GW150914-GBM
Figure 3. Cumulative event rates of the background (blue dotted lines) and search (gray solid lines) samples for the GBM targetedfollow-up of CBC triggers. The panels in the figure from left to right correspond to results from the soft, normal, and hard templatespectra. The distribution of the search samples is largely consistent with that of the background. The two most significant events fromthe search distribution are the GBM transient identified in the follow-up to GW150914 (red diamond) and a soft, long-duration, transientfound 26 s after a low-significance GW trigger. The long, soft transient is likely due to solar activity, and in a chance coincidence with aGW trigger.
10-5
10-4
10-3
10-2
10-1 100 101
FAR
GBM
(Hz)
|∆T| (s)
search GW150914-GBM
10-5
10-4
10-3
10-2
10-1 100 10110-4
10-3
10-2
10-1
100
101
FAP
(pos
t-tria
ls)
Figure 4. Scatter plot of the combined search sample’s FARGBM
vs. absolute time offset between the CBC trigger and the GBMtransient |∆T |. The red diamond is the GBM transient detected inthe follow-up of GW150914, found with similar significance to theoriginal analysis reported in Connaughton et al. (2016). The shad-ing is the post-trials FAP, with the diagonal contours demarcatingincreasing decades in FAP. The lower left contour is at FAP=10−4.
to FARGBM, the time offset between the GBM and the420
CBC candidate, ∆T , and takes into account the trials421
factors of the search stemming from the number of tem-422
plates used, the number and size of the search windows,423
etc. The minimum value of∆Tmin is the bin-width of the424
data. Figure 4 shows a scatter plot of all CBC triggers’425
FARGBM as a function of the absolute time difference426
between GBM and CBC triggers (|∆T |), with the color-427
scale and contours showing the FAP.428
The lowest FARGBM of the search came from the GBM429
transient found in the follow-up to the CBC trigger as-430
sociated with GW150914. The ranking statistic of the431
GBM source, GW150914-GBM, was measured to occur432
in the search with a FARGBM of 2.0 × 10⁻⁴ Hz and a433
FAP of 4 × 10⁻³, consistent within errors for the re-434
sults reported in Connaughton et al. (2016). The next435
lowest false alarm rate FARGBM =2.6 × 10⁻⁴ Hz of the436
search occurred in the analysis of the GBM transient de-437
tected at 2015-09-29 12:15:43.6 UTC. The event was at438
the edge of the search window, 26 s before the GW trig-439
ger time that triggered the analysis, resulting in a FAP440
of 0.23. The event was found using the soft template and441
the longest (8.192 s) timescale of the search. A search442
for other possibly associated astrophysical transients at443
that time revealed that the GBM event occurred during444
the exponential decay tail of an M-class solar flare. The445
GBM localization is consistent with the Sun and incon-446
sistent with the LIGO sky-map, thus we conclude this447
event is due to solar activity. All remaining coincidences448
in the search had FARGBM > 5 × 10⁻³ Hz and FAPs449
greater than ∼10−2.450
4. CONCLUSIONS AND DISCUSSION451
In this paper we have reported on results from the452
search of Fermi GBM data for electromagnetic coun-453
terparts to gravitational wave candidates. We per-454
formed two separate searches for gamma-ray signals in455
the Fermi GBM around triggers from the GstLAL and456
PyCBC searches for compact binary merger signals in457
LIGO data collected during O1: A blind search corre-458
lating the catalog of GBM GRBs to subthreshold GW459
triggers; and a targeted coherent GBM follow-up seeded460
by the LIGO event times. Results from both searches461
were largely consistent with background estimated by462
using high FARGW candidates. No on-board triggered463
GRBs, or GRBs found by the un-targeted GBM search,464
were found to be within ∼100 s of a CBC trigger.465
The most significant event in the targeted follow-up466
was from the trigger associated with GW150914. The467
GBM source, GW150914-GBM, was previously reported468
in Connaughton et al. (2016). The event’s false alarm469
rate reported here, FARGBM = 2.2 × 10⁻⁴ Hz, was de-470
termined from an empirical measurement of the search471
background over the entire O1 run, and was found to472
be of comparable significance to the previous estimate of473
1.2 × 10⁻⁴ Hz using only the 3 day period around the474
gravitational wave detection. No other CBC candidates475
were found to have notable counterparts in the GBM476
follow-up search.477
Due to the partial coverage of the LIGO sky map478
by GBM, as well as the low count statistics on BH-BH479
mergers, the lack of counterparts to the GW candidates480
LVT151012 and GW151226 are not sufficient to conclude481
a chance coincidence of GW150914-GBM (Racusin et al.482
2016). On the other hand, the significance of GW150914-483
GBM remains marginal, and thus the potential associa-484
tion between the GW and the gamma-ray source is in-485
conclusive.486
For the targeted search, the long tails in the back-487
ground distribution out to high values of the ranking488
GBM Targeted Search • Search performed over 3 template spectra • GW150914-GBM candidate is most significant at
FAR ~2x10⁻⁴ Hz • Second lowest FAR is a chance coincidence with a
solar flare (soft spectrum)
Preliminary

False Alarm Probability for All-O1
13
5
10-4
10-3
10-2
100 101 102Cum
ulat
ive
even
t rat
e (H
z)
Λ
Soft Spectrum
backgroundsearch
Solar flare
10-4
10-3
10-2
100 101 102
Λ
Normal Spectrum
backgroundsearch
10-4
10-3
10-2
100 101 102
Λ
Hard Spectrum
backgroundsearch
GW150914-GBM
Figure 3. Cumulative event rates of the background (blue dotted lines) and search (gray solid lines) samples for the GBM targetedfollow-up of CBC triggers. The panels in the figure from left to right correspond to results from the soft, normal, and hard templatespectra. The distribution of the search samples is largely consistent with that of the background. The two most significant events fromthe search distribution are the GBM transient identified in the follow-up to GW150914 (red diamond) and a soft, long-duration, transientfound 26 s after a low-significance GW trigger. The long, soft transient is likely due to solar activity, and in a chance coincidence with aGW trigger.
10-5
10-4
10-3
10-2
10-1 100 101
FAR
GBM
(Hz)
|∆T| (s)
search GW150914-GBM
10-5
10-4
10-3
10-2
10-1 100 10110-4
10-3
10-2
10-1
100
101
FAP
(pos
t-tria
ls)
Figure 4. Scatter plot of the combined search sample’s FARGBM
vs. absolute time offset between the CBC trigger and the GBMtransient |∆T |. The red diamond is the GBM transient detected inthe follow-up of GW150914, found with similar significance to theoriginal analysis reported in Connaughton et al. (2016). The shad-ing is the post-trials FAP, with the diagonal contours demarcatingincreasing decades in FAP. The lower left contour is at FAP=10−4.
to FARGBM, the time offset between the GBM and the420
CBC candidate, ∆T , and takes into account the trials421
factors of the search stemming from the number of tem-422
plates used, the number and size of the search windows,423
etc. The minimum value of∆Tmin is the bin-width of the424
data. Figure 4 shows a scatter plot of all CBC triggers’425
FARGBM as a function of the absolute time difference426
between GBM and CBC triggers (|∆T |), with the color-427
scale and contours showing the FAP.428
The lowest FARGBM of the search came from the GBM429
transient found in the follow-up to the CBC trigger as-430
sociated with GW150914. The ranking statistic of the431
GBM source, GW150914-GBM, was measured to occur432
in the search with a FARGBM of 2.0 × 10⁻⁴ Hz and a433
FAP of 4 × 10⁻³, consistent within errors for the re-434
sults reported in Connaughton et al. (2016). The next435
lowest false alarm rate FARGBM =2.6 × 10⁻⁴ Hz of the436
search occurred in the analysis of the GBM transient de-437
tected at 2015-09-29 12:15:43.6 UTC. The event was at438
the edge of the search window, 26 s before the GW trig-439
ger time that triggered the analysis, resulting in a FAP440
of 0.23. The event was found using the soft template and441
the longest (8.192 s) timescale of the search. A search442
for other possibly associated astrophysical transients at443
that time revealed that the GBM event occurred during444
the exponential decay tail of an M-class solar flare. The445
GBM localization is consistent with the Sun and incon-446
sistent with the LIGO sky-map, thus we conclude this447
event is due to solar activity. All remaining coincidences448
in the search had FARGBM > 5 × 10⁻³ Hz and FAPs449
greater than ∼10−2.450
4. CONCLUSIONS AND DISCUSSION451
In this paper we have reported on results from the452
search of Fermi GBM data for electromagnetic coun-453
terparts to gravitational wave candidates. We per-454
formed two separate searches for gamma-ray signals in455
the Fermi GBM around triggers from the GstLAL and456
PyCBC searches for compact binary merger signals in457
LIGO data collected during O1: A blind search corre-458
lating the catalog of GBM GRBs to subthreshold GW459
triggers; and a targeted coherent GBM follow-up seeded460
by the LIGO event times. Results from both searches461
were largely consistent with background estimated by462
using high FARGW candidates. No on-board triggered463
GRBs, or GRBs found by the un-targeted GBM search,464
were found to be within ∼100 s of a CBC trigger.465
The most significant event in the targeted follow-up466
was from the trigger associated with GW150914. The467
GBM source, GW150914-GBM, was previously reported468
in Connaughton et al. (2016). The event’s false alarm469
rate reported here, FARGBM = 2.2 × 10⁻⁴ Hz, was de-470
termined from an empirical measurement of the search471
background over the entire O1 run, and was found to472
be of comparable significance to the previous estimate of473
1.2 × 10⁻⁴ Hz using only the 3 day period around the474
gravitational wave detection. No other CBC candidates475
were found to have notable counterparts in the GBM476
follow-up search.477
Due to the partial coverage of the LIGO sky map478
by GBM, as well as the low count statistics on BH-BH479
mergers, the lack of counterparts to the GW candidates480
LVT151012 and GW151226 are not sufficient to conclude481
a chance coincidence of GW150914-GBM (Racusin et al.482
2016). On the other hand, the significance of GW150914-483
GBM remains marginal, and thus the potential associa-484
tion between the GW and the gamma-ray source is in-485
conclusive.486
For the targeted search, the long tails in the back-487
ground distribution out to high values of the ranking488
False Alarm Probability • GW150914-GBM has lowest post-trials FAP
at ~2x10⁻³ • FAP is still too high to declare an
unambiguous EM counterpart • No other candidates had FAP < 0.01
Preliminary

Other Upper Limits
Setting Upper Limits
14
GW170104
Fermi GBM+LAT 2017, arXiv:1706.00199Wilson-Hodge+ 2012, ApJS, 201, 33
Earth Occultation Technique (Wilson-Hodge+ 2012) set upper limits on emission from flaring sources
Have also issued upper limits for IceCube and ANTARES neutrinos
Group at UMD using GBM data to set UL for some previous FRBs
Impulsive upper limits:• GBM can set flux upper limits in the event no interesting counterpart was found.• The upper limit is primarily dependent on the noise background in GBM and the
geometry to the GBM detectors for each patch of sky that is inspected.• Requires assumption of signal timescale and spectrum —currently 1s timescale
and the average GBM-observed short GRB spectrum• For O2, upper limits of LIGO 99% credible region have been produced

O2, O3, and Beyond
15
• Improvements made to the background estimation of the targeted search — Done for O2
• Updated ‘hard’ spectral template — Done for O2
• Characterization and determination of recovery efficiency for both searches — Ongoing
• Adapting the the GBM flight software trigger classifier to work for both searches — Ready for O3?
• Joint FAR estimation between GBM and LIGO candidates — Ready for O3?

Conclusions
16
• GBM provides a window into the high-energy transient universe • ~85% time coverage, ~70% instantaneous sky coverage, over 3
decades of energy• GBM teams have developed and are improving low-latency offline
searches to study un-triggered events and for follow-up of interesting events
• Have reported on every LV-EM trigger in O1 and O2 and completed the All-O1 analysis of LIGO sub-threshold triggers.
• Our search pipelines continue to process incoming sub-threshold triggers in O2 and automatically search for candidates
• GBM team will be providing new continuous data in hour-long chunks, over the next 2 years will be releasing new public tools to enable analysis
• GBM provides unmatched ability to follow-up and characterize high-energy transient counterparts to GW events

Backup
17