search for nuclear ashes in electrochemical...
TRANSCRIPT
Violante, V., et al. Search For Nuclear Ashes In Electrochemical Experiments. in Tenth International Conference on Cold Fusion. 2003. Cambridge, MA: LENR-CANR.org. It may be different from the version published by World Scientific, Inc (2003) in the official Proceedings of the conference.
Search For Nuclear Ashes In Electrochemical Experiments
V. VIOLANTE, M.L. APICELLA, L. CAPOBIANCO*
Associazione EURATOM-ENEA sulla Fusione, Centro Ricerche Frascati, C.P. 65 - 00044 Frascati (Rome) Italy
F. SARTO, A. ROSADA, E. SANTORO
ENEA, Unità Tecnico Scientifica Fusione, Centro Ricerche Casaccia, Via Anguillarese Km 1.300, 00100 Rome Italy
M. MCKUBRE, F. TANZELLA
SRI International 333 Ravenswood Ave Menlo Park CA (USA)
C. SIBILIA
INFM-Dipartimento di Energetica, La Sapienza University, Via Scarpa 16, Rome
Electrochemical experiments have been carried out in order to identify traces of nuclear processes occurring in condensed matter. The experimental activity was primarily designed to reduce the background element impurities by using ultra-pure cleaning procedures to eliminate contamination. The working conditions allowed to obtain a clear signal from the investigated phenomena. Neutron activation, SIMS and high resolution Mass Spectrometer analysis yielded experimental data greater than the measurement error and well above the detection limits of the instruments. The isotopic abundance has been studied for some elements and a strong difference as been observed between experimental data and natural values. A correlation has been observed between the shift of the isotopic composition and a weak emission of X-rays, in some experiments.
1 Introduction
The research, conceived to have strong evidences of nuclear processes occurring in condensed matter, has been developed within a cooperative effort between ENEA, SRI and Rome University.
Low energy transmutations in hydrogen-metal systems have been claimed in the recent years [1-5]. Search for nuclear ashes has demonstrated that H-3 is also produced during electrochemical loading of palladium with deuterium [6-7]. In previous work [2], mainly oriented to reveal X–rays emission during electrochemical loading of Pd and Ni with hydrogen (and deuterium), has been showed that a weak emission of X-rays was often correlated with an anomalous isotopic shift (revealed by neutron activation analysis) of up to 47%, of some elements e.g. Ag. In order to keep studying this matter a new experimental approach has been followed to achieve signals well above the background. Following such a philosophy search for tritium in electrochemical loading of deuterium in palladium and isotopic composition analysis (by SIMS) on a marker element have been carried out. Cu was selected as marker for experiments of electrochemical loading of hydrogen in nickel thin films
* ENEA Guest

because it has only two isotopes (63Cu and 65Cu) and neither overlaps with isotopes of other elements having the same masses. In addition we observed that masses 126 and 130 are absolutely absent in the experimental system, so that one may exclude that SIMS measurements of Cu are affected by these masses twice ionized. The experimental approach follows the theoretical planning that nuclear phenomena, at low energy in condensed matter are generated and controlled by plasmons-polaritons [8-9]. Experiments have been conceived in order to have clear evidence of LENR process occurring in condensed matter and to have, as far as possible, an evidence of the plasmon-polaritons excitation effect.
2 Thin films experiments 2.1 Experimental apparatus and procedures
1) Cells The cell (15cc) was realized using only two materials: pure polyethylene and 99.98% pure Pt. Fig.1a shows a detail of the anode-cathode support including the thin film. The anode is a platinum wire wrapped in the shape of a planar spiral. The cathode is a metallic thin film containing Ni or Pd. The cathode contact is made with a “C” shape platinum wire inserted into a polyethylene support. Polyethylene shields prevent the electrolysis between anode and cathode connections.
2) Thin Films The thin film is supported on a plastic disk (pure polyethylene as described above) 12 mm in diameter and 1 mm thick. The films were prepared by sputtering contemporaneously over two
Anode
Electric contact
Metallic thin film (400 A)Plastic support
Electrolyte
Ge Detector
Lead shield
Anode
Electric contact
Metallic thin film (400 A)Plastic support
Electrolyte
Ge Detector
Lead shield
Figure1a. Details of the cell and thin film identical adjacent plastic support targets, to yield a blank thin film electrode with the same deposition of the working one.
3) Cell Cleaning Procedure 1) Nitric Acid wash 2) 18 Mohm-cm pure water rinse 3) Pure ethanol with 20% KOH rinse 4) Pure ethanol wash and rinse 5) 18 Mohm-cm pure water wash and rinse (several times).
4) Laboratory Environment The film preparation, cleaning process, cell assembly and experiments were performed in a 1000 class clean room at the ENEA laboratory using dust-free gloves.

5) Measurements SIMS measurements have been carried out with a Leybold SSM-Mass Spectrometer Module, equipped with a Leybold IQE 12/38 source of 1.0-5.0 keV Ar ions and a Balzers Quadrupole Mass Analyzer working in the mass range 0-511. The equipment is suitable, in particular, for isotopic ratio measurements of elements and its sensitivity is 109 atoms/cm2. Tritium measurements have been performed with a Packard beta counter model 2560 TR/XL (58.75% efficiency). X-ray measurements were performed with ORTEC planar intrinsic high purity Ge (HPGE) detector. X-Ray measurements are strongly affected by the materials between the electrode and the Ge detector, even if all the thickness have been reduced to the minimum in order to minimize the effect. Such a condition, together with the detector efficiency made impossible to reveal a signal very well above the background: attenuation effect is shown in Fig. 1b.
Figure 1b. Calculated attenuation of X-Ray signal through the electrolyte and polymer in the experimental apparatus
X-Rays energy = 15 keV
2.2 Experiments
Six experiments have been done on Ni films: Ni1c, Ni2c, Ni1D, Ni2D, NiF, NiE by performing SIMS analysis on both the black and on the blank films. All the electrochemical loadings were done by using 1M Li2SO4 in pure H2O (18 M-ohm-cm) ranging from 40 min up to 20 hr, with current and voltage ranging between 10-220 mA and 3–6.1 V respectively; the electrode surface was always 0.8 cm2. Laser was used in experiment NiE, black film was electrolyzed for 40 min to load Ni with hydrogen and then irradiated, for 3 hr, with HeNe (632.8 nm) laser under plasmons resonant condition. Details on this experiment are given in Ref. [10]. A synopsis of the experiments is shown in Table 1.

Table 1. Synopsis of thin film experiments (N.M. = Not Measured)
Elapsed
time Film status
Current mA
Voltage V
Electrolyte
X Ray Cu presence
63Cu/65Cu shift
Laser applied
Ni1c black
3 hr Ok (after
loading)
100-220
4.8-6.1 1M Li2SO4 10 cc
NO Low NO NO
Ni1c blank
Ok N.M. Low NO NO
Ni2c black
3 hr Ok (after
loading)
25-190 3-6 1M Li2SO4 10 cc
10%D2O
YES YES YES (1.37)
NO
Ni2c blank
Ok N.M. Low NO NO
Ni1d black
4 hr destroyed
20-90 3.2-4.3 1M Li2SO4 10 cc
NO N.M. N.M. NO
Ni1d blank
Ok N.M. Low NO NO
Ni2d black
5 hr Ok (after
loading)
25-30 3.5-3.7 1M Li2SO4 10 cc
YES YES YES (0.97)
NO
Ni2d blank
Ok N.M. Low NO NO
NiF black
20 hr Ok (after
loading)
5 2.8 1M Li2SO4 10 cc
NO YES NO NO
NiF blank
Ok N.M. Low NO NO
NiE black
40 min Ok (after
loading)
10-30 3.1-3.4 1M Li2SO4 10 cc
N.M. YES YES YES
NiE blank
Ok N.M. Low NO YES
After the experiment blank and black films were inserted contemporaneously in the SIMS vacuum chamber positioned at 180 ° on a cylindrical support and analyzed one after the other, under the same vacuum chamber conditions . After the measurement, in order the check the instrument behaviour, some analysis were done on the S.S. samples support to check the isotopic ratio of Cu (impurity) there and the natural composition turned out always.
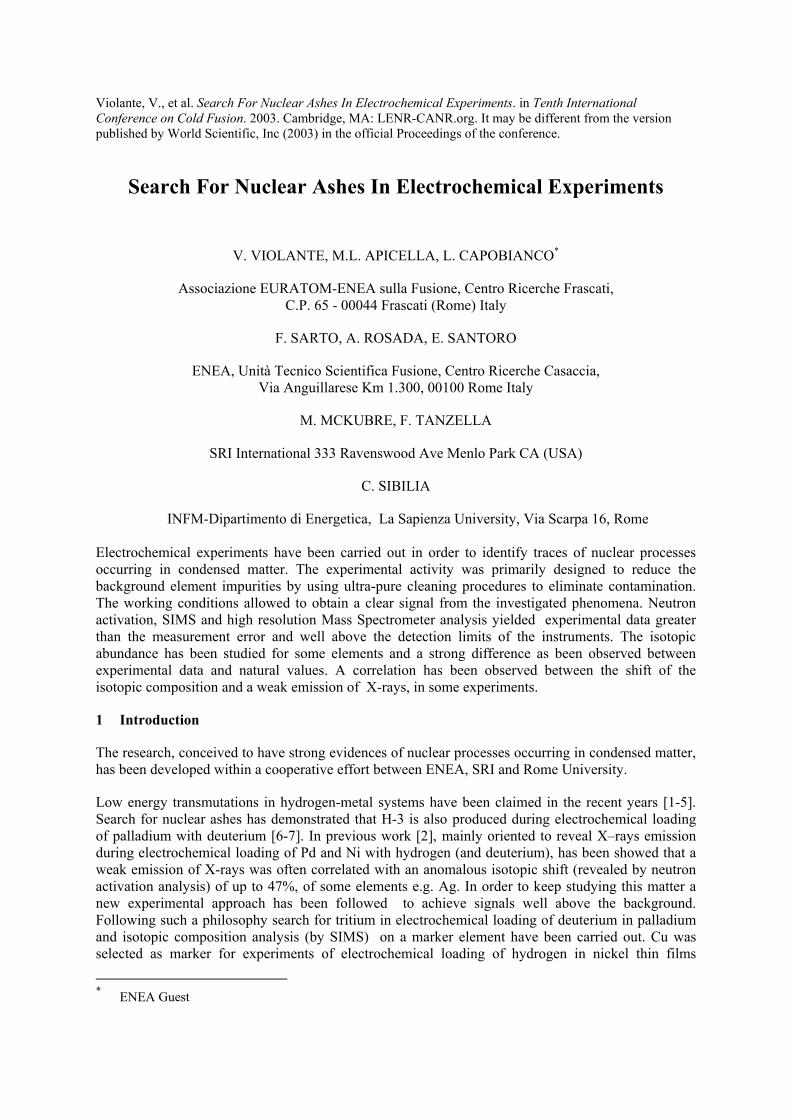
Cell Ni1c black didn’t show any X-Ray signal above the background and the Cu isotopic composition was clearly the natural one and in accordance with the measurement done on its blank. Cell Ni2c was experienced by using 1M Li2SO4 into 90% of pure H2O and 10% of D2O as electrolyte (blank in this case has been done with a not working cell filled with 10 cc D2O). A weak emission of X-rays was observed in the energy range 5-10 keV, see Fig. 2 and a shift of the 63Cu/65Cu isotopic ratio was observed up to less than 1.3 (nat. value = 2.24).
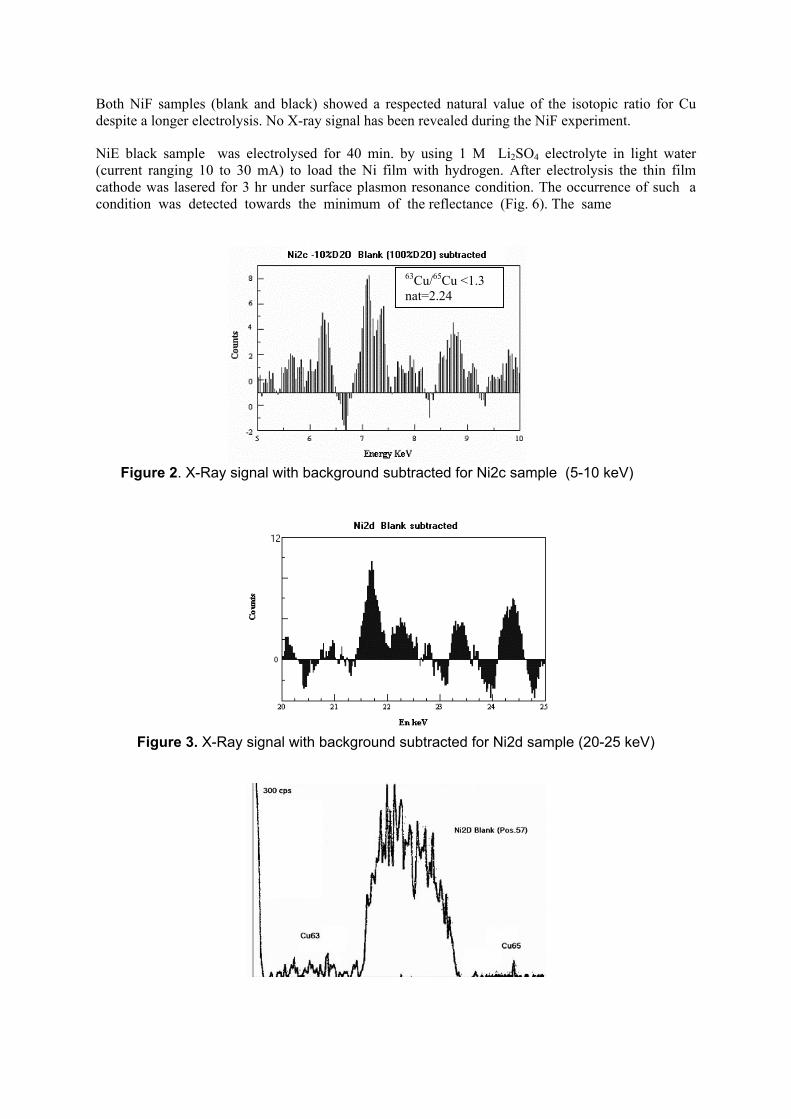
Ni2d cell showed a weak X-rays signal in the range 20-25 keV, the spectrum is given in Fig. 3. In coincidence the SIMS analysis revealed a shift for the isotopic ratio 63Cu/65Cu up to 0.94 while in the blank the natural value was respected, see figs 4 and 5. Cu concentration in the blank results to be lower than in the black, since Cu is deposited as impurity during the electrolysis. Several SIMS measurements over the samples gave always the same indication and in the black the maximum value of the isotopic ratio was 1.7 instead of 2.25.
Both NiF samples (blank and black) showed a respected natural value of the isotopic ratio for Cu despite a longer electrolysis. No X-ray signal has been revealed during the NiF experiment.
NiE black sample was electrolysed for 40 min. by using 1 M Li2SO4 electrolyte in light water (current ranging 10 to 30 mA) to load the Ni film with hydrogen. After electrolysis the thin film cathode was lasered for 3 hr under surface plasmon resonance condition. The occurrence of such a condition was detected towards the minimum of the reflectance (Fig. 6). The same
Figure 2. X-Ray signal with background su
Figure 3. X-Ray signal with background
63Cu/65Cu <1.3 nat=2.24
btracted for Ni2c sample (5-10 keV)
subtracted for Ni2d sample (20-25 keV)

Figure 4. Peaks of 63Cu and 65Cu in the Ni2d blank film
Figure 5. Peaks of 63Cu and 65Cu in the Ni2d black film
(a) (b) (c)
Figure 6. Reflected laser beam spot for increasing incidence angles: before reflectance minimum (a), in reflectance minimum (b) for an incidence angle larger than the total
reflection one, after reflectance minimum (c).
Figure 7. Peaks of 63Cu and 65CU in the NiE blank film
optical treatment was done on the blank sample (not loaded with hydrogen). Details on such an experiment are given into an other paper presented at this conference [8]. Figure 6 shows the image of the reflected laser beam spot from the layered system lens-air-Ni film. The central spot (b) shows the coupling between radiation and the metal surface.
After such a treatment a SIMS measurement has been done on both the blank and the black sample, giving surprisingly an enhancement of the isotopic shift effect observed in previous experiments; results are shown in Figs 7 and 8. The analysis reveals a strong difference between the samples: in the blank the isotopic ratio between 63Cu and 65Cu shows an abundance of the first one as expected. The
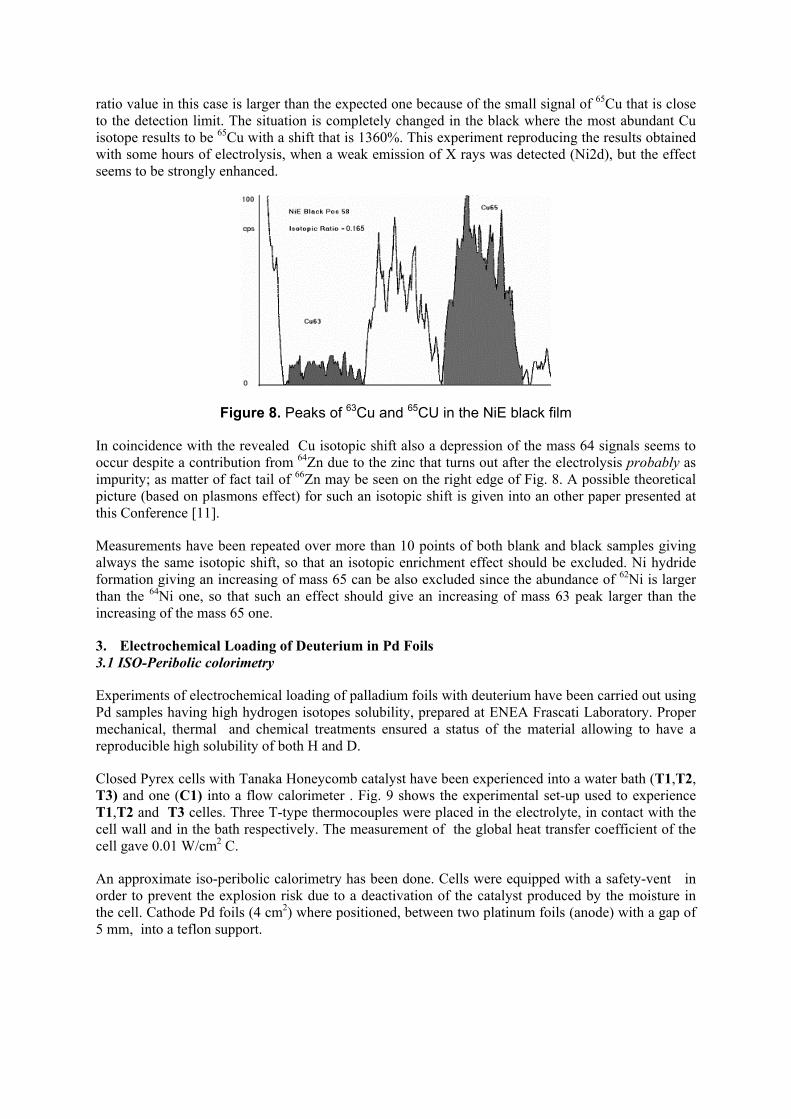
ratio value in this case is larger than the expected one because of the small signal of 65Cu that is close to the detection limit. The situation is completely changed in the black where the most abundant Cu isotope results to be 65Cu with a shift that is 1360%. This experiment reproducing the results obtained with some hours of electrolysis, when a weak emission of X rays was detected (Ni2d), but the effect seems to be strongly enhanced.
Figure 8. Peaks of 63Cu and 65CU in the NiE black film
In coincidence with the revealed Cu isotopic shift also a depression of the mass 64 signals seems to occur despite a contribution from 64Zn due to the zinc that turns out after the electrolysis probably as impurity; as matter of fact tail of 66Zn may be seen on the right edge of Fig. 8. A possible theoretical picture (based on plasmons effect) for such an isotopic shift is given into an other paper presented at this Conference [11].
Measurements have been repeated over more than 10 points of both blank and black samples giving always the same isotopic shift, so that an isotopic enrichment effect should be excluded. Ni hydride formation giving an increasing of mass 65 can be also excluded since the abundance of 62Ni is larger than the 64Ni one, so that such an effect should give an increasing of mass 63 peak larger than the increasing of the mass 65 one.
3. Electrochemical Loading of Deuterium in Pd Foils 3.1 ISO-Peribolic colorimetry
Experiments of electrochemical loading of palladium foils with deuterium have been carried out using Pd samples having high hydrogen isotopes solubility, prepared at ENEA Frascati Laboratory. Proper mechanical, thermal and chemical treatments ensured a status of the material allowing to have a reproducible high solubility of both H and D.
Closed Pyrex cells with Tanaka Honeycomb catalyst have been experienced into a water bath (T1,T2, T3) and one (C1) into a flow calorimeter . Fig. 9 shows the experimental set-up used to experience T1,T2 and T3 celles. Three T-type thermocouples were placed in the electrolyte, in contact with the cell wall and in the bath respectively. The measurement of the global heat transfer coefficient of the cell gave 0.01 W/cm2 C.
An approximate iso-peribolic calorimetry has been done. Cells were equipped with a safety-vent in order to prevent the explosion risk due to a deactivation of the catalyst produced by the moisture in the cell. Cathode Pd foils (4 cm2) where positioned, between two platinum foils (anode) with a gap of 5 mm, into a teflon support.

Thermocouple
Thermocouple
ThermocoupleLaser
Safety vent
Catalyst
Water bath
Pd Foil Teflon support
Thermocouple
Thermocouple
ThermocoupleLaser
Safety vent
Catalyst
Water bath
Pd Foil Teflon support
Figure 9. Schematic picture of experimental apparatus for deuterium loading into Pd foils
Table 2. Synoptic of D loading in Pd foils experiment
Elapsed Time (s)
Electrolyte Voltage (V)
Current (mA)
Loading D/Pd
Excess of Power
(W)
Tritium Excess
Laser Triggering
T1 200.000 0.1M LiOD 3.1-12 15-300 ∼0.94 NO NO NO T2 1000.000 0.1M LiOD 3.2-12 20-30 ∼0.95 NO NO NO T3 1200.000 0.1M LiOD 3.2-12 20-350
Hi-Low ≥0.96 0.5-1
(bursts) 15-20% > isotop.
enrich
Period.
Electrical resistance of the palladium cathode was measured during the electrolysis by means of 4-wires measurement done with an HP-4263 LCR Meter. All the electrical contacts were realised with 0.25 mm Pt wires. The data acquisition system was based on a HP34970A DAQ switch unit powered with LabView 6.1 software by means of GPIB connection. Cell power supply is an AMEL galvanostat, modulated, during the HI-LO current mode by an HP 33120 Wave Function Generator. The electrolyte was 0.1 M LiOD. Results of the three experienced cells (T1,T2 and T3) are summarized in Table 2.
The achieved loading was high in all the experiments. The minimum loading was obtained in the T1 experiment while the maximum has been given by cell T3 (D/Pd ≥0.96). The improvement was due to the hi-lo current mode, since before applying such an operating condition also cell T3 achieved a loading around 0.94 – 0.95. At high loading values cell T3 was periodically stimulated for some minutes with laser (λ=632 nm). When the maximum loading was achieved two effects have been observed in cell T3:
1) A sharp increasing of the electrolyte temperature, of 0.5-1 °C, despite a decreasing of the temperature of the external water bath (black curve in Fig. 10). 2) In coincidence an increasing of the R/Ro value was observed indicating an increasing of the cathode temperature of about 2-3 °C.
A rough estimate of the excess of power was done on the basis of the measured heat transfer coefficient and 0.5-1 W of excess was estimated. Fig.10 and Fig. 11 show the increasing of the electrolyte temperature and the contemporaneous increasing of the R/Ro value of the Pd cathode, despite the bath temperature decreasing.

The thermal effect has been observed several times during the experiment in coincidence with the increasing of the normalized resistance of the Pd.
At the end of the experiment the cathode was completely de-loaded by means of an anodic
T electrolyte
Laser
T Bath
Figure 10. Temperature increasing of the electrolyte
Figure 11. Increasing of the R/Ro
polarization with 15 mA of current until R/Ro was again one passing through the maximum (close to 2).
All the gas were recombined by the catalyst and after stopping the electrochemical system one cc of the solution was analyzed to measure the tritium content. The background has been done with 1 cc of virgin LiOD 0.1 M electrolyte and a sample of 1 cc of the exhausted electrolyte measured. Electrolyte samples have been taken by using an high precision EPPENDORF sampler. Three measurements have been repeated for three days and one was of 10 hours giving an increasing of the electrolyte activity from 37.2±0.218 CPM up to 47.6±0.316 in the virgin and in the exhausted one respectively. The isotopic enrichment was calculated taking into account the consumption of the electrolyte after 14 days of experiment. (initial 25 cc final 20 cc) due to the efficiency of the recombiner. Calculations have been done by applying the well known relationship for tritium enrichment:
−
−−−=
dtdNxxF
PPPxnaF
Ndtdx t
vg
v
v
E
EL
t αα1

where: x is the mole fraction of DTO in the electrolyser at time t, Nt are the moles of D2O in the electrolyser at time t, FL and Fg the feed rate of heavy water and the flow rate of the evolving gases respectively, a the mole fraction of the DTO in the feed αE and αV the electrochemical and vapour phase separation factors (2 and 1.016 are generally accepted for the system working conditions), P and PV are the pressure in the cell and the D2O vapour pressure respectively.
The calculations gave a maximum increasing for tritium enrichment up to 41 CPM, so that an increasing of the tritium content above the enrichment has been observed for cell T3 (15-20%). Similar procedure and measurements have been done for cell T1 and T2 but no increasing of tritium above the expected isotopic enrichment was observed. Such an increasing of tritium is not correlated with the estimated excess of power. Even if all the reported effects have been observed after the laser triggering of T3 cell, in this case it’s impossible to have a precise correlation with a condition of existing plasmons at the surface like in the case, above described, of the hydrogenated Ni thin film.
3.2 Replication into a flow calorimeter
Excess of power measurement has been replicated by using a flow calorimeter shown in Fig. 12. Calorimetric system is composed of a Memmert thermostatic box (±0.05 °C), Haake thermostatic bath for coolant water, Bronkhorst high precision mass flow meter and controller (0.3-0.1 cc/s) read by the data acquisition system in order to have a precise measurement of the output power. He leakage tested cell (2E-10 mbar l/s) is immersed into a water jacket cooled by a water coolant pipe. Inlet and outlet temperatures of the coolant are measured with two PT100 thermometers (four wires measurements). The cell is equipped with Tanaka honeycomb catalyst. Cell power supply is an AMEL galvanostat, modulated, during the HI-LO current mode by an HP 33120 Wave Function Generator. Output power is measured by means of the mass flow rate and coolant temperatures. R/Ro measurement is done by means of an HP- 4284
Figure 12. Flow calorimeter system

Figure13. Excess of heat ranging from 100 up to 600 mW during 150000 s Hi-LO current mode
LCR Meter. Data acquisition system is similar to the above described one. A control system open a safety valve on the top of the cell if the cell pressure excides 1.6 bar (because of a possible reduction of the catalyst efficiency) in order to prevent explosion.
The excess of power appeared, after 300.000 seconds of electrolysis, when, an R/Ro value equal to 1.69 (x ∼ 0.95) was achieved under Hi-LO current mode. The excess was ranging between 100 and 600 mW for 140000 s (see Fig. 13) and disappeared when the R/Ro value increased up to 1.74 (x < 0.94).
Table 3. Synopsis of C1 Cell experiment
Elapsed Time (s)
Electrolyte Voltage (V)
Current (mA)
Loading D/Pd
Excess of Power
(W)
Tritium Excess
Laser Triggering
C1 660.000 0.1M LiOD 3.1-12 15-350 HI - LO
∼0.95 0.15-0.6 NO NO
No increasing of tritium, above the expected electrochemical enrichment, has been found after the experiment, despite a larger electrolyte consumption compared to the consumption of T3 cell due to a reduction of the catalyst efficiency during the experiment. This data is a further element indicating that the increasing of tritium in cell T3 should not be ascribed to an electrochemical effect. A summary of the C1 cell experiment is reported in table 3.
Conclusions
The experimental observations reproduce the data on X-Ray emission and on isotopic shift presented at ICCF9 by the authors.
SIMS isotopic composition analysis performed confirmed a correlation between a weak X-Ray emission from hydrogenated Ni and isotopic shift of a marker element on the experienced samples.
A clear evidence of a strong variation of the Cu natural isotopic composition has been observed, in particular after laser excitation of plasmons-polaritons.
Power measurements on electrochemical experiments of deuterium loading in palladium shown a clear signal of excess of power production above the loading threshold D/Pd = 0.95-0.96.
Measurements of tritium in the spent electrolytes revealed an increasing of tritium concentration 15-20% above the isotopic enrichment.
Surface plasmons-polaritons seem to have a key role in the occurrence of the observed phenomena.
One may conclude that LENR in condensed matter may explain the observations unless a very powerful mechanism for isotopic separation has been found.
Forgetting excess of power, the question is:
Where is the disappeared isotope?
From where does tritium enter the system?
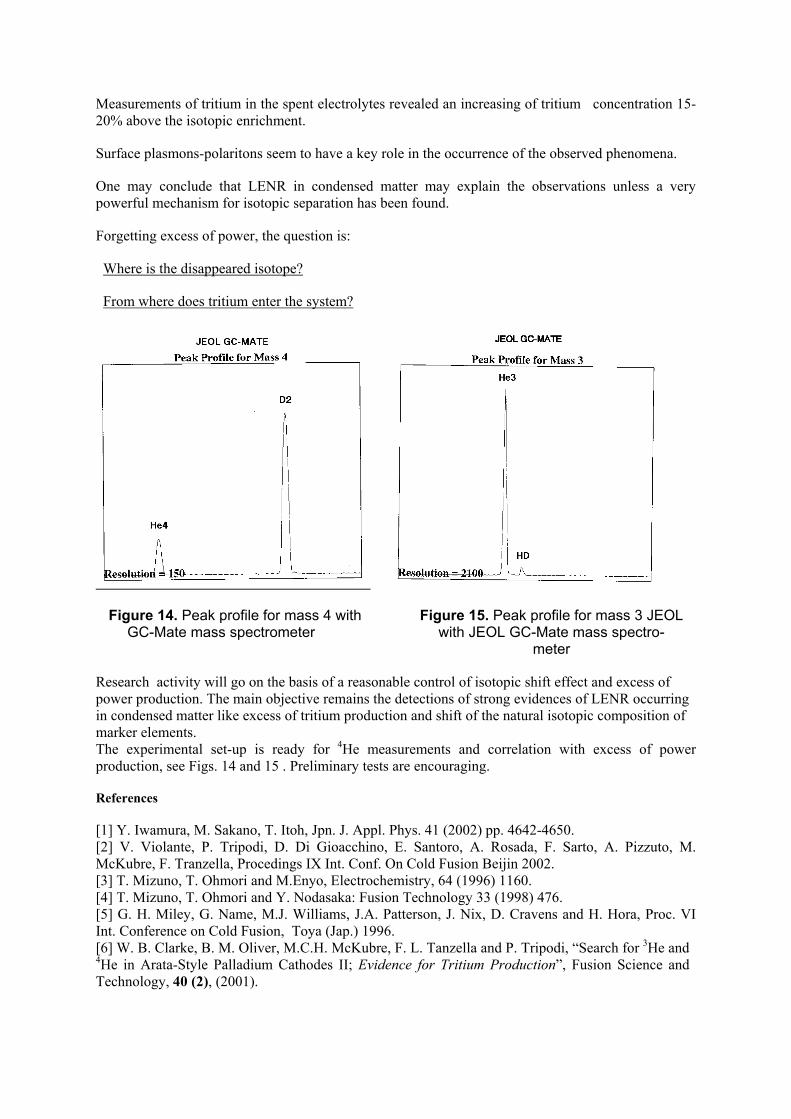
Figure 14. Peak profile for mass 4 with Figure 15. Peak profile for mass 3 JEOL GC-Mate mass spectrometer with JEOL GC-Mate mass spectro-
meter
Research activity will go on the basis of a reasonable control of isotopic shift effect and excess of power production. The main objective remains the detections of strong evidences of LENR occurring in condensed matter like excess of tritium production and shift of the natural isotopic composition of marker elements. The experimental set-up is ready for 4He measurements and correlation with excess of power production, see Figs. 14 and 15 . Preliminary tests are encouraging.
References
[1] Y. Iwamura, M. Sakano, T. Itoh, Jpn. J. Appl. Phys. 41 (2002) pp. 4642-4650. [2] V. Violante, P. Tripodi, D. Di Gioacchino, E. Santoro, A. Rosada, F. Sarto, A. Pizzuto, M. McKubre, F. Tranzella, Procedings IX Int. Conf. On Cold Fusion Beijin 2002. [3] T. Mizuno, T. Ohmori and M.Enyo, Electrochemistry, 64 (1996) 1160. [4] T. Mizuno, T. Ohmori and Y. Nodasaka: Fusion Technology 33 (1998) 476. [5] G. H. Miley, G. Name, M.J. Williams, J.A. Patterson, J. Nix, D. Cravens and H. Hora, Proc. VI Int. Conference on Cold Fusion, Toya (Jap.) 1996. [6] W. B. Clarke, B. M. Oliver, M.C.H. McKubre, F. L. Tanzella and P. Tripodi, “Search for 3He and 4He in Arata-Style Palladium Cathodes II; Evidence for Tritium Production”, Fusion Science and Technology, 40 (2), (2001).

[7] V. Violante et Al. Proceedings II Conf. On Cold Fusion, Como 1991. [8] V. Violante, A.Torre, G.H. Miley, G. Selvaggi, Fusion Technology 39 266 (2001). [9] V. Violante, C. Sibilia, D. Di Gioacchino,, M. McKubre, F. Tanzella, P. Tripodi. Hydrogen Isotopes Interaction Dynamics in Palladium Lattice, Conference Proccedings Vol. 70 “ICCF8”, F. Scaramuzzi Ed. SIF, Bologna (2000) 409-417. [10] C. Sibilia, S. Paoloni, E. Castagna, F. Sarto, V. Violante, Analysis of Ni-Hydride Thin Film after Surface Plasmons Generation by Laser Technique Proceedings ICCF10, 24-29/08/03 Boston USA. [11] V. Violante, F. Sarto, E. Santoro, L. Capobianco, M. McKubre, F. Tanzella G.H Miley, N. Luo, P. J. Shrestha Study of Lattice Potentials on Low Energy Nuclear Processes in Condensed Matter, Proc. ICCF1024-29/08/03 Boston USA.