sea to source - university of georgia
TRANSCRIPT

Sea to Source
M E T H O D S TO O L K I T
LAND AND LAND-BASED SYSTEMS
Introduction
1. Land-Based Systems 1.1 Litter Transects
1.2 Input and Use of Plastic Packaging
1.3 Collection and Management of Solid Waste
1.4 Municipal Solid Waste Characterization
1.5 Photo Quadrat Litter Data Collection
2. Aquatic Systems and Air 2.1 Water Sampling for Microplastics
2.2 Sediment Sampling for Microplastics
2.3 Air Sampling for Microplastics
2.4 Riverbank Surveys for Fishing Debris
3. Knowledge, Attitudes, and Perceptions3.1 Key Informant Interviews
3.2 Focus Group Discussions
3.3 Household Surveys
3.4 World Café Workshop
3.5 Youth Outreach and Education
4. Technology and Tools4.1 Debris Tracker
4.2 Bottle Tag: Open Source Tracking Technology
Appendix1. Drift Cards
2. Riverine Stormwater Outfall Assessment
3. Characterizing Waste Sites
Acknowledgements
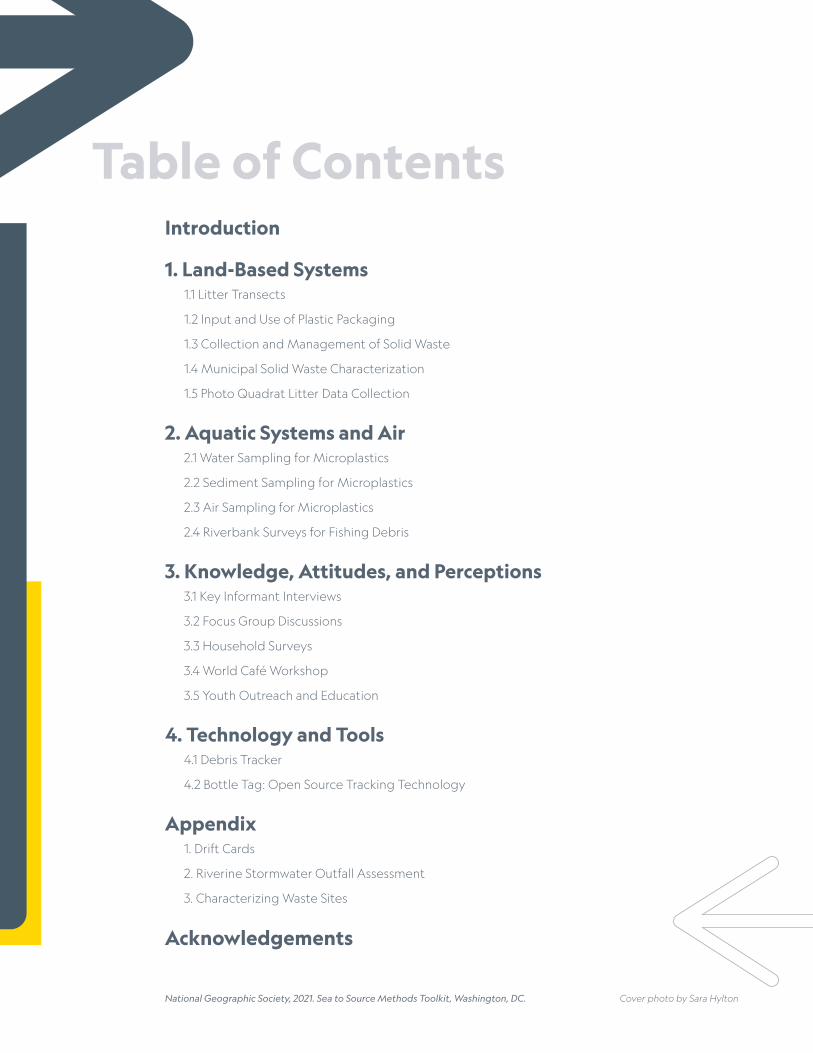
Table of Contents
Cover photo by Sara HyltonNational Geographic Society, 2021. Sea to Source Methods Toolkit, Washington, DC.
3 • INTRODUCTION
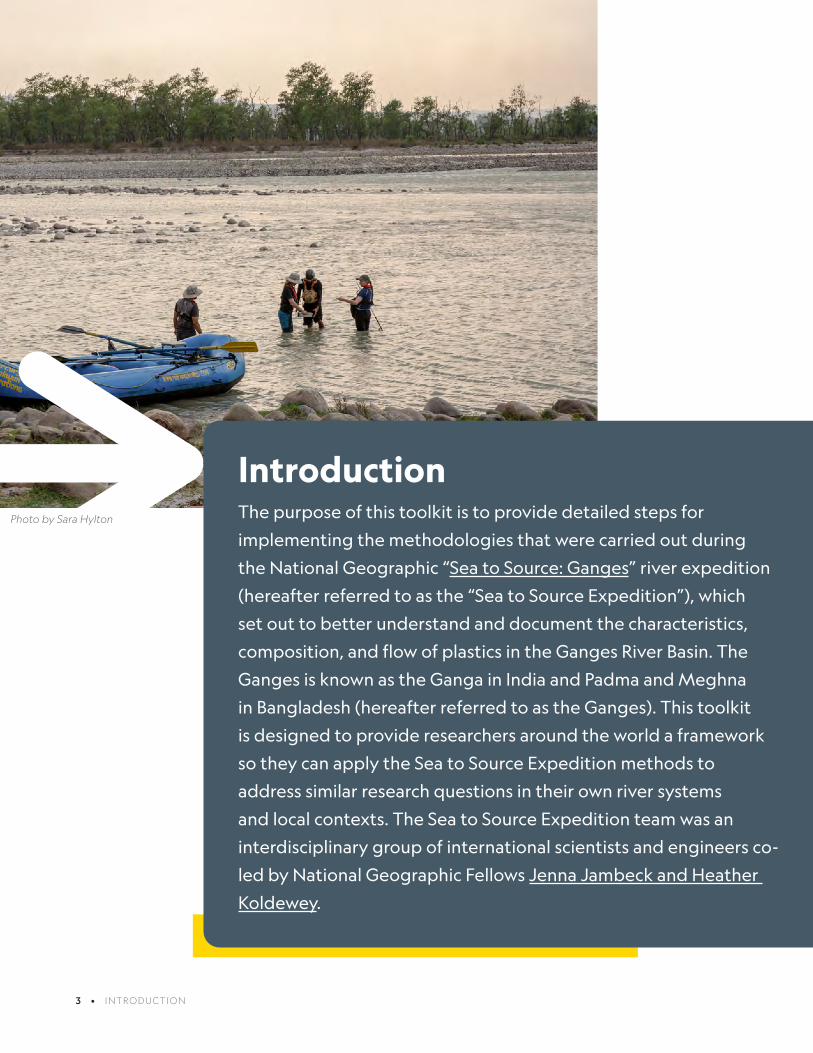
IntroductionThe purpose of this toolkit is to provide detailed steps for
implementing the methodologies that were carried out during
the National Geographic “Sea to Source: Ganges” river expedition
(hereafter referred to as the “Sea to Source Expedition”), which
set out to better understand and document the characteristics,
composition, and flow of plastics in the Ganges River Basin. The
Ganges is known as the Ganga in India and Padma and Meghna
in Bangladesh (hereafter referred to as the Ganges). This toolkit
is designed to provide researchers around the world a framework
so they can apply the Sea to Source Expedition methods to
address similar research questions in their own river systems
and local contexts. The Sea to Source Expedition team was an
interdisciplinary group of international scientists and engineers co-
led by National Geographic Fellows Jenna Jambeck and Heather
Koldewey.
Photo by Sara Hylton

INTRODUCTION • 4
This toolkit provides a library of methods that can be used to characterize a river basin from sea to source. Methods can be used individually or in combination with one another. These methods were chosen because they can be deployed rapidly, relatively easily by a few people, and provide useful scientific data. Using common methods across different studies ensures proper comparisons for data collected in various locations to answer larger regional and global questions.
Navigating the ToolkitThe Sea to Source Expedition team set out to fill gaps in knowledge, ranging from empirical data used to calibrate and validate models, to collecting data where none had been collected before. The expedition was designed to cover pre- and post-monsoon conditions, be a rapid assessment at each sampling location (11 sampling locations), and be appropriate to use in collaboration with local partners and communities. This toolkit contains the methods that were developed, tested, and then applied during the expedition (over a period of a year and a half). The methods were developed with global collaboration and coordination in mind—they pull from the knowledge and expertise of the interdisciplinary scientific co-leads, along with the entire expedition team and its partners. The methods provide outputs and results that are either complementary or comparable to current methods in use by other global programs to assess plastic pollution (such as the United Nations Environment Programme and the World Bank) and adhere to accepted scientific sampling methods and standards in the peer-reviewed literature. At the time this toolkit was completed, four manuscripts containing methods have been published and several more are in preparation. You can find the current list of publications associated with the Expedition here.
The methods in this toolkit cover Land-Based Systems (Section 1.0), Aquatic Systems and Air (Section 2.0), Knowledge, Attitudes, and Perceptions (Section 3.0), and Technology and Tools (Section 4.0), as well as some experimental methods that can be found in the Appendix. It was important to the entire team that these methods be open source, easy to follow, rapidly completed, and replicable. The reduction of plastic pollution on our planet will come from many interventions around the world. We believe data, especially at the local level, empower communities and decision-makers to choose a path forward that fits best for them and their contexts.
Photo by Sara Hylton

5 • INTRODUCTION
This document is designed to allow you to easily navigate directly to a particular method based on your research goals. In the next section you will find a decision matrix to compare methods, and examine the relative costs, time, level of effort, and equipment required for each method. Following the matrix is a list of guiding questions that may also help direct you to a particular method most appropriate for addressing the research questions you are trying to answer.
Decision MatrixMethod Special
Equipment/Skills Required
Use with Debris Tracker
Works well with Method
Ease of use
Cost Staff Needed*
Prep Time
Field Time**
1. Land-Based Systems
1.1 Litter Transects Smartphone 3 1.2, 1.3
1.2 Input and Use of Plastic Packaging
Smartphone, scale
1.1
1.3 Collection and Management of Solid Waste
Smartphone 3 1.1, 1.4
1.4 Municipal Solid Waste Characterization
Sorting table, bins, scale, etc.
1.3
1.5 Photo Quadrat Litter Data Collection
Quadrat, smartphone, analysis software
2. Aquatic Systems and Air
2.1 Water Sampling for Microplastics
Sampling equip., FTIR, boat (optional)
2.2
2.2 Sediment Sampling for Microplastics
Sampling equip., FTIR, boat (optional)
2.1
2.3 Air Sampling for Microplastics
Sampling equip., FTIR
2.4 Riverbank Surveys for Fishing Debris
Sampling supplies

INTRODUCTION • 6
3. Knowledge, Attitudes, and Perceptions
3.1 Key Informant Interviews (KII)
Note-taking supplies and/or recording device
3.2, 3.3
3.2 Focus Group Discussions (FGD)
Note-taking supplies and/or recording device
3.1, 3.3
3.3 Household Surveys
Note-taking supplies and/or recording device
3.1, 3.2
3.4 World Café Workshop
Large paper, markers for group work
3.5 Youth Outreach and Education
3
4. Technology and Tools
4.1 Debris Tracker Smartphone 3 1.1, 1.3, 3.5
4.2 Bottle Tag: Open Source Tracking Technology
Supplies to construct bottle tags, viewing software
Appendix: Experimental Methods
1. Drift Cards Materials to construct cards
3.5
2. Riverine Stormwater Outfall Assessment
Smartphone 3
3. Characterizing Waste Sites
Smartphone 3 1.3, 1.4
7 • INTRODUCTION
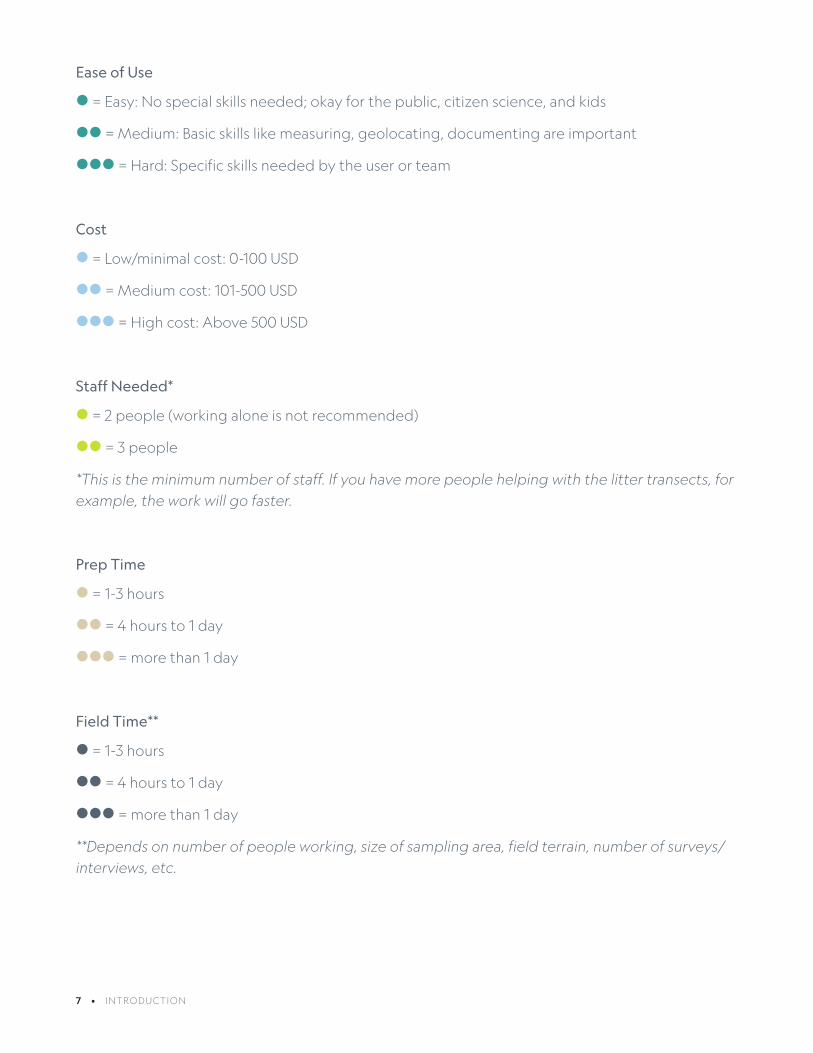
Ease of Use
= Easy: No special skills needed; okay for the public, citizen science, and kids
= Medium: Basic skills like measuring, geolocating, documenting are important
= Hard: Specific skills needed by the user or team
Cost
= Low/minimal cost: 0-100 USD
= Medium cost: 101-500 USD
= High cost: Above 500 USD
Staff Needed*
= 2 people (working alone is not recommended)
= 3 people
*This is the minimum number of staff. If you have more people helping with the litter transects, for example, the work will go faster.
Prep Time
= 1-3 hours
= 4 hours to 1 day
= more than 1 day
Field Time**
= 1-3 hours
= 4 hours to 1 day
= more than 1 day
**Depends on number of people working, size of sampling area, field terrain, number of surveys/interviews, etc.

INTRODUCTION • 8
Guiding Questions
I want to know... Refer to method...
1. Land-Based Systems
What types of litter end up on the ground in my community?
• Debris Tracker
• Litter Transects
• Photo Quadrat Litter Data Collection
What is the litter density (litter items/area) in a particular location?
• Litter Transects
• Photo Quadrat Litter Data Collection
What kinds of plastic packaging are used to wrap our most popular products?
• Input and Use of Plastic Packaging
Where do our most popular plastic-packaged products come from? Where are their manufacturers and parent companies located?
• Input and Use of Plastic Packaging
How are plastic and waste collected and managed in my community/study site?
• Collection and Management of Solid Waste
What is in the waste stream at my study site? What do people throw away in my community?
• Municipal Solid Waste Characterization
How much and what types of plastic are in the waste stream?
• Municipal Solid Waste Characterization
How and where does a community’s stormwater drain into other waterways? How much plastic is flowing through the stormwater system?
• Riverine Stormwater Outfall Assessment (experimental method)
Are there dumpsites and waste piles in my community? If so, where are they? How large are they?
• Characterizing Waste Sites (experimental method)
2. Aquatic Systems and Air
What is the quantity (particle count) and what are the types (polymers) of microplastics found in surface water?
• Water Sampling for Microplastics

9 • INTRODUCTION
What is the quantity (particle count) and what are the types (polymers) of microplastics found in the sediment?
• Sediment Sampling for Microplastics
What is the quantity (particle count) and what are the types (polymers) of microplastics found in the air?
• Air Sampling for Microplastics
What types of fishing activities occur and how is end-of-life fishing gear managed?
• Riverbank Surveys for Fishing Debris
How much (item count) and what types (polymers) of fishing gear are found on a shoreline/coastline?
• Riverbank Surveys for Fishing Debris
How far will a piece of litter travel if it ends up in a river?
• Bottle Tag: Open Source Tracking Technology
• Drift Cards (experimental method)
3. Knowledge, Attitudes, and Perceptions
What do the key influencers and leaders in the community think and feel about this issue? Who else should I be speaking with in the community?
• Key Informant Interviews (KII)
What do specific demographics within a community (such as women, men, or students) think and feel about this issue? How can I get a feel for the community context in less time than interviewing individuals?
• Focus Group Discussions (FGD)
What do individuals or families think and feel about this issue?
• Household Surveys
I have questions for multiple stakeholders (such as the government, industry, NGOs, community, academia, or leaders) to see what they think about this issue. Can they come together to converge on potential solutions to this issue?
• World Café Workshop
How can I engage students on this issue? • Youth Outreach and Education
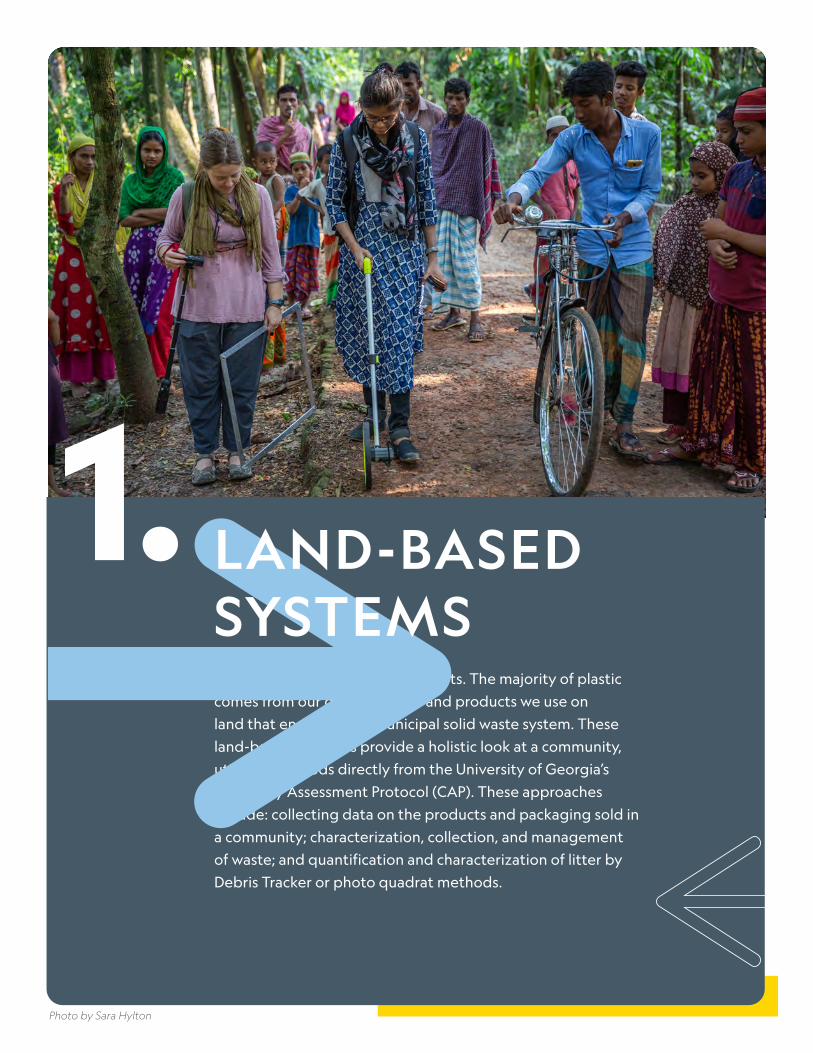
1.Land is where plastic pollution starts. The majority of plastic
comes from our daily activities and products we use on
land that end up in the municipal solid waste system. These
land-based methods provide a holistic look at a community,
utilizing methods directly from the University of Georgia’s
Circularity Assessment Protocol (CAP). These approaches
include: collecting data on the products and packaging sold in
a community; characterization, collection, and management
of waste; and quantification and characterization of litter by
Debris Tracker or photo quadrat methods.
LAND-BASED SYSTEMS
Photo by Sara Hylton
11 • LAND AND LAND-BASED SYSTEMS • LITTER TRANSECTS
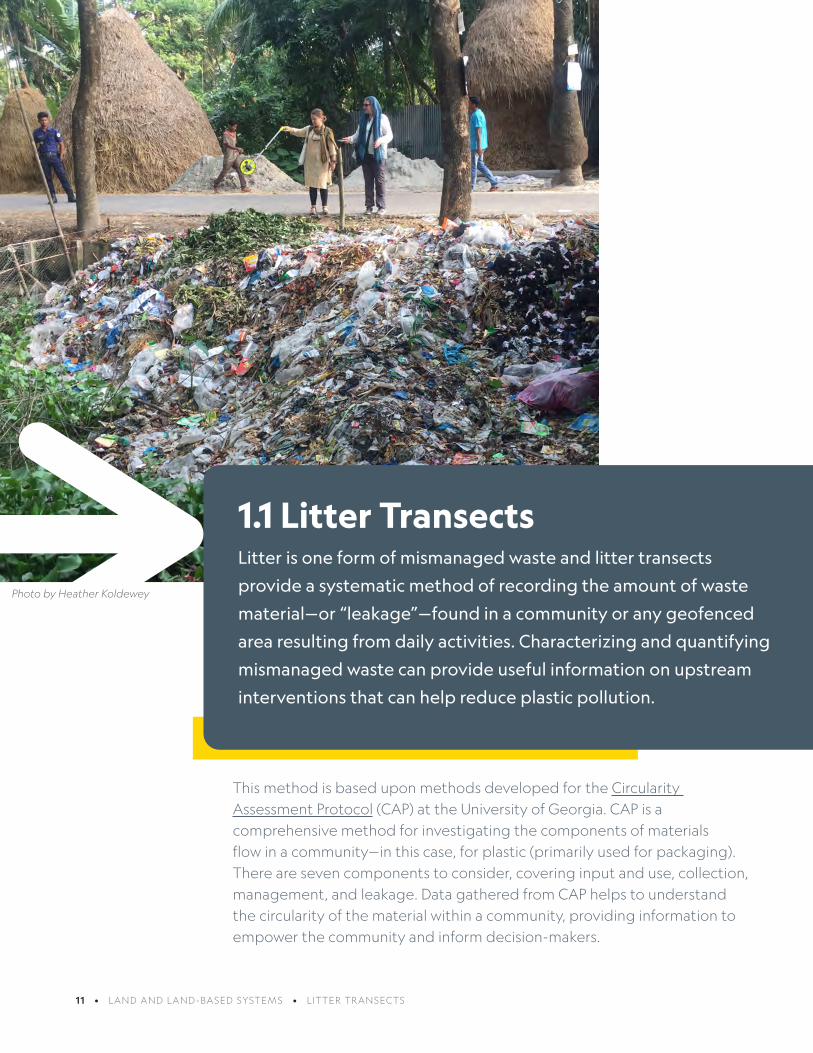
1.1 Litter TransectsLitter is one form of mismanaged waste and litter transects
provide a systematic method of recording the amount of waste
material—or “leakage”—found in a community or any geofenced
area resulting from daily activities. Characterizing and quantifying
mismanaged waste can provide useful information on upstream
interventions that can help reduce plastic pollution.
This method is based upon methods developed for the Circularity Assessment Protocol (CAP) at the University of Georgia. CAP is a comprehensive method for investigating the components of materials flow in a community—in this case, for plastic (primarily used for packaging). There are seven components to consider, covering input and use, collection, management, and leakage. Data gathered from CAP helps to understand the circularity of the material within a community, providing information to empower the community and inform decision-makers.
Photo by Heather Koldewey

LAND AND LAND-BASED SYSTEMS • LITTER TRANSECTS 12
Research Questions This Method Can Help Address• What are the most common litter items in the area?
• How much litter/leakage occurs in this area?
• How is litter/leakage changing over time? This is especially helpful if you are trying to track the effectiveness of any interventions to reduce litter/leakage.
Is this method right for you?
• Use of this method requires you to be able to safely walk 100 meters continuously and see 0.5 meter on either side.
• This method is best used in consultation and collaboration with city and community members so they can provide insight on what localized waste items are, why they are there, and what can be done about them.
• Anyone working with this method will also become more aware of litter/leakage in a city or community, which can be effective for outreach, education, and discussions of solutions.
Resources Needed• A tool for measuring a distance of 100 meters, such as a measuring wheel, predetermined
locations on a map, or a 100-meter tape measure. A phone path tracker may work, though these can have accuracy issues.
• Debris Tracker mobile app or clipboard, pen, and datasheet. More information about how to use Debris Tracker can be found later in the toolkit.
Personnel and ScalingThis is based upon the abundance of litter on the ground.
• For a low-quantity litter area (defined as fewer than 100 items per 100-meter transect), two people can do three 100-meter transects in about an hour.
❍ Depending on locations of transects and travel time, the team could do up to 12 transects/day.
Where to UseThis method can be used in any environment where a person can walk 100 meters;
this distance does not have to be in a straight line, but should be continuous. It is also
appropriate for any location that is legally walkable: cities, villages, remote areas,
mountains, coasts, or riverbanks.
13 • LAND AND LAND-BASED SYSTEMS • LITTER TRANSECTS
❍ Lighter littered areas take about 2-3 days to complete 27 transects.
• For a high-quantity litter area (defined as 500-1,000 items per 100-meter transect), two people can do one 100-meter transect in about an hour.
❍ Depending on locations of transects and travel-time, the team could do up to six transects/day.
❍ Cities with a high quantity of litter take about five working days to complete 27 transects.
• Work in pairs at a minimum, whether in low-quantity or high-quantity litter areas.
Example Outputs and Results• Litter Density: items per square meter (m2).
• Most common litter items found, such as cups, bottle caps, plastic bags, etc.
• Most common material found, such as plastic, paper, metal, etc.
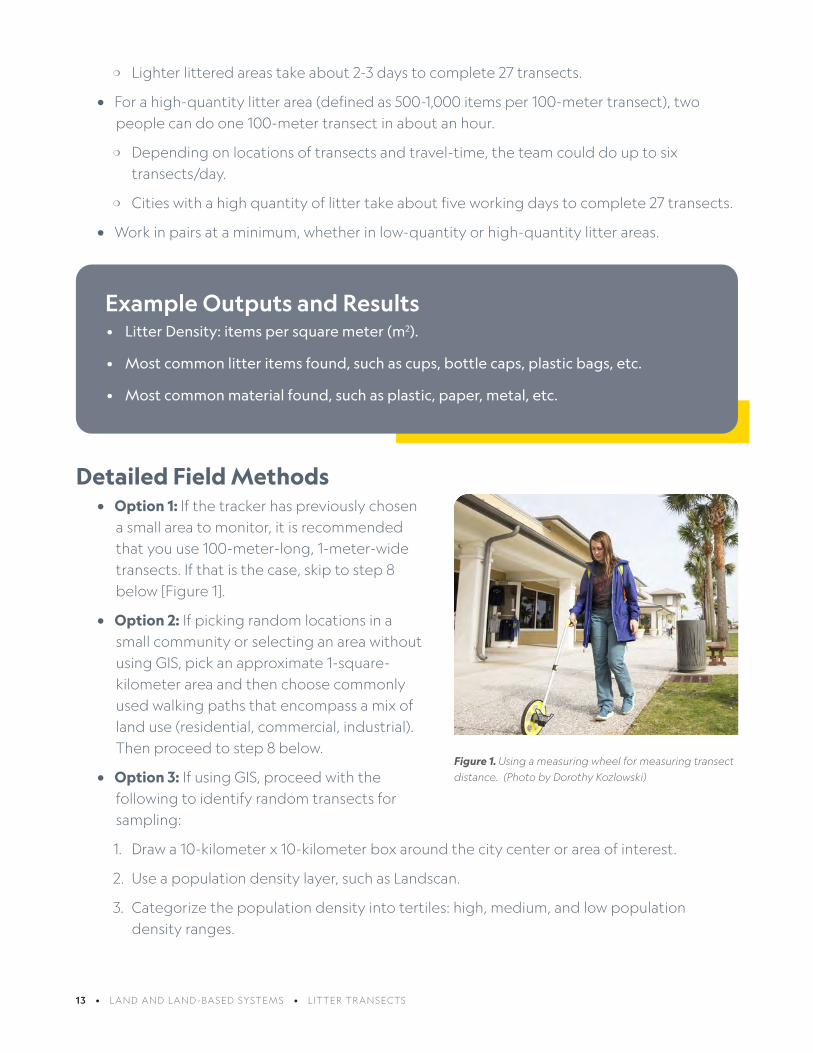
Detailed Field Methods• Option 1: If the tracker has previously chosen
a small area to monitor, it is recommended that you use 100-meter-long, 1-meter-wide transects. If that is the case, skip to step 8 below [Figure 1].
• Option 2: If picking random locations in a small community or selecting an area without using GIS, pick an approximate 1-square-kilometer area and then choose commonly used walking paths that encompass a mix of land use (residential, commercial, industrial). Then proceed to step 8 below.
• Option 3: If using GIS, proceed with the following to identify random transects for sampling:
1. Draw a 10-kilometer x 10-kilometer box around the city center or area of interest.
2. Use a population density layer, such as Landscan.
3. Categorize the population density into tertiles: high, medium, and low population density ranges.
Figure 1. Using a measuring wheel for measuring transect
distance. (Photo by Dorothy Kozlowski)

LAND AND LAND-BASED SYSTEMS • LITTER TRANSECTS 14
4. Use stratified random sampling (a tool in ArcMap) to pick three boxes, each 1-kilometer square, from each tertile.
5. In each 1-kilometer square, randomly pick three squares, each 200 meters long per side. These can be clustered or stratified, depending on time and safety.
6. One 100-meter-long x 1-meter-wide transects will be chosen in the field in each of the three 200-meter squares. They should be in walkable areas.
7. This is a total of three 1-kilometer boxes in each of the quantiles for a total of 27 transects per geofenced 10-kilometer x 10-kilometer area covering a city or community.
8. In the field when you arrive at the pre-identified location, choose a path that gets traveled by people—sidewalk, roadside, walking path—and find an edge, side, or gutter to follow. If you have more than one choice, flip a coin to choose which path to follow or which side to walk for data collection.
9. Take notes on the site characteristics: land use, weather, tracker names, site name, date, and time. Also enter the starting location of the transect into Debris Tracker.
10. Count every piece of litter as you walk 100 meters (measure 100 meters while walking or measure out before tracking). Use the Debris Tracker mobile app to count each item—you can find a tutorial on how to use Debris Tracker here.
• To understand temporal trends, follow up with a sampling frequency (for example, monthly) for the re-accumulation rate with about nine transects for subsequent sampling, one in each square kilometer.
• Consider the time of day for sampling (and take into account street sweeping). Early mornings and afternoons are often good times, but it is most important to note the time and status of the street upon transect data collection. When picking a time of day to conduct a transect, always consider weather and safety as well.
Figure 3. Map of litter data logged on three transects.
Figure 2. Random 1-square-kilometer areas with transect
locations.
15 • LAND AND LAND-BASED SYSTEMS • LITTER TRANSECTS
Safety and Other Considerations• Prepare a proper risk assessment before conducting
fieldwork, in accordance with your organization’s requirements. Points to consider:
❍ Always get any permits or approvals needed to collect these data and access sites to collect samples.
❍ Check the weather. Make sure that expected temperature, rain, and other indicators predict reasonably safe conditions for working outside.
❍ You will be doing a lot of walking, so prepare for this with proper clothing and gear. Wear items you would for a long day hike, taking into account potential changes in weather. Wear hats, covered shoes, and clothing appropriate for the weather. Wear bright colors or even a safety vest so you can be seen.
❍ Also be sure to wear clothing that adheres to the social and cultural norms of the community.
❍ Be prepared with any first aid requirements. This includes but is not limited to a basic first aid kit (for minor cuts, scratches, stings, etc.), plenty of water, and sun protection.
❍ Walking near traffic can be dangerous. Stay alert, and watch for vehicles of all kinds, such as cars, trucks, motorbikes, and bicycles. Make sure you are clearly visible.
❍ We recommend working with an in-community partner who can help navigate any local
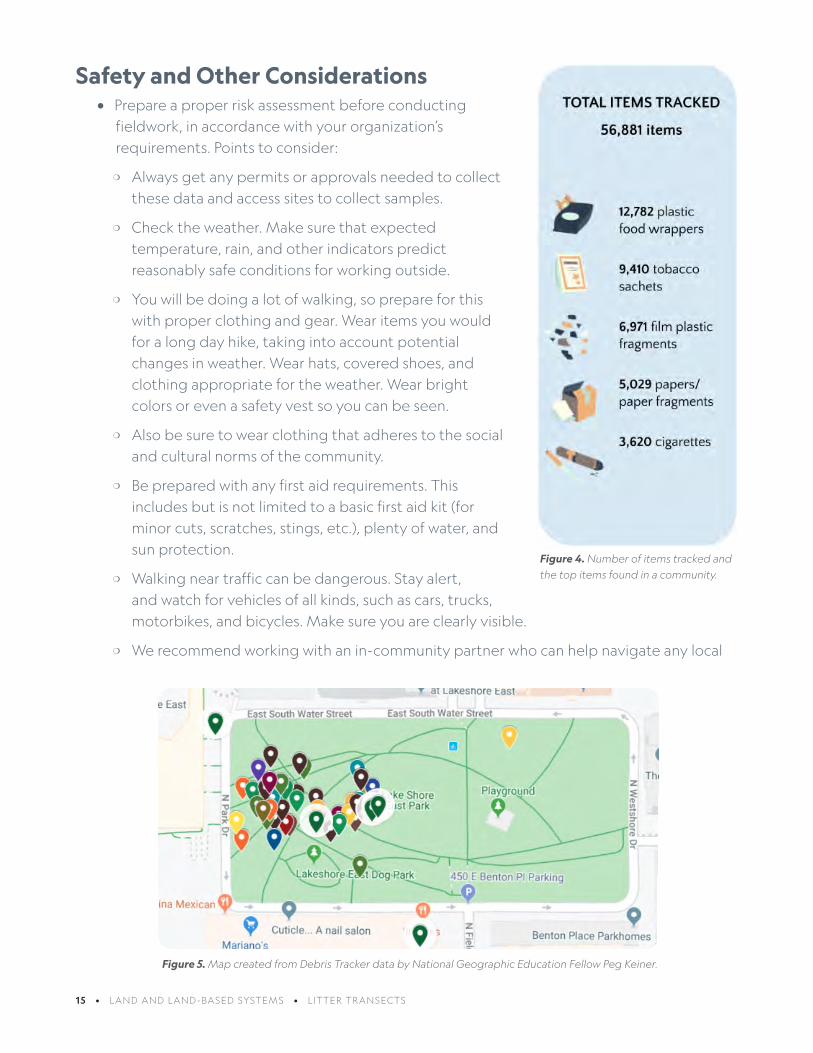
Figure 4. Number of items tracked and
the top items found in a community.
Figure 5. Map created from Debris Tracker data by National Geographic Education Fellow Peg Keiner.
LAND AND LAND-BASED SYSTEMS • LITTER TRANSECTS 16
health and safety concerns.
❍ Discuss any concerns, think through precautions, and bring the appropriate safety gear that you need to stay safe during the activity.
Detailed Analysis Methods• If using Debris Tracker, download data as a CSV file (guide here) and open it in a spreadsheet
program such as Google Sheets, Excel, etc.
• Use the spreadsheet to organize the data by material type (plastic, paper, metal, etc.) and item counts. The top material type and item can be found for each 1-square-kilometer transect or the entire city. These calculations can also be done by hand if data sheets are used or if you have no access to the software.
• Take a litter count for each transect and divide by 100 square meters to get litter-per-square-meter density.
• ArcGIS StoryMaps or Google My Maps can be used to create a map with the data and photos collected during the work.
• Using GIS, litter data can be further analyzed and potentially extrapolated with further analysis.
Further Reading• Youngblood, K., Brooks A., Das, N., Duncan, E., Khatoon, H., Maddalene, T., Napper, I.,
Nelms, S., Patel, S., Singh, A., Sultana, M.N., Verma, G., Zakir, T., Jambeck, J. (in prep.).
The characterization of litter in communities along the Ganges River.
• Use this tutorial to learn how to upload your Debris Tracker data to Google Maps.
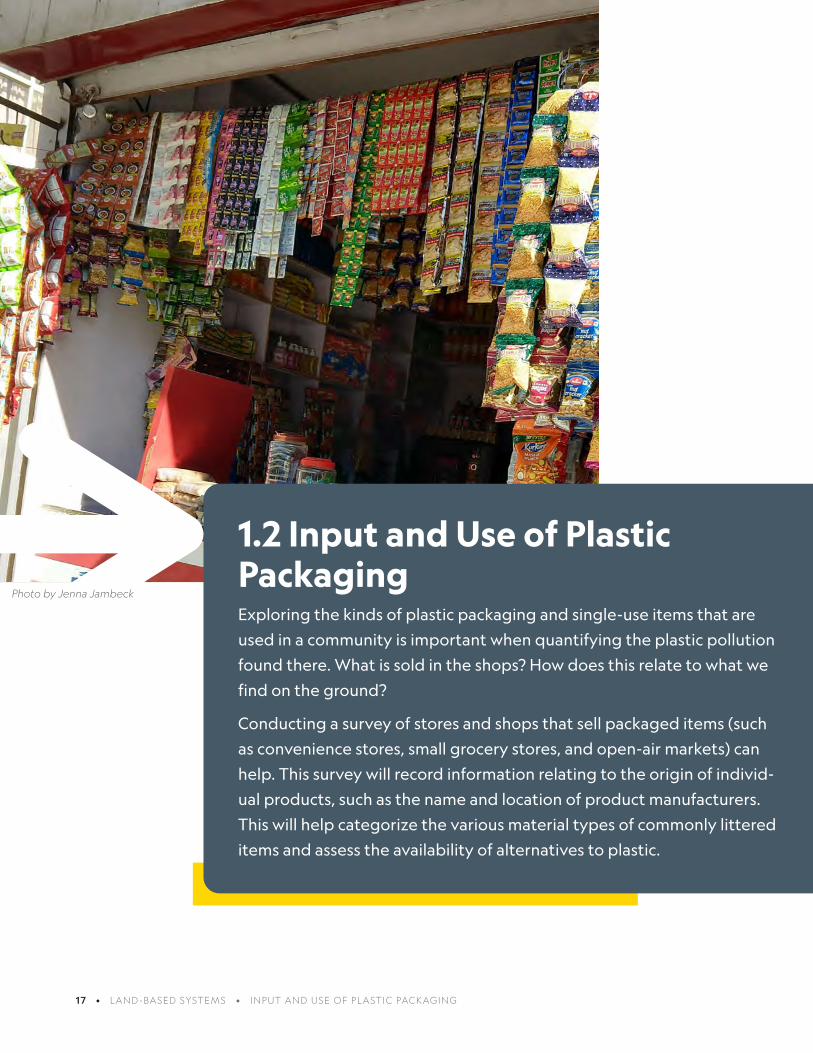
17 • LAND-BASED SYSTEMS • INPUT AND USE OF PLASTIC PACKAGING
1.2 Input and Use of Plastic PackagingExploring the kinds of plastic packaging and single-use items that are
used in a community is important when quantifying the plastic pollution
found there. What is sold in the shops? How does this relate to what we
find on the ground?
Conducting a survey of stores and shops that sell packaged items (such
as convenience stores, small grocery stores, and open-air markets) can
help. This survey will record information relating to the origin of individ-
ual products, such as the name and location of product manufacturers.
This will help categorize the various material types of commonly littered
items and assess the availability of alternatives to plastic.
Photo by Jenna Jambeck

LAND-BASED SYSTEMS • INPUT AND USE OF PLASTIC PACKAGING • 18
This method is based upon methods developed for the Circularity Assessment Protocol (CAP) at the University of Georgia. CAP is a comprehensive method for investigating the components of materials flow in a community—in this case, for plastic (primarily used for packaging). There are seven components to consider, covering input and use, collection, management, and leakage. Data gathered from CAP helps to understand the circularity of the material within a community, providing information to empower the community and inform decision-makers.
Research Questions This Method Can Help Address• What types of packaging are used for commonly littered items?
• What is the ratio between the product’s price and its overall volume?
• How much plastic (by weight) is generated by commonly littered items?
• What alternatives to plastic are available?
• What is the price difference between plastic packaging and alternatives?
Is this method right for you?• This method is designed to be used in conjunction with the Litter Transect method.
• Working with local partners is encouraged and can help identify locations for surveying stores and other points of sale.
• Funding must be available to purchase samples of common items.
Resources Needed• Ability to speak the local language or a translator, to communicate with shopkeepers
when possible.
• Cash to purchase samples of common items.
• Scale to measure plastic packaging samples with a 0.1-gram degree of accuracy.
Where to UseThis method can be used in any city or village where there are stores, markets, or
vendors; areas sampled are typically limited to those also sampled using the Litter
Transect method.

19 • LAND-BASED SYSTEMS • INPUT AND USE OF PLASTIC PACKAGING
Personnel and Scaling• Store surveys are typically conducted in groups of three (see field methods below for
details). Two people can conduct three surveys in about about 90 minutes, assuming limited travel time between stores.
Example Outputs and Results • A map noting the manufacturing location and parent company location of popular
products that are sold in stores in the city/community. Such a map can illustrate how
far plastic-packaged products are shipped.
• A chart or graph that relates the mass or quantity of a product in ratio to the mass of
the packaging. For example, a food wrapper may have a mass of 3 grams and hold 8
ounces of a snack (such as chips or crisps).
• Images that show examples of typical products and packaging that are for sale in
shops and from vendors [Figure 3 and 4].
Detailed Field Methods• Sampling sites should correspond with litter
transect sites (see detailed field methods of the Litter Transects method for site selection options).
• Conduct surveys at a minimum of three stores within a 1-square-kilometer litter sampling area whenever possible. For a good cross-section of businesses, a convenience store, a grocery store, and a small vendor should be visited for each litter sampling area (three stores per square kilometer).
❍ Some communities will have limited options, so survey what is available. In many cases, a community might only be served by a single store; in that case, survey that lone store. The Sea to Source Expedition encountered this situation in many communities, and collected helpful survey information nonetheless.
Figure 1. There are many alternatives to plastic packag-
ing. This shop uses paper bags instead of plastic. (Photo
by Kathryn Youngblood)

LAND-BASED SYSTEMS • INPUT AND USE OF PLASTIC PACKAGING • 20
❍ We recommend establishing prior contact with the community you are working in (in addition to getting the necessary permits required by local regulations)—making local people aware of your work can help the process. Prior contact with store owners and local shop associations can be helpful, or even required by local regulations. While this work can be conducted without speaking with the store staff itself, conversations with them often provide insight on context, background, and information on the most popular items.
• Determine which brands occupy the most shelf space—an indication of the most popular brands of each product—and buy the top three brands of each item. When possible, you can also ask the shopkeeper which brands are the most popular. If products are available in different sizes, select the smallest available size.
• This method focuses on the following item categories:
❍ Beverages
❍ Chips/crisps (if another snack item is more popular, then substitute)
❍ Candy/sweets (if another snack item is more popular, then substitute)
❍ Tobacco
❍ Other: Include other popular items (such as personal care products and sachets) that appear to be community favorites based on key observations from litter transects.
• Record key information about each product. You can do this immediately, or later on as long as samples are carefully labeled and stored. This information should include:
❍ The location (GPS information is the best source) and name of the store it came from
❍ Size (by weight and volume) of the product as reported on the package
❍ Cost (note the local currency)
❍ After separating the product from the package, weigh and record the weight in grams of (1) weight of packaging (2) weight of product.
❍ From information on the packaging, record the location (1) where the product was manufactured (2) the product’s parent company.
❍ Type of plastic/material (and describe the packaging in detail)
• Film plastic? If possible, note whether it is multilayer or metalized.
Figure 2. This vendor wraps food in biodegradable leaves
instead of plastic or other synthetic materials. (Photo by
Jenna Jambeck).

21 • LAND-BASED SYSTEMS • INPUT AND USE OF PLASTIC PACKAGING
• Rigid plastic?
• Coated paperboard?
• Can you tell if it is recyclable? (Some packaging indicates whether it can be recycled or has a resin code on it. Note: these codes are usually seen only in North America.)
• Identify resin if there is a code printed on the package.
• Optional deep dive: Identify plastic type using Fourier transform infrared (FTIR) spectrometer analysis in laboratory.
• Collect a sample of the store’s most commonly used retail bag. Record the following:
❍ Material type: Plastic, paper, other (note type).
❍ Color.
❍ Size: Lay flat and measure length without handles and width. If the bag has handles, measure their length.
❍ Weigh bag at the lab or analysis area and record weight in grams.
❍ Price, if available from the shop owner.
• Document alternatives, including reusable options, if they are available instead of plastic in the stores where products were purchased [Figures 1 and 2].
❍ Record the type and price of each alternative. Examples: reusable glass bottles and other bulk sale or Reusable systems.
Figure 3. Photo survey of products for
sale and examples of plastic packaging.
(Photo by Jenna Jambeck)
Figure 4. Photo survey of products for sale and examples of plastic packaging.
(Photo by Jenna Jambeck)

LAND-BASED SYSTEMS • INPUT AND USE OF PLASTIC PACKAGING • 22
❍ Record the price of the plastic option.
❍ In each store surveyed, take photographs of the shelves displaying products.
Safety and Other Considerations• Prepare a proper risk assessment before conducting fieldwork, in accordance with your
organization’s requirements. Points to consider:
❍ Always get any permits or approvals needed to collect these data and access sites to collect samples.
❍ Check the weather. Make sure that expected temperature, rain, and other indicators predict reasonably safe conditions for working outside.
❍ You will be doing a lot of walking, so prepare for this with proper clothing and gear. Wear items you would for a long day hike, taking into account potential changes in weather. Wear hats, covered shoes, and clothing appropriate for the weather. Wear bright colors or even a safety vest so you can be seen.
❍ Also be sure to wear clothing that adheres to the social and cultural norms of the community.
❍ Be prepared with any first aid requirements. This includes but is not limited to a basic first aid kit (for minor cuts, scratches, stings, etc.), plenty of water, and sun protection.
❍ Walking near traffic can be dangerous. Stay alert, and watch for vehicles of all kinds, such as cars, trucks, motorbikes, and bicycles. Make sure you are clearly visible.
❍ We recommend working with an in-community partner who can help navigate any local health and safety concerns.
❍ Discuss any concerns, think through precautions, and bring the appropriate safety gear that you need to stay safe during the activity.
Detailed Analysis Methods• After sampling, head back to the lab and weigh all packaging from each store using a scale
and record weight to nearest 0.1 gram (one-tenth of a gram).
• Use Excel or a similar spreadsheet program to compile the weight of plastic generated, product volume, and price for common littered item types. Record item type, brand, manufacturer, manufacturing location, parent company, and parent company location.
• Some manufacturing and parent company information may be available on product packaging, but further internet research will likely be required. Appropriate sources of information may include company websites or business registries.
• GIS or similar software can be used to map the flow between the parent company, manufacturer, and the sampling site.

23 • LAND-BASED SYSTEMS • INPUT AND USE OF PLASTIC PACKAGING
• Summarize the kinds of alternatives to plastic that were available at each store.
• Use the above quantitative data to inform the narrative about what products the community typically buys, where the products come from, and how this relates to what is found littered on the ground in the form of mismanaged waste.

24 • LAND-BASED SYSTEMS • COLLECTION AND MANAGEMENT OF SOLID WASTE
1.3 Collection and Management of Solid WasteWhen a community’s waste collection and management system
is designed well, it may go unnoticed. When designed for
each community’s context, these services play a critical role in
protecting human health and the environment. This method
provides a systematic approach to investigating, describing,
and engaging the community about its waste collection and
management system. Many people know little about how their
community’s waste system works and this method can help spread
awareness within a community.
This method is based upon methods developed for the Circularity Assessment Protocol (CAP) at the University of Georgia. CAP is a comprehensive method for investigating the components of materials flow in a community—in this case, for plastic (primarily used for packaging). There are seven components to consider, covering input and use, collection, management, and leakage. Data gathered from CAP helps to understand the circularity of the material within a community, providing information to empower the community and inform decision-makers.
Photo by Heather Koldewey
LAND-BASED SYSTEMS • COLLECTION AND MANAGEMENT OF SOLID WASTE • 25
Research Questions This Method Can Help Address • How much of the community’s waste collection is handled by the government?
• Are there private entities that collect waste?
• Is there an informal sector, separate from the government or the private sector, that collects waste? If so, what percentage of waste collection is that sector responsible for?
• What types of facilities manage solid waste within the community? Where are they?
Is this method right for you?
• This method is designed to be used in conjunction with the Litter Transect method (for gathering data in random locations in the city), as well as other methods that characterize a community or city’s circularity, but can also be used on its own to specifically address questions around waste collection and management.
• Contacts with the local government or municipality are required for permission to visit sites and for interviews. They may also be able to provide existing background data.
Resources Needed• Pen and paper for recording notes.
• Voice recording device. A mobile phone recording app is sufficient.
• Camera, preferably with integrated GPS. A camera on a mobile phone is sufficient.
• Mobile smartphone for mapping bins/locations with Debris Tracker mobile app.
Personnel and Scaling • For reasons of safety and efficiency, having two people carry out the photographic survey
work and interviews is highly recommended.
• Survey work takes approximately one hour per 1-square-kilometer area.
• Interviews typically take a maximum of one hour.
Where to UseThis method can be used in any city, town, or village.

26 • LAND-BASED SYSTEMS • COLLECTION AND MANAGEMENT OF SOLID WASTE
Example Outputs and Results• Types of waste and recycling collection in a city/community.
• Percent coverage of collection in a city/community.
• Mapped and photographic surveys of trash cans and recycle bins inrandom sampling areas.
Detailed Field Methods• Identify trash/rubbish bins in the Litter Transects.
❍ Sampling sites should correspond with litter transect sites when those two methods arebeing conducted in conjunction (see Detailed Field Methods for Litter Transects for siteselection options).
❍ Log the location and status of each trash can and recycle bin in each litter transect.
» What type of collection bin is it?
» Is it overflowing or otherwise hindered? Note how and why.
» Is it clean and well maintained?
❍ Photograph at least one bin that is representative of each of the different kinds ofbins observed [Figure 1].
• Interview a local government official who has detailed knowledge of the community’ssolid waste collection practices (sample interview questions can be found here), or obtaininformation from solid waste management reports and other official publications.
• If possible, join a typical collection route, such as a public or residential collection, to observecollection practices.
• Photograph and document all collection and waste management practices [Figure 2] asobserved within the sampling area.
• Ask local government officials or other contacts to visit one representative wastemanagement facility from each category that exists in a community (find out what existsfrom reports or interviews). These facilities can include: Transfer stations or temporaryholding sites, waste processing sites, recycling/materials recovery facilities, sorting facilities,compost facilities, anaerobic digestion facilities, landfills, and any other sites where materialsor waste are taken after collection for processing, sorting, or management.
❍ Document information about these facilities, including location (using GPS coordinates onthe map in Debris Tracker), and take photographs of all processes.

LAND-BASED SYSTEMS • COLLECTION AND MANAGEMENT OF SOLID WASTE • 27
❍ At each facility, take notes on the quantity of waste managed annually, the types of material accepted, and other significant activities at the site.
❍ Interview on-site staff for more details as possible.
• During the interview process, inquire if an informal waste sector exists. If it does:
❍ Find out the extent of the informal collection and what is being collected (such as specific items collected, specific areas the informal sector works, etc.).
❍ You can also observe, interview community members and workers, and visit informal management facilities [Figure 3] to document their operations the same way the formal sites were documented in the above instructions.
❍ Be sure to get permission from a local community member if you visit an informal collection site.
Safety and Other Considerations• Prepare a proper risk assessment before conducting fieldwork, in accordance with your
organization’s requirements. Points to consider:
❍ Always get any permits or approvals needed to collect these data and access sites to collect samples.
❍ Check the weather. Make sure that expected temperature, rain, and other indicators predict reasonably safe conditions for working outside.
❍ You will be doing a lot of walking, so prepare for this with proper clothing and gear. Wear items you would for a long day hike, taking into account potential changes in weather. Wear hats, covered shoes, and clothing appropriate for the weather. Wear bright colors or even a safety vest so you can be seen.
Figure 1. Dual-purpose bin with separate trash and recy-
cling compartments. (Photo by Jenna Jambeck)
Figure 2. Waste processing facility in Rishikesh, India.
(Photo by Jenna Jambeck)

28 • LAND-BASED SYSTEMS • COLLECTION AND MANAGEMENT OF SOLID WASTE
❍ Also be sure to wear clothing that adheres to the social and cultural norms of the community.
❍ Walking near traffic can be dangerous. Stay alert, and watch for vehicles of all kinds, such as cars, trucks, motorbikes, and bicycles. Make sure you are clearly visible.
❍ Be prepared with any first aid requirements. This includes but is not limited to a basic first aid kit (for minor cuts, scratches, stings, etc.), plenty of water, and sun protection.
❍ If visiting waste facilities, take special care to assess risks beforehand and recognize that hazardous materials and conditions may exist there.
❍ We recommend working with an in-community partner who can help navigate any local health and safety concerns and also help identify appropriate local contacts for interviews.
❍ Discuss any concerns, think through precautions, and bring the appropriate safety gear that you need to stay safe during the activity.
Detailed Analysis Methods• Summarize notes and photos to describe and generally characterize the city/community
collection system that you observed.
• Along with photographs, GIS or similar software can also be used to map the trash cans, facilities, or other notable locations. ArcGIS StoryMaps may be helpful.
• Summarize the data collected from the interviews and add them to your recorded observations.
Figure 3. Informal collection and processing of materials
for recycling in India. (Photo by Jenna Jambeck)

29 • LAND-BASED SYSTEMS • MUNICIPAL SOLID WASTE CHARACTERIZATION
1.4 Municipal Solid Waste CharacterizationData collected using this method can provide information on
solid waste composition produced by a community. This data can
be useful for these municipalities, the public, and researchers,
particularly in those geographic areas where data is poor or
nonexistent. Data collection can prompt further analysis.
The information obtained through comprehensive waste characterization enables us to plan waste reduction measures and establish recycling programs, while considering the appropriate use of limited resources. Waste sorting events conducted one or two times a year provide a snapshot of a community waste stream. Depending on how variable the waste generation characteristics are, these sorting events may not encompass seasonality or other local events over time.
Photo by Sara Hylton
LAND-BASED SYSTEMS • MUNICIPAL SOLID WASTE CHARACTERIZATION • 30
Research Questions This Method Can Help Address • What waste components (such as plastic, paper, metal, etc.) are most commonly found
within a given geographic area?
• What percentage of the waste is recyclable?
• How can communities reduce the amount of waste being dumped into landfills?
• How could a given community effectively implement the four Rs—Reduce, Reuse, Recycle, Recover—to reduce the use of virgin resources and move towards a circular economy?
Is this method right for you?
• This method can be used if places where trash is deposited are easily accessible to you for sampling purposes. Locations include bins, dumpsites, or locations where vehicles empty their waste.
• The use of this method requires obtaining or constructing a sorting table suitable for sorting waste.
• Only use this method if it is safe to carry out sampling at your chosen location (such as a dumpsite or other sampling site).
• This method is useful if municipal solid waste (MSW) hauling vehicles serve distinct areas of the city (so they can be associated with particular locations) and are available for sampling.
• A single sampling event is a snapshot in time. It cannot replace a full, long-term waste composition study, but it does provide insight into what kinds of waste are generated, based on the samples sorted. A full waste characterization study would sample at least four times a year, or once in each season, and sorts would be performed over a five-day work week.
• The sampling process should be supplemented with information from the municipality collected during the Collection and Management of Solid Waste method in order to extrapolate waste generation rates.
Where to Use• This method can be used in any defined geographic area or by an event. Examples
include but are not limited to:
❍ A city, community, or university.
❍ Large sporting events, religious services, other gatherings.
• Samples are collected from bins (such as trash cans and recycle bins), collection vehicles, or landfills/dumpsites.
31 • LAND-BASED SYSTEMS • MUNICIPAL SOLID WASTE CHARACTERIZATION
Resources Needed• A waste-sorting table with a 5-cm wire mesh screen. Below is an overview of how to
construct the table:
❍ Build the frame of the table using standard lumber in lengths of roughly two to three meters that can be cut to size, ideally from scrap or recycled materials. Build the table approximately 2 meters long. (Shorter can work, but limits how many people can sort at the same time. To allow more people to help sort, build a longer table.)
❍ Once the frame of the table is built, the top should be covered with a 5-cm mesh screen, or similar, using a staple gun or industrial stapler to attach the wire mesh to the table.
• Heavy-duty tarpaulin, 2 x 3 meters or larger.
• For sorting, each team member needs the following personal protective equipment:
❍ Rain suit or waterproof overalls to protect clothing and skin
❍ Work gloves
❍ Nitrile gloves
❍ Dust masks
❍ Safety glasses
• One pack of heavy duty 100-liter contractor trash/garbage bags.
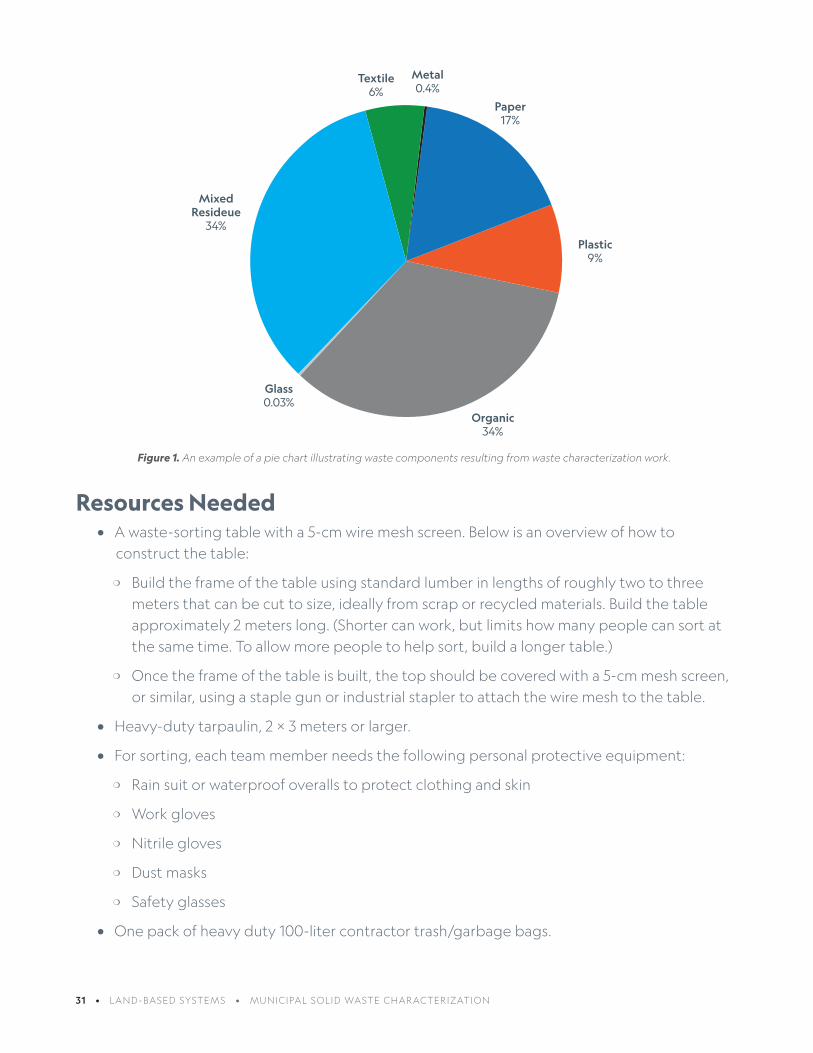
Mixed Resideue
34%
Textile6%
Metal0.4%
Paper17%
Plastic9%
Organic34%
Glass0.03%
Figure 1. An example of a pie chart illustrating waste components resulting from waste characterization work.

LAND-BASED SYSTEMS • MUNICIPAL SOLID WASTE CHARACTERIZATION • 32
• Trash cans, bins, or buckets to hold each of the sorted waste components for weighing plastics, aluminum, liquids, etc. Trash bags can be used if needed.
• Scale with a range of roughly 0.5 kilogram to weigh trash components. If weighing bags, a hanging scale is easiest. If weighing cans/bins, an industrial scale works best.
Personnel and Scaling • As an example, eight people can sort 250 to 780 kilograms of waste per day depending on
conditions, type of waste, and the number of categories for sorting. You may scale your expectations from that example. Keep in mind that more categories take more time.
Example Outputs and Results• This method will yield data indicating the composition of a community’s waste,
expressed as a percentage of each component of waste by mass (wet weight). A pie chart of waste characterization (expressed as percent by mass) can be generated from the data [Figure 1].
Detailed Field Methods• Construct a sieve sorting table.
See Resources Needed section above and the wood table shown in Figure 2.
• Sample selection depends on your goals for characterization. In other words, if you want to know what kinds of waste is generated by a school, mall, or business area, collect their waste for sorting. Wonder what kinds of trash are left behind after a public event, such as a fair or sporting event? Audit the waste generated by those events. For a targeted location or event, sampling can be conducted from bins in chosen locations and during times that contain the waste of interest for auditing. For waste that is representative of trash that ends up at a community landfill or dumpsite, select garbage bags from the trucks/carts dumping fresh waste at the landfill that are representative of trash coming from different parts of the
Figure 2. Dumping trash for sorting on the sieve sorting table. (Photo by
Dorothy Kozlowski/UGA)

33 • LAND-BASED SYSTEMS • MUNICIPAL SOLID WASTE CHARACTERIZATION
community. Work with the haulers, collectors, or the site manager to get a sense of what is representative before sampling. Waste already in the landfill, called “legacy waste,” can be subsampled for sorting. Be aware that in dumpsites that are subject to open picking, the legacy waste likely represents waste that has had valuable items removed, while fresh waste from the trucks will not have been picked over, and will better represent what makes it to the landfill. The waste coming to the landfill is managed waste and not waste as generated—waste picking of valuable items can occur at the site of generation, in places such as trash cans, dumpsters, or homes.
• Open the bags onto a plastic tarpaulin and spread out using a shovel to look for hazardous components, such as needles or medical waste. If any hazards are found, do not touch them—safety is of the utmost importance. Make note of them and do not put them on the table to be sorted. Contact the on-site manager or your community liaison about the items and follow their guidance on how to dispose of them.
• Once any hazardous elements have been removed, use a shovel to place the remaining waste onto the sorting table [Figure 2].
• Shake the table to agitate the screen, or tap on the screen with a tool or your hand, so items that fit through the screen fall through like a sieve.
• Waste items small enough to fall through the mesh grid are called the “fines” [Figure 5]. These are all weighed together as an aggregate mass, photographed, and assessed visually to estimate the organic content, meaning the percent by volume that is food waste.
• The items that remain on the screen are sorted by hand into categories. The waste is typically categorized into between six and nine different categories; examples are shown in Table 1. Categories can be expanded in greater detail as desired. For example, plastics can be further sorted into both rigid and film plastic [Figures 3 and 4].
• Food waste should include both food and soiled paper, since soiled paper, though not suitable for recycling, can still be composted.
• Any item that is not identifiable is placed in the “Other” category. This category can also apply to odd/rare items.
• Site-specific categories can also be created, since less-common waste components may be found in quantity at a particular site, but not be found at most other waste sites.
Figure 3. Sorting waste at the sieve sorting table. (Photo by Dorothy
Kozlowski/UGA)

LAND-BASED SYSTEMS • MUNICIPAL SOLID WASTE CHARACTERIZATION • 34
• Each category of waste (such as plastic, metal, or other material) is then weighed to the nearest 0.5 kilogram. One way to do this is to fill buckets, bins, or bags. Weigh the bucket or bag after it is completely filled. A hanging scale works well for a bag. If buckets or bins are used, first weigh them empty and record the weight of this container, then weigh it filled. Next, subtract the weight of the empty container from the overall weight of it when filled with waste. This will prevent the weight of the container from being included in the weight of the trash.
• Record the mass in the respective waste category and designate a new bag or reuse the emptied bucket for that category.
• Approximately 250 to 780 kilograms of waste can be sorted in a day using this method.
Safety and Other Considerations• Prepare a proper risk assessment before conducting fieldwork, in accordance with your
organization’s requirements. Points to consider:
❍ Always get any permits or approvals needed to collect these data and access sites to collect samples.
❍ Check the weather. Make sure that expected temperature, rain, and other indicators predict reasonably safe conditions for working outside.
❍ Take particular care around hazardous materials in the waste samples. Be alert for sharps, explosives, or toxic or clinical waste. Do not sort these items. Screen the waste before sorting to remove these hazardous items and notify the manager per local regulations.
❍ Be prepared with any first aid requirements. This includes but is not limited to a basic first aid kit (for minor cuts, scratches, stings, etc.), plenty of water, and sun protection.
Figure 4. Placing waste in proper bins, separated by
material type, for weighing following a waste sort. (Photo
by Dorothy Kozlowski/UGA)
Figure 5. Waste “fines” that have fallen through the screen
and will not be further sorted. (Photo by Dorothy Kozlo-
wski/UGA)

35 • LAND-BASED SYSTEMS • MUNICIPAL SOLID WASTE CHARACTERIZATION
❍ Working with waste can be hazardous. Perform all work according to local and national regulations and training, including Occupational Safety and Health, Hazardous Waste Operations and Emergency Response (HAZWOPER) training, or other programs pertinent to the area.
❍ Personal protective equipment is essential. Necessary items include:
» Coveralls: rain suit, waterproof overalls, or pants/trousers and long sleeve shirt at least long enough to protect skin from coming into contact with waste.
» Nitrile gloves covered by work gloves: preferably puncture-resistant to protect hands against sharp edges.
» Safety glasses: to protect eyes from splashing liquids or mud.
» Dust masks: recommended to protect from airborne dust, splashing liquids, etc.
» Remember that you are working with trash, which presents particular health risks. Check medical history to make sure tetanus shots are up to date for all participants.
❍ Check the weather. Make sure that expected temperature, rain, and other indicators predict reasonably safe conditions to work outside. Also make sure that personnel are equipped with hats, closed-toe shoes, clothes appropriate for the temperature, and wear sunscreen as necessary. Wear bright colors or even a safety vest so you can be seen.
❍ Waste sorting is not recommended if public health conditions present a risk to personnel.
❍ Waste sorting is not recommended for children under the age of 18.
Detailed Analysis Methods• Calculate the total mass of waste sorted by adding up the weights of each type of
trash collected.
• Enter data into a spreadsheet—using Excel, Google Sheets, or other spreadsheet software—and calculate the percent contributed by each component. This calculation is done by dividing the mass of each component by the total mass of all waste sorted.
Table 1: Recommended Waste Categories
Biodegradable Fraction of Waste Non-Biodegradable Fraction of Waste
Paper Products Plastics
Food waste Metals
Rubber, Leather, and Textile Glass
Yard waste Other
Wood

LAND-BASED SYSTEMS • MUNICIPAL SOLID WASTE CHARACTERIZATION • 36
Further Reading• CPHEEO. (2016). Municipal Solid Waste Management Manual Part II. Central
Public Health and Environmental Engineering Organisation MInistry Of Urban Development, 1–604. http://cpheeo.gov.in/upload/uploadfiles/files/Part2.pdf
• ASTM Standard. (2012). Standard Guide for Sampling Waste Piles. Annual Book of ASTM Standards, 96 (Reapproved), 1–11.
• Max J Krause and Timothy G Townsend (2014) Rapid Waste Composition Studies for the Assessment of Solid Waste Management Systems in Developing Countries. Int J Waste Resources 4: 145. doi:10.4172/2252-5211.1000145
• McCauley-Bell P, Reinhart DR, Sfeir H, Ryan BO (1997) Municipal Solid Waste Composition Studies. Practice Periodical of Hazardous Toxic and Radioactive Waste Management 1: 158–163.

37 • LAND-BASED SYSTEMS • PHOTO QUADRAT LITTER DATA COLLECTION
1.5 Photo Quadrat Litter Data CollectionThis survey method is used to determine litter density by
intensively surveying all litter in small, defined areas. Quadrats
(fixed frames of a set size) are used to mark off the portions of the
larger area that will be photographed to identify all visible items.
Photo by Sara Hylton
LAND-BASED SYSTEMS • PHOTO QUADRAT LITTER DATA COLLECTION • 38
Research Questions This Method Can Help Address • What is the density (or concentration) of litter in a geographic location?
• Does this density or composition change over time?
Is this method right for you?
• This method ensures standardized sampling in a fixed area in a relatively short amount of time in the field.
• Data collection with this method is rapid and requires minimal training, time, and equipment.
• Data analysis requires more time investment and potential access and experience with image analysis software, though this is not required for a base count of items.
Resources Needed• A tool for measuring a distance of 100 meters, such as a measuring wheel, predetermined
locations on a map, or a 100-meter tape measure. A phone path tracker may work, though these can have accuracy issues.
• Transect marking equipment. These include: tape, rope, chalk, and other marking tools.
• A half-meter square (0.5 m2) quadrat frame. This can be fabricated from metal, PVC pipe, wood, or other sturdy material [Figure 1].
• Camera with enough storage capacity to collect at least 20 pictures per transect.
• Handheld GPS unit or a cell phone with geolocation functionality.
• Photo storage location on a computer, external hard drive, or cloud-based storage.
• Image viewing software, such as Google Photos or Microsoft Photos.
• Image processing capability. This can be manual or through Image Analysis software like CPCe, ENVI, or ArcGIS, which offers online or pro options.
• Data management software, such as Microsoft Excel or Google Sheets.
Where to Use• This method can be used in any community, riverbank, beach, or sampling location.
This method can also be conducted underwater, but that requires special skills, safety measures, and considerations relating to SCUBA or snorkel surveys that are not detailed here.

39 • LAND-BASED SYSTEMS • PHOTO QUADRAT LITTER DATA COLLECTION
Personnel and Scaling • Data Collection
❍ It is highly recommended that, for reasons of safety and efficiency, two people carry out the data collection process.
❍ Depending on the survey location, the survey can take 30 minutes per transect: 15 minutes to set up, 10 minutes to sample, and five minutes to break down any equipment. When conducting multiple surveys spread throughout a community or shoreline, you will also need to factor in travel time between sites. Ideally, three transects are completed per location, requiring a total of 2 to 2.5 hours, depending on travel time.
• Data analysis
❍ One person is usually sufficient for data processing and analysis. Large datasets can be split between multiple analysts, as long as they all carefully maintain standards of accuracy and consistency in identifying litter items.
❍ Image processing can be dependent on litter abundance; photos with low litter density will be quick to process, while those with high litter density will take more time. Twenty photos can take up to an hour to process.
❍ Analysis of the resulting processed litter data requires one person for processing and another for verifying results. Each transect analysis can take as little as a couple of hours, or up to 20 hours, depending on the level of analysis needed.
Example Outputs and Results• Resulting photo data will look like Figure 1.
• Processed photo data can look like Table 1.
• Analysis results may include:
❍ Litter composition and count, including materials, plastic product types, etc.
❍ Litter density, expressed as the average number of items per square meter.
❍ Optional: size distribution, GIS analysis, differences over time, etc.
• Note: the outputs will describe fewer categories of litter than are described when individually identifying and logging items in the field (see Litter Transects with Debris Tracker data collection for comparison).

LAND-BASED SYSTEMS • PHOTO QUADRAT LITTER DATA COLLECTION • 40
Detailed Field Methods• Survey Location:
❍ For best results, conduct at least three surveys, each in different locations at each site. So there should be three surveys per square kilometer (km2).
❍ For inland community surveys, the site can correspond with litter transect sites. See detailed field methods for Litter Transects for site selection options.
❍ For riverbanks, shorelines, and coastlines, an upper, middle, and lower survey location along the river should be picked for the community. At least one survey should be conducted at each location, but ideally three surveys will be conducted at each location.
• Survey Procedure Options:
❍ Inland, community surveys:
» Transects will be 1 meter wide x 100 meters long, generally along a sidewalk or walkway for safety.
» The quadrat is placed on the ground every five meters along the transect and a photo is taken of each quadrat. This will result in 20 photos.
» Photos should be taken directly above the quadrat (not at an angle) and be as close as possible while still including the full quadrat [Figure 1].
❍ Riverbank/Shoreline surveys:
» Transects are laid as a 10-meter x 10-meter perimeter on the shoreline, bank, beach, or immediately adjacent to the body of water. If there is insufficient riverbank or beach to lay down a 10-meter x 10-meter perimeter, the same overall area can be laid out, but in a longer and thinner rectangle, such as 8 x 12 meters.
» The quadrat is randomly thrown 20 times within the 10-meter x 10-meter perimeter. After each throw, a photo of the quadrat is taken.
• This data collection method garners a lot of attention. This can be an opportunity to engage and speak with community members about litter, but can also be distracting or intimidating. Only proceed with work when you feel safe.
Figure 1. Sample quadrat photo. (Photo by Jenna Jambeck)

41 • LAND-BASED SYSTEMS • PHOTO QUADRAT LITTER DATA COLLECTION
• Data Management:
❍ All photo data should be stored safely. Ideally, the data are backed up to a second source, with clear labelling that includes the location, until analysis.
❍ Notes regarding the location surveyed, participants involved, and any related field data such as weather, time of day, etc. should be included.
❍ Backing up data is very important. If possible, back up photo data in cloud storage or external hard drives.
Safety and Other Considerations
• Prepare a proper risk assessment before conducting fieldwork, in accordance with your organization’s requirements. Points to consider:
❍ Check the weather. Make sure that expected temperature, rain, and other indicators predict reasonably safe conditions for working outside.
❍ You will be doing a lot of walking, so prepare for this with proper clothing and gear. Wear items you would for a long day hike, taking into account potential changes in weather. Wear hats, covered shoes, clothes appropriate for the weather, and sunscreen as necessary. Wear bright colors or even a safety vest so you can be seen.
❍ Also be sure to wear clothing that adheres to the social and cultural norms of the community.
❍ Be prepared with any first aid requirements. This includes but is not limited to a basic first aid kit (for minor cuts, scratches, stings, etc.), plenty of water, and sun protection. Consider requiring an up-to-date tetanus shot for each participant.
❍ While it is possible for one person to complete field data collection, we strongly recommend working in groups of at least two for both safety and efficiency.
❍ Conducting inland community-based litter data collection can mean working around both automobile and pedestrian traffic and may include unexpected interactions with people and/or animals. Be aware of your surroundings, navigate traffic safely, and do not enter areas that seem unsafe. Always make sure you are visible.
Figure 2. Taking a quadrat photo on the Sea to Source
Expedition. (Photo by Navin Das)

LAND-BASED SYSTEMS • PHOTO QUADRAT LITTER DATA COLLECTION • 42
❍ Surveying near water—shoreline, riverbank, and beach—presents risks. Sampling locations can be isolated or away from people, making it particularly important to work in groups of two or more. Minimize exposure to natural threats in these environments.
❍ We recommend working with an in-community partner to help with any local language, navigation, health, and safety concerns.
❍ Discuss any concerns, think through precautions, and bring the appropriate safety gear that you need to stay safe during the activity.
Detailed Analysis Methods• Image processing:
❍ Images can be processed by one or more people as long as they all carefully maintain standards of accuracy and consistency. It can be helpful for team members to conduct random spot checks on each others’ work.
❍ The simplest form of photo data processing includes identifying and recording items in each picture. For example, a given photo could show one plastic bottle and two plastic bags. Records can be made in Excel or Google Sheets. Here is an example table that aligns with the Debris Tracker item list and can be used for identifying litter items in images.
❍ Data should include the location of the transect, which transect the photo it is from, when the photo was taken, and other useful information. See Table 1 for sample data output.
❍ More advanced processing options include using image analysis software, such as ArcGIS, which can allow for geospatial analysis or size distribution.
• Image Data Analysis:
❍ Using Excel or Google Sheets, you can calculate 1) a total count of items, or 2) a count of items by material type, after aggregating data into different material/type categories.
❍ Composition can be calculated by aggregating material types, and item types within each material, and then taking a count of each item out of the total count of all items. For example, if there are 10 plastic items out of 50 total items, the proportion of plastic would be 20 percent.
❍ To determine density, first calculate the area covered by the quadrat. Examples:
» If the quadrat was thrown 20 times in a transect, then the area covered is: 20 x 0.5 square meters (m2) = 10 square meters (m2).
» If 50 items were counted, then the litter density is 50 items / 10 square meters (m2) = 5 items per square meter (m2).
» If 10 items were plastic, then the plastic litter density is 10 items / 10 square meter (m2) = 1 plastic item per square meter (m2).
43 • LAND-BASED SYSTEMS • PHOTO QUADRAT LITTER DATA COLLECTION
Further Reading• Foster, et al. (1991). Point vs. photo quadrat estimates of the cover of sessile marine
organisms. Journal of Experimental Marine Biology and Ecology, vol. 146, Issue 2, p. 193-203.
• At the time of publication of this method, sample analysis is still underway. We anticipate that a paper, authored by Brooks et al., will be published by the middle of 2021.
• More advanced analysis techniques using geospatial or imagery analysis software can be used, but descriptions of these are outside of the scope of this toolkit.
• Consider how you will utilize your data, such as engaging policy and decision makers, conducting education and awareness campaigns, or presenting at scientific conferences

2.AQUATIC SYSTEMS AND AIRPlastic pollution from land can end up in rivers, which then
act as conduits that transport plastic into the ocean. Larger
plastic litter items can break down into smaller microplastics.
Alternatively, common microplastics, such as fibers from
clothes or car tires, can directly wash into aquatic systems.
These aquatic-focused methods provide approaches to
document the quantity and type of microplastics that can be
found in water and sediment. Air can transport microplastics
into aquatic systems, so there is also a method for sampling
microplastics in air. A method is offered for assessing plastic
debris resulting from fishing activities, which occur in a wide
range of aquatic systems and are poorly documented in
freshwater environments.
Photo by Sara Hylton

45 • AQUATIC SYSTEMS AND AIR • WATER SAMPLING FOR MICROPLASTICS
2.1 Water Sampling for MicroplasticsThis water sampling method provides a quick, low-cost process for
collecting microplastics from surface water. The method pumps
a known amount of water (for example, 30 liters) over a mesh
of pre-selected pore size. As the water flows through the mesh,
microplastics (and other solids) that are larger than the mesh pore
size are left behind on the surface.
Photo by Sara Hylton

AQUATIC SYSTEMS AND AIR • WATER SAMPLING FOR MICROPLASTICS • 46
Research Questions This Method Can Help Address • How much microplastic is found in surface water?
• What are the sizes and characteristics of the microplastic?
• How does the concentration of microplastic vary? Does the concentration differ along a river course or next to areas of interest, such as sewage treatment outflow locations?
Is this method right for you?
• Use this method if there is an aquatic environment you can sample. If needed, make sure you can safely use a boat to get to the middle of the river, along the riverbank, or out to sea.
• Ensure you have the right safety equipment (such as life jackets and other essential equipment) and the correct supplies needed to make the pumping equipment.
• You will need to have a mesh of a defined size (such as 330 µm), which is required for the collection of each sample.
• This method requires access to a microscope within a clean environment to analyze the mesh for microplastic after sampling. You also need tweezers for extraction.
• If it is important to identify each suspected microplastic’s polymer type, you will need access to a collaborator or laboratory with a Fourier transform infrared (FTIR) or Raman spectrometer.
❍ There are some labs that provide spectroscopy through collaborative research or as a service, if you do not have access to spectroscopy.
❍ Without using spectroscopy, you can still gather useful data by manually sorting plastics under a microscope (this is most effective for particles >500 µm). Then they can be further classified by shape type (such as fragment or fiber), color, size, and description. Each potential microplastic piece should be photographed using a microscope, for records and obtaining dimensions data.
Where to Use• This method can be used in any aquatic environment including freshwater, brackish,
or marine environments. The water needs to be at least 0.5 meters deep, but deeper than that is preferable so sediment and sand are not stirred from the bottom and collected on the mesh during sampling.
47 • AQUATIC SYSTEMS AND AIR • WATER SAMPLING FOR MICROPLASTICS
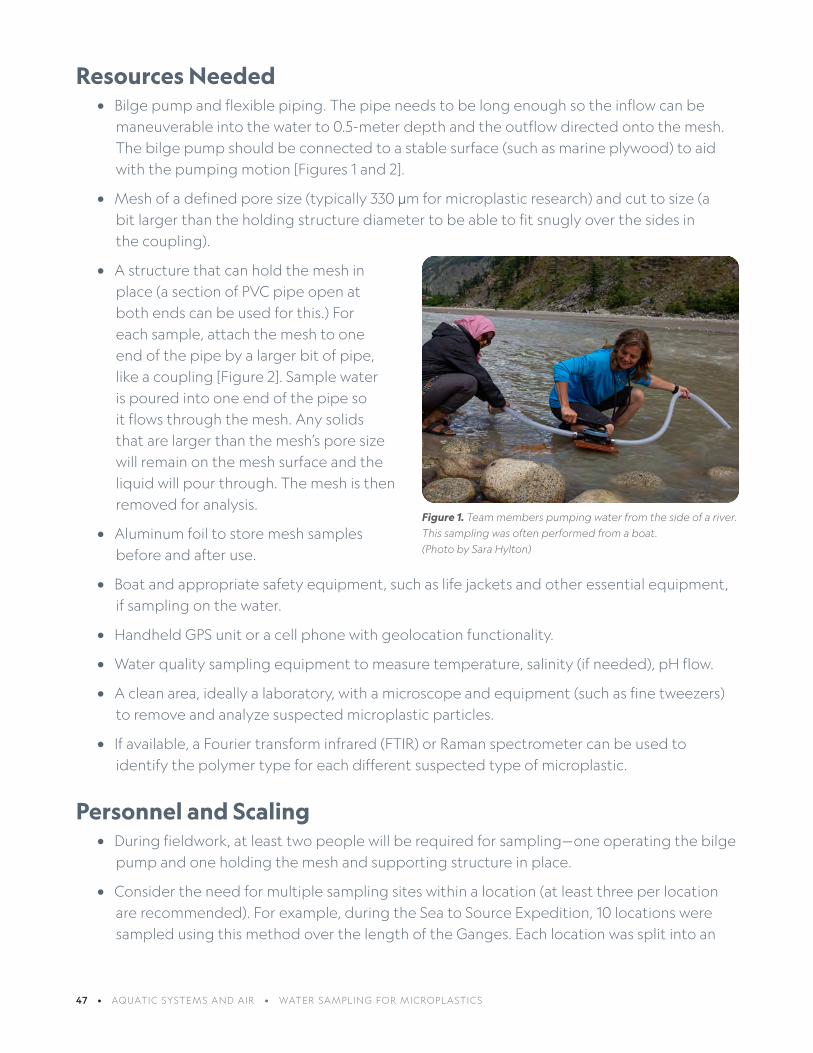
Resources Needed• Bilge pump and flexible piping. The pipe needs to be long enough so the inflow can be
maneuverable into the water to 0.5-meter depth and the outflow directed onto the mesh. The bilge pump should be connected to a stable surface (such as marine plywood) to aid with the pumping motion [Figures 1 and 2].
• Mesh of a defined pore size (typically 330 µm for microplastic research) and cut to size (a bit larger than the holding structure diameter to be able to fit snugly over the sides in the coupling).
• A structure that can hold the mesh in place (a section of PVC pipe open at both ends can be used for this.) For each sample, attach the mesh to one end of the pipe by a larger bit of pipe, like a coupling [Figure 2]. Sample water is poured into one end of the pipe so it flows through the mesh. Any solids that are larger than the mesh’s pore size will remain on the mesh surface and the liquid will pour through. The mesh is then removed for analysis.
• Aluminum foil to store mesh samples before and after use.
• Boat and appropriate safety equipment, such as life jackets and other essential equipment, if sampling on the water.
• Handheld GPS unit or a cell phone with geolocation functionality.
• Water quality sampling equipment to measure temperature, salinity (if needed), pH flow.
• A clean area, ideally a laboratory, with a microscope and equipment (such as fine tweezers) to remove and analyze suspected microplastic particles.
• If available, a Fourier transform infrared (FTIR) or Raman spectrometer can be used to identify the polymer type for each different suspected type of microplastic.
Personnel and Scaling • During fieldwork, at least two people will be required for sampling—one operating the bilge
pump and one holding the mesh and supporting structure in place.
• Consider the need for multiple sampling sites within a location (at least three per location are recommended). For example, during the Sea to Source Expedition, 10 locations were sampled using this method over the length of the Ganges. Each location was split into an
Figure 1. Team members pumping water from the side of a river.
This sampling was often performed from a boat.
(Photo by Sara Hylton)

AQUATIC SYSTEMS AND AIR • WATER SAMPLING FOR MICROPLASTICS • 48
upper, middle, and lower section (more information below). At each of these locations, six samples were taken over two days (three on each day). Allow for travel time between sites.
Example Outputs and Results• Microplastic (MP) concentration (MP L-1)
• Type of particle (such as fragment or fiber), dimensions (length and diameter), and color of microplastic.
• Most common material (such as polyester, acrylic, or rayon) This is dependent on access to a FTIR or Raman spectrometer.
Detailed Field Methods• Sampling site selection
❍ Consider suitable dates and locations for sampling as this may impact the results. For example, the Sea to Source Expedition took measurements during two distinct time periods separated by several months—pre-monsoon and post-monsoon—to capture temporal variation in microplastic abundance.
❍ Non-synthetic clothing should be worn (such as those made of cotton fabrics) to reduce sample contamination from synthetic textiles.
Figure 2. Team members holding the water sampling equip-
ment. (Photo by Sunanda Bhola)
PVC pipe to hold mesh in place while water is pumped over it
Bilge pump and hosing attached to plywood board
Completed sample stored and ready for transport

49 • AQUATIC SYSTEMS AND AIR • WATER SAMPLING FOR MICROPLASTICS
❍ Consider how best to obtain replicates; ideally there should be at least three replicates at each location at a minimum. As an example, for a 5-kilometer stretch of river, samples were collected from three points at 2.5-kilometer intervals (at 0, 2.5, and 5 km) from the center of the river. Samples were replicated on two consecutive days (n = 6 per site). Post-monsoon sampling occurred at the same sites using the GPS locations from the pre-monsoon collection trip. For tidal sections of the river, samples were collected on an ebbing tide to ensure microplastics within the outflowing river water were not those potentially brought inshore from the Bay of Bengal [Figure 1].
❍ Before fieldwork, the water pumping system (the bilge pump and tubing) should be checked for contamination in a clean laboratory before and after the expedition. A procedural blank (of your known volume of water; for example, 30 liters) filtered (through a 30 µm mesh) distilled water will simulate the sampling process and identify potential sources of contamination from the equipment. Additionally, before sampling, each mesh needs to be visually inspected for contamination using a microscope and any particles should be removed before use. The mesh should then be wrapped in two layers of clean foil before and after use to avoid subsequent contamination.
• Sample collection
❍ To collect the samples, a known volume of water (ideally > 30 liters) should be pumped from 0.5 meters below the surface river water. This should ideally be collected from a point at the center of the river. During the Sea to Source Expedition, the pumping volume was adjusted to 30 liters considering the target microplastic size range (>330 µm) and logistical and practical challenges during sampling. However, the smaller the mesh size, the more foreign debris will be collected so potentially harder to analyze but more microplastic will potentially be collected.
❍ The water should then be filtered through the mesh of your chosen size using a hand-operated bilge pump. The mesh should be placed across a supporting structure as described in the Resource section (such as a PVC tube that can hold it in place). The pumping volume of each stroke of the bilge pump needs to be quantified so a known volume of water can be pumped (for example, 50 pump strokes = 30 liters).
❍ After sample collection, the mesh should be folded inward twice, placed in foil which is carefully folded over the mesh and at each edge, and then placed in a sealable plastic zip-top bag to minimize contamination.
❍ To check for contamination, blanks should be collected. Blanks help identify whether samples are being contaminated with plastics that don’t come from the tested water. For example, clothes can be made of plastic fibers and can shed into air. These plastic fibers could be caught in the mesh, impacting the sample results. To check for contamination, dampen a paper filter with filtered water and leave it nearby while sampling. A single blank can be used to cover one set of samples from several locations taken on a single day. For storage, the filter paper should then be treated like a sample, double-wrapped in

AQUATIC SYSTEMS AND AIR • WATER SAMPLING FOR MICROPLASTICS • 50
foil and placed in a sealable plastic zip-top bag ready to analyze in the lab. If lab analysis reveals that your blank and your sample contain similar concentrations of microplastics, then your sample is probably contaminated and cannot be used.
❍ It is important that someone is tasked with writing down information about the area and recording situational updates, as this might impact results (for example, if it has been raining, if the testing location is next to an especially populated or busy area, a wastewater treatment plant, or stormwater outfall).
Safety and Other Considerations• Prepare a proper risk assessment before conducting fieldwork, in accordance with your
organization’s requirements. Points to consider:
❍ Always get any permits or approvals needed to collect these data and access sites to collect samples.
❍ Check the weather. Make sure that expected temperature, rain, and other indicators predict reasonably safe conditions for working outside.
❍ Also be sure to wear clothing that adheres to the social and cultural norms of the community.
❍ Be prepared with any first aid requirements. This includes but is not limited to a basic first aid kit (for minor cuts, scratches, stings, etc.), plenty of water, and sun protection
❍ Appropriate boat and water safety equipment needs to be immediately available—either aboard the boat or carried by team members.
❍ Wear proper personal safety gear, such as life jackets.
❍ We recommend working with a local partner who can help navigate any local health and safety concerns. A boat operator with knowledge of the river and conditions is also advised.
❍ The environment on the water can change rapidly, so be prepared for a potential emergency situation (such as a person overboard).
❍ Discuss any concerns, think through precautions, and bring the appropriate safety gear
that you need to stay safe during the activity.
Detailed Analysis Methods• After sample collection, each mesh should be analyzed for microplastics using a light
microscope and information on the type of particle (such as fragment or fiber), dimensions (length and diameter), and color recorded. Manually sorting plastics under a microscope is most effective for particles >500 µm. Shape classifications include fragments, films, spherical beads and fibers. Suspected microplastics can then be analyzed by Fourier transform infrared (FTIR) spectroscopy.

51 • AQUATIC SYSTEMS AND AIR • WATER SAMPLING FOR MICROPLASTICS
Further Reading• Napper, I.E., Baroth, A., Barrett, A.C., Bhola, S., Chowdhury, G.W., Davies, B.F.R., Duncan,
E.M., Kumar, S., Nelms, S.E., Niloy, M.N.H., Nishat, B., Maddalene, T., Thompson, R.C.,Koldewey, H. (2021). The abundance and characteristics of microplastics in surface water in the transboundary Ganges River. Environmental Pollution. http://doi.org/10.1016/j.envpol.2020.116348
• During any laboratory analysis, all steps should be conducted in a dedicated clean room for microplastic work, which limited access and procedural blanks (as above for field methodology). Cotton laboratory coats and clothes can be worn to reduce contamination from synthetic textiles. Any laboratory equipment used should be made of glass or stainless steel and thoroughly rinsed with filtered (1.6 µm) water before use.

52 • AQUATIC SYSTEMS AND AIR • SEDIMENT SAMPLING FOR MICROPLASTICS
2.2 Sediment Sampling for MicroplasticsThis sediment sampling method is a process for collecting
sediment from a river and extracting microplastic from it
for analysis. This method will identify the concentration of
microplastics which have sunk down to the riverbed. Sediment is
collected during fieldwork, then the microplastics are extracted
using density separating methods on the sediment. Further
analysis is then conducted on the suspected microplastics.
Photo by Sara Hylton

AQUATIC SYSTEMS AND AIR • SEDIMENT SAMPLING FOR MICROPLASTICS • 53
Research Questions This Method Can Help Address • How much microplastic is found in the sediment?
• What are the characteristics and size of the recovered microplastic?
• How does the concentration of microplastic vary? Does the concentration differ along a river course or next to areas of interest, such as sewage treatment outflow locations?
• What are possible sources of the microplastic? How does it compare with levels of microplastic in other nearby environments, such as air and water?
Is this method right for you?
• Use this method if there is an aquatic environment you can sample. If needed, make sure you can safely use a boat to get to the middle of the river, along the riverbank, or out to sea.
• If using a boat, make sure you have the appropriate safety equipment (such as life jackets).
• Ensure you have received the proper permissions from country or regional authorities to collect sediment samples.
• This method requires a clean area or a laboratory to do sediment density separations, a Sediment-Microplastic Isolation (SMI) unit and density separation media (zinc chloride), access to a microscope within the clean lab environment to analyze the mesh for microplastic, and fine tweezers for extraction.
• If it is important to identify each suspected microplastic’s polymer type, you will need access to a collaborator or laboratory with a Fourier transform infrared (FTIR) or Raman spectrometer.
❍ There are some labs that provide spectroscopy through collaborative research or as a service, if you do not have access to spectroscopy.
❍ Without using spectroscopy, you can still gather useful data by manually sorting plastics under a microscope (this is most effective for particles >500 micrometers). Then they can be further classified by shape type (such as fragment or fiber), color, size, and description. Each potential microplastic piece should be photographed using a microscope, for records and obtaining dimensions data.
Where to Use• This method can be used in any aquatic environment where the bottom sediment
can be reached and extracted. This can either be done with a sediment grabber or with a clean metal tray and spoon. Note that the latter method requires submerging your hands/arms to collect the sediment.

54 • AQUATIC SYSTEMS AND AIR • SEDIMENT SAMPLING FOR MICROPLASTICS
Resources Needed• Sediment grabber or a large
metal spoon.
• Large tray to place sediment.
• Foil bags to hold sediment.
• Plastic zip-close/sealable bags for an extra barrier for the samples in aluminum foil. This helps minimize the risk of contamination.
• Boat and appropriate safety equipment, such as life jackets and other essential equipment, if sampling on the water.
• Handheld GPS unit or a cell phone with geolocation functionality.
• Depth sounder to record sampling depth.
• 30-mm nylon mesh to collect microplastics after density separation.
• A Sediment-Microplastic Isolation (SMI) unit can be brought, or a similar instrument built.
• A clean area, ideally a laboratory, with a microscope and equipment (such as fine tweezers) to remove and analyze suspected microplastic particles.
• If available, a Fourier transform infrared (FTIR) or Raman spectrometer can be used to identify the polymer type for each different suspected type of microplastic.
Personnel and Scaling • During fieldwork, a minimum of two people will be required for sampling—one collecting
the sediment into the tray and then into foil bags, and the other supporting. Additional team members will be required for the boat crew.
• Consider the need for replicates (at least three in each location are recommended). For example, during the Sea to Source Expedition over the length of the Ganges river, 10 locations were sampled using this method. At each location, six samples were taken over two days (three on each day) Each location was split into an upper, middle, and lower section.
Figure 1. Team members using the metal spoon and tray method
for scooping sediment into a foil bag. (Photo by Emily Duncan)

AQUATIC SYSTEMS AND AIR • SEDIMENT SAMPLING FOR MICROPLASTICS • 55
Example Outputs and Results• Microplastic (MP) concentration per volume of sediment. This is expressed as: MP L-1
• Type of particle (fragment or fiber), its dimensions (length and diameter) and the color of microplastic.
• Most common material (such as polyester, acrylic, or rayon) found in the sediment samples. This is dependent on FTIR equipment and analysis.
Detailed Field Methods• Sampling site selection
❍ Consider suitable dates and locations for sampling as this may impact the results. For example, pre-monsoon and post-monsoon season, to capture temporal variation in microplastic abundance.
❍ Consider how best to obtain replicates. Ideally there should be three or more replicates at each location at a minimum. As an example, for a 5-kilometer stretch of river, samples were collected from three points at 2.5-kilometer intervals (0, 2.5 km, and 5 km) from the center of the river. Samples were replicated on two consecutive days (n = 6 per site). For consistency, post-monsoon sampling occurred at the same sites using the GPS locations from pre-monsoon sampling.
• Sample collection
❍ To collect the samples, approximately 250 grams of sediment should be obtained (the more the better, but only 50 grams is used for extraction in the lab). The sediment can be collected by a sediment grabber (such as an Ekman grab, which can be sourced from field equipment
Figure 2. Photo by Imogen Napper

56 • AQUATIC SYSTEMS AND AIR • SEDIMENT SAMPLING FOR MICROPLASTICS
suppliers) or simply with a large metal spoon with a long handle. Place the collected sediment into a large metal tray, or if possible, straight into foil bags. Place the foil bags into a larger sealable plastic zip-top bag to protect the sample.
❍ It is important that someone is tasked with writing down information about the area and recording situational updates, as this might impact results (for example, if it has been raining, if the testing location is next to an especially populated or busy area, a wastewater treatment plant, or stormwater outfall).
• To check for contamination, blanks should be collected. Blanks help identify whether samples are being contaminated with plastics that do not come from the sediment. For example, clothes can be made of plastic fibers and can shed into air. These plastic fibers could be caught in the mesh, impacting the sample results. To check for contamination, dampen a paper filter with filtered water and leave it nearby while sampling. A single blank can be used to cover one set of samples from several locations taken on a single day. For storage, the filter paper should then be treated like a sample—double-wrapped in foil and placed in a sealable plastic zip-top bag ready to analyze in the lab. If lab analysis reveals that your blank and your sample contain similar concentrations of microplastics, then your sample is probably contaminated and cannot be used.
• Transport the samples back to the laboratory for analysis.
• This sample method may require a bit of creativity and adaptability; depending on the riverbed, it might be quite rocky and therefore difficult to scoop up sediment. You will need to find a suitable area. The spoon works well close to the shore (within two meters) and the sediment grabber works well to a depth of around 10 meters. The depth can be confirmed by a depth sounder.
Safety and Other Considerations• Prepare an appropriate risk assessment according to your organization’s requirements prior
to fieldwork. Points to consider:
Figure 3. A Sediment Microplastic Isolation (SMI) unit on a mag-
netic stirring plate. (Photo by Anju Baroth)

AQUATIC SYSTEMS AND AIR • SEDIMENT SAMPLING FOR MICROPLASTICS • 57
❍ Always get any permits or approvals needed to collect these data and access sites to collect samples.
❍ Check the weather. Make sure that expected temperature, rain, and other indicators predict reasonably safe conditions to work outside.
❍ Also be sure to wear clothing that adheres to the social and cultural norms of the community.
❍ Be prepared with any first aid requirements. This includes but is not limited to a basic first aid kit (for minor cuts, scratches, stings, etc.), plenty of water, and sun protection.
❍ Appropriate boat/water safety equipment, such as life jackets, must be worn.
❍ We recommend working with an in-community partner who can help navigate any local health and safety concerns, as well as the physical environment of the river.
❍ The environment on the water can change rapidly, so have a plan for a potential emergency situation (such as a person falling overboard).
❍ Discuss and think through safety protocols, and bring the appropriate safety gear that you need to stay safe during the activity.
❍ The sediment grabber may become trapped at the bottom, which can be an issue if there is a strong current. Remember the correct way to handle ropes and stay in a safe area with minimal current.
❍ Sediment sampling can be messy, so ensure good hygiene and hand washing after sampling.
Detailed Analysis MethodsThis Detailed Analysis is following methodology from:
Coppock, R. L., Cole, M., Lindeque, P. K., Queir Os A, A. M., & Galloway, T. S. (2017). A small-scale, portable method for extracting microplastics from marine sediments. Environmental Pollution, 230, 829–837. Open access.
• Extracting plastics from sediment is a time-intensive method and will require a Sediment Microplastic Isolation (SMI) unit or similar device. Coppock, et al. (2017) describes how to use an SMI unit and the processes surrounding it.
• Prior to using the SMI, dry the sediment for approximately 72 hours. Use 50 grams of dry sediment per extraction. Data should be normalized by the dry weight (in grams) of sediment added to the SMI for extraction. Zinc chloride is the most effective density separation media and is most efficient at a density of 1.5 grams cm-3. This allows the media to be dense enough for the floatation of different polymer types while allowing fine sediments to settle out of suspension and achieving the desired separation.

58 • AQUATIC SYSTEMS AND AIR • SEDIMENT SAMPLING FOR MICROPLASTICS
• During extraction from sediment samples, all cleaned equipment should be placed inside a laminar flow hood or a clean environment and covered with clean aluminum foil to minimize contamination.
• On each occasion, a dry 50-gram sample, clean magnetic stir bar and 700 mL of zinc chloride (ZnCl2) should be added to the purged SMI unit. A magnetic stirring plate will be needed to mix the sediment; do this for five minutes, and then allow the sediment to settle for five minutes, followed by three short stirring pulses to allow the escape of trapped air bubbles. Leave the unit to settle until the supernatant is clear of sediment.
• Next, close the valve and pour the supernatant through a 30-mm nylon mesh using vacuum filtration (or split over multiple meshes if high quantities of organic material are present), retaining the zinc chloride for further use. Clean the SMI unit with filtered (1.6 µm) distilled water to recover any remaining particles.
• The meshes will hold any collected microplastics. Transfer each mesh to a clean petri dish and seal with Parafilm.
• After each extraction, the SMI should be cleaned with ultrapure water and purged again before processing the next sample. Carry out procedural blanks (ZnCl2 excluding sediment) prior to first use and after every three samples as a contamination control measure.
• Daily cleaning of the SMI unit, conducted at the end of each sample, will need to be completed and tests with procedural blanks should be conducted with each sample. For example, doing the whole process but only with filtered, clean, or distilled water or solution to check for foreign contaminants.
• Microplastic analysis
❍ After the collection of the samples, each mesh should be analyzed for microplastics using a light microscope. Extract anything you think could be synthetic from each mesh using metal tweezers, then place on a filter paper in a petri dish and record:
» Information on the type of particle (fragment or fiber, for example)
» Dimensions (length and diameter)
» Color of particle
» Shape classifications, including fragments, films, spherical beads, and fibers.
❍ Suspected microplastics can then be analyzed by Fourier transform infrared (FTIR) or Raman spectroscopy. During any laboratory analysis, all steps should be conducted in a dedicated clean room for microplastic work, with limited access and procedural blanks. Cotton laboratory coats and clothes can be worn to reduce contamination from synthetic textiles. It is preferable if laboratory ware used can be made of glass or stainless steel and thoroughly rinsed with filtered (1.6 µm) water before use.

59 • AQUATIC SYSTEMS AND AIR • AIR SAMPLING FOR MICROPLASTICS
2.3 Air Sampling for MicroplasticsThis air sampling method is a quick and inexpensive way to collect
and measure microplastic from atmospheric deposition. This
method involves leaving equipment in one location for a 24-hour
period to collect microplastics that settle onto the ground from
the atmosphere. These settled particulates can then be removed
and analyzed with a microscope or other tools to assess size,
composition, and other characteristics.
Photo by Heather Koldewey

AQUATIC SYSTEMS AND AIR • AIR SAMPLING FOR MICROPLASTICS • 60
Research Questions This Method Can Help Address • How much microplastic is found to be settling into the rivers, ocean, and land from the air?
• What are the sizes and characteristics of microplastic found in the air?
• How does the concentration of microplastic vary depending on the location? For example, in areas of high or low population density?
Is this method right for you?
• Ensure you have the correct sampling equipment and have obtained mesh of a defined size (30 µm) required for the collection of each sample.
• Ensure the sampling equipment will be safe and secure in your chosen sampling location.
• Ensure you have 72 hours to spend at one sample location. You must leave sampling equipment for a continuous 24-hour period then repeat for two more 24-hour periods as replicates.
• This method requires access to a microscope within a clean environment to analyze the mesh for microplastic after sampling. You also need tweezers for extraction.
• If it is important to identify each suspected microplastic’s polymer type, you will need access to a collaborator or laboratory with a Fourier transform infrared (FTIR) or Raman spectrometer.
❍ There are some labs that provide spectroscopy through collaborative research or as a service, if you do not have access to spectroscopy.
❍ Without using spectroscopy, you can still gather useful data by manually sorting plastics under a microscope (this is most effective for particles >500 µm). Then they can be further classified by shape type (such as fragment or fiber), color, size, and description. Each potential microplastic piece should be photographed using a microscope, for records and obtaining dimensions data.
Where to Use• This method can be used anywhere the equipment can be placed securely. The
equipment is less than 0.5 m2 and 0.25 meter tall.
• Location of the equipment will be determined primarily by your research goals. For the Sea to Source Expedition, samples were taken as close to the river as possible to assess potential deposition into aquatic environments. However, you should also consider population density and the safety of your equipment when determining where to place your equipment.

61 • AQUATIC SYSTEMS AND AIR • AIR SAMPLING FOR MICROPLASTICS
Resources Needed• Mesh of a defined pore size (such as the 30 µm mesh used previously) and cut to size. The
mesh should be cut a bit larger than the diameter of the holding structure so it fits snugly over the sides of the coupling.
• A structure that can hold the mesh in place (a section of PVC pipe open at both ends can be used for this). For each sample, attach the mesh to one end of the pipe by a larger bit of pipe, like a coupling [Figure 2]. Sample water is poured into one end of the pipe so it flows through the mesh. Any solids that are larger than the mesh’s pore size will remain on the mesh surface and the liquid will pour through. The mesh is then removed for analysis.
• Plastic or glass funnels.
• Plastic or glass bottles to hold funnels.
• A structure to hold the bottle and funnel in place [Figure 1].
• Aluminum foil to store mesh samples before and after use.
• Plastic zip-close/sealable bags, for an extra barrier for the samples in aluminum foil. This helps minimize the risk of contamination.
• Handheld GPS unit or a cell phone with geolocation functionality.
• A system for recording rainfall and wind speed.
• A clean area, ideally a laboratory, with a microscope and equipment (such as fine tweezers) to remove and analyze suspected microplastic particles.
• If available, a Fourier transform infrared (FTIR) or Raman spectrometer can be used to identify the polymer type for each different suspected type of microplastic.
Figure 1. The air equipment setup, including funnels, bottles, and stand.
(Photo by Imogen Napper)
Funnels
Bottles
Holding Structure

AQUATIC SYSTEMS AND AIR • AIR SAMPLING FOR MICROPLASTICS • 62
Personnel and Scaling • During fieldwork, a minimum of two people will be required for sampling, to handle the
physical work of changing the mesh and equipment, and recording data.
• Consider the need for replicates (at least three in each location are recommended). For example, during the Sea to Source Expedition, 10 locations were sampled using this method over the length of the Ganges. Each location was split into an upper, middle, and lower section (more information below). At each of these locations, six samples were taken over two days (three on each day). Allow for travel time between sites.
Example Outputs and Results• Microplastic (MP) concentration deposited from air per area. This is expressed as:
m−2 d−1.
• Type of particle (fragment or fiber), dimensions (length and diameter), and color of microplastic.
• Most common material (such as polyester, acrylic, or rayon) This is dependent on access to a FTIR or Raman spectrometer.
Detailed Field Methods• Sampling site selection
❍ Think about sample locations in terms of your research goals. In the case of the Sea to Source Expedition, samples were taken as close to the river as possible to assess potential deposition into aquatic environments.
❍ Consider how best to obtain replicates. Ideally, there should be three or more replicates at each location at a minimum. As an example, for a 5-kilometer stretch of river, samples were collected from three points at 2.5-kilometer intervals (0, 2.5 km, and 5 km) from the center of the river. Samples were replicated on three consecutive days (n = 9 per site).
• Sample collection
❍ Total atmospheric fallout (wet and dry deposition) can be collected through a funnel (such as one with a diameter of 13 cm) and should be placed in a bottle (500 mL PET bottle can work for this). The funnel and bottle should be secured into a structure to keep it standing [Figure 1].
❍ The sampling set-up should be placed in each location for 72 hours. Collect samples after each 24-hour period.

63 • AQUATIC SYSTEMS AND AIR • AIR SAMPLING FOR MICROPLASTICS
❍ The sampling set-up should be placed at similar heights at each site and in open areas not affected by surrounding buildings, trees, or other structures that might impact the surrounding atmospheric deposition. For example, do not place the set-up behind a large building. It is easier to identify sample placement locations during previous site visits. It may be useful to add a label in the local language that notes the equipment should not be tampered with/touched/approached during the testing.
❍ For each sample, attach the mesh to one end of the pipe, then slide a larger bit of pipe over the mesh to secure it like a coupling [Figure 2]. Sample water is poured into one end of the pipe so it flows through the mesh. Any solids that are larger than the mesh’s pore size will remain on the mesh surface and the liquid will pour through.
❍ After each 24-hour exposure, the funnel should be rinsed and filtered (through a 30 µm mesh) distilled water three times in order to recover all microplastics that might be adhering to its walls. Then the liquid which has been collected in the bottle is directly filtered onto the 30 μm mesh through the pipe structure which secures the mesh. Similarly, the bottle housing the funnel should be rinsed with 250 mL of filtered (through a 30 µm mesh) distilled water three times and then poured over the mesh.
❍ After sample collection, the mesh is then removed for analysis. The mesh should be folded inward twice, placed in foil which is carefully folded over the mesh and then at each edge, and then placed into a plastic zip-close/sealable bag to minimize contamination.
❍ Rainfall intensity over each 24-hour period can be recorded with a rain gauge placed at one of the sample locations.
❍ To check for contamination, blanks should be collected. The blank is a filter paper dampened with filtered (through a 30 μm mesh) distilled water on an open petri dish. Blanks help identify whether samples are being contaminated with plastics that don’t come from the tested water. For example, clothes can be made of plastic fibers and can shed into air. These plastic fibers could be caught in the mesh, impacting the sample results. To check for contamination, dampen a paper filter with filtered water and leave it nearby while sampling. In the case of air samples, after each of the 24-hour periods (but only needs to be at one site replicate), deploy the blank before you start processing the samples. Place it near your air sample while you process it, while performing the washing
Figure 2. Team members collecting samples after a 24-hour
period. Here they filter the sample onto the mesh.
(Photo by Sara Hylton)

AQUATIC SYSTEMS AND AIR • AIR SAMPLING FOR MICROPLASTICS • 64
and filtering steps described above. Once the sample processing is complete, the filter paper should then be double-wrapped in foil and placed in a zip-close/sealable bag ready to check in the lab. If you are collecting similar results on your blank as your sample, then your sample is most likely to have been contaminated during the processing and cannot be used.
❍ It is important that someone is tasked with writing down information about the area and recording situational updates, as this might impact results (for example, if it has been raining, if the testing location is next to an especially populated or busy area, a wastewater treatment plant, or stormwater outfall).
Safety and Other Considerations• Prepare a proper risk assessment prior to fieldwork according to your organization’s
requirements. Points to consider:
❍ Always get any permits or approvals needed to collect these data and access sites to collect samples.
❍ Check the weather. Make sure that expected temperature, rain, and other indicators predict reasonably safe conditions for working outside.
❍ Also be sure to wear clothing that adheres to the social and cultural norms of the community.
❍ Be prepared with any first aid requirements. This includes but is not limited to a basic first aid kit (for minor cuts, scratches, stings, etc.), plenty of water, and sun protection.
❍ Appropriate boat/water safety equipment, such as life jackets, must be worn on the water.
❍ We recommend working with an in-community partner who can help navigate any local health and safety concerns. Discuss, think through precautions, and bring the appropriate safety gear that you need to stay safe during the activity.
❍ Equipment may be stolen or tampered with. Asking a local member of the community to help locate a secure location to deploy the equipment—such as a private garden—and keeping an eye on it can help. Additionally, try to place the equipment out of public view.
❍ Take precautions for inclement weather. Storms or high winds can knock over the equipment. Therefore, make sure the equipment is carefully secured. For example, rocks can be used as weights to hold it down.
Detailed Analysis Methods• After the collection of the samples, each mesh should be analyzed for microplastics
using a light microscope and information recorded on the type of particle (such as whether it is fragment or fiber), its dimensions (length and diameter), and the color of the material. Shape classifications include fragments, films, spherical beads, and fibers.

65 • AQUATIC SYSTEMS AND AIR • AIR SAMPLING FOR MICROPLASTICS
Further Reading• At the time of publication of this method, sample analysis is still underway. We
anticipate that a paper, authored by Napper, et al., will be published by the middle of 2021.
Suspected microplastics can then be analyzed by Fourier transform infrared (FTIR) or Raman spectroscopy.
• During any laboratory analysis, all steps should be conducted in a dedicated clean room for microplastic work, with limited access and procedural blanks, as referenced above in field methodology. Cotton laboratory coats and clothes can be worn to reduce contamination from synthetic textiles. It is preferable that laboratory ware be made of non-plastic material (such as glass, stainless steel, or ceramic) and thoroughly rinsed with filtered (1.6 µm) water before use.

66 • AQUATIC SYSTEMS AND AIR • RIVERBANK SURVEYS FOR FISHING DEBRIS
2.4 Riverbank Surveys for Fishing DebrisAbandoned, lost, or otherwise discarded fishing gear (ALDFG) can
cause environmental and socioeconomic harm, but little is known
about its abundance and distribution in rivers, or where it comes
from. This method was developed to help fill those knowledge
gaps in a rapid-assessment format.
Photo by Sara Hylton

AQUATIC SYSTEMS AND AIR • RIVERBANK SURVEYS FOR FISHING DEBRIS • 67
Research Questions This Method Can Help Address • How much ALDFG occurs on riverbanks?
• How does the abundance of ALDFG vary spatially?
• How does the abundance of ALDFG vary temporally?
• What are the characteristics of ALDFG on riverbanks?
Is this method right for you?
• This method is best used in consultation with fishing community members so that they can provide insight on whether items of fishing gear are in use (active) or littered (ALDFG) and what they are used for.
• If definitive identification of ALDFG materials (by polymer type) is required, access to a laboratory with Fourier transform infrared (FTIR) spectroscopy capability will be required.
Resources Needed• Ability to speak the local language, or a translator, to communicate with the fishers.
• Stopwatch.
• A system to track your survey route and distance, such as a handheld GPS unit or a mobile phone with route-tracking app.
• Ruler and tape measure to record the size of ALDFG items.
• Camera.
• Clipboard, pens/pencils, and recording sheet—preferably waterproof paper.
• Small sample bags, permanent marker pen, and scissors to collect samples of ALDFG items.
• If available, a Fourier transform infrared (FTIR) or Raman spectrometer can be used to identify the polymer type for polymer classification of ALDFG items.
Where to Use• This method can be used on riverbanks where a survey team can walk safely and
legally for 30 minutes along the water’s edge, with at least one meter on either side of them.
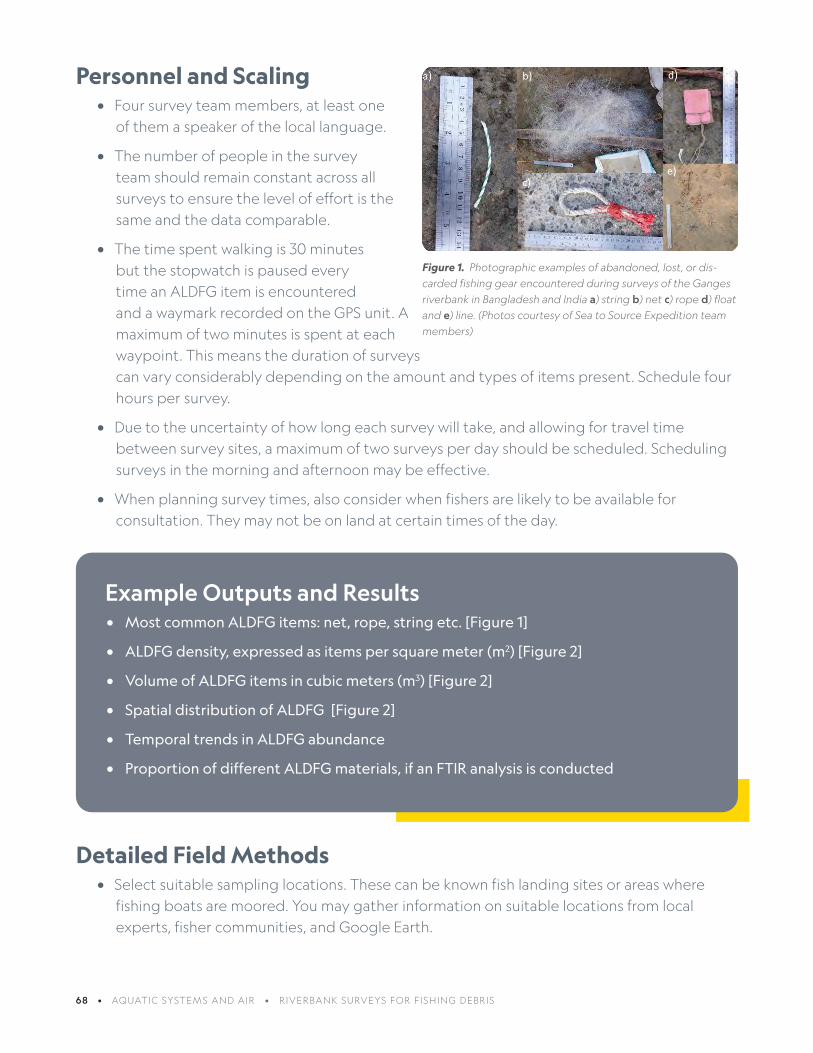
68 • AQUATIC SYSTEMS AND AIR • RIVERBANK SURVEYS FOR FISHING DEBRIS
Personnel and Scaling • Four survey team members, at least one
of them a speaker of the local language.
• The number of people in the survey team should remain constant across all surveys to ensure the level of effort is the same and the data comparable.
• The time spent walking is 30 minutes but the stopwatch is paused every time an ALDFG item is encountered and a waymark recorded on the GPS unit. A maximum of two minutes is spent at each waypoint. This means the duration of surveys can vary considerably depending on the amount and types of items present. Schedule four hours per survey.
• Due to the uncertainty of how long each survey will take, and allowing for travel time between survey sites, a maximum of two surveys per day should be scheduled. Scheduling surveys in the morning and afternoon may be effective.
• When planning survey times, also consider when fishers are likely to be available for consultation. They may not be on land at certain times of the day.
Example Outputs and Results• Most common ALDFG items: net, rope, string etc. [Figure 1]
• ALDFG density, expressed as items per square meter (m2) [Figure 2]
• Volume of ALDFG items in cubic meters (m3) [Figure 2]
• Spatial distribution of ALDFG [Figure 2]
• Temporal trends in ALDFG abundance
• Proportion of different ALDFG materials, if an FTIR analysis is conducted
Detailed Field Methods• Select suitable sampling locations. These can be known fish landing sites or areas where
fishing boats are moored. You may gather information on suitable locations from local experts, fisher communities, and Google Earth.
Figure 1. Photographic examples of abandoned, lost, or dis-
carded fishing gear encountered during surveys of the Ganges
riverbank in Bangladesh and India a) string b) net c) rope d) float
and e) line. (Photos courtesy of Sea to Source Expedition team
members)
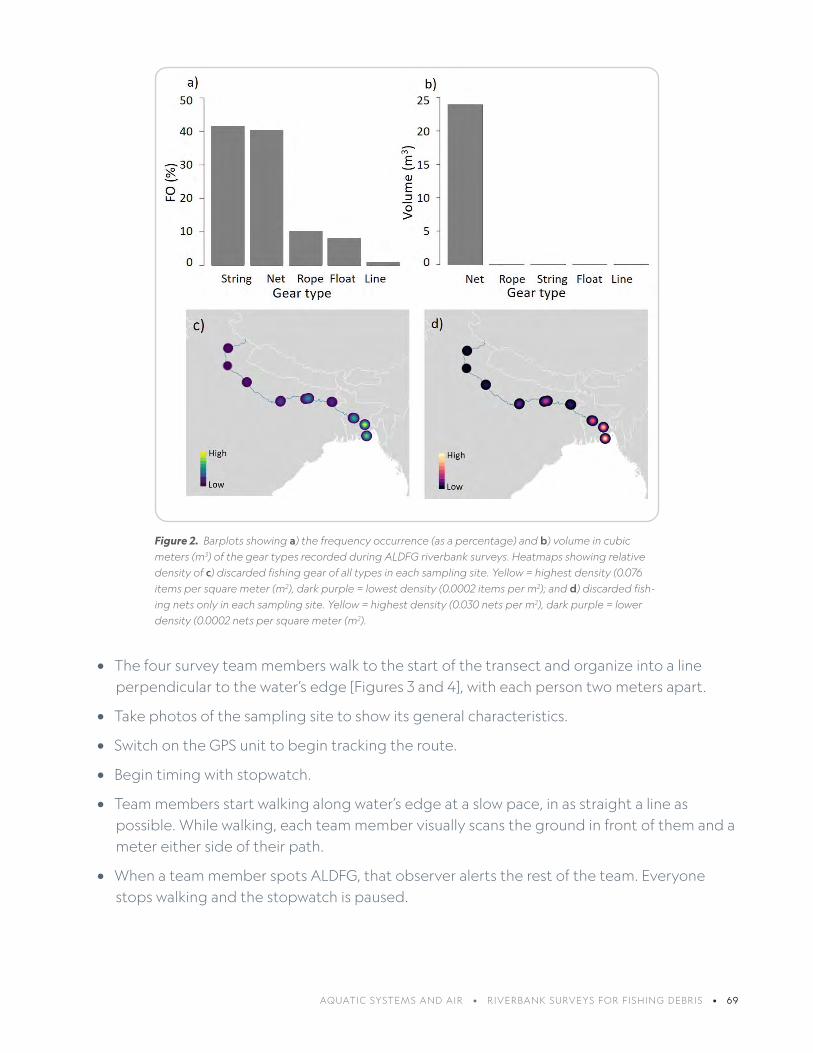
AQUATIC SYSTEMS AND AIR • RIVERBANK SURVEYS FOR FISHING DEBRIS • 69
• The four survey team members walk to the start of the transect and organize into a line perpendicular to the water’s edge [Figures 3 and 4], with each person two meters apart.
• Take photos of the sampling site to show its general characteristics.
• Switch on the GPS unit to begin tracking the route.
• Begin timing with stopwatch.
• Team members start walking along water’s edge at a slow pace, in as straight a line as possible. While walking, each team member visually scans the ground in front of them and a meter either side of their path.
• When a team member spots ALDFG, that observer alerts the rest of the team. Everyone stops walking and the stopwatch is paused.
Figure 2. Barplots showing a) the frequency occurrence (as a percentage) and b) volume in cubic
meters (m3) of the gear types recorded during ALDFG riverbank surveys. Heatmaps showing relative
density of c) discarded fishing gear of all types in each sampling site. Yellow = highest density (0.076
items per square meter (m2), dark purple = lowest density (0.0002 items per m2); and d) discarded fish-
ing nets only in each sampling site. Yellow = highest density (0.030 nets per m2), dark purple = lower
density (0.0002 nets per square meter (m2).

70 • AQUATIC SYSTEMS AND AIR • RIVERBANK SURVEYS FOR FISHING DEBRIS
• Start timing two minutes and record the following information on datasheet [Figure 5]. One person should be assigned as the written notetaker for consistency, though all team members contribute equally to observing and verbally describing the items for the recorder:
❍ Sample number (you can use a nomenclature that also corresponds to the sample site)
❍ Gear type: net/rope/float/string
❍ Height in centimeters (cm)
❍ Width in centimeters (cm)
❍ Length in centimeters (cm)
❍ Mesh size in millimeters (mm) if relevant
❍ Description of gear: fragment, whole net, etc.
❍ Color
❍ Net type
❍ Latitude
❍ Longitude
❍ Description of any floats present and quantity
❍ Sample taken? (yes/no)
• Take one photo only of each item with a ruler or measuring tape for scale. Ensure the order of photos corresponds with entries in the datasheet so the photo files can be electronically labeled once uploaded.
• If conducting FTIR analysis, collect a sample of each distinct type of net found. Note: a sample of each type of net found during the event is collected, but multiple samples of the same type of net (even if found further down the beach) are not needed. Cut out a small portion of the net using the scissors and place in a sample bag. Label bag with sample number, date, and sampling location [Figure 6].
• Record ALDFG on GPS as a waypoint.
• If there are multiple items present, record as many as possible within the two-minute time limit.
Figure 4. Four team members walking in parallel to look for nets
on the ground. (Photo by Jenna Jambeck)
Figure 3. Formation and movement of a transect next to water’s
edge.

AQUATIC SYSTEMS AND AIR • RIVERBANK SURVEYS FOR FISHING DEBRIS • 71
• Team members should not continue searching for items until the survey recommences, as this affects the level of observer effort.
• Once all information is recorded, resume the stopwatch and continue walking along transect until the next ALDFG is encountered.
• After 30 minutes, stop tracking the route on the GPS unit.
• After fieldwork is complete, download the information from the GPS unit and calculate the distance of the transect.
• Download the photos and label them to correspond with the sample number on the datasheet.
• To understand temporal trends, repeat this process across multiple months, seasons, and years, depending on timescale and question of interest.
Safety and Other Considerations
• Prepare a proper risk assessment before conducting fieldwork, in accordance with your organization’s requirements. Points to consider:
❍ Always get any permits or approvals needed to collect these data and access sites to collect samples.
❍ Check the weather. Make sure that expected temperature, rain, and other indicators predict reasonably safe conditions to work outside.
❍ You will be doing a lot of walking, prepare for this with proper clothing and gear. Wear and bring items you would for a long day hike, for example, where you might be exposed to all kinds of weather elements. Wear appropriate footwear, sunscreen as needed, hats, covered shoes, clothes for the temperature, drinking water, etc.
❍ Also be sure to wear clothing that adheres to the social and cultural norms of the community. Wear bright colors or a safety vest so you can be seen.
Figure 5. Measuring, photographing, marking GPS coordinates,
and describing a piece of net found near the river’s edge.
(Photo by Jenna Jambeck)
Figure 6. Sampling the net for polymer identification analysis.
(Photo by Jenna Jambeck)

72 • AQUATIC SYSTEMS AND AIR • RIVERBANK SURVEYS FOR FISHING DEBRIS
❍ Be prepared with any first aid requirements. This includes but is not limited to a basic first aid kit (for minor cuts, scratches, stings, etc.), plenty of water, and sun protection.
❍ Wear gloves when handling ALDFG items.
❍ We recommend working with an in-community partner who can help navigate any local health and safety concerns. Do not survey alone.
❍ Be aware of hazards (such as trips and falls) while walking along the riverbank.
Detailed Analysis Methods• To calculate the density of ALDFG items, it is necessary to first calculate the total area
surveyed.
❍ Download the GPS track of your course and measure distance surveyed.
❍ Transect width is approximately 8 meters (four people, each with 1-meter search area on either side of their path). Total area is surveyed = distance x width.
❍ Density, expressed as: items per square meter (m2) = number of items/total area surveyed.
• To ensure results are comparable with those of existing and future studies, abundance of items should be presented using two metrics: Frequency of occurrence (%FO) and volume in cubic meters (m3). The proportions of each gear type (net, string, rope, float, line) and color should also be presented in this manner.
• To visualize the spatial distribution of ALDFG items, download waypoints and plot them on a map using ArcGIS or QGIS.
• Examine temporal trends using mixed-effects models (fixed effect = temporal variable).
Further Reading• Nelms, S., Duncan, E.M., Patel, S., Badola, R., Bhola, S., Chakma, S., Chowdhury,
G.W., Godley, B.J., Haque, A.B., Johnson, J.A., Khatoon, H., Kumar, S., Napper, I.E., Niloy, M.N.H., Akter, T., Badola, S., Dev, A., Rawat, S., Santillo, D., Sharma, E., Koldewey, H. (2020). Riverine plastic pollution from fisheries: Insights from the Ganges River system. Science of the Total Environment. https://doi.org/10.1016/j.scitotenv.2020.143305

3.KNOWLEDGE, ATTITUDES, AND PERCEPTIONS
Plastic pollution enters the environment for a wide variety of reasons, including poor
product design, inappropriate or inadequate waste management systems, and human
behavior. Understanding the reasons for plastic pollution and finding appropriate
solutions can be aided by understanding local knowledge, attitudes, and perceptions.
Here, social science methods have been tailored to gain an understanding of plastic
pollution in communities, including Key Informant Interviews, Focus Group Discussions
and Household Surveys. In addition, the World Café method engages stakeholders in
collaborative dialogue and knowledge sharing to create possibilities for action. This
section also includes a method to increase awareness and engagement through youth
outreach and education, which can be delivered alongside research activities.
Photo by Sara Hylton

74 • KNOWLEDGE , ATITUDES, AND PERCEPTIONS • KEY INFORMANT INTERVIEWS
3.1 Key Informant InterviewsKey Informant Interviews (KII) allow researchers to collect in-depth
qualitative information from individuals who are selected for their
firsthand experience and special knowledge of a topic of interest.
These conversations take place in a free-flowing manner, using
a semi-structured or unstructured interview approach, and can
provide information to support the design of planned activities
and offer insights and explanations for findings.
Photo by Al-Hasan
KNOWLEDGE , ATITUDES, AND PERCEPTIONS • KEY INFORMANT INTERVIEWS • 75
Research Questions This Method Can Help AddressKII questions that could be posed to the village leader:
• How does your community deal with its waste?
• Does your village face any problems with waste management?
• What do you think causes these problems?
• What kind of relationship does the village have with municipal government on waste collection?
• What waste services and infrastructure has been established in the village? Who decides
where to put these elements?
Is this method right for you?
• This method can be used for a range of purposes like seeking local permissions, information gathering, informing research design, and exploring views. It can be applied at any stage of a project, from identification and planning to evaluation.
• This method can be used to identify other key informants to interview, a technique known as “snowball sampling,” and to identify other individuals who could participate in focus group discussions.
Where to Use• This method can be applied where low-cost and quick information gathering
techniques are required.
• This method is useful when you need qualitative and descriptive information, and you can carefully select key informants for their unique perspectives or specialized knowledge.
• One-on-one settings can enable a comfortable environment for frank and open discussions, particularly around sensitive or emotional topics or if group gatherings are not feasible.
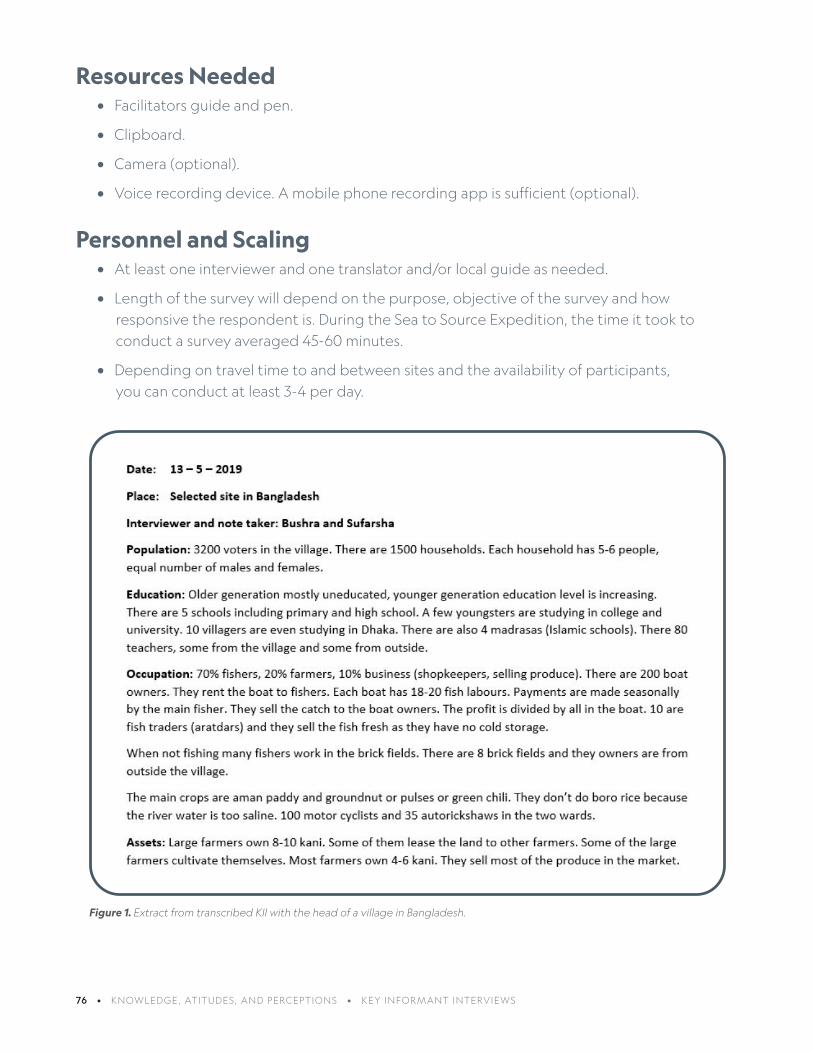
76 • KNOWLEDGE , ATITUDES, AND PERCEPTIONS • KEY INFORMANT INTERVIEWS
Resources Needed• Facilitators guide and pen.
• Clipboard.
• Camera (optional).
• Voice recording device. A mobile phone recording app is sufficient (optional).
Personnel and Scaling • At least one interviewer and one translator and/or local guide as needed.
• Length of the survey will depend on the purpose, objective of the survey and how responsive the respondent is. During the Sea to Source Expedition, the time it took to conduct a survey averaged 45-60 minutes.
• Depending on travel time to and between sites and the availability of participants, you can conduct at least 3-4 per day.
Figure 1. Extract from transcribed KII with the head of a village in Bangladesh.

KNOWLEDGE , ATITUDES, AND PERCEPTIONS • KEY INFORMANT INTERVIEWS • 7 7
Example Outputs and ResultsExamples of outputs from the community:
• Total population, as number of households and/or number of people.
• Number of active schools in the village.
• Number of active health centers.
• Types of facilities provided by health centers.
• Different occupations held by the community.
• Types of assets community members own.
• Names of active NGOs in the village and the types of support and services they provide.
Waste specific output examples:
• Types of plastic waste disposal methods practiced in the village.
• Data on different areas where the village usually disposes of plastic waste. For example, the number and location of trash cans and formal/and or informal dumpsites in the village (if any).
• Types of waste management infrastructure available in the village (if any).
• Funding source available to the village for waste management infrastructure.
• Decision-making actors and processes for waste management implementation within the village.
• How often the municipality collects waste from the village.
• How often waste pickers collect waste from the village.
• Types and number of cleanliness drives/activities that are conducted in the village.
• How often cleanliness drives/activities are conducted in the village.
• Who participates in the cleanliness drives/activities conducted.

78 • KNOWLEDGE , ATITUDES, AND PERCEPTIONS • KEY INFORMANT INTERVIEWS
Detailed Field Methods• Ensure you have completed all required ethics
assessments beforehand.
• Carefully select participants who are experts or well-positioned to speak about the topic of interest and represent the experiences of specific groups.
• Introduce yourself, observe any necessary protocols and clearly state the purpose of your visit. Document consent for the interview and seek permissions early to record the conversation by written and/or audio means, or for any photographs.
• During the interview be flexible and open-minded to allow for unexpected, nuanced, and sometimes conflicting information to surface. Try not to ask leading or biased questions; use probing language appropriately to encourage the respondent to expand on a response or seek clarification.
• Most importantly, watch body language, be a good listener, and know when it is time to wrap up the interview. You may have not gathered all the information you were seeking, but if the responses begin to get repetitive, no new information is being uncovered, or the respondent becomes increasingly frustrated or distracted, it may be time to end the interview. In this case, ask the respondent if they would like to end and begin to wrap up.
• Participants are often giving up a significant amount of time to participate in your research, so it is important from the outset to be clear that their participation is voluntary, and there is no reward for participation or sanctions for refusal. It is good practice to give a small non-monetary token of appreciation to the participants for their time, during the Sea to Source Expedition, at the end of the fieldwork at each site, village leaders were gifted with (plastic-free) fruit and sweet baskets as a gesture of appreciation, for allowing us to work in their village, and showing support which helped facilitate the work during the intensive three-day data collection (Figure 3).
• At your earliest opportunity, review your notes and ensure you have captured all the important information while it is fresh in your memory,
Figure 2. A key informant interview (KII) with a member of
the fishing community. (Photo by Heather Koldewey)
Figure 3. Plastic-free gifts of appreciation provided to
community leaders following surveys. (Photo by
Naresh Kumar Negi)

KNOWLEDGE , ATITUDES, AND PERCEPTIONS • KEY INFORMANT INTERVIEWS • 79
that your notes are legible, and you expand any points that you were unable to note fully at the time.
• In the case of the Sea to Source Expedition, experienced field researchers conducted these as unstructured interviews. No list of questions or guides was used; instead, a few specific points or topics were covered (see examples above), in addition to the overall discussion. This approach was taken since these interviews began early on in community interactions to gather background information, invite discussion, and test ideas that had been included in facilitator guides and survey tools, and orient the research team with the community.
Safety and Other Considerations• Prepare appropriate risk and ethics assessments according to your organization’s
requirements prior to conducting interviews. Some key considerations:
❍ Always get permits or seek permissions needed to collect this data, including any photographs.
❍ Always ensure the local authorities, village leaders, or elders are aware you are working in the village on the specific days previously agreed upon. It is customary to meet the village leader first when you arrive in a community; they are very often a useful key informant to interview.
❍ Always meet in a safe and accessible place.
❍ Always work with local researchers or community members to recruit participants and to help with the local language (where needed).
❍ Be considerate of your audience, adhere to local social norms and religious customs, and wear culturally appropriate/sensitive clothing.
❍ Discuss any concerns, think through precautions, and bring the appropriate safety gear to ensure the safety of you and the community.
Detailed Analysis Methods• The Sea to Source Expedition used KIIs to:
❍ Observe local customs.
❍ Meet the village head or council members on arrival at each site.
❍ Ensure permission was in place to conduct field work.
❍ Introduce the village head to the research team.
❍ Understand population demographics of the village to inform sampling for other research methods used (see FGDs and surveys).
❍ Better understand the local situation and talk through prior assumptions on waste management to feed into other research methods, rather than as a qualitative research method.
80 • KNOWLEDGE , ATITUDES, AND PERCEPTIONS • KEY INFORMANT INTERVIEWS
• For a detailed description of methods for the processing, analysis and presentation of qualitative data see Newing et al 2011 and World Bank 2020.
• Please remember, the type and level of analysis will be guided by your objectives. For example, if KIIs are implemented to understand the lay of the land when working at a new site and learn more about local dynamics to inform activity design, further research analysis methods may not be necessary.
Further Reading• Patel S., et al. (in prep.). Exploring multidimensional poverty and plastic pollution to
engender change in rural solid waste management.
• Bryman, A. (2012). Social Research Methods 4th edition. Oxford University Press
• Newing, H., Eagle, C.M., Puri, R.K., Watson, C.W. (2011). Conducting Research in Conservation: Social science methods and practice. Routledge: London and New York, pp. 399.
• Pahl, S. Wyles, K. (2016). The Human Dimension: How Social and Behavioural Research Methods Can Help Address Microplastics in the Environment. Anal. Methods. 9. 10.1039/C6AY02647H.
• USAID (1996). Technical Note on Key Informant Interviews. Monitoring and Evaluation Series
• World Bank (2020). Understanding People’s Perspectives on Identification: A Qualitative Research Toolkit. Washington, DC: World Bank License: Creative Commons Attribution 3.0 IGO (CC BY 3.0 IGO).
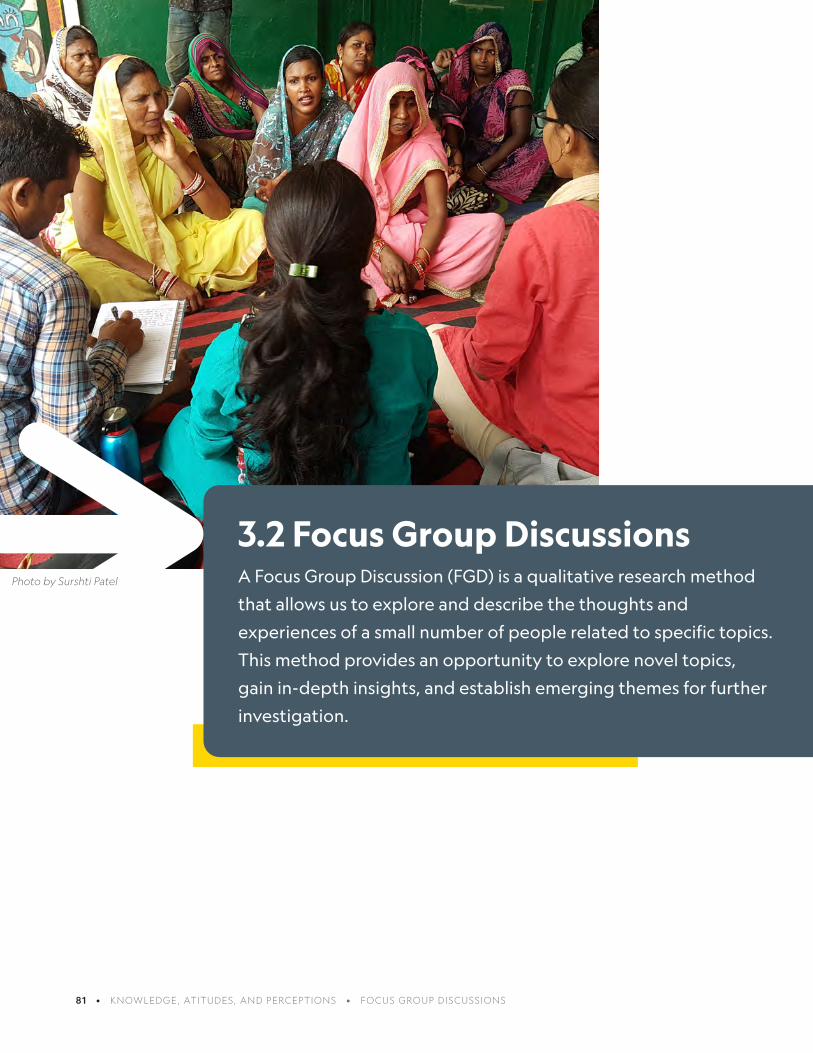
81 • KNOWLEDGE , ATITUDES, AND PERCEPTIONS • FOCUS GROUP DISCUSSIONS
3.2 Focus Group DiscussionsA Focus Group Discussion (FGD) is a qualitative research method
that allows us to explore and describe the thoughts and
experiences of a small number of people related to specific topics.
This method provides an opportunity to explore novel topics,
gain in-depth insights, and establish emerging themes for further
investigation.
Photo by Surshti Patel
KNOWLEDGE , ATITUDES, AND PERCEPTIONS • FOCUS GROUP DISCUSSIONS • 82
Research Questions This Method Can Help Address • Who uses single-use plastic and what types of it are they using?
• What are the local drivers and impacts of plastic use and pollution?
• What is the public’s knowledge and awareness about plastic pollution and waste management?
• What are the various perceptions, attitudes, and practices relating to plastic pollution?
• What barriers exist to mitigating the impacts of plastics? What are potential opportunities to change behavior?
Is this method right for you?
• This method is for anyone who wants to understand the human dimensions of plastics by studying attitudes, perceptions, and behaviors in order to inform mitigation strategies and systems change. These strategies include behavior change campaigns and implementing locally-led solutions.
• Anyone working with this method will understand how different stakeholders contribute, perceive, and understand the issue. They will also be able to identify the opportunities and barriers to addressing it.
• This method offers an opportunity to collaborate on the development of communications and solutions with relevant stakeholders.
• This method can be applied to inform the design of in-depth interviews and applied alongside other quantitative or mixed-method approaches to allow for suitable statistical analysis (Pahl and Wyles 2016 provides further details).
Where to Use• This method can be applied in any environment where you can gather a group of 5-12
people within your target audience.
• This method may be preferred if working in communities where literacy rates are low, as there is less reliance on written text, and it can be combined effectively with visual aids.
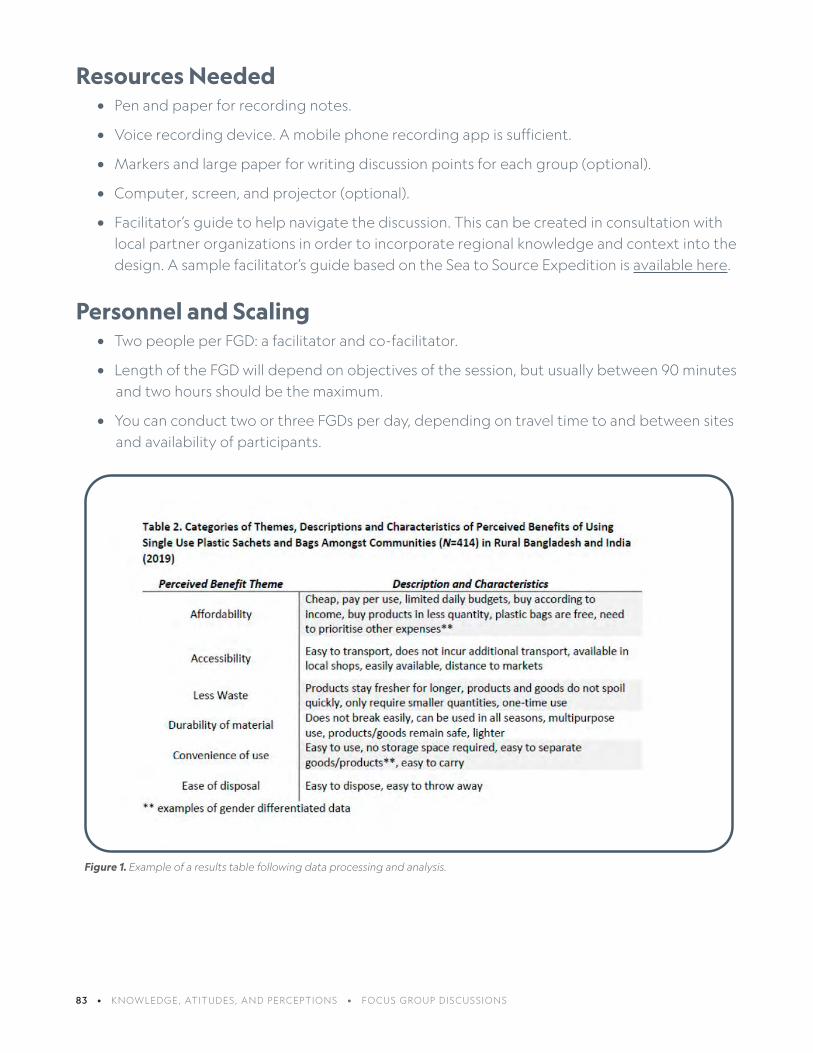
83 • KNOWLEDGE , ATITUDES, AND PERCEPTIONS • FOCUS GROUP DISCUSSIONS
Resources Needed• Pen and paper for recording notes.
• Voice recording device. A mobile phone recording app is sufficient.
• Markers and large paper for writing discussion points for each group (optional).
• Computer, screen, and projector (optional).
• Facilitator’s guide to help navigate the discussion. This can be created in consultation with local partner organizations in order to incorporate regional knowledge and context into the design. A sample facilitator’s guide based on the Sea to Source Expedition is available here.
Personnel and Scaling• Two people per FGD: a facilitator and co-facilitator.
• Length of the FGD will depend on objectives of the session, but usually between 90 minutesand two hours should be the maximum.
• You can conduct two or three FGDs per day, depending on travel time to and between sitesand availability of participants.
Figure 1. Example of a results table following data processing and analysis.
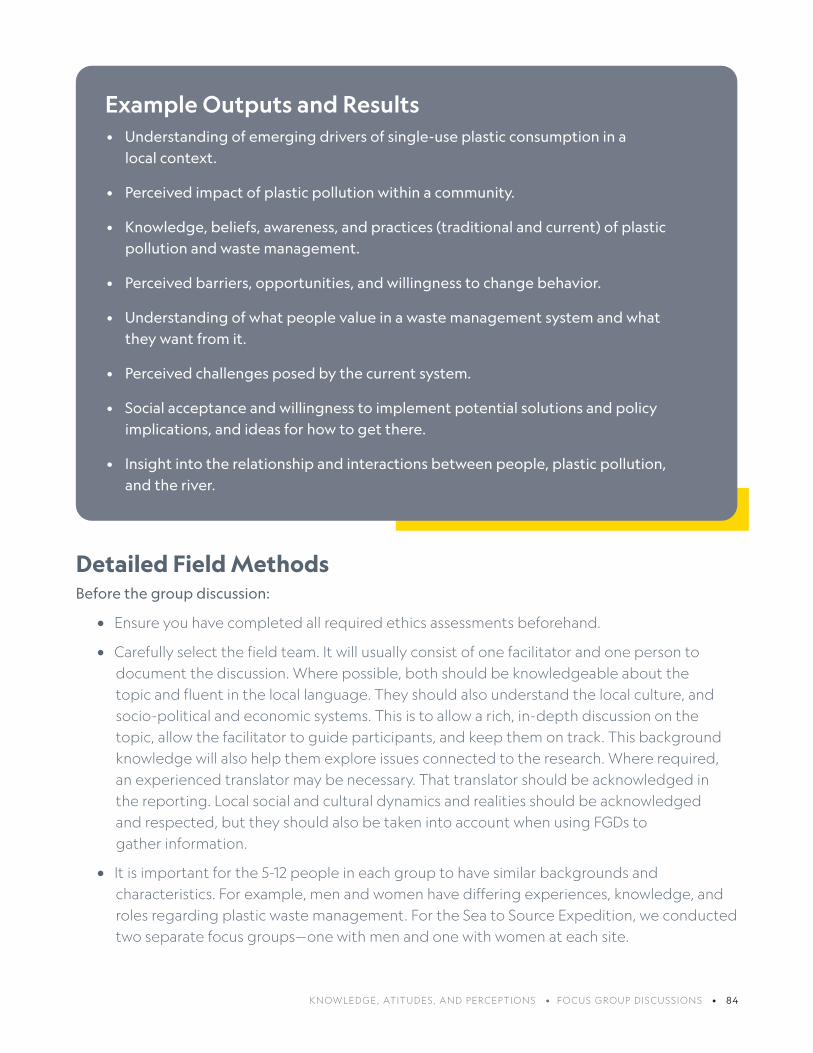
KNOWLEDGE , ATITUDES, AND PERCEPTIONS • FOCUS GROUP DISCUSSIONS • 84
Example Outputs and Results• Understanding of emerging drivers of single-use plastic consumption in a
local context.
• Perceived impact of plastic pollution within a community.
• Knowledge, beliefs, awareness, and practices (traditional and current) of plastic pollution and waste management.
• Perceived barriers, opportunities, and willingness to change behavior.
• Understanding of what people value in a waste management system and what they want from it.
• Perceived challenges posed by the current system.
• Social acceptance and willingness to implement potential solutions and policy implications, and ideas for how to get there.
• Insight into the relationship and interactions between people, plastic pollution, and the river.
Detailed Field MethodsBefore the group discussion:
• Ensure you have completed all required ethics assessments beforehand.
• Carefully select the field team. It will usually consist of one facilitator and one person to document the discussion. Where possible, both should be knowledgeable about the topic and fluent in the local language. They should also understand the local culture, and socio-political and economic systems. This is to allow a rich, in-depth discussion on the topic, allow the facilitator to guide participants, and keep them on track. This background knowledge will also help them explore issues connected to the research. Where required, an experienced translator may be necessary. That translator should be acknowledged in the reporting. Local social and cultural dynamics and realities should be acknowledged and respected, but they should also be taken into account when using FGDs to gather information.
• It is important for the 5-12 people in each group to have similar backgrounds and characteristics. For example, men and women have differing experiences, knowledge, and roles regarding plastic waste management. For the Sea to Source Expedition, we conducted two separate focus groups—one with men and one with women at each site.
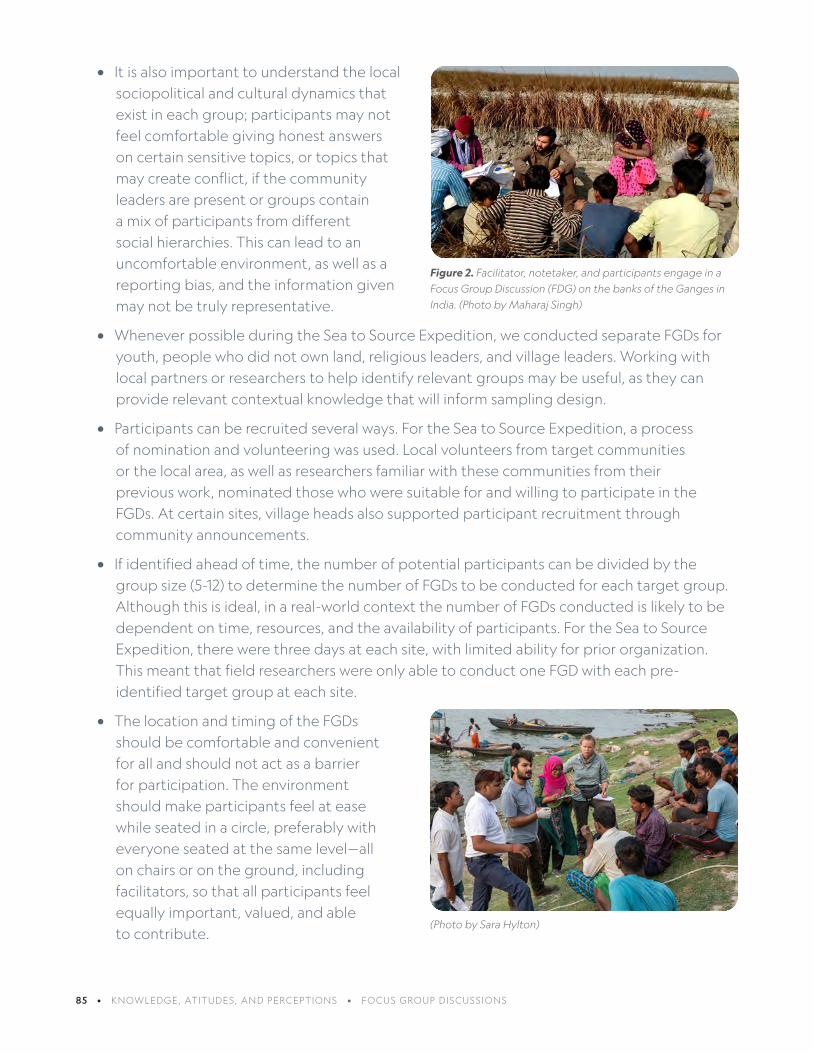
85 • KNOWLEDGE , ATITUDES, AND PERCEPTIONS • FOCUS GROUP DISCUSSIONS
• It is also important to understand the local sociopolitical and cultural dynamics that exist in each group; participants may not feel comfortable giving honest answers on certain sensitive topics, or topics that may create conflict, if the community leaders are present or groups contain a mix of participants from different social hierarchies. This can lead to an uncomfortable environment, as well as a reporting bias, and the information given may not be truly representative.
• Whenever possible during the Sea to Source Expedition, we conducted separate FGDs for youth, people who did not own land, religious leaders, and village leaders. Working with local partners or researchers to help identify relevant groups may be useful, as they can provide relevant contextual knowledge that will inform sampling design.
• Participants can be recruited several ways. For the Sea to Source Expedition, a process of nomination and volunteering was used. Local volunteers from target communities or the local area, as well as researchers familiar with these communities from their previous work, nominated those who were suitable for and willing to participate in the FGDs. At certain sites, village heads also supported participant recruitment through community announcements.
• If identified ahead of time, the number of potential participants can be divided by the group size (5-12) to determine the number of FGDs to be conducted for each target group. Although this is ideal, in a real-world context the number of FGDs conducted is likely to be dependent on time, resources, and the availability of participants. For the Sea to Source Expedition, there were three days at each site, with limited ability for prior organization. This meant that field researchers were only able to conduct one FGD with each pre-identified target group at each site.
• The location and timing of the FGDs should be comfortable and convenient for all and should not act as a barrier for participation. The environment should make participants feel at ease while seated in a circle, preferably with everyone seated at the same level—all on chairs or on the ground, including facilitators, so that all participants feel equally important, valued, and able to contribute.
Figure 2. Facilitator, notetaker, and participants engage in a
Focus Group Discussion (FDG) on the banks of the Ganges in
India. (Photo by Maharaj Singh)
(Photo by Sara Hylton)

KNOWLEDGE , ATITUDES, AND PERCEPTIONS • FOCUS GROUP DISCUSSIONS • 86
• The facilitator’s guide can be completed in consultation with local partner organizations—they can provide local knowledge and context on the topic and incorporate it into the design. Field piloting and refinement are important steps to ensure the suitability of the questions, techniques, translations, and type of responses received. A sample facilitator’s guide based on the Sea to Source Expedition is available here.
• When possible, give any equipment a trial run to check its suitability. For example, if using a mobile phone app to record group discussions, try this in varying rooms and groups sizes to ensure conversations can be heard clearly.
During the group discussion:
• Ensure at the start of the interview you introduce yourself, observe any necessary protocols, and clearly state the purpose of your visit. Document consent for the interview, assure privacy and confidentiality, and seek permissions early to record (via written and/or audio means) conversations. Also get permission to take photographs.
• Remain flexible and open-minded during the interview to allow for unexpected, incomplete, nuanced, and sometimes conflicting information to surface. The discussion may drift away from the original question.
• Do not ask leading or biased questions, but use probes appropriately to encourage the respondents to expand on a response, seek clarification, and guide discussion.
• The ability to include all participants in the discussion is a key role of the facilitators; they should listen carefully to all opinions and note levels of engagement and participation from individuals. The facilitator may need to encourage those who are quieter and seem more reluctant to speak to share their opinions and views. Encourage politely and without force.
• The facilitator also needs to find creative, constructive ways to prevent the more talkative or dominant participants from dominating the dialogue, without hindering their enthusiasm or insulting them. For example, facilitators may assess the group dynamics and decide to split into smaller breakout groups to elicit responses from quieter or more reluctant participants.
• The co-facilitator, who is documenting the discussion, should comprehensively note group characteristics, themes that emerge during the discussion, nonverbal communication, and key word-for-word quotes from participants that are especially illuminating.
• Most importantly, watch body language, be a good listener, and know when it is time to wrap up the discussion. Even if all the desired information has not been gathered, if the responses begin to get repetitive, no new information is being uncovered, or the
(Photo by Surshti Patel)
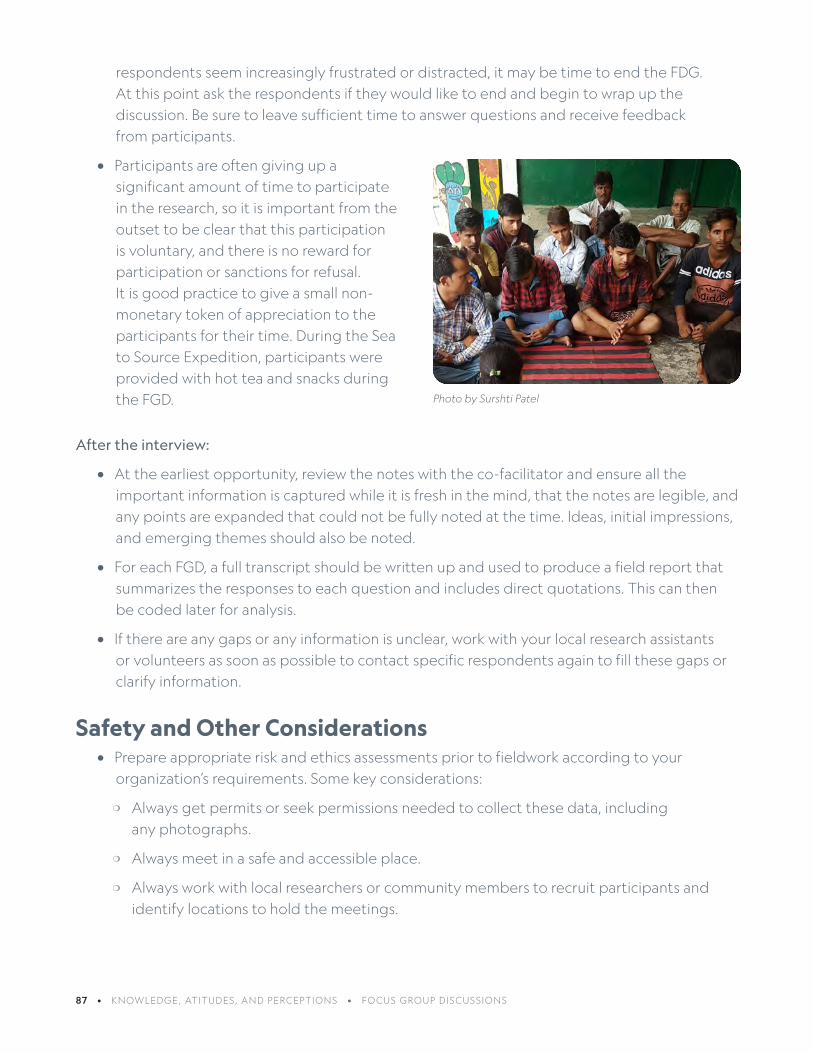
87 • KNOWLEDGE , ATITUDES, AND PERCEPTIONS • FOCUS GROUP DISCUSSIONS
respondents seem increasingly frustrated or distracted, it may be time to end the FDG. At this point ask the respondents if they would like to end and begin to wrap up the discussion. Be sure to leave sufficient time to answer questions and receive feedback from participants.
• Participants are often giving up a significant amount of time to participate in the research, so it is important from the outset to be clear that this participation is voluntary, and there is no reward for participation or sanctions for refusal. It is good practice to give a small non-monetary token of appreciation to the participants for their time. During the Sea to Source Expedition, participants were provided with hot tea and snacks during the FGD.
After the interview:
• At the earliest opportunity, review the notes with the co-facilitator and ensure all the important information is captured while it is fresh in the mind, that the notes are legible, and any points are expanded that could not be fully noted at the time. Ideas, initial impressions, and emerging themes should also be noted.
• For each FGD, a full transcript should be written up and used to produce a field report that summarizes the responses to each question and includes direct quotations. This can then be coded later for analysis.
• If there are any gaps or any information is unclear, work with your local research assistants or volunteers as soon as possible to contact specific respondents again to fill these gaps or clarify information.
Safety and Other Considerations• Prepare appropriate risk and ethics assessments prior to fieldwork according to your
organization’s requirements. Some key considerations:
❍ Always get permits or seek permissions needed to collect these data, including any photographs.
❍ Always meet in a safe and accessible place.
❍ Always work with local researchers or community members to recruit participants and identify locations to hold the meetings.
Photo by Surshti Patel

KNOWLEDGE , ATITUDES, AND PERCEPTIONS • FOCUS GROUP DISCUSSIONS • 88
❍ We recommend, wherever possible, that you facilitate the discussions in the local language or use a local translator, where a facilitator or co-facilitator is not from the area.
❍ Be considerate of your audience, including local social norms and religious customs, and wear culturally-appropriate clothing.
❍ Ensure there is at least one well-stocked first aid kit present.
❍ Please take note of local public health conditions and guidance; circumstances might not allow for safe gatherings indoors, and even outdoor events may present risks. Consult with relevant local officials about safe standards for in-person meetings, and apply appropriate social distancing and protective measures as needed.
Detailed Analysis Methods• For the Sea to Source Expedition, the data collected from FGDs were manually coded for
thematic and count analysis. There are several software packages that can also support automatically coding data, such as NVivo. Regardless of approach, whether manually or by software, coding of qualitative data takes time and your findings may require some ground validation.

89 • KNOWLEDGE , ATITUDES, AND PERCEPTIONS • FOCUS GROUP DISCUSSIONS
Further Reading• Nishat, B., Brooks A., Chakma, S., Jambeck, J.R., Koldewey, H.J., Niloy, M.N.H., Patel,
S., Youngblood, K., Zakir, T., Chowdhury, G.W. (in prep.). Plastic Waste Generation, Characterization and Management in Communities along the Meghna and Padma, in Bangladesh.
• Patel S., et al. (in prep.). Exploring multidimensional poverty and plastic pollution to engender change in rural solid waste management
• Bryman, A. (2012). Social Research Methods 4th edition. Oxford University Press
• Henderson, L., & Green, C. (2020). Making sense of microplastics? Public understandings of plastic pollution. Marine Pollution Bulletin, 152, 110908.
• Newing, H., Eagle, C.M., Puri, R.K., Watson, C.W. (2011). Conducting Research in Conservation: Social science methods and practice. Routledge: London and New York, 399 pp.
• Pahl, S., Wyles, K. (2016). The Human Dimension: How Social and Behavioural Research Methods Can Help Address Microplastics in the Environment. Analytical Methods.
• USAID (2013). Technical Note on Focus Group Interviews. Monitoring and Evaluation Series
• World Bank. (2020). Understanding People’s Perspectives on Identification: A Qualitative Research Toolkit, Washington, DC.
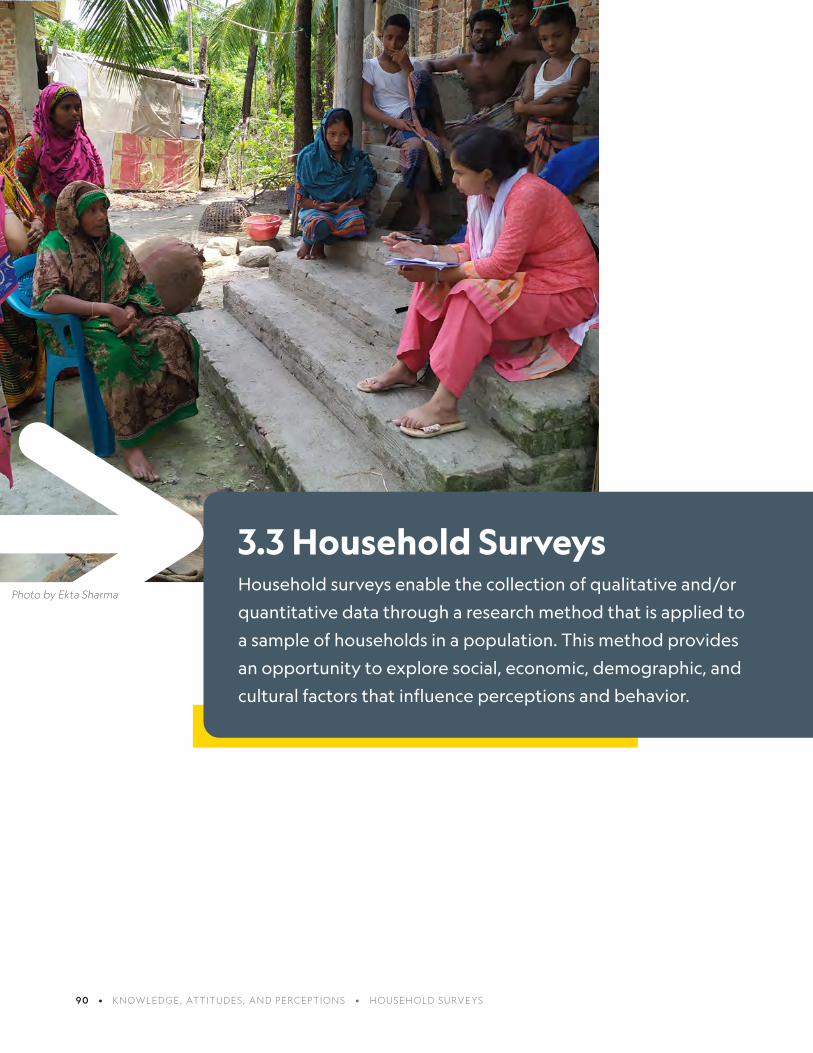
90 • KNOWLEDGE , ATTITUDES, AND PERCEPTIONS • HOUSEHOLD SURVEYS
3.3 Household SurveysHousehold surveys enable the collection of qualitative and/or
quantitative data through a research method that is applied to
a sample of households in a population. This method provides
an opportunity to explore social, economic, demographic, and
cultural factors that influence perceptions and behavior.
Photo by Ekta Sharma
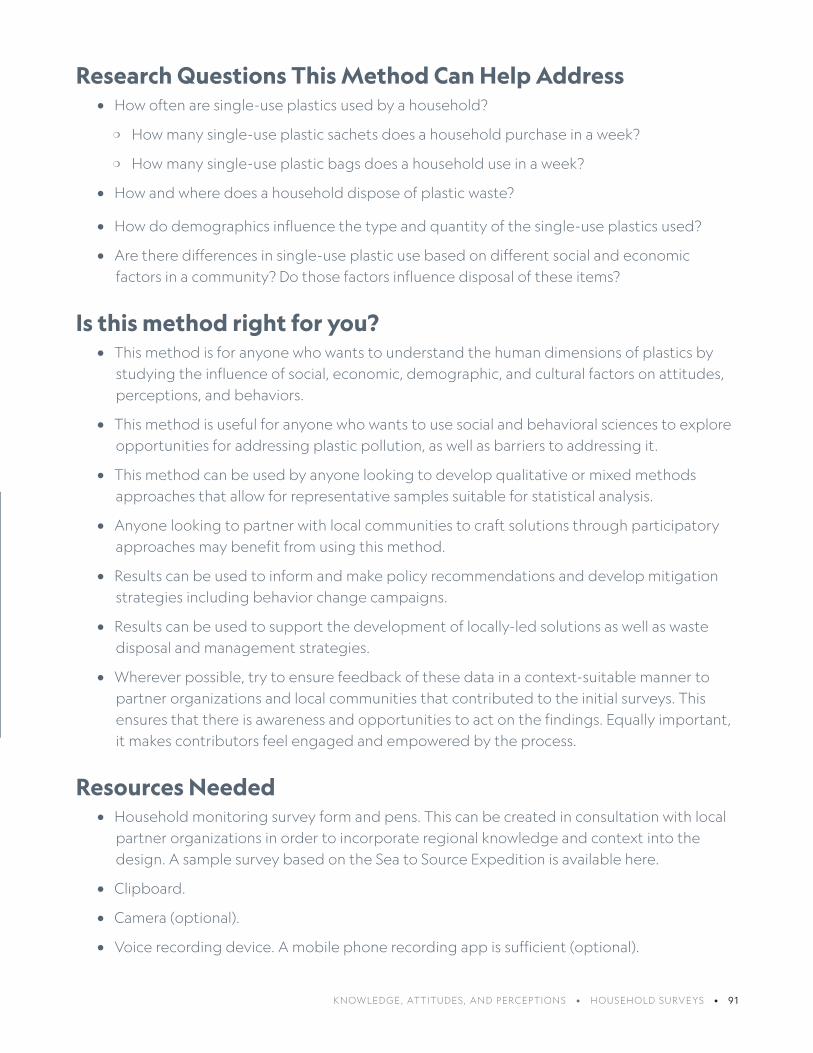
KNOWLEDGE , ATTITUDES, AND PERCEPTIONS • HOUSEHOLD SURVEYS • 91
Research Questions This Method Can Help Address • How often are single-use plastics used by a household?
❍ How many single-use plastic sachets does a household purchase in a week?
❍ How many single-use plastic bags does a household use in a week?
• How and where does a household dispose of plastic waste?
• How do demographics influence the type and quantity of the single-use plastics used?
• Are there differences in single-use plastic use based on different social and economic factors in a community? Do those factors influence disposal of these items?
Is this method right for you?
• This method is for anyone who wants to understand the human dimensions of plastics by studying the influence of social, economic, demographic, and cultural factors on attitudes, perceptions, and behaviors.
• This method is useful for anyone who wants to use social and behavioral sciences to explore opportunities for addressing plastic pollution, as well as barriers to addressing it.
• This method can be used by anyone looking to develop qualitative or mixed methods approaches that allow for representative samples suitable for statistical analysis.
• Anyone looking to partner with local communities to craft solutions through participatory approaches may benefit from using this method.
• Results can be used to inform and make policy recommendations and develop mitigation strategies including behavior change campaigns.
• Results can be used to support the development of locally-led solutions as well as waste disposal and management strategies.
• Wherever possible, try to ensure feedback of these data in a context-suitable manner to partner organizations and local communities that contributed to the initial surveys. This ensures that there is awareness and opportunities to act on the findings. Equally important, it makes contributors feel engaged and empowered by the process.
Resources Needed• Household monitoring survey form and pens. This can be created in consultation with local
partner organizations in order to incorporate regional knowledge and context into the design. A sample survey based on the Sea to Source Expedition is available here.
• Clipboard.
• Camera (optional).
• Voice recording device. A mobile phone recording app is sufficient (optional).

92 • KNOWLEDGE , ATTITUDES, AND PERCEPTIONS • HOUSEHOLD SURVEYS
Where to Use• This method can be applied when working in any local community, where you
have a local partner or guide that can assist you with familiarizing yourself with the community, meeting participants and help arrange interviews.
• Where a population census is available, this can be used to determine your sampling frame and size, using random sampling to ensure a representative study. For example, you could sample 10 percent of a community, or a minimum of 100 people, with a focus on communities with a strong relationship with or proximity to a body of water, and relatively close to an urban center.
• In the absence of a population census, you can work with local community leaders or health providers to see if population data is available. If not, during Key Informant Interviews, you can work with local or village leaders to understand local population demographics and use this information to inform the development of an appropriate sampling strategy.
• While it is ideal to use this method in a setting where a statistically significant sample size can be established, this also needs to be considered alongside available resources, and may not always be possible (Liswanti, et al. 2012). For example, the Sea to Source Expedition was limited to six days per site (three days pre-monsoon and three days post-monsoon), so sampling 10 percent of the community was not always possible. However, at least 100 interviews per site were obtained, across different groups of interest.
Personnel and Scaling • At least one interviewer and one translator and/or local guide as needed.
• Length of the survey will depend on the purpose and objective of the survey, but usually 45-60 minutes should be the maximum.
• Depending on travel time to and between sites and the availability of participants, you might conduct four or five surveys a day.

KNOWLEDGE , ATTITUDES, AND PERCEPTIONS • HOUSEHOLD SURVEYS • 93
Example Outputs and Results• Household demographics
• Subjective wellbeing as a measure of life satisfaction
• Household material lifestyle (wealth proxy)
• Household weekly/monthly single-use plastic usage
• Household food security
• Household waste disposal practices
• Household interactions with the river and natural environment
• Household willingness to change behaviors and adopt new practices
• Knowledge, beliefs, awareness, and attitudes towards plastic pollution and waste management
Detailed Field MethodsBefore you start:
• Ensure you have completed all required ethics assessments beforehand.
• Where available/possible, it is always helpful to gather existing data on target communities from secondary sources or local partner organizations to inform survey development.
• Survey development should be completed in consultation with local partner organizations that can contribute their perspective and local context to the design. Some example components:
❍ Respondent profile.
❍ Household demographics and characteristics.
❍ Life quality, food security, and wealth.
❍ Waste and plastic waste consumption and disposal.
❍ Knowledge, attitudes, and perceptions.
❍ Additional related questions were developed for specific audiences, such as fishers, shopkeepers and waste collectors.
❍ An example survey is available here. Please remember your survey design will be decided by the purpose and objectives of your study.

94 • KNOWLEDGE , ATTITUDES, AND PERCEPTIONS • HOUSEHOLD SURVEYS
• Field piloting and refinement is an important step to ensure the suitability of the questions, the translation, techniques, indicators, type of data collected, and any equipment.
• To help deal with bias, where possible, it may be most appropriate to work with research assistants who share backgrounds to those being interviewed. Those with backgrounds in common with subjects are less likely to be perceived as from any overseeing organizations or authority.
During the Interview:
• Ensure at the start of the interview you introduce yourself, observe any necessary protocols and courtesies and clearly state the purpose of your visit. Document consent for the interview, assure anonymity, and seek permissions early to record the conversation by written, audio, or photographic means.
• It is important from the outset to be clear that this participation is voluntary, and there is neither reward for participation nor sanctions for refusal.
• Set the tone you like at the start of the interview. The tone and formality you begin with will tend to continue throughout.
• Each interview will be unique, even when applying a structured approach. Be open-minded and try to make respondents feel at ease—you may come across new information that you have not received before.
• Use simple probes to elicit extra information and ensure you have allowed room to record this on your survey form. Ensure you write down your questions alongside responses.
• Be prepared to repeat or rephrase questions slightly so that the respondent understands the question being asked. However, try to make sure that you do not ask leading or biased questions; use probing language appropriately to encourage the respondent to expand on a response or seek clarification.
• The interview will generally become easier as it goes on and the researcher and respondent become more comfortable with each other. If you reach sensitive topics and the respondent does not want to answer or gives short, elusive responses, move onto a different section and come back to that difficult section later on. If during the interview you have been unable to strike a good rapport with the respondent, or the respondent does not seem at ease, perhaps you may be able to come back to the more sensitive questions later on.
• Always gently emphasize that you are not looking for the right answers and there is no
Figure 1. Field interviews being conducted.
(Photo by Heather Koldewey)
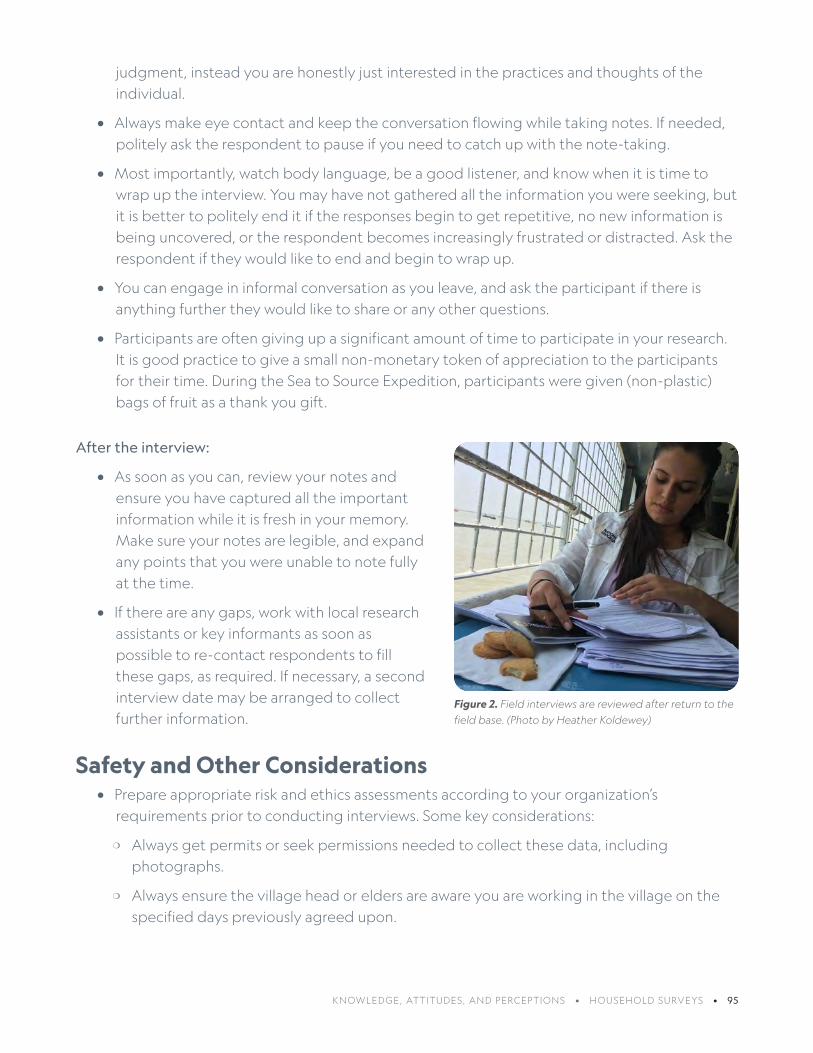
KNOWLEDGE , ATTITUDES, AND PERCEPTIONS • HOUSEHOLD SURVEYS • 95
judgment, instead you are honestly just interested in the practices and thoughts of the individual.
• Always make eye contact and keep the conversation flowing while taking notes. If needed, politely ask the respondent to pause if you need to catch up with the note-taking.
• Most importantly, watch body language, be a good listener, and know when it is time to wrap up the interview. You may have not gathered all the information you were seeking, but it is better to politely end it if the responses begin to get repetitive, no new information is being uncovered, or the respondent becomes increasingly frustrated or distracted. Ask the respondent if they would like to end and begin to wrap up.
• You can engage in informal conversation as you leave, and ask the participant if there is anything further they would like to share or any other questions.
• Participants are often giving up a significant amount of time to participate in your research. It is good practice to give a small non-monetary token of appreciation to the participants for their time. During the Sea to Source Expedition, participants were given (non-plastic) bags of fruit as a thank you gift.
After the interview:
• As soon as you can, review your notes and ensure you have captured all the important information while it is fresh in your memory. Make sure your notes are legible, and expand any points that you were unable to note fully at the time.
• If there are any gaps, work with local research assistants or key informants as soon as possible to re-contact respondents to fill these gaps, as required. If necessary, a second interview date may be arranged to collect further information.
Safety and Other Considerations• Prepare appropriate risk and ethics assessments according to your organization’s
requirements prior to conducting interviews. Some key considerations:
❍ Always get permits or seek permissions needed to collect these data, including photographs.
❍ Always ensure the village head or elders are aware you are working in the village on the specified days previously agreed upon.
Figure 2. Field interviews are reviewed after return to the
field base. (Photo by Heather Koldewey)

96 • KNOWLEDGE , ATTITUDES, AND PERCEPTIONS • HOUSEHOLD SURVEYS
❍ Always meet in a safe and accessible place.
❍ Always work with local researchers or known community members to recruit participants and to help with the local language (where needed).
❍ Be considerate of your audience, adhere to local social norms and religious customs, and wear culturally appropriate/sensitive clothing.
❍ Discuss any concerns, think through precautions, and bring the appropriate safety gear to ensure that you and the community are safe during the activity.
Detailed Analysis Methods• For a detailed description on processing, analysis, and presentation of quantitative and
qualitative data see Newing, et al. (2011) and World Bank (2020).
• When possible, ensure that the results and outcomes of the work get back to the community, so that they can be empowered with the data to take action.
Photo by Heather Koldewey

KNOWLEDGE , ATTITUDES, AND PERCEPTIONS • HOUSEHOLD SURVEYS • 97
Further Reading• Patel S., et al. (in prep.). Exploring multidimensional poverty and plastic pollution to
engender change in rural solid waste management.
• Nelms, S., Duncan, E.M., Patel, S., Badola, R., Bhola, S., Chakma, S., Chowdhury, G.W., Godley, B.J., Haque, A.B., Johnson, J.A., Khatoon, H., Kumar, S., Napper, I.E., Niloy, M.N.H., Akter, T., Badola, S., Dev, A., Rawat, S., Santillo, D., Sharma, E., Koldewey, H. (2020). Riverine plastic pollution from fisheries: Insights from the Ganges River system. Science of the Total Environment. https://doi.org/10.1016/j.scitotenv.2020.143305
• Bryman, A. (2012). Social Research Methods 4th edition. Oxford University Press
• Newing, H., Eagle, C.M., Puri, R.K., Watson, C.W. (2011). Conducting Research in Conservation: Social science methods and practice. Routledge: London and New York, 399 pp.
• Pahl, S. Wyles, K. (2016). The Human Dimension: How Social and Behavioural Research Methods Can Help Address Microplastics in the Environment. Analytical Methods.
• World Bank. (2020). Understanding People’s Perspectives on Identification: A Qualitative Research Toolkit, Washington, DC.

98 • KNOWLEDGE , ATTITUDES, AND PERCEPTIONS • WORLD CAFÉ WORKSHOP
3.4 World Café WorkshopWorld Café methodology is a creative process for leading
collaborative dialogue, sharing knowledge, and creating
possibilities for action. The World Café approach places value on
group intelligence, organizing several discussion rounds on a topic
of mutual interest. These structured small-group conversations
are designed to elicit individual ideas and synthesize them into a
comprehensive message.
This process of inquiry is based on methods developed by The World Café.
Photo by Sara Hylton

KNOWLEDGE , ATTITUDES, AND PERCEPTIONS • WORLD CAFÉ WORKSHOP • 99
Research Questions This Method Can Help Address • What are perceived as the most problematic litter items in a city or community?
• What are the largest barriers to changing the ways plastic is used and managed?
• What is the role of policy in managing plastic waste?
• How can barriers be overcome and change be facilitated?
Is this method right for you? • This method is intended to be used in communities with a wide variety of stakeholders with
different perspectives, such as industry, business, government, NGOs, etc.
• This method requires a minimum of 10 participants, but is best suited for groups larger than 15. A larger group may require additional support for the facilitator.
• This method can be used to gauge the workshop attendees’ thoughts on particular questions or issues. These questions could include:
❍ What is the most problematic litter item in your community?
❍ How would you change the product design or management system to address this item?
❍ What policies need to be put into place for these changes to happen?
Resources Needed• A room with multiple tables and areas for breakout group discussion.
• Markers and large paper for writing discussion points for each group.
• Computer, screen, and projector (optional).
• Microphone (optional, or as needed for group size).
• Appropriate refreshments for sustained group energy and to encourage continued informal conversations. If not these supplying yourself, liaise with the provider to ensure these are not served with single-use plastic.
Where to Use• This method can be used in any city, town, or village.
• This method requires sufficient space to conduct the workshop for the full duration.
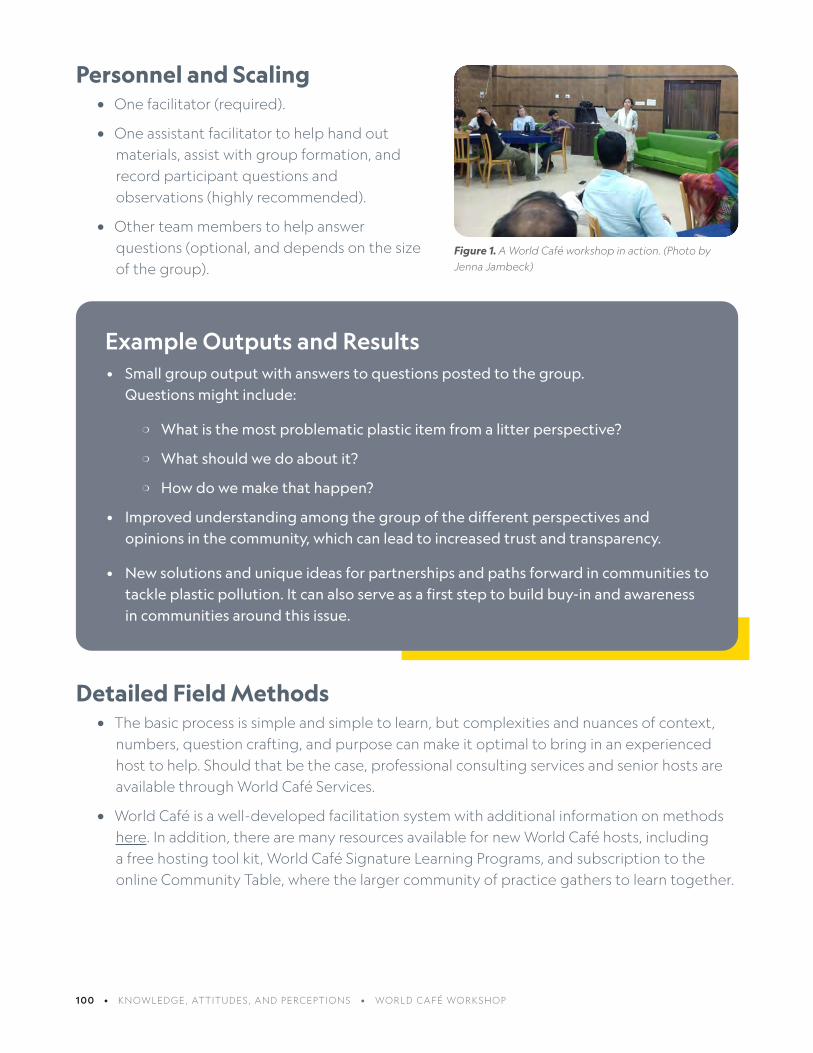
100 • KNOWLEDGE , ATTITUDES, AND PERCEPTIONS • WORLD CAFÉ WORKSHOP
Personnel and Scaling • One facilitator (required).
• One assistant facilitator to help hand out materials, assist with group formation, and record participant questions and observations (highly recommended).
• Other team members to help answer questions (optional, and depends on the size of the group).
Example Outputs and Results• Small group output with answers to questions posted to the group.
Questions might include:
❍ What is the most problematic plastic item from a litter perspective?
❍ What should we do about it?
❍ How do we make that happen?
• Improved understanding among the group of the different perspectives and opinions in the community, which can lead to increased trust and transparency.
• New solutions and unique ideas for partnerships and paths forward in communities to tackle plastic pollution. It can also serve as a first step to build buy-in and awareness in communities around this issue.
Detailed Field Methods• The basic process is simple and simple to learn, but complexities and nuances of context,
numbers, question crafting, and purpose can make it optimal to bring in an experienced host to help. Should that be the case, professional consulting services and senior hosts are available through World Café Services.
• World Café is a well-developed facilitation system with additional information on methods here. In addition, there are many resources available for new World Café hosts, including a free hosting tool kit, World Café Signature Learning Programs, and subscription to the online Community Table, where the larger community of practice gathers to learn together.
Figure 1. A World Café workshop in action. (Photo by
Jenna Jambeck)
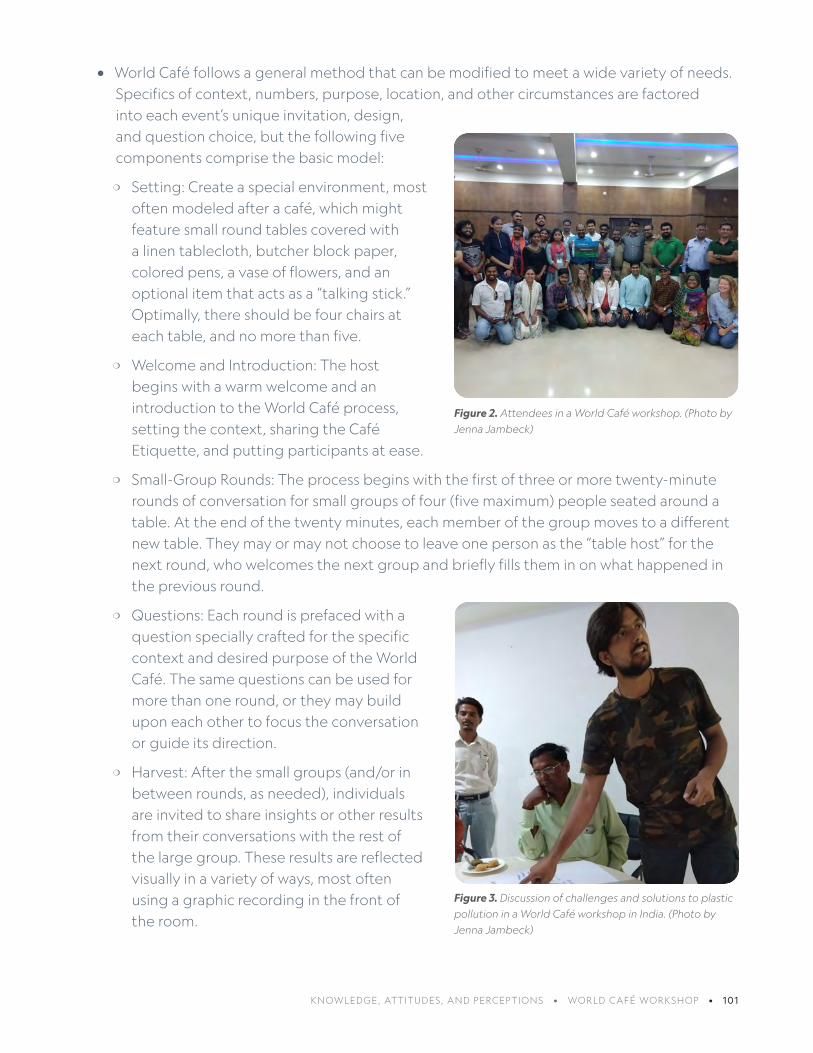
KNOWLEDGE , ATTITUDES, AND PERCEPTIONS • WORLD CAFÉ WORKSHOP • 101
• World Café follows a general method that can be modified to meet a wide variety of needs. Specifics of context, numbers, purpose, location, and other circumstances are factored into each event’s unique invitation, design, and question choice, but the following five components comprise the basic model:
❍ Setting: Create a special environment, most often modeled after a café, which might feature small round tables covered with a linen tablecloth, butcher block paper, colored pens, a vase of flowers, and an optional item that acts as a “talking stick.” Optimally, there should be four chairs at each table, and no more than five.
❍ Welcome and Introduction: The host begins with a warm welcome and an introduction to the World Café process, setting the context, sharing the Café Etiquette, and putting participants at ease.
❍ Small-Group Rounds: The process begins with the first of three or more twenty-minute rounds of conversation for small groups of four (five maximum) people seated around a table. At the end of the twenty minutes, each member of the group moves to a different new table. They may or may not choose to leave one person as the “table host” for the next round, who welcomes the next group and briefly fills them in on what happened in the previous round.
❍ Questions: Each round is prefaced with a question specially crafted for the specific context and desired purpose of the World Café. The same questions can be used for more than one round, or they may build upon each other to focus the conversation or guide its direction.
❍ Harvest: After the small groups (and/or in between rounds, as needed), individuals are invited to share insights or other results from their conversations with the rest of the large group. These results are reflected visually in a variety of ways, most often using a graphic recording in the front of the room.
Figure 2. Attendees in a World Café workshop. (Photo by
Jenna Jambeck)
Figure 3. Discussion of challenges and solutions to plastic
pollution in a World Café workshop in India. (Photo by
Jenna Jambeck)

102 • KNOWLEDGE , ATTITUDES, AND PERCEPTIONS • WORLD CAFÉ WORKSHOP
Further Reading• The World Café website offers extensive information about this method, and
additional write-ups are available via The Workshop Bank and the Wageningen Institute’s Multi-Stakeholder Partnerships
Safety and Other Considerations• Prepare an appropriate risk assessment before implementation according to your
organization’s requirements. Points to consider:
❍ Always get any permits or approvals needed to collect these data, including any photographs.
❍ We recommend working with an in-community partner who can help navigate cultural norms, any unanticipated conflicts of interest, help to understand the landscape (such as, current conflicts between interest groups in the community), and any local health and safety concerns.
❍ Always meet in a safe and accessible place.
❍ Always work with local researchers or community members to recruit participants and to help with the local language (where needed).
❍ Be considerate of your audience, adhere to local social norms and religious customs, and wear culturally appropriate/sensitive clothing.
❍ Discuss any concerns, think through precautions, and bring the appropriate safety gear to ensure that you and the community are safe during the activity.
❍ This method should not be used if in-person gatherings or in-person group meetings are not recommended if public health conditions present risks to you, participants, or the community.
Detailed Analysis Methods• Summarize the groups answers to questions and look for commonalities, differences,
trends, etc.
• Describe the diversity of stakeholders that attended.
• Write a narrative of the results to inform your target stakeholders or decision-makers.
• Share the full results/report with attendees and other stakeholders as needed.

103 • KNOWLEDGE , ATTITUDES, AND PERCEPTIONS • YOUTH OUTREACH AND EDUCATION
3.5 Youth Outreach and EducationThis environmental education program is an instructional approach
based on active learning that helps engage students, inviting
them to think about their relationship to plastic and investigate
its impacts on the community. In addition to learning about plastic
waste and how it is generated, students also analyze litter found in
the community—collecting, analyzing, and compiling data on it—
and are prompted to look for solutions to the problem. Engaging
youth this way is an important method for encouraging them to
look for opportunities for change.
Photo by Heather Koldewey
KNOWLEDGE , ATTITUDES, AND PERCEPTIONS • YOUTH OUTREACH AND EDUCATION • 104
Research Questions This Method Can Help Address • What does your target audience know about how the mismanagement of plastic leads to
plastic pollution?
• What are the community’s perceptions of how plastic affects the natural environment?
• What are the most common examples of plastic pollution in your location?
• How can you tackle mismanaged plastics in a community?
• How can each of us raise awareness?
Is this method right for you?
• This program is targeted at students 12 to 15 years old, but it can be adapted for other age groups. You will need established connections to schools and educators to conduct this method.
• This method can be led by a teacher or outside demonstrator. Any number of students can participate, but the program works best with groups of up to 20-30 students.
• You need a location where you can comfortably present to students for one or two hours.
• You need access to an outdoor area that is safe for litter tracking.
• If you are an outside demonstrator, get prior permission from the relevant education authority or the head of the school.
• You must also get prior written permission if you plan on recording the session with students via photographs or video.
Resources Needed• Clipboard, paper, and pen/pencil, for recording student responses or taking notes.
• Educator Guide that includes detailed steps for the program facilitator. An example guide can be found here that is based on the Teachers for Planet Earth education program as part of the Sea to Source Expedition.
• Plastic Pollution Action Journal and Debris Tracker Guide for guided student participation.
• Camera to capture interactive participation, subject to permission.
• Trash/bin bags for collecting waste tracked in the field session (optional). The session can be run entirely by visual recording that does not require any contact with litter. Do not pick up waste unless it is safe to do so, or if public health conditions make it unsafe.
• Hand sanitizer, gloves, and litter pickers if collecting waste.
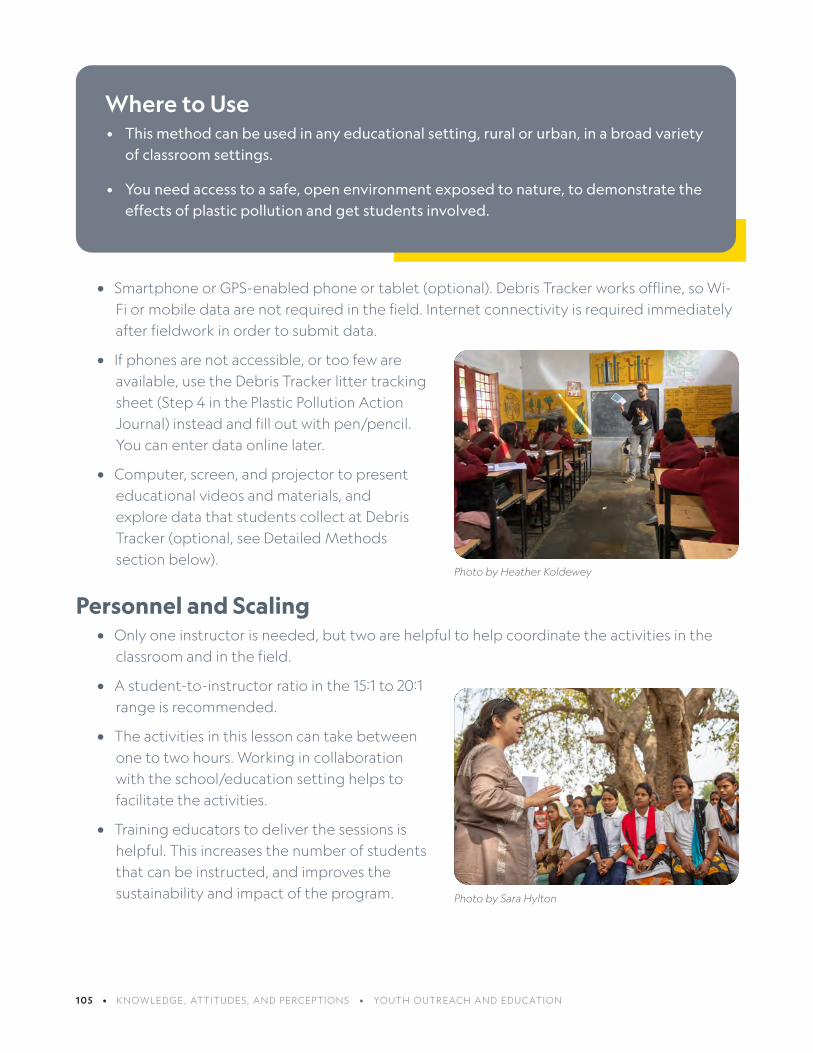
105 • KNOWLEDGE , ATTITUDES, AND PERCEPTIONS • YOUTH OUTREACH AND EDUCATION
• Smartphone or GPS-enabled phone or tablet (optional). Debris Tracker works offline, so Wi-Fi or mobile data are not required in the field. Internet connectivity is required immediately after fieldwork in order to submit data.
• If phones are not accessible, or too few are available, use the Debris Tracker litter tracking sheet (Step 4 in the Plastic Pollution Action Journal) instead and fill out with pen/pencil. You can enter data online later.
• Computer, screen, and projector to present educational videos and materials, and explore data that students collect at Debris Tracker (optional, see Detailed Methods section below).
Personnel and Scaling • Only one instructor is needed, but two are helpful to help coordinate the activities in the
classroom and in the field.
• A student-to-instructor ratio in the 15:1 to 20:1 range is recommended.
• The activities in this lesson can take between one to two hours. Working in collaboration with the school/education setting helps to facilitate the activities.
• Training educators to deliver the sessions is helpful. This increases the number of students that can be instructed, and improves the sustainability and impact of the program.
Where to Use• This method can be used in any educational setting, rural or urban, in a broad variety
of classroom settings.
• You need access to a safe, open environment exposed to nature, to demonstrate the effects of plastic pollution and get students involved.
Photo by Heather Koldewey
Photo by Sara Hylton
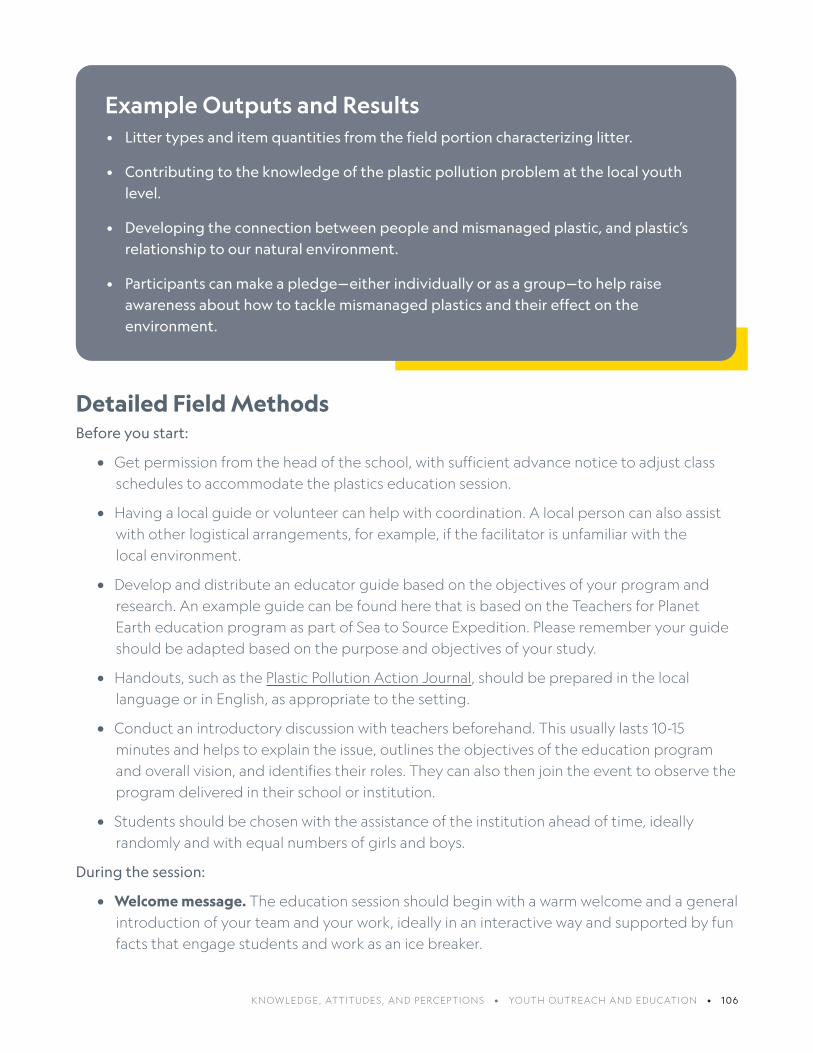
KNOWLEDGE , ATTITUDES, AND PERCEPTIONS • YOUTH OUTREACH AND EDUCATION • 106
Example Outputs and Results• Litter types and item quantities from the field portion characterizing litter.
• Contributing to the knowledge of the plastic pollution problem at the local youth level.
• Developing the connection between people and mismanaged plastic, and plastic’s relationship to our natural environment.
• Participants can make a pledge—either individually or as a group—to help raise awareness about how to tackle mismanaged plastics and their effect on the environment.
Detailed Field MethodsBefore you start:
• Get permission from the head of the school, with sufficient advance notice to adjust class schedules to accommodate the plastics education session.
• Having a local guide or volunteer can help with coordination. A local person can also assist with other logistical arrangements, for example, if the facilitator is unfamiliar with the local environment.
• Develop and distribute an educator guide based on the objectives of your program and research. An example guide can be found here that is based on the Teachers for Planet Earth education program as part of Sea to Source Expedition. Please remember your guide should be adapted based on the purpose and objectives of your study.
• Handouts, such as the Plastic Pollution Action Journal, should be prepared in the local language or in English, as appropriate to the setting.
• Conduct an introductory discussion with teachers beforehand. This usually lasts 10-15 minutes and helps to explain the issue, outlines the objectives of the education program and overall vision, and identifies their roles. They can also then join the event to observe the program delivered in their school or institution.
• Students should be chosen with the assistance of the institution ahead of time, ideally randomly and with equal numbers of girls and boys.
During the session:
• Welcome message. The education session should begin with a warm welcome and a general introduction of your team and your work, ideally in an interactive way and supported by fun facts that engage students and work as an ice breaker.

107 • KNOWLEDGE , ATTITUDES, AND PERCEPTIONS • YOUTH OUTREACH AND EDUCATION
• Pre-evaluation. Participants should be asked a set of questions to understand their baseline knowledge, such as:
❍ What do you think about plastics?
❍ Why do you choose products made with or packaged within plastic?
❍ What do we know about mismanaged plastic that causes plastic pollution?
❍ What is your relationship with plastic?
❍ What is plastic’s relationship with our natural environment?
❍ Do you think plastic is a cause of pollution or not?
❍ What are the most common examples of the plastic pollution problem?
• Briefing. Screen an introductory video, such as this video on ocean plastics, showcasing the global and local issues caused by plastic pollution, and how the rest of the world is tackling it, helps to provide information on the topic to the participants.
• Lesson Plan. The person facilitating this method should follow along with the Educator Guide established beforehand. Students should use the Plastic Pollution Action Journal to start to think about plastic the way researchers do. Students will be encouraged to go through the worksheets while describing their observations and asking and answering questions.
• Field session. If you are conducting a hands-on training session, take the students outside in or around the classroom location (see Safety and Other Considerations section below). Have them record the number of plastic and other litter items (Step Four of the Plastic Pollution Action Journal) or on the Debris Tracker mobile app. Students can be divided into small groups and asked to record their findings as a team. If you wish to have the students collect waste, ensure that you have the proper resources and safety equipment including trash/bin bags, gloves, litter pickers, hand sanitizer, etc. As a reminder, this session can be run entirely by visual recording that does not require any contact with litter. Do not pick up waste unless it is safe to do so, or if public health conditions make it unsafe. The field session can take 15-30 minutes of data collection.
• When recording is done, let students calculate the type and their number of items they found and present their findings (show them on a blackboard, whiteboard, or chart paper by summing up the total amount they recorded) and express their feelings. You can also ask or help them to identify the location/spot from where they found the maximum amount of trash, or sites with particular types of litter, to bring it to their attention.
Photo by Sara Hylton
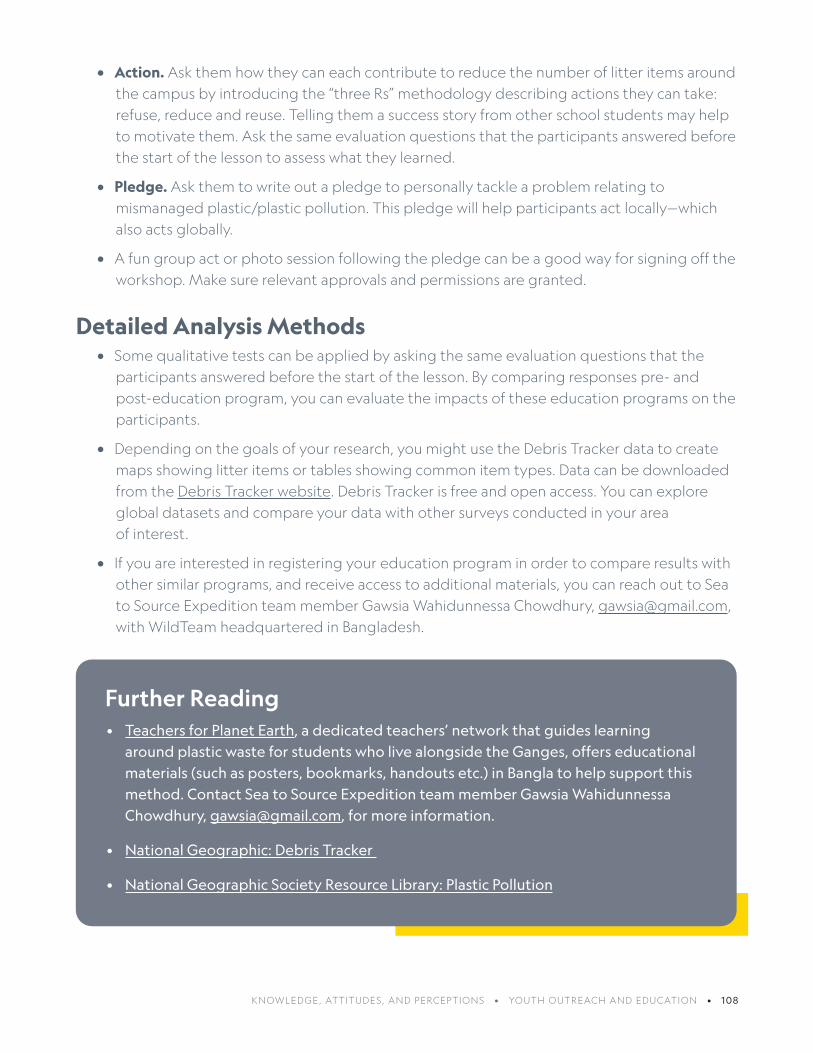
KNOWLEDGE , ATTITUDES, AND PERCEPTIONS • YOUTH OUTREACH AND EDUCATION • 108
• Action. Ask them how they can each contribute to reduce the number of litter items around the campus by introducing the “three Rs” methodology describing actions they can take: refuse, reduce and reuse. Telling them a success story from other school students may help to motivate them. Ask the same evaluation questions that the participants answered before the start of the lesson to assess what they learned.
• Pledge. Ask them to write out a pledge to personally tackle a problem relating to mismanaged plastic/plastic pollution. This pledge will help participants act locally—which also acts globally.
• A fun group act or photo session following the pledge can be a good way for signing off the workshop. Make sure relevant approvals and permissions are granted.
Detailed Analysis Methods• Some qualitative tests can be applied by asking the same evaluation questions that the
participants answered before the start of the lesson. By comparing responses pre- and post-education program, you can evaluate the impacts of these education programs on the participants.
• Depending on the goals of your research, you might use the Debris Tracker data to create maps showing litter items or tables showing common item types. Data can be downloaded from the Debris Tracker website. Debris Tracker is free and open access. You can explore global datasets and compare your data with other surveys conducted in your area of interest.
• If you are interested in registering your education program in order to compare results with other similar programs, and receive access to additional materials, you can reach out to Sea to Source Expedition team member Gawsia Wahidunnessa Chowdhury, [email protected], with WildTeam headquartered in Bangladesh.
Further Reading• Teachers for Planet Earth, a dedicated teachers’ network that guides learning
around plastic waste for students who live alongside the Ganges, offers educational materials (such as posters, bookmarks, handouts etc.) in Bangla to help support this method. Contact Sea to Source Expedition team member Gawsia Wahidunnessa Chowdhury, [email protected], for more information.
• National Geographic: Debris Tracker
• National Geographic Society Resource Library: Plastic Pollution

4.TECHNOLOGY AND TOOLS
The use of technology and tools cuts across all of the methods in this toolkit.
These tools can improve efficiency (such as geospatial data being fed directly into
a database) and effectiveness (automation can eliminate mistakes resulting from
transcribing handwritten data). These tools also allow you to scale data collection
beyond what would otherwise be possible. This section explains how to use the free
Debris Tracker mobile app, a tool for collecting litter and geospatial data or other
factors that can impact litter density and distribution within a community. Finally, the
open-source bottle tag method can be used to trace the movement of a plastic bottle
from the point it enters a water body to its final destination.
Photo by Sara Hylton
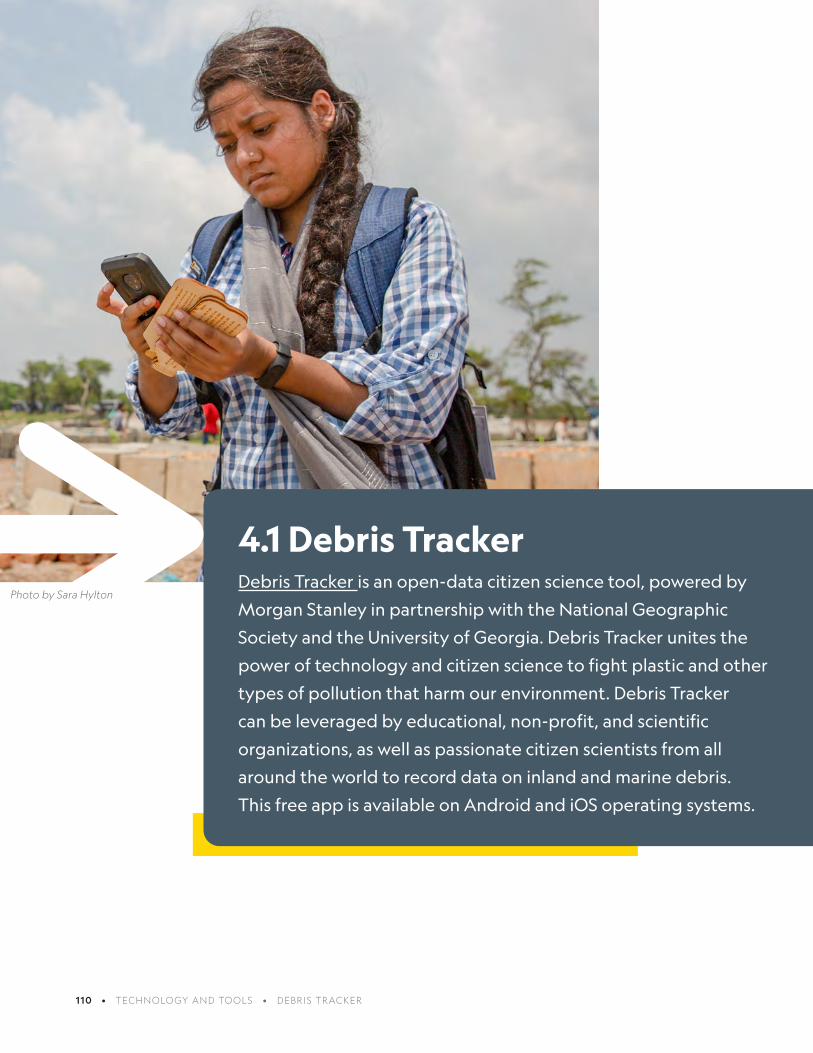
110 • TECHNOLOGY AND TOOLS • DEBRIS TRACKER
4.1 Debris TrackerDebris Tracker is an open-data citizen science tool, powered by
Morgan Stanley in partnership with the National Geographic
Society and the University of Georgia. Debris Tracker unites the
power of technology and citizen science to fight plastic and other
types of pollution that harm our environment. Debris Tracker
can be leveraged by educational, non-profit, and scientific
organizations, as well as passionate citizen scientists from all
around the world to record data on inland and marine debris.
This free app is available on Android and iOS operating systems.
Photo by Sara Hylton

TECHNOLOGY AND TOOLS • DEBRIS TRACKER • 111
Research Questions This Method Can Help Address • How much litter is ending up in the environment within your sampling area?
• What kind of litter is there and how did it get there? How is that changing over time?
Is this method right for you?
• Using Debris Tracker ensures standardized sampling and collection of litter data.
• Data collection using Debris Tracker requires minimal training, time, and equipment.
• Debris Tracker is a tool that can be used to collect data in various situations, including for Youth Outreach and Education, Litter Transects, and citizen science initiatives.
Resources Needed• Smartphone or GPS-enabled phone or tablet (Debris Tracker works offline, so you do not
need Wi-Fi in the field, just later after fieldwork to submit data).
• If phones are not accessible, or if too few are available, datasheets (found here) can be filled out with pen/pencil and data can be entered later.
Personnel and Scaling • For a low-quantity litter area (defined as fewer than 100 items per 100-meter transect), two
people can do three 100-meter transects in about an hour.
• For a high-quantity litter area (defined as 500-1,000 items per 100-meter transect), two people can do one 100-meter transect in about an hour.
• Work in pairs at a minimum, whether in low-quantity or high-quantity litter areas.
Where to UseThis method can be used in any city, town, or village.
Example Outputs and Results• Litter types in a sample area [Figure 1].
• Item quantities in a sample area [Figure 1].
• Data can be analyzed and examined on the Debris Tracker Website [Figure 2].

112 • TECHNOLOGY AND TOOLS • DEBRIS TRACKER
Detailed Field Methods• You can use the app any way that makes sense for the
questions you are trying to answer. Potential methods may include:
❍ Tracking along a transect. Example: 1 meter x 100 meters
❍ Tracking for a set amount of time: 30 minutes, 60 minutes, etc.
❍ Tracking a given area: 25 meters x 25 meters
• You may choose to resample an area weekly, monthly, or seasonally to capture changes over time, which can also include monitoring the impact of any solutions-based interventions at a location.
• Additional resources and information are available here:
❍ Debris Tracker app website
❍ National Geographic background on Debris Tracker
Safety and Other Considerations• Prepare a proper risk assessment before you start fieldwork
according to your organization’s requirements. Points to consider:
❍ Check the weather. Make sure that expected temperature, rain, and other indicators predict reasonably safe conditions for working outside.
❍ Also be sure to wear clothing that adheres to the social and cultural norms of the community.
❍ Be prepared with any first aid requirements. This includes but is not limited to a basic first aid kit (for minor cuts, scratches, stings, etc.), plenty of water, and sun protection.
❍ Wear utility gloves whenever you are touching trash.
❍ Avoid dangerous pieces of trash like needles, broken glass, and syringes unless you have been properly trained on how to safely pick them up.
❍ During your tracking session, do not touch your face. After your tracking session, wash your hands with soap and water for at least 20 seconds or use hand sanitizer.
❍ Disinfect your phone after each tracking session. Check online for tips on how to do this.
❍ Picking up trash is optional. If you do decide to pick it up, make sure you have had an up to date tetanus shot. Remember, you are working with trash.
❍ When working outside, consider weather safety, sunscreen, and reusable bottles of water to stay hydrated.
Figure 1. Number of items tracked and
top items found in a community.

TECHNOLOGY AND TOOLS • DEBRIS TRACKER • 113
Detailed Analysis Methods• Depending on your questions, you might use the Debris Tracker data to create maps
showing litter items or tables showing common item types.
• Data can be downloaded here.
• Data on Debris Tracker are free and open access. You can explore global datasets, and compare your data with other surveys conducted in your area of interest (for example, by beaches or region).
Figure 2. Web-based data analysis and visualization on the Debris Tracker website.

114 • TECHNOLOGY AND TOOLS • DEBRIS TRACKER
Figure 4. Plastic Pollution Action Journal for students
Figure 3. The Debris Tracker Mobile Application Guide can help you get started.

TECHNOLOGY AND TOOLS • DEBRIS TRACKER • 115
Figure 6. The Debris Tracker Getting Started Guide and Tutorial video are available.
Figure 5. Using Debris Tracker to collect geospatial data on the Sea to Source Expedition.

116 • TECHNOLOGY AND TOOLS • DEBRIS TRACKER
Further Reading• National Geographic: Debris Tracker
• Te Tai Tokerau Debris Monitoring Project
• Martin JM, Jambeck JR, Ondich BL, Norton TM. (2019). Comparing quantity of marine debris to loggerhead sea turtle (Caretta caretta) nesting and non-nesting emergence activity on Jekyll Island, Georgia, USA. Mar Pollut Bull.
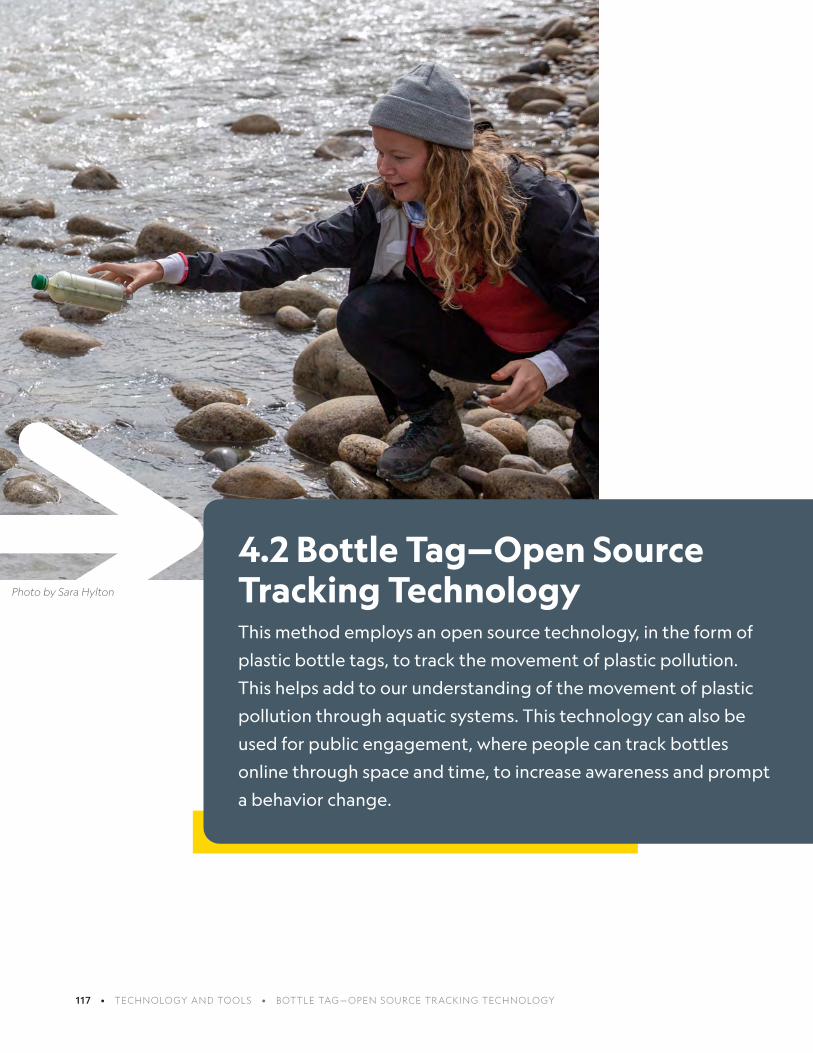
117 • TECHNOLOGY AND TOOLS • BOTTLE TAG—OPEN SOURCE TRACKING TECHNOLOGY
4.2 Bottle Tag—Open Source Tracking TechnologyThis method employs an open source technology, in the form of
plastic bottle tags, to track the movement of plastic pollution.
This helps add to our understanding of the movement of plastic
pollution through aquatic systems. This technology can also be
used for public engagement, where people can track bottles
online through space and time, to increase awareness and prompt
a behavior change.
Photo by Sara Hylton
TECHNOLOGY AND TOOLS • BOTTLE TAG—OPEN SOURCE TRACKING TECHNOLOGY • 118
Research Questions This Method Can Help Address • How is plastic debris moving in space and time from rivers to the ocean?
• Where does plastic debris accumulate?
• What river/coastal/ocean habitat locations are vulnerable to degradation due to the presence of plastic accumulations?
• Where are potential hotspots and vulnerable areas from plastic debris accumulation that can be targeted for clean up?
Is this method right for you?
• This method requires consultation and collaboration with technical specialists as they develop the technology required to construct the bottle tags (or a budget to purchase tags).
• Some expertise or access to collaborators is required to assist with spatial analysis of the resulting tracking data.
• This method will require compliance with any local legislation related to releasing items into the river/ocean, particularly if using satellite technology.
• Users will need to engage with community members and/or local partners to identify the optimal release sites and times.
Resources Needed• The technical capability to produce the bottle tag as detailed in this method, or;
• Resources to purchase the bottle tags. The Sea to Source Expedition sourced bottle tags from the Arribada Initiative.
Personnel and Scaling • For reasons of safety and efficiency, we highly recommended that two team members work
together to release the tags.
• The tags can be produced to last for a variable amount of time; from a few months to two or three years.
Where to UseThis method can be used in aquatic systems, including any freshwater or marine
systems. However, physical barriers such as dams need to be considered, and there
needs to be sufficient flow to move the tag through the system.
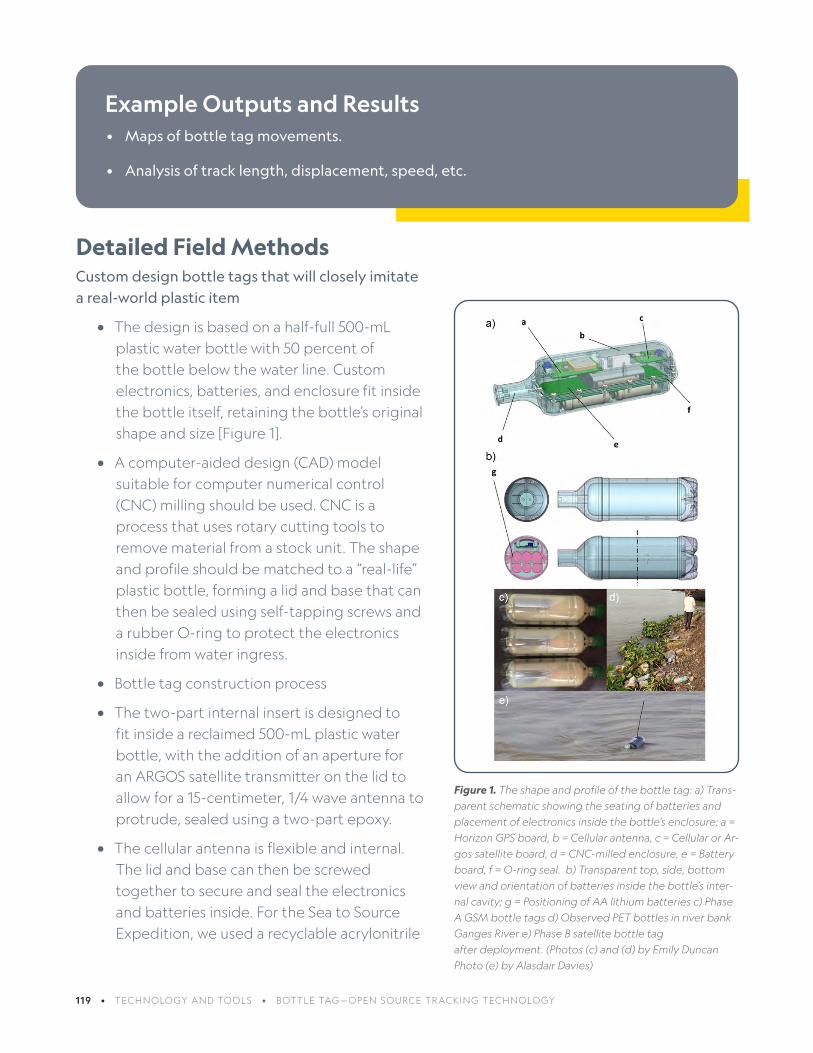
119 • TECHNOLOGY AND TOOLS • BOTTLE TAG—OPEN SOURCE TRACKING TECHNOLOGY
Detailed Field MethodsCustom design bottle tags that will closely imitate a real-world plastic item
• The design is based on a half-full 500-mL plastic water bottle with 50 percent of the bottle below the water line. Custom electronics, batteries, and enclosure fit inside the bottle itself, retaining the bottle’s original shape and size [Figure 1].
• A computer-aided design (CAD) model suitable for computer numerical control (CNC) milling should be used. CNC is a process that uses rotary cutting tools to remove material from a stock unit. The shape and profile should be matched to a “real-life” plastic bottle, forming a lid and base that can then be sealed using self-tapping screws and a rubber O-ring to protect the electronics inside from water ingress.
• Bottle tag construction process
• The two-part internal insert is designed to fit inside a reclaimed 500-mL plastic water bottle, with the addition of an aperture for an ARGOS satellite transmitter on the lid to allow for a 15-centimeter, 1/4 wave antenna to protrude, sealed using a two-part epoxy.
• The cellular antenna is flexible and internal. The lid and base can then be screwed together to secure and seal the electronics and batteries inside. For the Sea to Source Expedition, we used a recyclable acrylonitrile
Example Outputs and Results• Maps of bottle tag movements.
• Analysis of track length, displacement, speed, etc.
Figure 1. The shape and profile of the bottle tag: a) Trans-
parent schematic showing the seating of batteries and
placement of electronics inside the bottle’s enclosure; a =
Horizon GPS board, b = Cellular antenna, c = Cellular or Ar-
gos satellite board, d = CNC-milled enclosure, e = Battery
board, f = O-ring seal. b) Transparent top, side, bottom
view and orientation of batteries inside the bottle’s inter-
nal cavity; g = Positioning of AA lithium batteries c) Phase
A GSM bottle tags d) Observed PET bottles in river bank
Ganges River e) Phase B satellite bottle tag
after deployment. (Photos (c) and (d) by Emily Duncan
Photo (e) by Alasdair Davies)
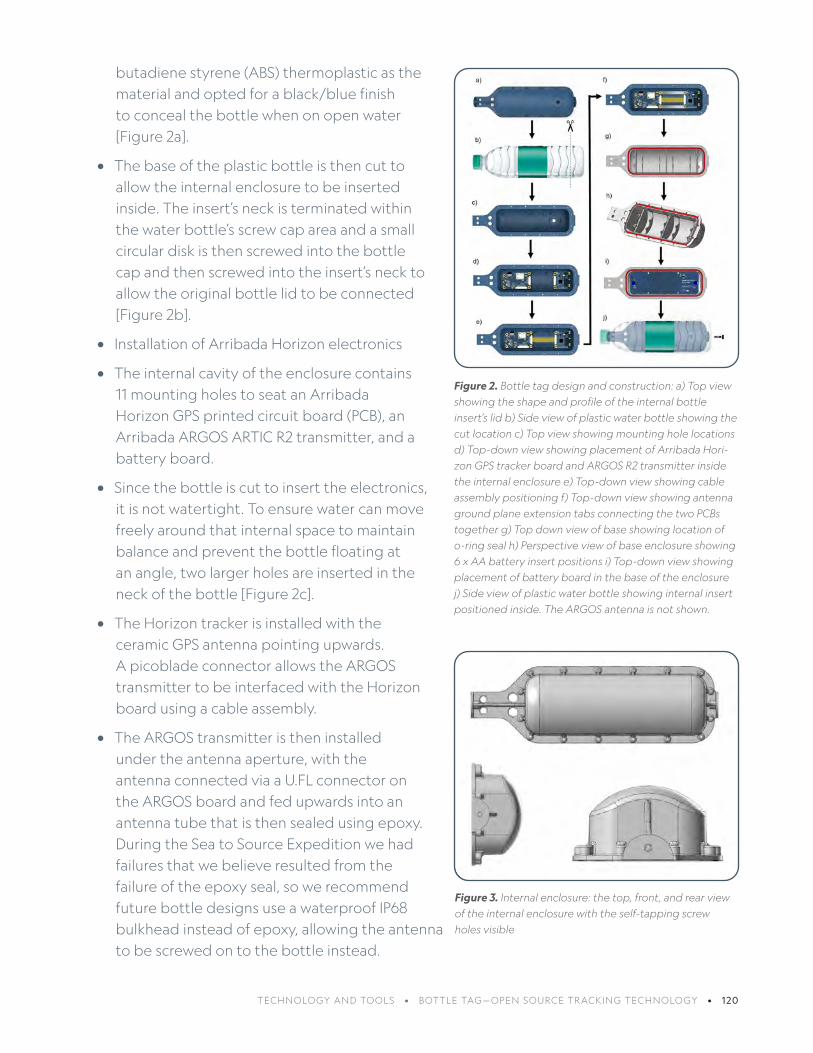
TECHNOLOGY AND TOOLS • BOTTLE TAG—OPEN SOURCE TRACKING TECHNOLOGY • 120
butadiene styrene (ABS) thermoplastic as the material and opted for a black/blue finish to conceal the bottle when on open water [Figure 2a].
• The base of the plastic bottle is then cut to allow the internal enclosure to be inserted inside. The insert’s neck is terminated within the water bottle’s screw cap area and a small circular disk is then screwed into the bottle cap and then screwed into the insert’s neck to allow the original bottle lid to be connected [Figure 2b].
• Installation of Arribada Horizon electronics
• The internal cavity of the enclosure contains 11 mounting holes to seat an Arribada Horizon GPS printed circuit board (PCB), an Arribada ARGOS ARTIC R2 transmitter, and a battery board.
• Since the bottle is cut to insert the electronics, it is not watertight. To ensure water can move freely around that internal space to maintain balance and prevent the bottle floating at an angle, two larger holes are inserted in the neck of the bottle [Figure 2c].
• The Horizon tracker is installed with the ceramic GPS antenna pointing upwards. A picoblade connector allows the ARGOS transmitter to be interfaced with the Horizon board using a cable assembly.
• The ARGOS transmitter is then installed under the antenna aperture, with the antenna connected via a U.FL connector on the ARGOS board and fed upwards into an antenna tube that is then sealed using epoxy. During the Sea to Source Expedition we had failures that we believe resulted from the failure of the epoxy seal, so we recommend future bottle designs use a waterproof IP68 bulkhead instead of epoxy, allowing the antenna to be screwed on to the bottle instead.
Figure 2. Bottle tag design and construction: a) Top view
showing the shape and profile of the internal bottle
insert’s lid b) Side view of plastic water bottle showing the
cut location c) Top view showing mounting hole locations
d) Top-down view showing placement of Arribada Hori-
zon GPS tracker board and ARGOS R2 transmitter inside
the internal enclosure e) Top-down view showing cable
assembly positioning f) Top-down view showing antenna
ground plane extension tabs connecting the two PCBs
together g) Top down view of base showing location of
o-ring seal h) Perspective view of base enclosure showing
6 x AA battery insert positions i) Top-down view showing
placement of battery board in the base of the enclosure
j) Side view of plastic water bottle showing internal insert
positioned inside. The ARGOS antenna is not shown.
Figure 3. Internal enclosure: the top, front, and rear view
of the internal enclosure with the self-tapping screw
holes visible

121 • TECHNOLOGY AND TOOLS • BOTTLE TAG—OPEN SOURCE TRACKING TECHNOLOGY
• The cellular tags deployed during the Sea to Source Expedition switched the ARGOS transmitter PCB for an Arribada Horizon cellular transmitter. The cellular installation process remained the same [Figure 2d].
• A cable assembly is plugged in to connect the two boards and power supplied by plugging the battery board JST connector into the Horizon board.
• Power was provided to the ARGOS transmitter via the cable assembly [Figure 2e]. Two aluminum strips were then attached to the printed circuit board mount points on each board and screwed in to connect the two printed circuit boards. This extended the ground plane of the antenna and enhanced performance [Figure 2f].
Installing the battery board inside the internal enclosure
• The base of the internal enclosure incorporated an O-ring seal and groove to accept a rubber 2.5-mm O-ring. The groove is 1.87 mm deep, allowing 75 percent of the O-ring to be seated and 25 percent compressed by the flat surface of the lid that is then screwed on to seal the unit.
• Marine-grade lubricant is added to the O-ring before placement to seat it correctly within the groove [Figure 2g].
• An AA battery holder printed circuit board is then fitted, capable of seating six batteries (on the base) and three batteries (on top), with each battery supported by a groove to hold them securely in place, preventing movement after deployment. A complete unit can therefore hold nine AA batteries in total [Figure 2h].
• The battery board is screwed into the four mounting holes in the base and six AA lithium batteries installed under the board [Figure 2i]. For the Sea to Source Expedition, the number of batteries was reduced from a maximum capacity of nine to six following flotation checks (see the Mechanics section below).
Closing and sealing the internal enclosure
• Once the O-ring seal is installed and seated, the lid can be aligned and screwed into place using self-tapping screws.
• As the lid is sealed, the O-ring should be continuously assessed to ensure it remains in the groove and flush with the lid and base.
• The front, rear, and sides of the enclosure need to be checked to ensure that all the screws are tight.
Figure 4. Orientation of batteries inside the bottle’s
internal cavity
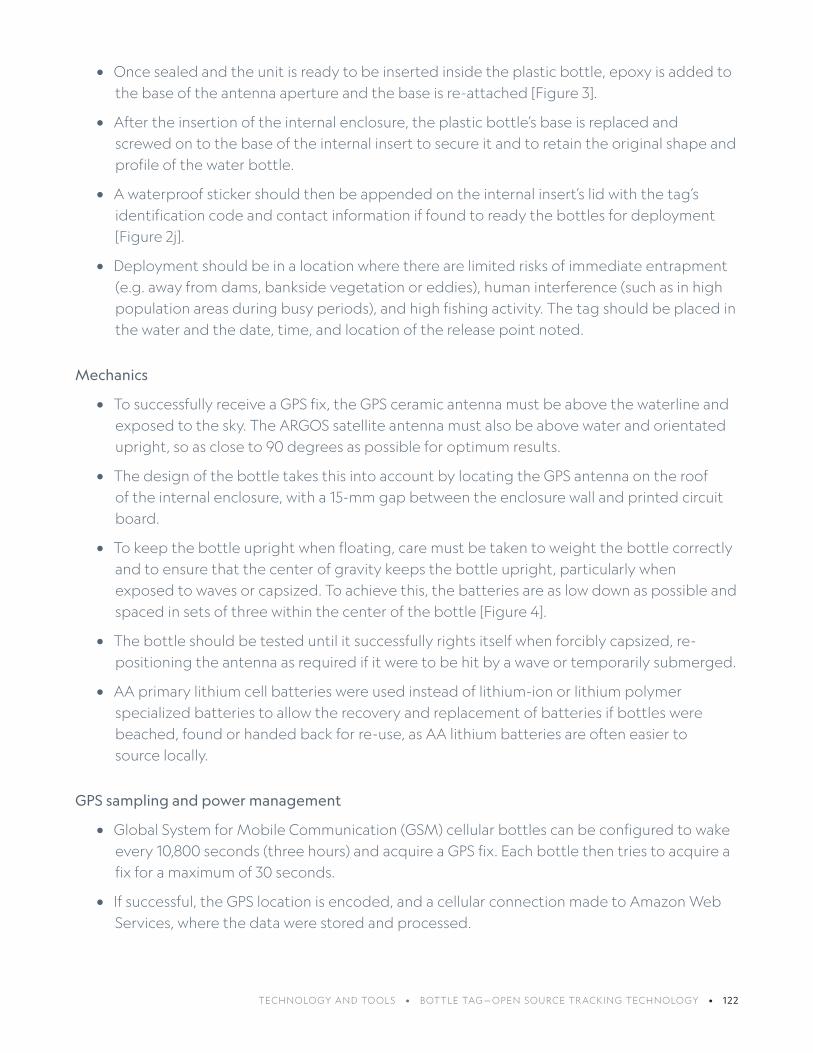
TECHNOLOGY AND TOOLS • BOTTLE TAG—OPEN SOURCE TRACKING TECHNOLOGY • 122
• Once sealed and the unit is ready to be inserted inside the plastic bottle, epoxy is added to the base of the antenna aperture and the base is re-attached [Figure 3].
• After the insertion of the internal enclosure, the plastic bottle’s base is replaced and screwed on to the base of the internal insert to secure it and to retain the original shape and profile of the water bottle.
• A waterproof sticker should then be appended on the internal insert’s lid with the tag’s identification code and contact information if found to ready the bottles for deployment [Figure 2j].
• Deployment should be in a location where there are limited risks of immediate entrapment (e.g. away from dams, bankside vegetation or eddies), human interference (such as in high population areas during busy periods), and high fishing activity. The tag should be placed in the water and the date, time, and location of the release point noted.
Mechanics
• To successfully receive a GPS fix, the GPS ceramic antenna must be above the waterline and exposed to the sky. The ARGOS satellite antenna must also be above water and orientated upright, so as close to 90 degrees as possible for optimum results.
• The design of the bottle takes this into account by locating the GPS antenna on the roof of the internal enclosure, with a 15-mm gap between the enclosure wall and printed circuit board.
• To keep the bottle upright when floating, care must be taken to weight the bottle correctly and to ensure that the center of gravity keeps the bottle upright, particularly when exposed to waves or capsized. To achieve this, the batteries are as low down as possible and spaced in sets of three within the center of the bottle [Figure 4].
• The bottle should be tested until it successfully rights itself when forcibly capsized, re-positioning the antenna as required if it were to be hit by a wave or temporarily submerged.
• AA primary lithium cell batteries were used instead of lithium-ion or lithium polymer specialized batteries to allow the recovery and replacement of batteries if bottles were beached, found or handed back for re-use, as AA lithium batteries are often easier to source locally.
GPS sampling and power management
• Global System for Mobile Communication (GSM) cellular bottles can be configured to wake every 10,800 seconds (three hours) and acquire a GPS fix. Each bottle then tries to acquire a fix for a maximum of 30 seconds.
• If successful, the GPS location is encoded, and a cellular connection made to Amazon Web Services, where the data were stored and processed.

123 • TECHNOLOGY AND TOOLS • BOTTLE TAG—OPEN SOURCE TRACKING TECHNOLOGY
• GSM cellular bottles have a high idle power consumption (9mA) in comparison to satellite bottles; they have an estimated total life of eight weeks.
• A second engineering process conducted during the Sea to Source Expedition reduced that to 38uA (9+ years in idle with 6 x AA batteries) for the satellite bottles deployment. Satellite bottles were configured to wake every 14,400 seconds (four hours) and acquire a GPS fix. Each bottle tries to acquire a fix for a maximum of 60 seconds.
• If successful, the GPS location is encoded and transmitted via Argos to Argos Web Services. Data can then be downloaded and decoded to acquire positions and operational metadata (battery life, status of device).
• To maximize the chance of transmitting to a passing satellite, Argos pass prediction and orbital correctional data should be pre-loaded onto each bottle and only satellites known to be operational targeted. To keep a constant time, the bottles should also be programmed to synchronize their internal clocks using time acquired from GPS fixes.
Safety and Other Considerations• Prepare a proper risk assessment according to your organization’s requirements. Some
key considerations:
❍ Legislation and permissions may be required by relevant authorities to release plastic items and tracking technology, particularly satellite tracking technology. In this case, GSM tracking may be the only available option.
❍ Assess the safety requirements specific to the release site, such as boat safety or minimizing risks of deploying on riverbanks or coasts.
❍ Check the cellular connectivity across the areas you hope to cover. Where there is no GSM system for the mobile network, data recovery will likely be limited to the immediate neighborhood of communication towers. Consider using roaming SIMs that connect to multiple cellular providers and therefore should be more reliable.
❍ Depending on the deployment site, human interference may be an issue, so consider making the bottle less conspicuous. We recommend deliberately aging the bottle’s appearance, removing bright labels, and timing and locating the release site away from observers.
❍ In sites of high fishing activity, there is a risk of tags becoming entangled and trapped in active gear. Consider the time and place of deployment (around fishing seasons/activity) of the tags to minimize this risk.
❍ Bottle tags should be retrieved wherever possible at the end of the deployment period to avoid further pollution.
❍ Discuss any concerns, think through precautions, and bring the appropriate safety gear that you need to stay safe during the activity.

TECHNOLOGY AND TOOLS • BOTTLE TAG—OPEN SOURCE TRACKING TECHNOLOGY • 124
Detailed Analysis Methods• The post-fieldwork analysis requires access to spatial analysis (such as Excel, R with “sf”
package, QGIS, ArcMap) to document maps of bottle tag movements, analysis of track length, displacement, speed of travel, etc.
Further Reading• Duncan EM, Davies A, Brooks A, Chowdhury GW, Godley BJ, Jambeck J, Maddalene T,
Napper I, Nelms SE, Rackstraw C, Koldewey H. (2020). Message from a bottle: using novel technology to track the movement of plastic pollution. PLOS ONE. https://journals.plos.org/plosone/article?id=10.1371/journal.pone.0242459
• National Geographic: Exploring with GIS

APPENDIXThe methods included in this appendix were carried out during the
Sea to Source Expedition, but they remain experimental. They have
not been published in peer-reviewed literature, because results were
not extensive enough or lacking entirely. They are included in this
toolkit so that they may be explored further and built upon by others.
Photo by Heather Koldewey

126 • APPENDIX • DRIFT CARDS
1. Drift CardsThis method was used experimentally during the Sea to
Source Expedition. While this method was used primarily in an
opportunistic way—the drift cards were set out while already
working in an area—a more systematic and representative
sampling method could be developed. Some research groups
have planned drift card launches and even turned them into
community events.
This method uses drift cards to investigate the potential paths of land-based litter into a waterway or litter dropped into a waterway. Drift cards are tracking objects, made of marine plywood or other buoyant materials, that are released into oceans or rivers to track currents or water circulation. They are typically released in batches and labeled with basic instructions [Figure 1] that request that anyone who finds a card use the contact information printed on the card to report when and where it was recovered. This information is collected and, taken together, it can indicate how litter and floating waste move through a waterway.
Photo by Sara Hylton

APPENDIX • DRIFT CARDS • 127
Research Questions This Experimental Method May Help Address
• How much of a community’s ground-based waste gets into a waterway?
• Where does ground-based waste end up if it enters a waterway?
• Where do litter items end up if they are dropped directly into a waterway?
Is this method right for you?
• Local collaboration is critical to this method in order to mobilize the public to help track where drift cards end up. Without this participation and feedback—called participatory sensing— you will not end up with any data.
• This method requires communication systems for people to report where and when they find drift cards. Some possibilities include: texting/messaging you directly, reporting on social media, or reporting through a web portal.
• You will need biodegradable materials (such as wood) to make the drift cards and ensure that they are individually identifiable (usually with a number).
Resources Needed• Drift cards. These should be made from buoyant, biodegradable materials (such as wood)
that can be printed or etched with text. The cards can vary in size and shape depending on the project and purpose; during the Sea to Source Expedition, the drift cards were roughly 10 cm x 5 cm and bottle-shaped, with text printed in Bangla on one side and Hindi
Where to Use• This method can be used in areas where litter or waste may end up on the ground (to
investigate how much may reach an aquatic system).
• In an aquatic system like a stream, river, or coastal area (where you know currents or moving water will make the drift card travel) for someone to likely eventually find.
Figure 1. Example of a drift card. (Photo by Sara Hylton)

128 • APPENDIX • DRIFT CARDS
on the other. Each drift card needs a unique identifier, such as a number.
• Debris Tracker mobile app or another GPS recording device to note where you release them.
• Pen and paper to record where and when the drift cards are put into the environment if neither phone or GPS device are available.
• Coordination with the local community for permission to release the cards, and also to identify the most effective ways to mobilize the community to report the location of drift cards after release and share this location data.
Personnel and Scaling • It is highly recommended that, for reasons of safety and efficiency, two people work to
release the drift cards in addition to working within a larger group of data collectors.
• The timing and scaling of this method will depend on the number of drift cards placed in various locations. The more locations you place the cards, more travel time will be needed. Logging each card upon release takes about 20 seconds in the Debris Tracker app.
Example Output/Results• Types of waste and recycling collection in a city/community.
• Location where drift cards are released and where they end up in maps, GIS, or other visualization systems.
• Insight on the transmission of litter items dropped on land to aquatic systems.
• Maximum distance from aquatic systems items on land still reach waterways.
• Percent of drift cards that reach an aquatic system.
Detailed Field Methods• Work with a collaborator on creating drift cards that are biodegradable (such as wood) that
have messaging on them prompting people to report finding them [Figure 1].
• There is no minimum number of cards required, but a larger number of released cards
Figure 2. Placing and recording the placement of Drift
Cards. (Photo by Sara Hylton)

APPENDIX • DRIFT CARDS • 129
increases the chances of people reporting them. Drift card releases typically include hundreds or even thousands of cards.
• Make sure each card is numbered or otherwise uniquely identified. Numbering them with a permanent marker is effective.
• Place cards in locations where there is litter on land, in waste piles, or in systematic distances away from the edge of a waterway.
• Make sure the campaign has been underway to recruit people to look for and report the cards if they find them in the environment before you release them. Continue this campaign so that any cards that are found are reported. Providing a motivation to report (through an incentive program, for example) might help get more reports from recruited members and/or the public. The researchers conducting this experimental method can decide what people should do when they find the cards. After reporting when and where a card was found, should they retrieve them? Or would they prefer that the cards be returned to the spot they found them after reporting? Those who implement this method determine what works best for their situation and scientific experiment.
• NOTE: This method was trialed during the Sea to Source Expedition, when we released nearly 3,000 drift cards. Very few reports of cards came back—they were often taken as souvenirs. Though people in the community were informed when the cards were released, there was no targeted public campaign to inform people to report when they found cards, nor was there a clear incentive for reporting. A targeted campaign or plan for reporting is necessary to obtain data when using the drift card method, or they can be integrated into a plastic pollution education or communication program.
Safety and Other Considerations• Prepare an appropriate risk assessment according to your organization’s requirements.
Figure 3. Drift card placed near litter to investigate
transport. (Photo by Sara Hylton)
Figure 4. Community members help place drift cards in
a drainage canal. (Photo by Jenna Jambeck)

130 • APPENDIX • DRIFT CARDS
Points to consider:
❍ Always obtain any permits or approvals needed to deploy the drift cards and collect these data.
❍ River and coastal conditions should always be assessed prior to sampling, ensuring that dangerous conditions such as flooding, dam releases, and strong currents are avoided for the duration of sampling.
❍ Wear and bring items you would for a long day hike, for example, where you might be exposed to all kinds of weather. Wear sunscreen, hats, covered shoes, clothes for the temperature, and other gear as appropriate to the conditions. Also be sure to wear clothing that adheres to the social and cultural norms of the community. Wear bright colors or a safety vest in order to be seen.
❍ Check the weather. Make sure that expected temperature, rain, and other indicators predict reasonably safe conditions for working outside.
❍ Walking near transportation corridors can be dangerous. Watch for traffic of all kinds—cars, trucks, motorbikes, bicycles. Make sure you are clearly visible.
❍ We recommend working with an in-community partner who can help navigate any local health and safety concerns.
Detailed Analysis Methods• You should map locations where the cards were released, and also where they were found,
in free mapping or GIS software. Analyze data collected, such as percent of cards reported, proximity to water, distance traveled.

131 • APPENDIX • RIVERINE STORMWATER OUTFALL ASSESSMENT
2. Riverine Stormwater Outfall AssessmentThis method was used experimentally during the Sea to
Source Expedition. While this method was used primarily in an
opportunistic way—the process was conducted while already
working in an area—a more systematic and representative
sampling method could be developed.
The Riverine Stormwater Outfall Assessment is used to document the locations and frequency of stormwater outfalls and record litter associated with stormwater systems in communities. Outcomes include gaining familiarity with stormwater outfalls and litter, knowledge for the community that can inspire policy, education, and design tools to reduce litter.
Photo by Heather Koldewey

APPENDIX • RIVERINE STORMWATER OUTFALL ASSESSMENT • 132
Research Questions This Experimental Method May Help Address
• What is the abundance and types of litter in stormwater systems?
• What are the trends and the relationships between community stormwater systems and waste management practices?
• What is the frequency of litter from stormwater systems entering an aquatic environment?
Is this method right for you?
• This method requires safe access to the land-water interface in the community.
• The use of this method requires the ability to comfortably walk 3-5 kilometers along the riverbank or coastline even though it may not have designated trails.
• You will benefit from having a local partner who can help provide context and knowledge regarding the community stormwater and waste management systems along with their associated challenges or innovations.
Resources Needed• Debris Tracker mobile app or clipboard, datasheet, and pen.
• Access to public domain maps (such as Google Maps).
• A tool for measuring a set distance, such as a measuring wheel, predetermined locations on a map, or a tape measure. A phone path tracker may work, though these can have accuracy issues.
• A ruler, tape measure, or digital measuring device, depending on what is appropriate for the site (see details below).
• ArcGIS or equivalent geospatial analysis software.
Where to Use• This is a land-based survey method that is conducted along the interface between
land and aquatic bodies that receive stormwater runoff from communities.
• Locations for surveying are generally located adjacent to formal settlements, either urban or rural, within any geography (inland or coastal), as long as the land-water interface can be adequately surveyed.

133 • APPENDIX • RIVERINE STORMWATER OUTFALL ASSESSMENT
Personnel and Scaling • It is highly recommended that, for reasons of safety and efficiency, two people work
together to conduct the stormwater outfall assessment.
• Time commitments vary with litter density and the number of personnel available to help. Surveying three land-water-interface transects will take at least one hour if there are three or so stormwater outlets and minimal litter. Time requirements are site-specific and will increase with the frequency of outlets and quantities of mismanaged waste.
• Prepare to set aside one full day for surveying or equivalent. For rapid assessments with limited time set aside for stormwater outfall assessment, it will be necessary to increase personnel requirements to survey the transects more efficiently.
Example Output/Results• Counts of the abundance of litter in storm drains.
• Counts of the abundance/frequency of litter entering an aquatic environment from storm drains.
• Composition of litter in storm drains, by material and product types.
• Frequency and location of built and natural stormwater outfalls in a community.
Detailed Field MethodsStep 1: Site Selection
• If you have predetermined land-water interface sites, skip to step 2
• Determine lower, middle, and upper sampling locations. Start by finding the point along the river that is most adjacent to the community.
• This point will represent the midpoint of the middle transect.
• From the midpoint, measure 0.5 kilometers up and downstream. The 1.0-kilometer distance between these two points will represent the middle transect.
Figure 1. Conducting stormwater drain assessment.
(Photo by Heather Koldewey)

APPENDIX • RIVERINE STORMWATER OUTFALL ASSESSMENT • 134
• Next measure 2.5 kilometers from the original midpoint up and downstream to create bounding end points for the community land-water interface. These endpoints will represent the ends of the upper and lower transect sites. From these ends, measure 1.0 kilometers toward the midpoint. These 1.0-kilometer stretches represent the upper and lower transects.
• Note that the “lower” should correspond with downstream of the community and the “upper’’ should correspond with the area upstream of the community.
Step 2: Surveying
• It is best to systematically work through the transects, starting from one end and working toward the other, ideally in the same direction, consistently working from downstream to upstream every time, where the starting point is x = 0 meters and the end point is x = 500 meters.
• Begin walking toward the end of the transect. Every time you pass a natural or built stormwater outlet it will be documented in the Debris Tracker app, under the “Hydrology” section in the “University of Georgia New Materials Institute” list. Provide a description in the record, using a nomenclature that represents the site, and the storm drain number.
❍ Where the format is Site Number+Outlet Number
❍ Represented by numerical values: XXXYYY
❍ Example of this format: Site: 001; Outlet Number: 005 would be: 001005
❍ Time and location will automatically be included by the app software
• Document the approximate type of the stormwater outfall.
❍ If natural, document if covered by vegetation or sediment.
❍ If the stormwater outfall is built, document the material—concrete, iron, or other material—and note if it is a pipe, open drain, or open canal.
Figure 2. Recording litter in a stormwater drain with De-
bris Tracker. (Photo by Sara Hylton)
Figure 3. Investigating stormwater drains. (Photo by
Heather Koldewey)
135 • APPENDIX • RIVERINE STORMWATER OUTFALL ASSESSMENT
• Document the approximate size of the outlet.
❍ If it is a channel, approximate the width, depth, and channel shape (natural, triangular, trapezoidal).
❍ If it is a pipe, provide the diameter if circular and width and depth if rectangular.
• Before proceeding to the next outlet, determine if there is water flow in the drain.
❍ If no flow or low flow, record litter that is present in the outlet starting at the end of the outlet and working inland for 20 meters using Debris Tracker.
❍ If flow is present, stand at a safe location and count the number of items that pass for two minutes. Document this number on the datasheet.
❍ If the outlet is a closed pipe, it may not be possible to measure litter discharge safely and so this can be noted, and you can proceed to the next outlet.
Step 3: Repeat until the three transects are covered. If seasonal trends are being examined, repeat the process over a time series that covers the seasonal variation
Safety and Other Considerations• Prepare appropriate risk assessment before conducting fieldwork according to your
organization’s requirements. Points to consider:
❍ River and coastal conditions should always be assessed prior to sampling, ensuring that dangerous conditions such as flooding, dam releases, and strong currents are avoided for the duration of sampling.
❍ The land-water interface is sometimes challenging to scale on foot; sometimes stormwater outlets are difficult to access because of steep terrain or unstable soil. Never risk your personal safety to document stormwater outlets.
❍ Be cognizant of weather. Land-water interfaces often have minimal urban or natural cover, leaving them exposed to weather conditions. Heavy rainfall events, storms, and flood warnings should be heeded. Consider the time of day to avoid surveying during extreme temperatures, and avoid sampling after dark.
❍ Clothing and shoes should be appropriate for walking, and there is some potential bushwhacking through vegetation (though excessive bushwhacking should be avoided). Be aware of cultural norms regarding clothing to minimize unnecessary attention. A bright-colored vest may be helpful for visibility with other group members, however. This can also help to convey to onlookers that formal procedures are being conducted.
❍ Long pants/trousers and closed-toe shoes are required for this work.
❍ This work is inherently conducted outside over the course of a few hours and so precautions should be taken for water, food, first aid, and sunscreen needs.

APPENDIX • RIVERINE STORMWATER OUTFALL ASSESSMENT • 136
❍ Be ready to walk. While three kilometers are covered for each transect, often it is easiest to walk along the riverbank to the next transect, resulting in up to 5 kilometers of walking during a given sampling period.
❍ Always obtain necessary permits or community approval for sampling as required.
❍ Working with a local partner can be helpful for navigating the sample site both logistically as well as for additional safety or language barriers. Discuss any concerns, think through precautions, and bring the appropriate safety gear that you need to stay safe during the activity.
❍ Never survey riverbanks and stormwater outfalls alone.
Detailed Analysis MethodsNon-flowing Outlets:
• Any data collected via Debris Tracker can be accessed and downloaded as a CSV file from the Debris Tracker website and analyzed in a spreadsheet viewer like Excel or Google Sheets.
• Litter in the outlets can be reported as a count and composition of material and item types for each outlet
• Determine the total count of items by material and item type. Determine the proportion of items in the full sample that are plastic and the proportion of each item type.
Flowing Outlets:
• Litter counted in the flowing outlets can be reported by dividing the count by two, producing a count of items per minute. The average can then be taken across all of the outlets that had a flow for a mean count per minute
Outlet Frequency:
• Determine the frequency of outlets in the community by taking the average of the outlet counts in each transect. The frequency is represented by the average count per kilometer. Next multiply the frequency by five, to estimate the number of outlets across the whole in the community land-water interface.
Plastic Loads:
• Determine the proportion of outlets that were flowing and that were not flowing. Apply these proportions to the total number of outlets estimated for the community. Round to the nearest whole number for each.

137 • APPENDIX • RIVERINE STORMWATER OUTFALL ASSESSMENT
• The Potential Plastic Load represents the dry outlets with litter present that could potentially discharge into the receiving water. Take the average plastic item count and multiply it by the estimated number of dry outlets. This number represents the Potential Plastic Load.
• The Plastic Load represents the plastic litter in the flowing outlets that are deposited in the receiving water. Take the average count of plastic items per minute and multiply this by the number of flowing outlets.

138 • APPENDIX • CHARACTERIZING WASTE SITES
3. Characterizing Waste SitesThis method was used experimentally during the Sea to
Source Expedition. While this method was used primarily in an
opportunistic way—we implemented it while we were already
working on another method in an area—a more systematic and
representative sampling method could be developed.
This method outlines opportunistic documentation of all categories of waste sites, waste piles, and dump sites within and near cities.
Photo by Sara Hylton

APPENDIX • CHARACTERIZING WASTE SITES • 139
Research Questions This Experimental Method May Help Address
• Where are the major formal and informal waste sites in the community? And what do they look like?
• Where are there mismanaged waste piles in the community?
Is this method right for you?
• This method allows for an opportunistic approach, taking advantage of organized visits to waste management infrastructure such as dump sites, landfills, and recycling facilities.
• You can collect data using this method while conducting other research, such as Litter Transect sampling or riverbank sampling.
• This method is best used in consultation with a local collaborator to give you background information and local knowledge about waste practices and related infrastructure and accumulation sites.
Resources Needed• Debris Tracker mobile app or clipboard, datasheet, and pen.
• Transportation, if a site visit is organized.
• Ability to speak the local language, or a translator, to communicate with site operators and managers.
Personnel and Scaling • It is highly recommended that, for reasons of safety and efficiency, two people work
together to conduct this method in addition to working within a larger group of data collectors.
Where to Use• This method can be used in any city, village, or town where there are waste sites,
landfills, or waste piles.
• These types of infrastructure and waste sites can be in any community, whether coastal or mountainous, rural or urban, etc.

140 • APPENDIX • CHARACTERIZING WASTE SITES
• In general, the method requires little time unless a visit to a waste management site is organized. These visits can take one to two hours depending on transportation and time spent at the site.
• Documenting waste sites can be conducted as supplementary to other field data collection methods (for example, Litter Transects).
Example Output/Results• Coordinates of formal and informal waste sites and dump sites, with description.
• Photos of waste sites/facilities and dump sites (photographic survey).
• Time stamps related to waste sites, which are dynamic and change with the seasons (such as rainy compared with dry season).
Detailed Field Methods• Using the Debris Tracker app, press the “Start Tracking” button.
• You will see the “University of Georgia New Materials Institute” list. Select it.
• Options for waste sites within the “Waste” category:
❍ Dump Site
❍ Ash Pile
❍ Informal Recycling
❍ Waste Bin
❍ Recycle Bin
• The “Other” option can be used to manually describe sites that are encountered that do not fall within the above categories.
• When ready to submit tracked items, press the arrow in the top right corner and then “Submit”
• If not using the app, make a data sheet with the above tracking options and note the location, date, and time when you mapped a waste site manually.
Safety and Other Considerations• Prepare an appropriate risk assessment according to your organization’s requirements.
Points to consider:
❍ Always obtain any permits or approvals needed to collect these data.
APPENDIX • CHARACTERIZING WASTE SITES • 141
❍ Wear and bring items you would for a long day hike, and prepared for exposure to all kinds of weather. Wear sunscreen, hats, covered shoes, clothes for the temperature, and other gear as appropriate to the conditions. Also be sure to wear clothing that adheres to the social and cultural norms of the community. Wear bright colors or a safety vest so you can be seen.
❍ Check the weather. Make sure that expected temperature, rain, and other indicators predict reasonably safe conditions to work outside.
❍ Walking near transportation corridors can be dangerous. Watch for traffic of all kinds—cars, trucks, motorbikes, bikes. Make sure you are clearly visible.
❍ We recommend working with an in-community partner who can help navigate any local health and safety concerns. Discuss and think through those concerns and bring the appropriate safety gear that you need to stay safe during the activity.
Detailed Analysis Methods• Data relating to location and time may be used later as known data points for analysis.
For example, data can be used for the analysis and proximity of waste sites to various influencing factors, and also as ground-truthed data for satellite imagery analysis.

142 • APPENDIX • CHARACTERIZING WASTE SITES
Figure 1. Examples of waste sites. Left Column: dump sites. Right Column, from top: waste segregation facility, landfill,
and open dumping landfill. (Photos by Amy Brooks)

AcknowledgementsThis research was conducted in partnership with the National
Geographic Society, the Wildlife Institute of India, the Indian
Institute of Technology, WildTeam Bangladesh, the University
of Dhaka, and the Isabela Foundation, with approval from all
relevant agencies of the governments of India and Bangladesh.
We also wish to thank the communities at each expedition site
along the Ganges and our support teams, Felis Creations and
Green Holidays. Finally, a special thanks is dedicated to each of
the Sea to Source Expedition team members.
Photo by Sara Hylton
1 • LAND-BASED SYSTEMS • COLLECTION AND MANAGEMENT OF SOLID WASTE
Example Interview Questions based on the Sea to Source Expedition
• Waste and Recycling Collection
1. Who collects waste? Who collects recycling? Is there informal sector involvement? (If so, describe system)
2. How is waste collected? Door to door, by community dumpster, etc.?
3. How often is waste collected?
4. What percentage of the community has access to waste collection?
5. How is waste collection paid for in the community? Is there a cost to households? How much does it cost?
6. Are there any specific obstacles to reaching 100 percent collection?
• Waste Generation, Characterization, and Management
1. How much waste is generated per capita? Total generation rate for city/community?
2. How much does each type of waste material contribute to the overall output? What percentage of overall waste is organic, paper, plastic, metal, or other materials?
3. What is the biggest source of waste in the community? How much is generated by industry, tourism, households, and by other means?
4. How and where is the city/community waste managed? How much of it ends up in a landfill or recycling? Tabulate by percentage if possible. Is there informal sector involvement? If so, describe the system and how it operates.
5. How many facilities does the city/community use or operate to manage its waste? What types of facilities does each community use?
6. Are there any other waste management practices that I might not have observed?
• Policies
1. Does the community have any bans on plastic, or regulations or policies addressing plastic? Examples: bag bans, taxes on certain products, or bottle deposit schemes.
2. How is this policy enforced?
• Litter
1. Does street sweeping or gutter cleaning occur in the community? If so, how often?
2. Are there any other litter cleaning practices or policies in place, such as skimmer boats, grate collection devices, or other methods?

1 • LAND-BASED SYSTEMS • PHOTO QUADRAT LITTER DATA COLLECTION
Table 1. List of Litter Items from Debris Tracker
Material Item Type(Plastic Items Only)
Item Description
Plastic Plastic Food Products Plastic Grocery Bag
Other Plastic Bag
Plastic String, Tape, or Packing Straps
Plastic Bottle
Plastic Bottle Cap
Plastic Utensils
Plastic Food Wrapper
Foam or Plastic Cups or Lids
Styrofoam Container
Street Food Bowl
Straws
Other Food-Related Plastic
Plastic Fragments Hard Plastic Fragments
Film Fragments
Foam Fragments
Other Fragments
Personal Care Products Blister Pack
Cotton Buds
Toothbrushes
Toothpaste or Other Product Tube
Shampoo or Other HDPE Container
Shampoo Sachet
Other Personal Care Product
Tobacco Products Tobacco Sachets
Cigarettes
Cigarette Packaging
Other Tobacco Product
Other Plastic Products Flip Flops
Tires
Bulk Bags
Rubber Bands
Other Plastic
Metal Metal Aluminum or Tin Cans
Metal Bottle Caps or Tabs
Aluminum Foil
Metal Fragments
Other Metal

2 • LAND-BASED SYSTEMS • PHOTO QUADRAT LITTER DATA COLLECTION
Table 1 Continued.
Glass Glass Glass Bottle
Glass or Ceramic Fragments
Other Glass
Cloth Cloth Clothing
Fabric Pieces
Other cloth
Paper Paper Coated Paperboard
Noncoated Paper Food Wrapper
Multi-material Paper Box
Corrugated Cardboard
Receipts
Paper
Other Paper
C&D Materials C&D Materials Lumber
Building Materials
Aggregate & Brick
Bolts, Nails, and Screws
Other C&D
Fishing Gear Fishing Gear Buoys and Floats
Plastic Rope
Fishing Lures
Fishing Line
Plastic Net or Net Pieces
Other Fishing Gear
E-Waste E-Waste Batteries
E-Waste Fragments
Other E-Waste
Organic Waste Organic Waste Food Waste
Other Organic Waste
Other Other Popsicle Stick
Other
Unidentifiable Foreign Object

1 • KNOWLEDGE , ATTITUDES, AND PERCEPTIONS • FOCUS GROUP DISCUSSIONS
This is an example of a Focus Group Discussion Facilitators Guide used on the Sea to Source Expedition in Bangladesh and India. Please remember your guide will be decided by the purpose and objectives of your study and the location and local context for your research.
Example Focus Group Discussion Facilitators Guide based on the Sea to Source Expedition
Dear Participants:
I am part of a team that is conducting a study about the impact and importance of plastic waste management in the daily lives of local people in [insert village/community name] and its environment.
The [insert project title] is a study that works with you, the local community, to understand better how you deal with plastic waste management in your community. The objective of this study is to better understand how families in [village name] live, how you use plastics, and your thoughts and opinions on waste management and the impact it has on your surrounding natural environment.
This discussion will last about an hour and is completely voluntary. Your personal data and your responses will be kept confidential. You can choose to stop at any time during this survey and withdraw your participation from this study. There is no direct benefit associated with participating in the survey, nor are there sanctions should you decline to participate.
Many Thanks,
[Project Team / Name of Project Leader]
Location and date:
Start Time:
End time:
Facilitator/s:
# of participants:
Please pass round a participant list prior to commencing that records participant name, occupation, gender, and contact number (if possible)
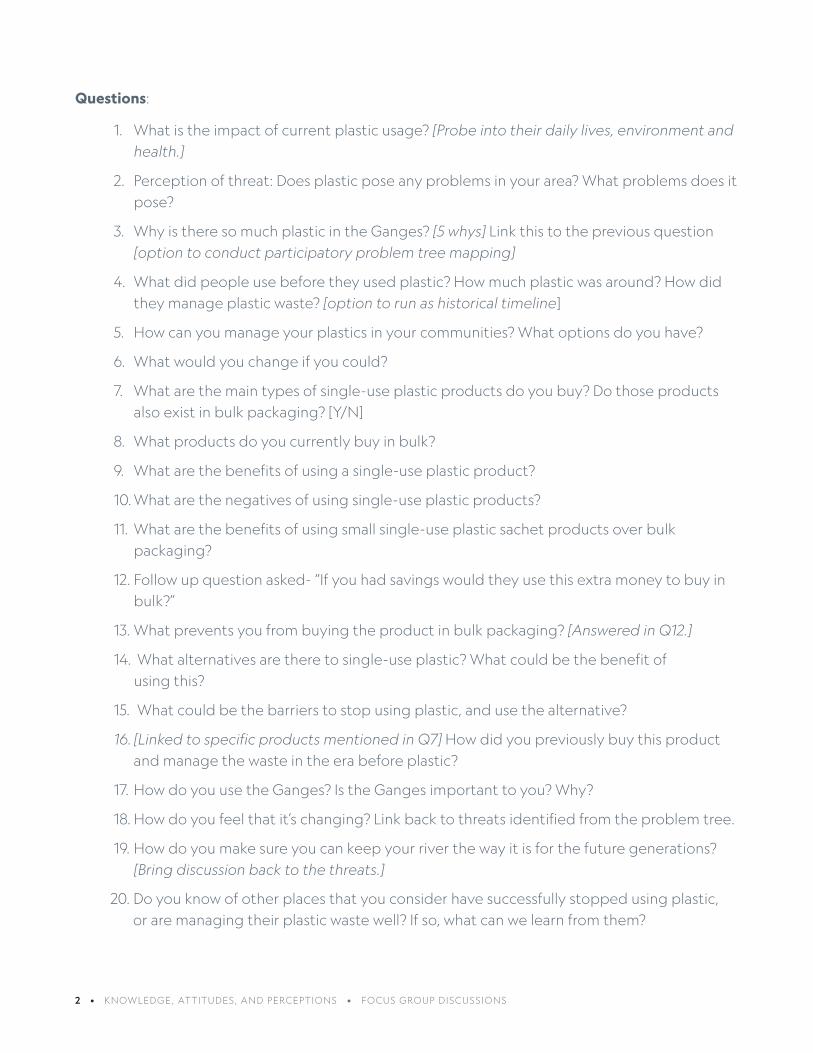
2 • KNOWLEDGE , ATTITUDES, AND PERCEPTIONS • FOCUS GROUP DISCUSSIONS
Questions:
1. What is the impact of current plastic usage? [Probe into their daily lives, environment and health.]
2. Perception of threat: Does plastic pose any problems in your area? What problems does it pose?
3. Why is there so much plastic in the Ganges? [5 whys] Link this to the previous question [option to conduct participatory problem tree mapping]
4. What did people use before they used plastic? How much plastic was around? How did they manage plastic waste? [option to run as historical timeline]
5. How can you manage your plastics in your communities? What options do you have?
6. What would you change if you could?
7. What are the main types of single-use plastic products do you buy? Do those products also exist in bulk packaging? [Y/N]
8. What products do you currently buy in bulk?
9. What are the benefits of using a single-use plastic product?
10. What are the negatives of using single-use plastic products?
11. What are the benefits of using small single-use plastic sachet products over bulk packaging?
12. Follow up question asked- “If you had savings would they use this extra money to buy in bulk?”
13. What prevents you from buying the product in bulk packaging? [Answered in Q12.]
14. What alternatives are there to single-use plastic? What could be the benefit of using this?
15. What could be the barriers to stop using plastic, and use the alternative?
16. [Linked to specific products mentioned in Q7] How did you previously buy this product and manage the waste in the era before plastic?
17. How do you use the Ganges? Is the Ganges important to you? Why?
18. How do you feel that it’s changing? Link back to threats identified from the problem tree.
19. How do you make sure you can keep your river the way it is for the future generations? [Bring discussion back to the threats.]
20. Do you know of other places that you consider have successfully stopped using plastic, or are managing their plastic waste well? If so, what can we learn from them?

1 • KNOWLEDGE , ATTITUDES, AND PERCEPTIONS • HOUSEHOLD SURVEYS
This is an example of a Household Survey used on the Sea to Source Expedition in Bangladesh and India. Please remember your survey design will be decided by the purpose and objectives of your study and the location and local context for your research.
Example Household Monitoring Survey based on the Sea to Source Expedition
Dear Participant,
I am part of a team that is undertaking a study about the impact and importance of plastic waste management in the daily lives of local people in [insert village/community name] and our environment.
The [insert project title] is a study that works with you, the local community, to understand better, how you deal with waste management in your community. The objective of this study is to better understand how families in [village name] live, how you use plastics in your daily lives, and your thoughts on waste management and your surrounding natural environment. The survey will last approximately 45 minutes, and we will ask you questions about your household, income-generating activities, food access, well-being, waste management, plastic use, and your interactions with the environment.
This survey is completely voluntary and your personal data and all you say will be kept confidential. You can choose to stop at any time during this survey and withdraw your participation from this study. There is no direct benefit associated with participating in the survey, nor are there sanctions should you decline to participate.
Many Thanks,
[Project Team / Name of Project Leader]
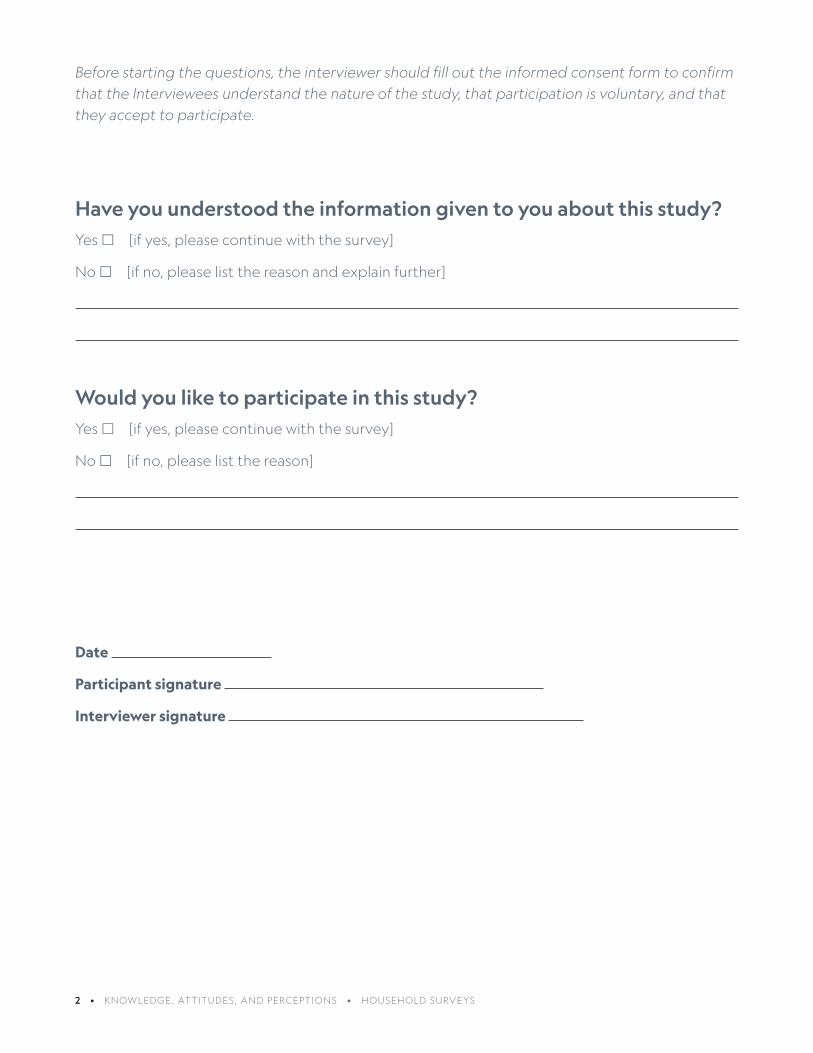
2 • KNOWLEDGE , ATTITUDES, AND PERCEPTIONS • HOUSEHOLD SURVEYS
Before starting the questions, the interviewer should fill out the informed consent form to confirm that the Interviewees understand the nature of the study, that participation is voluntary, and that they accept to participate.
Have you understood the information given to you about this study?Yes [if yes, please continue with the survey]
No [if no, please list the reason and explain further]
Would you like to participate in this study?Yes [if yes, please continue with the survey]
No [if no, please list the reason]
Date
Participant signature
Interviewer signature

3 • KNOWLEDGE , ATTITUDES, AND PERCEPTIONS • HOUSEHOLD SURVEYS
Section A: General background and wellbeing
Date of interview: Village Name: Ward:
Season: Summer Rainy Winter Spring
Monsoon: Pre-Monsoon Post-Monsoon
GPS: Latitude: Longitude:
Distance from River:
Respondent full name:
Male Female
Interviewer name:
Interview Start time:
Hello/Good morning/Good afternoon, I would like to start by asking you a question about how you feel generally and how you are.
1. With all things considered, how satisfied are you with your life?
Please record additional information i.e. why the respondent feels the way they do?
ID NUMBER
PREASSIGNED HH CODE
1 2 3 4 5
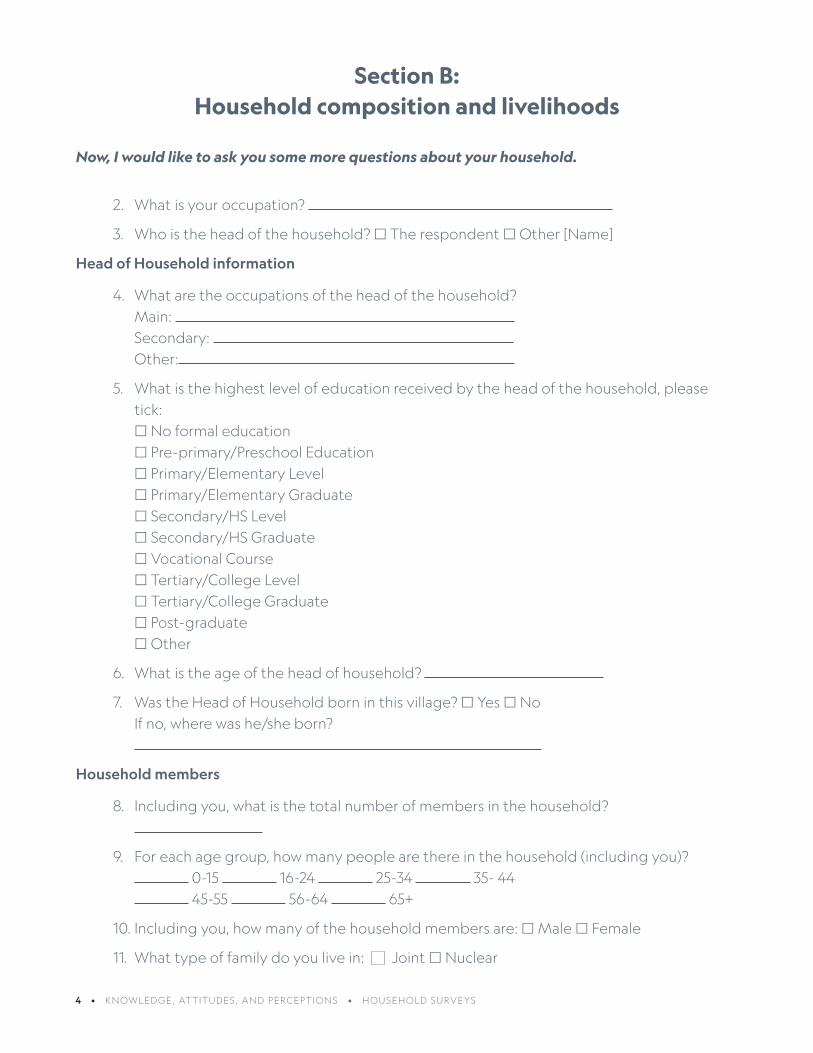
4 • KNOWLEDGE , ATTITUDES, AND PERCEPTIONS • HOUSEHOLD SURVEYS
Section B: Household composition and livelihoods
Now, I would like to ask you some more questions about your household.
2. What is your occupation?
3. Who is the head of the household? The respondent Other [Name]
Head of Household information
4. What are the occupations of the head of the household? Main: Secondary: Other:
5. What is the highest level of education received by the head of the household, please tick: No formal education Pre-primary/Preschool Education Primary/Elementary Level Primary/Elementary Graduate Secondary/HS Level Secondary/HS Graduate Vocational Course Tertiary/College Level Tertiary/College Graduate Post-graduate Other
6. What is the age of the head of household?
7. Was the Head of Household born in this village? Yes No If no, where was he/she born?
Household members
8. Including you, what is the total number of members in the household?
9. For each age group, how many people are there in the household (including you)? 0-15 16-24 25-34 35- 44 45-55 56-64 65+
10. Including you, how many of the household members are: Male Female
11. What type of family do you live in: Joint Nuclear

5 • KNOWLEDGE , ATTITUDES, AND PERCEPTIONS • HOUSEHOLD SURVEYS
12. Do any household members live outside? Yes No If yes, how many?
13. Are any household members in self-help groups? Yes No If Yes, please name
14. Are any household members in any community groups? Yes No If yes, please name
15. Are any household members beneficiaries of any NGO? Yes No If yes, please name
16. How many household members are currently in education? Please specify the number at level:
17. Is anyone in the household a village official? Yes No If yes, please specify: Name Position
Pre-Primary / Pre-School
Education
(Level 0)
Primary / Elementary Education
(Level 1)
Secondary /
High School Education
(Level 2)
Vocational Education
(Level 3)
Tertiary / College
Education
(Level 4)
Tertiary / Postgraduate
Education
(Level 5)

6 • KNOWLEDGE , ATTITUDES, AND PERCEPTIONS • HOUSEHOLD SURVEYS
Section C: Wealth
Now I would like to ask you some questions about your home.
House tenure
18. Do you own the house you live in? Yes No
19. Do you rent your house? Yes No
20. Is your house owned by the government? Yes No
Material style of life
21. Please indicate the following information about the household:
a. Type of roof: Native materials Tin Cement Combination
b. Type of wall: Native materials Concrete / brick Combination
c. Type of floor: Mud/sand Native materials Concrete/tiles Combination
d. How many rooms are there in the household?
e. What type of toilet do you have? Community toilet Open pit Water sealed Flush toilet None
f. What type of water source do you have access to? Government tap Personal Hand pump Community hand pump Well River Own pond Other
g. How many functional TVs?
h. How many functional mobile phones?
i. How many functional VCD/DVD players?
j. How many functional sound systems (cd/radio)?
k. How many boat engines?
l. How many boats w/o engines?
m. Do you own or lease any land? Yes No
n. Do you own any livestock? Yes No Please list:

7 • KNOWLEDGE , ATTITUDES, AND PERCEPTIONS • HOUSEHOLD SURVEYS
o. Energy source cooking: Wood Coal Dung cake Solar cookers Charcoal Kerosene LPG Biogas
p. Energy source lighting: Solar lamp Kerosene Lamp Electricity Solar Panel
q. Type of cooking stove: □ Traditional challah Coil heater Smokeless challah Kerosene stove LPG stove
r. How many functional bicycles?
s. How many functional cars?
t. How many functional autorickshaws?
u. How many functional vans?
v. How many functional carts?
w. Any other assets? Please list any other assets you observe
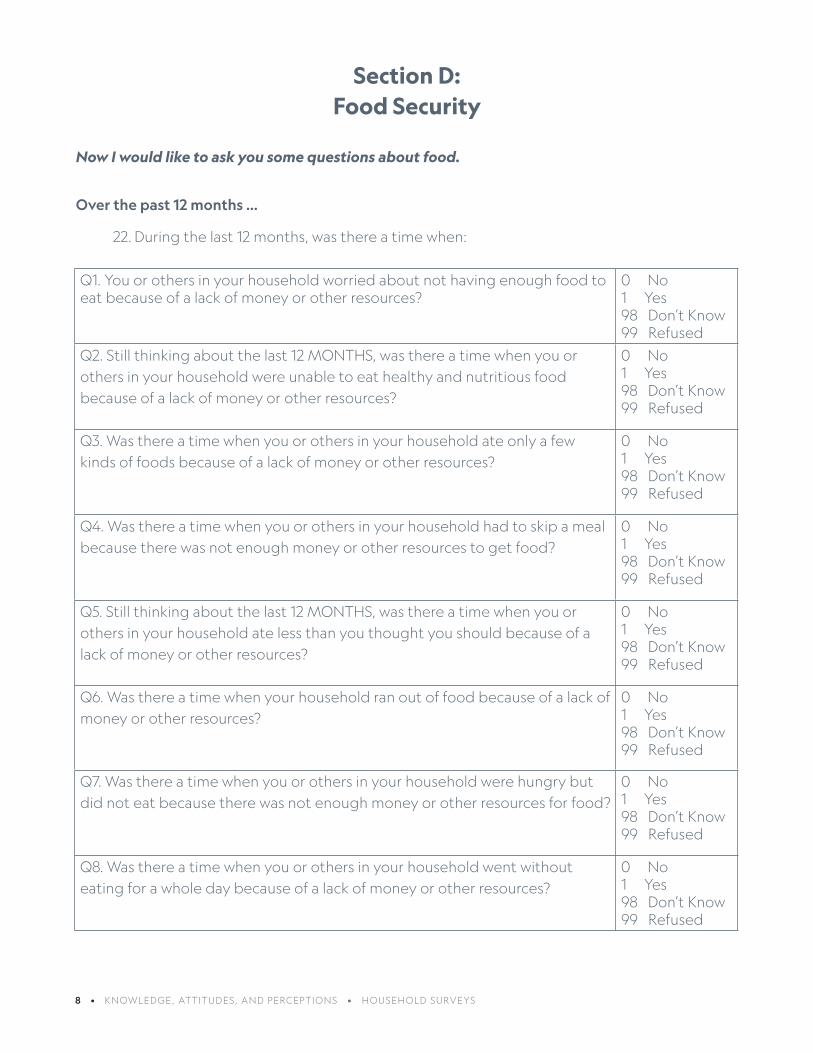
8 • KNOWLEDGE , ATTITUDES, AND PERCEPTIONS • HOUSEHOLD SURVEYS
Q1. You or others in your household worried about not having enough food to eat because of a lack of money or other resources?
0 No 1 Yes 98 Don’t Know 99 Refused
Q2. Still thinking about the last 12 MONTHS, was there a time when you or others in your household were unable to eat healthy and nutritious food because of a lack of money or other resources?
0 No 1 Yes 98 Don’t Know 99 Refused
Q3. Was there a time when you or others in your household ate only a few kinds of foods because of a lack of money or other resources?
0 No 1 Yes 98 Don’t Know 99 Refused
Q4. Was there a time when you or others in your household had to skip a meal because there was not enough money or other resources to get food?
0 No 1 Yes 98 Don’t Know 99 Refused
Q5. Still thinking about the last 12 MONTHS, was there a time when you or others in your household ate less than you thought you should because of a lack of money or other resources?
0 No 1 Yes 98 Don’t Know 99 Refused
Q6. Was there a time when your household ran out of food because of a lack of money or other resources?
0 No 1 Yes 98 Don’t Know 99 Refused
Q7. Was there a time when you or others in your household were hungry but did not eat because there was not enough money or other resources for food?
0 No 1 Yes 98 Don’t Know 99 Refused
Q8. Was there a time when you or others in your household went without eating for a whole day because of a lack of money or other resources?
0 No 1 Yes 98 Don’t Know 99 Refused
Section D: Food Security
Now I would like to ask you some questions about food.
Over the past 12 months …
22. During the last 12 months, was there a time when:

9 • KNOWLEDGE , ATTITUDES, AND PERCEPTIONS • HOUSEHOLD SURVEYS
Now I would like to ask you some questions about food.
Over the past 30 days…
23. Over the past 30 days, if there have been times when you did not have enough food or money to buy food? How many times per week has your family had to …? (Repeat for each question)
Everyday 3-6 times Once or twice
Less than once
Never Refused to answer
Rely on less preferred and less expensive foods
Borrow food or money, or rely on help from a friend or relative
Limit or cut portion size at mealtimes
Restrict consumption by adults in order for small children to eat
Reduce or skip number of meals eaten in a day

10 • KNOWLEDGE , ATTITUDES, AND PERCEPTIONS • HOUSEHOLD SURVEYS
Section E: Disposal Behaviours and plastic use
Now I would like to ask you a few questions on your community and how you deal with waste.
24. How many river clean-ups have you participated in within your village over the last 12 months? None One More than one but less than one per month One per month More
25. Within your community over the past 12 months, how do people dispose of, or reuse their plastic waste? Ask the respondent to indicate which methods are used in their community by placing them into one of three piles: “Yes” (for those that they believe are used in their community) “No” (for those that they believe are not used in their community) “Don’t know” For those in the “Yes” pile , ask the respondent to rank the cards in order of usage (1 – most frequently used). Record the results below: Dumping in the river Yes No Throw outside the house Yes No Burning or burying Yes No Dumping in the community dumpsite Yes No Recycling Yes No Sell to Kabadiwala Yes No Other, please specify Yes No
26. What do you think happens to the plastic after you get rid of it?
27. Within your community over the past 12 months, how do people dispose of their waste (other than plastics)? Ask the respondent to indicate which methods are used in their community by placing them into one of three piles: “Yes” (for those that they believe are used in their community) “No” (for those that they believe are not used in their community) “Don’t know” For those in the “Yes” pile , ask the respondent to rank the cards in order of usage (1 – most frequently used). Record the results below: Dumping in the river Yes No Throw outside the house Yes No Burning or burying Yes No

11 • KNOWLEDGE , ATTITUDES, AND PERCEPTIONS • HOUSEHOLD SURVEYS
Dumping in the community dumpsite Yes No Recycling Yes No Other, please specify Yes No
28. How frequently over the last 7 days have you used products packaged in small plastic sachets (For example: Brand X toothpaste, Brand Y shampoo, biscuits) within your household? Never Less than once a week 1-6 times per week 1-3 times per day 4 or more times per day Is this: Higher Average or Lower than normal?
29. How frequently over the last 7 days have you used products packaged in polythene bags (such as vegetable and grocery bags) within your household? Never Less than once a week 1-6 times per week 1-3 times per day 4 or more times per day Is this: Higher Average or Lower than normal?
30. How frequently over the last 7 days have you used products packaged in single-use plastic bags (such as vegetable and grocery bags) within your household? Never Less than once a week 1-6 times per week 1-3 times per day 4 or more times per day Is this: Higher Average or Lower than normal?
31. Please identify the categories and the number of each that you have used within the household over the last 15 days? Toiletries: List Food Wrappers: List Polythene bags: List
32. Where do you buy your products?
33. How often do you buy your products?
34. How do you get there?
35. How far is it?
36. Do you have any waste management system in place in your locality? Yes No don’t know
37. Do you have a community dumpsite? □ Yes No don’t know If yes, where have these dustbins been installed? □ In the community outside the community
38. Do you have a dustbin in your house? □ Yes No don’t know If not, where do you dispose of your waste?
39. Who disposes of your waste?

12 • KNOWLEDGE , ATTITUDES, AND PERCEPTIONS • HOUSEHOLD SURVEYS
Section F: Plastics in the Ganges
40. In what ways do you use the Ganges? Irrigation Domestic water use (such as: household cooking, cleaning) Transportation Bathing Washing clothes Dispose of waste Other, please specify
41. How concerned are you about the plastic pollution in the Ganges? Very Moderately Not concerned at all Don’t know/unsure Why do you feel that way?
42. How concerned are you about how much plastic you are using? Very Moderately Not concerned at all Don’t know/unsure Why do you feel that way?
43. How concerned are you about the plastic you see in your village? Very Moderately Not concerned at all Don’t know/unsure Why do you feel that way?
44. Please rank the following actors in order of how responsible are for plastic waste management in your village (1 being ultimately responsible): You as an individual □ You as a community □ Local government □ Municipal government □ Business/industry □ NGOs

13 • KNOWLEDGE , ATTITUDES, AND PERCEPTIONS • HOUSEHOLD SURVEYS
45. Please rank the following actors in order of how who you think should take a lead in reducing plastic -use your village (1 being ultimately responsible): You as an individual ou as a community □ Local government □ Municipal government □ Business/industry □ NGOs
46. I am going to read you several statements about the management of plastic waste. For each statement, I would like you to tell me if you: Strongly Agree, Agree, Disagree, Strongly disagree or have no opinion on it.
a. There is no issue with plastic waste management in my village Strongly Agree Agree Disagree Strongly Disagree no opinion
b. The plastic that enters the Ganges is not harming the wildlife Strongly Agree Agree Disagree Strongly Disagree no opinion
c. There is good waste management infrastructure in my village to deal with waste Strongly Agree Agree Disagree Strongly Disagree no opinion
d. The plastic in Ganga is affecting my fish catch Strongly Agree Agree Disagree Strongly Disagree no opinion
e. Plastic is a durable and useful material, to find an alternative is very difficult. Strongly Agree Agree Disagree Strongly Disagree no opinion
47. What approach do you think will be most effective in reducing plastic waste? Avoid/reduce the total waste created in the first place Reuse material as many times as possible Recycle waste into new products Recover energy from waste Dispose of the waste to the landfill
48. What three words would you use to describe plastic?
1. 2. 3.

14 • KNOWLEDGE , ATTITUDES, AND PERCEPTIONS • HOUSEHOLD SURVEYS
Section G: Ganga and You
49. Have you heard about the Namami Gange program? Yes No If yes, what are the activities conducted by the Namami Gange program in your community?
50. Have you observed any cleanliness activities along the Ganga River or your locality? Yes No
51. If yes, what are the activities that were conducted? Cleanliness Drives Awareness Rally Sensitization workshops Village meetings Others, specify
52. How often are these activities organized? Weekly Monthly Annually
53. Who organizes these activities? Community members local authorities individually NGO other organization, name
54. Have you participated in any of these programs? Yes No
55. How often have you been part of these programs?
56. Are you a Ganga Prahari? Yes No If yes, kindly answer the following questions:
57. What are the activities you have participated in as Ganga Prahari? 1) 2) 3)
58. Have you ever attended any training/workshop or participated in any program with NMCG-WII? Yes No
59. What kind of aquatic life have you seen in the Ganga River?
60. Have you noticed any change in the aquatic life in the river? Yes No
61. If yes, what are the changes you have observed?
62. Is plastic waste affecting the aquatic life and your surroundings? Yes No If yes, what are its impacts?
63. As a Ganga Prahari, what habits have you adopted to reduce the use of plastic?
64. As a Ganga Prahari, what are your suggestions to the community for combatting this situation?

15 • KNOWLEDGE , ATTITUDES, AND PERCEPTIONS • HOUSEHOLD SURVEYS
Interview end time:
Thank you for your time today. Do you have any questions for me? Or any other comments that you would like to make?
Please make a note of any questions or comments made by the respondent below.

1 • KNOWLEDGE , ATTITUDES, AND PERCEPTIONS • YOUTH OUTREACH AND EDUCATION
This is an example of an Educator Guide based on the Teachers for Planet Earth education program as part of the Sea to Source Expedition. Please remember your guide will be suited to the purpose and objectives of your study and the location and local context for your research..
Example Educator Guide based on the Sea to Source Expedition
Dear Educators,
I am part of a team that is undertaking a study about the impact and importance of plastic waste management in the daily lives of local people in [insert village/community name] and our environment. Your students can help with this scientific research by collecting data on plastic pollution in their community. They can become more aware by considering their own plastic use, thinking about where and how it is a problem, generating creative solutions to the problem, and making a pledge to help stop plastic pollution.
In partnership with communities along [your target river(s)], we are using scientific research and education to help each other understand plastic pollution problems, seek creative solutions together, and motivate communities—including the next generation—to pledge against plastic pollution.
Without the participation of communities, we will not be able to address this problem. Together we will make a difference!
Many Thanks,
[Project Team / Name of Project Leader]
Lesson Goal:• To build understanding of the plastic pollution problem and to encourage individuals to
pledge to combat it.
Materials Provided:• Plastic Pollution Action Journal
• Debris Tracker Guide
Materials Needed:• Pencils
• Large paper
• Markers
2 • KNOWLEDGE , ATTITUDES, AND PERCEPTIONS • YOUTH OUTREACH AND EDUCATION
• Litter/bin bags, hand sanitizer, gloves, and litter pickers (optional, for collecting waste)
• Smartphones and internet access (optional, for collecting and submitting data)
• Computer, screen, and projector (optional)
Time:• 60-90 minutes. Note that times in the plan below are minimums, totaling 60 minutes. If
possible, allow five minutes more for each section for deeper thinking and discussion.
Lesson Plan:This lesson plan is designed to help you guide students through these six steps found in the trifold Plastic Pollution Action Journal.
1. How is Plastic Part of My Life?
2. When is Plastic a Problem?
3. Using Science to Understand the Problem
4. Litter Tracking
5. Analyze Data and Find Solutions
6. Action Steps
Introduction (5 minutes)Explain that during this lesson, students will be thinking about an ordinary thing—plastic—that is a growing problem for our world. Give each student (or groups of students if needed) a Plastic Pollution Action Journal and a pencil, and have them write their name(s) at the top. They will use the journal throughout these activities.
Step 1: How is Plastic Part of My Life? (5 minutes)In Step 1, students think on their own or talk with a group about how they use different types of plastics in their daily lives. Ask them to add their ideas to the chart in the journal.
Next, ask students to think about the ways these plastics can cause problems. Answers might include:
• Waterways or drains can get clogged, causing flooding or other problems
• Animals can ingest plastic thinking it is food
• Litter can make a place less beautiful
• Litter from upstream communities flow downriver, bringing pollution to communities downstream

3 • KNOWLEDGE , ATTITUDES, AND PERCEPTIONS • YOUTH OUTREACH AND EDUCATION
• Too much litter can cause problems with where to put it
• Buried litter can eventually cause problems with soil and groundwater
We often say we can “throw away” plastics that we are done using. But in reality, there is no “away” – plastics and other litter have to go somewhere! Talk about where discarded plastic goes in your community.
Step 2: When is Plastic a Problem? (10 minutes)Have students open their journal and take the true/false quiz in Step 2. All of these are true!
1. Plastic discarded on land can get washed into rivers and end up in the ocean.
2. Plastics can harm animals in the environment through ingestion or entanglement.
3. Scientists estimate that 8 million metric tons of plastic enter our oceans every year.
4. Scientists have found plastics in the depths of the world’s oceans and at the summits of some of the world’s highest mountains.
5. 50 percent of plastic used globally is used only once and then discarded.
Talk about the quiz and show an introductory video about the plastic pollution problem if time allows. Give students time to answer the addition two questions in their journal:
• Why do you think action is needed around plastic pollution locally?
• Why do you think action is needed around plastic pollution globally?
Help students think about how plastic pollution upstream in the rivers of their community can affect the people and natural environments downstream. What seems like a local problem—just near home or only in some communities—can become a national and international problem.
Step 3: Using Science to Understand the Problem (10 minutes)In Step 3, read with students about using science to better understand the plastic pollution problem. These resources and activities are provided by the Sea to Source Expedition, a collaboration among researchers from Bangladesh, India, the United States, the United Kingdom, and National Geographic who are trying to answer these questions:
• How does plastic move from land to rivers and ultimately into the ocean?
• What are the most commonly littered plastics?
• Where do we find plastic littered on land?
• Are there microplastics in the air, water, and sediment near rivers?
• Why do people use plastic? What are the barriers to change?

4 • KNOWLEDGE , ATTITUDES, AND PERCEPTIONS • YOUTH OUTREACH AND EDUCATION
Have students share their thoughts. Do they have a hypothesis about any of these questions? How might they attempt to test their hypotheses if they were scientists/researchers?
The Sea to Source Expedition set out to study the interactions between plastics, land, water, and the communities along rivers in Bangladesh and India. This research includes methods such as:
1. Collecting data on types of commonly found litter
2. Sampling of water, air, and sediment for microplastics
3. Interviewing people in rural and urban areas about plastics use
4. Assessing the paths plastics travel in areas with and without waste management systems
5. Determining barriers to using less plastic
A critical goal is to find ways to reduce the load of plastics on land and in water. What is learned in this and other communities in Bangladesh and India will help in tackling this global challenge in other parts of the world.
Step 4: Litter Tracking (15 minutes)Using the Step 4 litter tracking sheet or Debris Tracker mobile app, students now work individually or in small teams to collect data on the types and amounts of plastics found along a set line, called a transect. If you divide students into groups, you may have them fill the following roles: one picking up the litter (if determined safe), one collecting the litter in a bag for disposal later, and one marking the types of litter on the data sheet or in the Debris Tracker mobile app. When tracking is finished, students will total each litter type and also add for litter total to enter at the bottom of the page.
Teachers can submit data for the students using the Debris Tracker app on a smartphone. This data will be incorporated into the research, helping to understand the most commonly littered plastics and where they are found. Thank you!
Step 5: Analyze Data and Find Solutions (10 minutes)After the litter tracking segment, students look closely at the data they collected. If time permits, combine all data collected for the entire transect on a board so the whole class can analyze it together.
Give students time to talk in small groups and answer the questions about which litter type was most common, where they found it, and why they think it was there. Have them bring their ideas back to a whole group discussion. Remind them that this challenging research is very similar to what some researchers are doing, but on a much larger scale!
After spending time collecting and analyzing data, students should be ready to brainstorm some local solutions. Have them work again in teams to fill in the chart, thinking about creative ways to reduce, reuse, or refuse plastics.
5 • KNOWLEDGE , ATTITUDES, AND PERCEPTIONS • YOUTH OUTREACH AND EDUCATION
Step 6: Action Steps (10 minutes)For the last step, give students time to reflect on their own. Students will likely have different ideas for how and why this issue might be important to them. Hopefully, each will be ready to make a pledge to help combat plastic pollution problems personally, with their family, or more broadly with their community.
You may consider rewarding students who make a pledge with a small token (for example, a pin or wristband) to serve as a reminder of the importance of this issue for their community and the world.
Ideas for More Learning• National Geographic Sea to Source Expedition
• National Geographic Debris Tracker
• National Geographic Society Resource Library - Plastic Pollution
• UN Environment Programme “Tide Turners”
Connect with Educators Conducting Similar Work:If you are interested in registering your education program in order to compare results with other similar programs, and receive access to additional materials, you can reach out to Sea to Source Expedition team member Gawsia Wahidunnessa Chowdhury, [email protected], with WildTeam headquartered in Bangladesh.

1 • LAND-BASED SYSTEMS • COLLECTION AND MANAGEMENT OF SOLID WASTE
Example Interview Questions based on the Sea to Source Expedition
• Waste and Recycling Collection
1. Who collects waste? Who collects recycling? Is there informal sector involvement? (If so, describe system)
2. How is waste collected? Door to door, by community dumpster, etc.?
3. How often is waste collected?
4. What percentage of the community has access to waste collection?
5. How is waste collection paid for in the community? Is there a cost to households? How much does it cost?
6. Are there any specific obstacles to reaching 100 percent collection?
• Waste Generation, Characterization, and Management
1. How much waste is generated per capita? Total generation rate for city/community?
2. How much does each type of waste material contribute to the overall output? What percentage of overall waste is organic, paper, plastic, metal, or other materials?
3. What is the biggest source of waste in the community? How much is generated by industry, tourism, households, and by other means?
4. How and where is the city/community waste managed? How much of it ends up in a landfill or recycling? Tabulate by percentage if possible. Is there informal sector involvement? If so, describe the system and how it operates.
5. How many facilities does the city/community use or operate to manage its waste? What types of facilities does each community use?
6. Are there any other waste management practices that I might not have observed?
• Policies
1. Does the community have any bans on plastic, or regulations or policies addressing plastic? Examples: bag bans, taxes on certain products, or bottle deposit schemes.
2. How is this policy enforced?
• Litter
1. Does street sweeping or gutter cleaning occur in the community? If so, how often?
2. Are there any other litter cleaning practices or policies in place, such as skimmer boats, grate collection devices, or other methods?

1 • LAND-BASED SYSTEMS • PHOTO QUADRAT LITTER DATA COLLECTION
Table 1. List of Litter Items from Debris Tracker
Material Item Type(Plastic Items Only)
Item Description
Plastic Plastic Food Products Plastic Grocery Bag
Other Plastic Bag
Plastic String, Tape, or Packing Straps
Plastic Bottle
Plastic Bottle Cap
Plastic Utensils
Plastic Food Wrapper
Foam or Plastic Cups or Lids
Styrofoam Container
Street Food Bowl
Straws
Other Food-Related Plastic
Plastic Fragments Hard Plastic Fragments
Film Fragments
Foam Fragments
Other Fragments
Personal Care Products Blister Pack
Cotton Buds
Toothbrushes
Toothpaste or Other Product Tube
Shampoo or Other HDPE Container
Shampoo Sachet
Other Personal Care Product
Tobacco Products Tobacco Sachets
Cigarettes
Cigarette Packaging
Other Tobacco Product
Other Plastic Products Flip Flops
Tires
Bulk Bags
Rubber Bands
Other Plastic
Metal Metal Aluminum or Tin Cans
Metal Bottle Caps or Tabs
Aluminum Foil
Metal Fragments
Other Metal

2 • LAND-BASED SYSTEMS • PHOTO QUADRAT LITTER DATA COLLECTION
Table 1 Continued.
Glass Glass Glass Bottle
Glass or Ceramic Fragments
Other Glass
Cloth Cloth Clothing
Fabric Pieces
Other cloth
Paper Paper Coated Paperboard
Noncoated Paper Food Wrapper
Multi-material Paper Box
Corrugated Cardboard
Receipts
Paper
Other Paper
C&D Materials C&D Materials Lumber
Building Materials
Aggregate & Brick
Bolts, Nails, and Screws
Other C&D
Fishing Gear Fishing Gear Buoys and Floats
Plastic Rope
Fishing Lures
Fishing Line
Plastic Net or Net Pieces
Other Fishing Gear
E-Waste E-Waste Batteries
E-Waste Fragments
Other E-Waste
Organic Waste Organic Waste Food Waste
Other Organic Waste
Other Other Popsicle Stick
Other
Unidentifiable Foreign Object

1 • KNOWLEDGE , ATTITUDES, AND PERCEPTIONS • FOCUS GROUP DISCUSSIONS
This is an example of a Focus Group Discussion Facilitators Guide used on the Sea to Source Expedition in Bangladesh and India. Please remember your guide will be decided by the purpose and objectives of your study and the location and local context for your research.
Example Focus Group Discussion Facilitators Guide based on the Sea to Source Expedition
Dear Participants:
I am part of a team that is conducting a study about the impact and importance of plastic waste management in the daily lives of local people in [insert village/community name] and its environment.
The [insert project title] is a study that works with you, the local community, to understand better how you deal with plastic waste management in your community. The objective of this study is to better understand how families in [village name] live, how you use plastics, and your thoughts and opinions on waste management and the impact it has on your surrounding natural environment.
This discussion will last about an hour and is completely voluntary. Your personal data and your responses will be kept confidential. You can choose to stop at any time during this survey and withdraw your participation from this study. There is no direct benefit associated with participating in the survey, nor are there sanctions should you decline to participate.
Many Thanks,
[Project Team / Name of Project Leader]
Location and date:
Start Time:
End time:
Facilitator/s:
# of participants:
Please pass round a participant list prior to commencing that records participant name, occupation, gender, and contact number (if possible)

2 • KNOWLEDGE , ATTITUDES, AND PERCEPTIONS • FOCUS GROUP DISCUSSIONS
Questions:
1. What is the impact of current plastic usage? [Probe into their daily lives, environment and health.]
2. Perception of threat: Does plastic pose any problems in your area? What problems does it pose?
3. Why is there so much plastic in the Ganges? [5 whys] Link this to the previous question [option to conduct participatory problem tree mapping]
4. What did people use before they used plastic? How much plastic was around? How did they manage plastic waste? [option to run as historical timeline]
5. How can you manage your plastics in your communities? What options do you have?
6. What would you change if you could?
7. What are the main types of single-use plastic products do you buy? Do those products also exist in bulk packaging? [Y/N]
8. What products do you currently buy in bulk?
9. What are the benefits of using a single-use plastic product?
10. What are the negatives of using single-use plastic products?
11. What are the benefits of using small single-use plastic sachet products over bulk packaging?
12. Follow up question asked- “If you had savings would they use this extra money to buy in bulk?”
13. What prevents you from buying the product in bulk packaging? [Answered in Q12.]
14. What alternatives are there to single-use plastic? What could be the benefit of using this?
15. What could be the barriers to stop using plastic, and use the alternative?
16. [Linked to specific products mentioned in Q7] How did you previously buy this product and manage the waste in the era before plastic?
17. How do you use the Ganges? Is the Ganges important to you? Why?
18. How do you feel that it’s changing? Link back to threats identified from the problem tree.
19. How do you make sure you can keep your river the way it is for the future generations? [Bring discussion back to the threats.]
20. Do you know of other places that you consider have successfully stopped using plastic, or are managing their plastic waste well? If so, what can we learn from them?

1 • KNOWLEDGE , ATTITUDES, AND PERCEPTIONS • HOUSEHOLD SURVEYS
This is an example of a Household Survey used on the Sea to Source Expedition in Bangladesh and India. Please remember your survey design will be decided by the purpose and objectives of your study and the location and local context for your research.
Example Household Monitoring Survey based on the Sea to Source Expedition
Dear Participant,
I am part of a team that is undertaking a study about the impact and importance of plastic waste management in the daily lives of local people in [insert village/community name] and our environment.
The [insert project title] is a study that works with you, the local community, to understand better, how you deal with waste management in your community. The objective of this study is to better understand how families in [village name] live, how you use plastics in your daily lives, and your thoughts on waste management and your surrounding natural environment. The survey will last approximately 45 minutes, and we will ask you questions about your household, income-generating activities, food access, well-being, waste management, plastic use, and your interactions with the environment.
This survey is completely voluntary and your personal data and all you say will be kept confidential. You can choose to stop at any time during this survey and withdraw your participation from this study. There is no direct benefit associated with participating in the survey, nor are there sanctions should you decline to participate.
Many Thanks,
[Project Team / Name of Project Leader]

2 • KNOWLEDGE , ATTITUDES, AND PERCEPTIONS • HOUSEHOLD SURVEYS
Before starting the questions, the interviewer should fill out the informed consent form to confirm that the Interviewees understand the nature of the study, that participation is voluntary, and that they accept to participate.
Have you understood the information given to you about this study?Yes [if yes, please continue with the survey]
No [if no, please list the reason and explain further]
Would you like to participate in this study?Yes [if yes, please continue with the survey]
No [if no, please list the reason]
Date
Participant signature
Interviewer signature

3 • KNOWLEDGE , ATTITUDES, AND PERCEPTIONS • HOUSEHOLD SURVEYS
Section A: General background and wellbeing
Date of interview: Village Name: Ward:
Season: Summer Rainy Winter Spring
Monsoon: Pre-Monsoon Post-Monsoon
GPS: Latitude: Longitude:
Distance from River:
Respondent full name:
Male Female
Interviewer name:
Interview Start time:
Hello/Good morning/Good afternoon, I would like to start by asking you a question about how you feel generally and how you are.
1. With all things considered, how satisfied are you with your life?
Please record additional information i.e. why the respondent feels the way they do?
ID NUMBER
PREASSIGNED HH CODE
1 2 3 4 5

4 • KNOWLEDGE , ATTITUDES, AND PERCEPTIONS • HOUSEHOLD SURVEYS
Section B: Household composition and livelihoods
Now, I would like to ask you some more questions about your household.
2. What is your occupation?
3. Who is the head of the household? The respondent Other [Name]
Head of Household information
4. What are the occupations of the head of the household? Main: Secondary: Other:
5. What is the highest level of education received by the head of the household, please tick: No formal education Pre-primary/Preschool Education Primary/Elementary Level Primary/Elementary Graduate Secondary/HS Level Secondary/HS Graduate Vocational Course Tertiary/College Level Tertiary/College Graduate Post-graduate Other
6. What is the age of the head of household?
7. Was the Head of Household born in this village? Yes No If no, where was he/she born?
Household members
8. Including you, what is the total number of members in the household?
9. For each age group, how many people are there in the household (including you)? 0-15 16-24 25-34 35- 44 45-55 56-64 65+
10. Including you, how many of the household members are: Male Female
11. What type of family do you live in: Joint Nuclear

5 • KNOWLEDGE , ATTITUDES, AND PERCEPTIONS • HOUSEHOLD SURVEYS
12. Do any household members live outside? Yes No If yes, how many?
13. Are any household members in self-help groups? Yes No If Yes, please name
14. Are any household members in any community groups? Yes No If yes, please name
15. Are any household members beneficiaries of any NGO? Yes No If yes, please name
16. How many household members are currently in education? Please specify the number at level:
17. Is anyone in the household a village official? Yes No If yes, please specify: Name Position
Pre-Primary / Pre-School
Education
(Level 0)
Primary / Elementary Education
(Level 1)
Secondary /
High School Education
(Level 2)
Vocational Education
(Level 3)
Tertiary / College
Education
(Level 4)
Tertiary / Postgraduate
Education
(Level 5)

6 • KNOWLEDGE , ATTITUDES, AND PERCEPTIONS • HOUSEHOLD SURVEYS
Section C: Wealth
Now I would like to ask you some questions about your home.
House tenure
18. Do you own the house you live in? Yes No
19. Do you rent your house? Yes No
20. Is your house owned by the government? Yes No
Material style of life
21. Please indicate the following information about the household:
a. Type of roof: Native materials Tin Cement Combination
b. Type of wall: Native materials Concrete / brick Combination
c. Type of floor: Mud/sand Native materials Concrete/tiles Combination
d. How many rooms are there in the household?
e. What type of toilet do you have? Community toilet Open pit Water sealed Flush toilet None
f. What type of water source do you have access to? Government tap Personal Hand pump Community hand pump Well River Own pond Other
g. How many functional TVs?
h. How many functional mobile phones?
i. How many functional VCD/DVD players?
j. How many functional sound systems (cd/radio)?
k. How many boat engines?
l. How many boats w/o engines?
m. Do you own or lease any land? Yes No
n. Do you own any livestock? Yes No Please list:

7 • KNOWLEDGE , ATTITUDES, AND PERCEPTIONS • HOUSEHOLD SURVEYS
o. Energy source cooking: Wood Coal Dung cake Solar cookers Charcoal Kerosene LPG Biogas
p. Energy source lighting: Solar lamp Kerosene Lamp Electricity Solar Panel
q. Type of cooking stove: □ Traditional challah Coil heater Smokeless challah Kerosene stove LPG stove
r. How many functional bicycles?
s. How many functional cars?
t. How many functional autorickshaws?
u. How many functional vans?
v. How many functional carts?
w. Any other assets? Please list any other assets you observe

8 • KNOWLEDGE , ATTITUDES, AND PERCEPTIONS • HOUSEHOLD SURVEYS
Q1. You or others in your household worried about not having enough food to eat because of a lack of money or other resources?
0 No 1 Yes 98 Don’t Know 99 Refused
Q2. Still thinking about the last 12 MONTHS, was there a time when you or others in your household were unable to eat healthy and nutritious food because of a lack of money or other resources?
0 No 1 Yes 98 Don’t Know 99 Refused
Q3. Was there a time when you or others in your household ate only a few kinds of foods because of a lack of money or other resources?
0 No 1 Yes 98 Don’t Know 99 Refused
Q4. Was there a time when you or others in your household had to skip a meal because there was not enough money or other resources to get food?
0 No 1 Yes 98 Don’t Know 99 Refused
Q5. Still thinking about the last 12 MONTHS, was there a time when you or others in your household ate less than you thought you should because of a lack of money or other resources?
0 No 1 Yes 98 Don’t Know 99 Refused
Q6. Was there a time when your household ran out of food because of a lack of money or other resources?
0 No 1 Yes 98 Don’t Know 99 Refused
Q7. Was there a time when you or others in your household were hungry but did not eat because there was not enough money or other resources for food?
0 No 1 Yes 98 Don’t Know 99 Refused
Q8. Was there a time when you or others in your household went without eating for a whole day because of a lack of money or other resources?
0 No 1 Yes 98 Don’t Know 99 Refused
Section D: Food Security
Now I would like to ask you some questions about food.
Over the past 12 months …
22. During the last 12 months, was there a time when:

9 • KNOWLEDGE , ATTITUDES, AND PERCEPTIONS • HOUSEHOLD SURVEYS
Now I would like to ask you some questions about food.
Over the past 30 days…
23. Over the past 30 days, if there have been times when you did not have enough food or money to buy food? How many times per week has your family had to …? (Repeat for each question)
Everyday 3-6 times Once or twice
Less than once
Never Refused to answer
Rely on less preferred and less expensive foods
Borrow food or money, or rely on help from a friend or relative
Limit or cut portion size at mealtimes
Restrict consumption by adults in order for small children to eat
Reduce or skip number of meals eaten in a day

10 • KNOWLEDGE , ATTITUDES, AND PERCEPTIONS • HOUSEHOLD SURVEYS
Section E: Disposal Behaviours and plastic use
Now I would like to ask you a few questions on your community and how you deal with waste.
24. How many river clean-ups have you participated in within your village over the last 12 months? None One More than one but less than one per month One per month More
25. Within your community over the past 12 months, how do people dispose of, or reuse their plastic waste? Ask the respondent to indicate which methods are used in their community by placing them into one of three piles: “Yes” (for those that they believe are used in their community) “No” (for those that they believe are not used in their community) “Don’t know” For those in the “Yes” pile , ask the respondent to rank the cards in order of usage (1 – most frequently used). Record the results below: Dumping in the river Yes No Throw outside the house Yes No Burning or burying Yes No Dumping in the community dumpsite Yes No Recycling Yes No Sell to Kabadiwala Yes No Other, please specify Yes No
26. What do you think happens to the plastic after you get rid of it?
27. Within your community over the past 12 months, how do people dispose of their waste (other than plastics)? Ask the respondent to indicate which methods are used in their community by placing them into one of three piles: “Yes” (for those that they believe are used in their community) “No” (for those that they believe are not used in their community) “Don’t know” For those in the “Yes” pile , ask the respondent to rank the cards in order of usage (1 – most frequently used). Record the results below: Dumping in the river Yes No Throw outside the house Yes No Burning or burying Yes No

11 • KNOWLEDGE , ATTITUDES, AND PERCEPTIONS • HOUSEHOLD SURVEYS
Dumping in the community dumpsite Yes No Recycling Yes No Other, please specify Yes No
28. How frequently over the last 7 days have you used products packaged in small plastic sachets (For example: Brand X toothpaste, Brand Y shampoo, biscuits) within your household? Never Less than once a week 1-6 times per week 1-3 times per day 4 or more times per day Is this: Higher Average or Lower than normal?
29. How frequently over the last 7 days have you used products packaged in polythene bags (such as vegetable and grocery bags) within your household? Never Less than once a week 1-6 times per week 1-3 times per day 4 or more times per day Is this: Higher Average or Lower than normal?
30. How frequently over the last 7 days have you used products packaged in single-use plastic bags (such as vegetable and grocery bags) within your household? Never Less than once a week 1-6 times per week 1-3 times per day 4 or more times per day Is this: Higher Average or Lower than normal?
31. Please identify the categories and the number of each that you have used within the household over the last 15 days? Toiletries: List Food Wrappers: List Polythene bags: List
32. Where do you buy your products?
33. How often do you buy your products?
34. How do you get there?
35. How far is it?
36. Do you have any waste management system in place in your locality? Yes No don’t know
37. Do you have a community dumpsite? □ Yes No don’t know If yes, where have these dustbins been installed? □ In the community outside the community
38. Do you have a dustbin in your house? □ Yes No don’t know If not, where do you dispose of your waste?
39. Who disposes of your waste?

12 • KNOWLEDGE , ATTITUDES, AND PERCEPTIONS • HOUSEHOLD SURVEYS
Section F: Plastics in the Ganges
40. In what ways do you use the Ganges? Irrigation Domestic water use (such as: household cooking, cleaning) Transportation Bathing Washing clothes Dispose of waste Other, please specify
41. How concerned are you about the plastic pollution in the Ganges? Very Moderately Not concerned at all Don’t know/unsure Why do you feel that way?
42. How concerned are you about how much plastic you are using? Very Moderately Not concerned at all Don’t know/unsure Why do you feel that way?
43. How concerned are you about the plastic you see in your village? Very Moderately Not concerned at all Don’t know/unsure Why do you feel that way?
44. Please rank the following actors in order of how responsible are for plastic waste management in your village (1 being ultimately responsible): You as an individual □ You as a community □ Local government □ Municipal government □ Business/industry □ NGOs

13 • KNOWLEDGE , ATTITUDES, AND PERCEPTIONS • HOUSEHOLD SURVEYS
45. Please rank the following actors in order of how who you think should take a lead in reducing plastic -use your village (1 being ultimately responsible): You as an individual ou as a community □ Local government □ Municipal government □ Business/industry □ NGOs
46. I am going to read you several statements about the management of plastic waste. For each statement, I would like you to tell me if you: Strongly Agree, Agree, Disagree, Strongly disagree or have no opinion on it.
a. There is no issue with plastic waste management in my village Strongly Agree Agree Disagree Strongly Disagree no opinion
b. The plastic that enters the Ganges is not harming the wildlife Strongly Agree Agree Disagree Strongly Disagree no opinion
c. There is good waste management infrastructure in my village to deal with waste Strongly Agree Agree Disagree Strongly Disagree no opinion
d. The plastic in Ganga is affecting my fish catch Strongly Agree Agree Disagree Strongly Disagree no opinion
e. Plastic is a durable and useful material, to find an alternative is very difficult. Strongly Agree Agree Disagree Strongly Disagree no opinion
47. What approach do you think will be most effective in reducing plastic waste? Avoid/reduce the total waste created in the first place Reuse material as many times as possible Recycle waste into new products Recover energy from waste Dispose of the waste to the landfill
48. What three words would you use to describe plastic?
1. 2. 3.

14 • KNOWLEDGE , ATTITUDES, AND PERCEPTIONS • HOUSEHOLD SURVEYS
Section G: Ganga and You
49. Have you heard about the Namami Gange program? Yes No If yes, what are the activities conducted by the Namami Gange program in your community?
50. Have you observed any cleanliness activities along the Ganga River or your locality? Yes No
51. If yes, what are the activities that were conducted? Cleanliness Drives Awareness Rally Sensitization workshops Village meetings Others, specify
52. How often are these activities organized? Weekly Monthly Annually
53. Who organizes these activities? Community members local authorities individually NGO other organization, name
54. Have you participated in any of these programs? Yes No
55. How often have you been part of these programs?
56. Are you a Ganga Prahari? Yes No If yes, kindly answer the following questions:
57. What are the activities you have participated in as Ganga Prahari? 1) 2) 3)
58. Have you ever attended any training/workshop or participated in any program with NMCG-WII? Yes No
59. What kind of aquatic life have you seen in the Ganga River?
60. Have you noticed any change in the aquatic life in the river? Yes No
61. If yes, what are the changes you have observed?
62. Is plastic waste affecting the aquatic life and your surroundings? Yes No If yes, what are its impacts?
63. As a Ganga Prahari, what habits have you adopted to reduce the use of plastic?
64. As a Ganga Prahari, what are your suggestions to the community for combatting this situation?

15 • KNOWLEDGE , ATTITUDES, AND PERCEPTIONS • HOUSEHOLD SURVEYS
Interview end time:
Thank you for your time today. Do you have any questions for me? Or any other comments that you would like to make?
Please make a note of any questions or comments made by the respondent below.

1 • KNOWLEDGE , ATTITUDES, AND PERCEPTIONS • YOUTH OUTREACH AND EDUCATION
This is an example of an Educator Guide based on the Teachers for Planet Earth education program as part of the Sea to Source Expedition. Please remember your guide will be suited to the purpose and objectives of your study and the location and local context for your research..
Example Educator Guide based on the Sea to Source Expedition
Dear Educators,
I am part of a team that is undertaking a study about the impact and importance of plastic waste management in the daily lives of local people in [insert village/community name] and our environment. Your students can help with this scientific research by collecting data on plastic pollution in their community. They can become more aware by considering their own plastic use, thinking about where and how it is a problem, generating creative solutions to the problem, and making a pledge to help stop plastic pollution.
In partnership with communities along [your target river(s)], we are using scientific research and education to help each other understand plastic pollution problems, seek creative solutions together, and motivate communities—including the next generation—to pledge against plastic pollution.
Without the participation of communities, we will not be able to address this problem. Together we will make a difference!
Many Thanks,
[Project Team / Name of Project Leader]
Lesson Goal:• To build understanding of the plastic pollution problem and to encourage individuals to
pledge to combat it.
Materials Provided:• Plastic Pollution Action Journal
• Debris Tracker Guide
Materials Needed:• Pencils
• Large paper
• Markers

2 • KNOWLEDGE , ATTITUDES, AND PERCEPTIONS • YOUTH OUTREACH AND EDUCATION
• Litter/bin bags, hand sanitizer, gloves, and litter pickers (optional, for collecting waste)
• Smartphones and internet access (optional, for collecting and submitting data)
• Computer, screen, and projector (optional)
Time:• 60-90 minutes. Note that times in the plan below are minimums, totaling 60 minutes. If
possible, allow five minutes more for each section for deeper thinking and discussion.
Lesson Plan:This lesson plan is designed to help you guide students through these six steps found in the trifold Plastic Pollution Action Journal.
1. How is Plastic Part of My Life?
2. When is Plastic a Problem?
3. Using Science to Understand the Problem
4. Litter Tracking
5. Analyze Data and Find Solutions
6. Action Steps
Introduction (5 minutes)Explain that during this lesson, students will be thinking about an ordinary thing—plastic—that is a growing problem for our world. Give each student (or groups of students if needed) a Plastic Pollution Action Journal and a pencil, and have them write their name(s) at the top. They will use the journal throughout these activities.
Step 1: How is Plastic Part of My Life? (5 minutes)In Step 1, students think on their own or talk with a group about how they use different types of plastics in their daily lives. Ask them to add their ideas to the chart in the journal.
Next, ask students to think about the ways these plastics can cause problems. Answers might include:
• Waterways or drains can get clogged, causing flooding or other problems
• Animals can ingest plastic thinking it is food
• Litter can make a place less beautiful
• Litter from upstream communities flow downriver, bringing pollution to communities downstream

3 • KNOWLEDGE , ATTITUDES, AND PERCEPTIONS • YOUTH OUTREACH AND EDUCATION
• Too much litter can cause problems with where to put it
• Buried litter can eventually cause problems with soil and groundwater
We often say we can “throw away” plastics that we are done using. But in reality, there is no “away” – plastics and other litter have to go somewhere! Talk about where discarded plastic goes in your community.
Step 2: When is Plastic a Problem? (10 minutes)Have students open their journal and take the true/false quiz in Step 2. All of these are true!
1. Plastic discarded on land can get washed into rivers and end up in the ocean.
2. Plastics can harm animals in the environment through ingestion or entanglement.
3. Scientists estimate that 8 million metric tons of plastic enter our oceans every year.
4. Scientists have found plastics in the depths of the world’s oceans and at the summits of some of the world’s highest mountains.
5. 50 percent of plastic used globally is used only once and then discarded.
Talk about the quiz and show an introductory video about the plastic pollution problem if time allows. Give students time to answer the addition two questions in their journal:
• Why do you think action is needed around plastic pollution locally?
• Why do you think action is needed around plastic pollution globally?
Help students think about how plastic pollution upstream in the rivers of their community can affect the people and natural environments downstream. What seems like a local problem—just near home or only in some communities—can become a national and international problem.
Step 3: Using Science to Understand the Problem (10 minutes)In Step 3, read with students about using science to better understand the plastic pollution problem. These resources and activities are provided by the Sea to Source Expedition, a collaboration among researchers from Bangladesh, India, the United States, the United Kingdom, and National Geographic who are trying to answer these questions:
• How does plastic move from land to rivers and ultimately into the ocean?
• What are the most commonly littered plastics?
• Where do we find plastic littered on land?
• Are there microplastics in the air, water, and sediment near rivers?
• Why do people use plastic? What are the barriers to change?

4 • KNOWLEDGE , ATTITUDES, AND PERCEPTIONS • YOUTH OUTREACH AND EDUCATION
Have students share their thoughts. Do they have a hypothesis about any of these questions? How might they attempt to test their hypotheses if they were scientists/researchers?
The Sea to Source Expedition set out to study the interactions between plastics, land, water, and the communities along rivers in Bangladesh and India. This research includes methods such as:
1. Collecting data on types of commonly found litter
2. Sampling of water, air, and sediment for microplastics
3. Interviewing people in rural and urban areas about plastics use
4. Assessing the paths plastics travel in areas with and without waste management systems
5. Determining barriers to using less plastic
A critical goal is to find ways to reduce the load of plastics on land and in water. What is learned in this and other communities in Bangladesh and India will help in tackling this global challenge in other parts of the world.
Step 4: Litter Tracking (15 minutes)Using the Step 4 litter tracking sheet or Debris Tracker mobile app, students now work individually or in small teams to collect data on the types and amounts of plastics found along a set line, called a transect. If you divide students into groups, you may have them fill the following roles: one picking up the litter (if determined safe), one collecting the litter in a bag for disposal later, and one marking the types of litter on the data sheet or in the Debris Tracker mobile app. When tracking is finished, students will total each litter type and also add for litter total to enter at the bottom of the page.
Teachers can submit data for the students using the Debris Tracker app on a smartphone. This data will be incorporated into the research, helping to understand the most commonly littered plastics and where they are found. Thank you!
Step 5: Analyze Data and Find Solutions (10 minutes)After the litter tracking segment, students look closely at the data they collected. If time permits, combine all data collected for the entire transect on a board so the whole class can analyze it together.
Give students time to talk in small groups and answer the questions about which litter type was most common, where they found it, and why they think it was there. Have them bring their ideas back to a whole group discussion. Remind them that this challenging research is very similar to what some researchers are doing, but on a much larger scale!
After spending time collecting and analyzing data, students should be ready to brainstorm some local solutions. Have them work again in teams to fill in the chart, thinking about creative ways to reduce, reuse, or refuse plastics.

5 • KNOWLEDGE , ATTITUDES, AND PERCEPTIONS • YOUTH OUTREACH AND EDUCATION
Step 6: Action Steps (10 minutes)For the last step, give students time to reflect on their own. Students will likely have different ideas for how and why this issue might be important to them. Hopefully, each will be ready to make a pledge to help combat plastic pollution problems personally, with their family, or more broadly with their community.
You may consider rewarding students who make a pledge with a small token (for example, a pin or wristband) to serve as a reminder of the importance of this issue for their community and the world.
Ideas for More Learning• National Geographic Sea to Source Expedition
• National Geographic Debris Tracker
• National Geographic Society Resource Library - Plastic Pollution
• UN Environment Programme “Tide Turners”
Connect with Educators Conducting Similar Work:If you are interested in registering your education program in order to compare results with other similar programs, and receive access to additional materials, you can reach out to Sea to Source Expedition team member Gawsia Wahidunnessa Chowdhury, [email protected], with WildTeam headquartered in Bangladesh.