sea power the value of offshore wind - south carolina that collects wind speed data. the data show...
TRANSCRIPT

SEA POWER The Value of Offshore Wind
Chris Carnevale February 27, 2014

About Us • SACE promotes responsible energy
choices that create global warming solutions and ensure clean, safe and healthy communities throughout the Southeast.
• SACE has been a leading voice for energy policy to protect the quality of life and treasured places in the Southeast for over 25 years. Founded in 1985, SACE remains the only regional organization primarily focused on developing clean energy solutions throughout the Southeast.
BECOME A MEMBER | TAKE ACTION @ www.cleanenergy.org FOLLOW US @ twitter.com/cleanenergyorg JOIN THE CONVERSATION on Facebook
READ MORE @ blog.cleanenergy.org/

Overview
• What is Peak Power?
• What is the Sea Breeze Effect?
• What do these have in common?
Disclaimers
• 2006-2008 Timeframe (other years may have different outcomes for both utilities and wind output)
• Evaluated Georgia Power, Progress Carolinas and Duke Energy Carolinas (reverted to parent company for costs data) – rough approximations for statewide electric demand
• Modeled offshore wind farms by AWS Truepower based on their power curves and weather data

Methodology Siting Analysis for Potential Near-Term Offshore Wind Farm
Development: Georgia, South Carolina, and North Carolina
March 2011 15
Figure 4. BOEMRE lease blocks (used as Study Blocks) with relative lowest intrusiveness for offshore wind development.
Siting Analysis for Potential Near-Term Offshore Wind Farm Development: Georgia, South Carolina, and North Carolina
March 2011 15
Figure 4. BOEMRE lease blocks (used as Study Blocks) with relative lowest intrusiveness for offshore wind development.
North Carolina 3,149 MW
South Carolina 3,315 MW
Georgia 2,050 MW

What is Peak Load?
7000
8000
9000
10000
11000
12000
13000
14000
15000
16000
0 6 12 18 24 Annual Avg. August Avg. February Avg.

Peaking Generation
• Required to supply electricity at heightened demand
• Necessary to prevent brownouts/blackouts • Fast reaction time • Can be very expensive

Simplistic Generation Model
Peaking
Intermediate
Base Load
Natural gas/petro combustion turbines
Natural gas combined cycle
Coal, Nuclear
Solar, Hydro, Wind
Hydro, Wind
Biomass, Geothermal

Simplistic Generation Model
3
Southern Alliance for Clean Energy Summer 2013
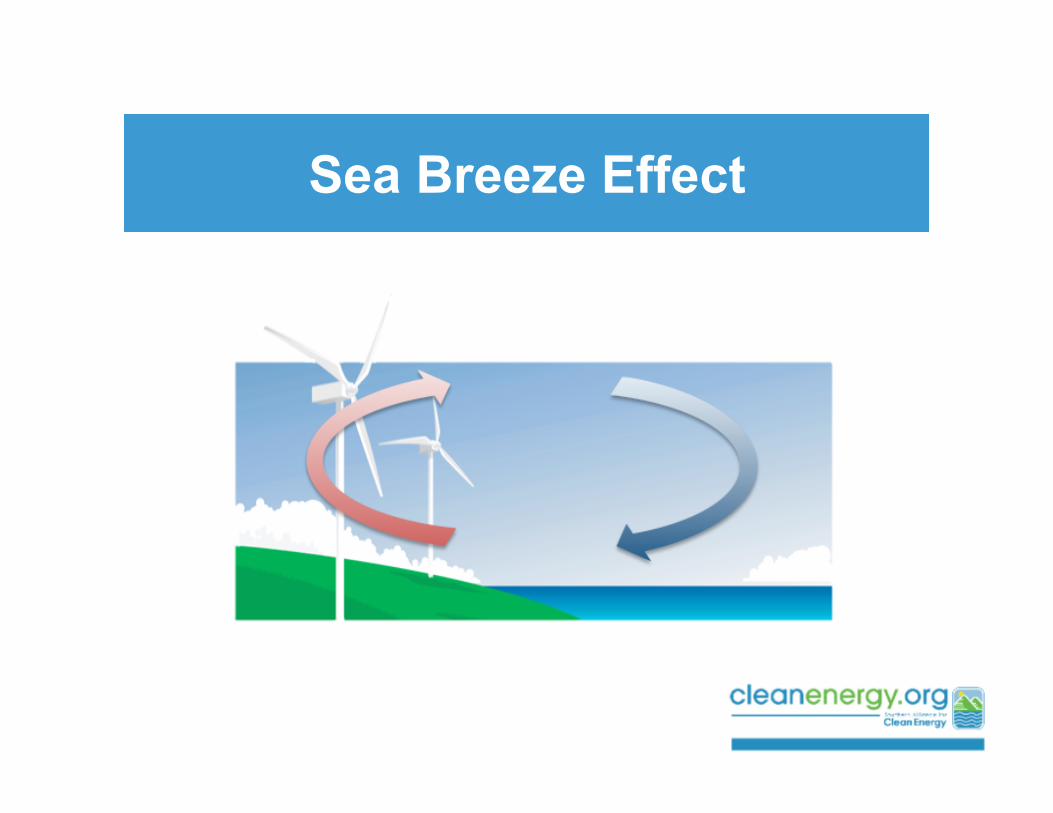
Sea Breeze Effect Occurs Offshore and Nearshore.
In 2007, an American offshore wind development firm published a report on offshore wind energy’s capability of matching a utility’s summer demand.2 The Cape Wind project off the coast of Massachusetts has a tower constructed several miles offshore that collects wind speed data. The data show that if that project were constructed, the electricity it would produce would coincide with summertime peak electrical generating demand. Cape Wind provides anecdotal evidence for the Sea Breeze Effect’s implications for offshore wind development.
Similar evidence suggests the Sea Breeze Effect also occurs in nearshore areas. In 2011, on a hot afternoon in Texas, numerous natural gas power plants and at least one coal-fired power plant suddenly went offline due to excessive heat.3 Newly built coastal wind farms provided power when the Texas grid manager needed the electricity most due in part to the sea breeze effect, helping to prevent a brownout or blackout.4 Therefore, the Sea Breeze Effect is not only a phenomenon for offshore, but also nearshore areas.
Peak-Power is High Value Power.
Peaking generation power plants are used minimally, but are required to quickly generate electricity and rapidly ramp up to meet the required electrical load. Peaking generation power plants can use diesel, petroleum, or more commonly, natural gas as a fuel source.5 The power plant’s minimal use, rapid and inefficient response as well as the use of fuels that are subject to price volatility make peaking generation an expensive generation resource. Nevertheless, peaking generation provides vital electrical resources when utilities need it most to prevent brownouts and blackouts. As such, utilities will pay more for peaking generation to ensure electrical reliability.
If offshore wind farms are capable of supplying peak power, utilities would not have to rely on more expensive
peaking generation units.
Source: U.S. Energy Information Administration.6 Note: The dispatch curve above is for a hypothetical collection of generators and does not represent an actual electric power system or model results. The capacity mix (of available generators) differs across the country; for example, the Pacific Northwest has significant hydroelectric capacity, and the Northeast has low levels of coal capacity. This dispatch curve does not show all costs associated with electric generation, such as capital costs.

Summertime = Peak Time
7000
8000
9000
10000
11000
12000
13000
14000
15000
16000
0 6 12 18 24 Annual Avg. August Avg. February Avg.

August has the most high demand occurrences
4
Southern Alliance for Clean Energy Summer 2013
Georgia’s Power Demands are Highest in the Summer.
Georgia Power is the largest electric utility in Georgia and the largest subsidiary company of Southern Company.7 The hour-by-hour electrical demand load profile of Georgia Power is available through the Federal Energy Regulatory Commission Form 714, along with Southern Company’s hourly generation cost (system lambda).8
Chart 2: Georgia Power Annual Electrical Demand 2011 (MW, by hour)
Georgia Power’s electrical demand tends to peak in the summer months from late May to early September (represented approximately by hours 3,500 – 6,000). During the wintertime, peak electrical demand also occurs from December to February (represented approximately by hours 8,000-8,760 and hours 0-1,000), albeit at a lesser scale relative to the summer months. Of the top 10% of electrical demand hours, the vast majority of them occur in June, July and August (see Chart 3).
Chart 3: Top 10% Hourly Demand Load Occurrences (Average 2006-2008)
May 13 June 223 July 249
August 321 September 70 Source: Georgia Power, FERC Form 714.
Another way to determine the importance of electrical generation is to evaluate at the cost of electricity at a particular hour. The higher the electrical cost, presumably the more important electrical generation becomes at that particular time. One way to determine these costs is by evaluating a utility’s cost to generate the next megawatt-hour (MWh) of electricity, also called the “system lambda”.9 For Southern Company (the parent company of Georgia Power), the 2011 top 10% of system lambda costs ranged from about $51 per MWh to about $264 per MWh. Like the top 10% of electrical demand hours, most of the top 10% system lambda costs in 2011 occurred during the summer months of June, July and August (see Chart 4).
Chart 4: Top 10% System Lambda Cost Occurrences (2011)
January 61 February 2 March 5 April 22 May 90 June 176 July 191
August 213 September 69 October 15
November 14 December 18
Source: Southern Company, FERC Form 714.
Jan Feb Mar Apr May June July Aug Sept Oct Nov Dec
Source: Georgia Power, FERC Form 714.
Rolling average indicated by black line. Hour 0 = 12AM, January 1, 2011
4
Southern Alliance for Clean Energy Summer 2013
South Carolina’s Power Demands are Highest in the
Summer. Progress Carolinas was the fourth largest electric utility in South Carolina until it recently merged with Duke Energy.7 The hour-by-hour electrical demand load profile of Progress Carolinas is available through the Federal Energy Regulatory Commission Form 714, along with Progress’ hourly generation cost (system lambda) for 2007.8
Chart 2: Progress Carolinas Annual Electrical Demand 2011 (MW, by hour)
Source: Progress Carolinas, FERC Form 714. Rolling average indicated by black line.
Hour 0 = 12AM, January 1, 2011 Progress Carolinas’ electrical demand tends to peak in the summer months from late May to early September (represented approximately by hours 3,500 – 5,500). During the wintertime, peak electrical demand also occurs from January to February (represented approximately by hours 0-500), albeit at a lesser intensity relative to the summer months. Of the top 10% of electrical demand hours, the vast majority of them occur in June, July and August (see Chart 3).
Chart 3: Top 10% Avg. Hourly Demand Load Occurrences (Average 2006-2008)
January 10 February 5
May 11 June 195 July 271
August 313 September 67 December 4
Source: Progress Carolinas, FERC Form 714.
Another way to determine the importance of electrical generation is to evaluate at the cost of electricity at a particular hour. The higher the electrical cost, presumably the more important electrical generation becomes at that particular time. One way to determine these costs is by evaluating a utility’s cost to generate the next megawatt-hour (MWh) of electricity, also called the “system lambda”.9 For Progress Carolinas, the 2007 top 10% of system lambda costs ranged from about $74 per MWh to about $237 per MWh. Unlike the top 10% of electrical demand hours, most of the top 10% system lambda costs in 2007 occurred during the winter months of January and February (see Chart 4). This result seems inconsistent with trend where high demand periods occur during the summertime. The inconsistency may be due to the availability of only a single year of data. System lambda costs tend to increase as a utility’s ability to serve peak demand decreases; thus forcing the utility to buy electricity on an open market that may also be full of other utilities bidding for that same peak power.
Chart 4: Top 10% System Lambda Cost Occurrences (2007)
January 238 February 207 March 102 April 105 May 5 June 4
August 74 September 36 October 45
November 4 December 56
Source: Progress Carolinas, FERC Form 714.
4000
6000
8000
10000
12000
14000
0 2000 4000 6000 8000
Jan Feb Mar Apr May June July Aug Sept Oct Nov Dec
4
Southern Alliance for Clean Energy Summer 2013
North Carolina’s Power Demands are Highest
in the Summer. Duke Energy is the largest electric utility in the country.7 The hour-by-hour electrical demand load profile of Duke Energy Carolinas LLC is available through the Federal Energy Regulatory Commission Form 714 for 2006-2008. However, hourly generation cost (system lambda) data are only available for the year 2006.8
Chart 2: Duke Energy Carolinas Power Annual Electrical Demand 2006-2008 Average (MW, by hour)
Duke Energy’s electrical demand tends to peak in the summer months from June to early September (represented approximately by hours 4,000 – 6,000). During the wintertime, peak electrical demand also occurs from December to February (represented approximately by hours 8,000-8,760 and hours 0-1,000), albeit at a lesser scale relative to the summer months. Of the top 10% of electrical demand hours, the vast majority of them occur in June, July and August (see Chart 3).
Chart 3: Top 10% Hourly Demand Load Occurrences (Average 2006-2008)
January 34 February 53
May 29 June 142 July 247
August 332 September 28 December 11 Source: Duke Energy, FERC Form 714.
Another way to determine the importance of electrical generation is to evaluate at the cost of electricity at a particular hour. The higher the electrical cost, presumably the more important electrical generation becomes at that particular time. One way to determine these costs is by evaluating a utility’s cost to generate the next megawatt-hour (MWh) of electricity, also called the “system lambda”.9 For Duke Energy, the 2006 top 10% of system lambda costs ranged from about $47 per MWh to about $241 per MWh. A high occurrence of the top 10% system lambda costs in 2006 occurred in June, July and August (see Chart 4). However, April had the highest occurrences of those top costs, and the top costs (in the $230+ per MWh range) occurred in November. The variability of these top system lambda costs is potentially due to the availability of only a single year of data.
Chart 4: Top 10% System Lambda Cost Occurrences (2006)
January 28 March 107 April 205 May 107 June 156 July 137
August 102 September 14 October 5
November 11 December 4 Source: Duke Energy, FERC Form 714.
Jan Feb Mar Apr May June July Aug Sept Oct Nov Dec
Source: Duke Energy, FERC Form 714. Rolling average indicated by black line.
Hour 0 = 12AM, January 1
North Carolina South Carolina
Georgia
Sea Breeze Effect

Anecdotal Evidence Nearshore and Offshore
“…the growing number of wind projects along the Texas coast has helped boost wind's contribution during peak summer hours since coastal winds tend to pick up in the afternoons.
As the land heats up during the day the air mass above it rises, pulling in the cooler air over the water and creating steady offshore winds.”
“Thanks to the sea breeze effect, an offshore wind farm in a location like Nantucket Sound will tend to be very productive during hot summer afternoon conditions, when electric demand in the region is at its highest due to increased use of air conditioning.”

South Carolina Capacity Factors
5
Southern Alliance for Clean Energy Summer 2013
South Carolina’s Sea Breeze Effect is Strongest in the Summer.
A report completed in 2011 by AWS Truepower estimated offshore wind energy output for three potential offshore wind farms off South Carolina’s northeastern coast.10 For each of the three potential wind farms, 10-minute scale wind speed data files were created based on historical data from January 1, 1999 to December 31, 2008. For the purposes of this report, the data files were aggregated from 2006-2008 (to match data available from Progress Carolinas) and narrowed down to the wintertime and summertime periods.
As can be seen by Chart 5, the Sea Breeze Effect during the summer months is most pronounced in the afternoon (especially around 5PM and 6PM). The wintertime Sea Breeze Effects are less pronounced but can generally be seen in the morning and afternoon (peaking around 6AM) and the lesser effect occurring in the evening (peaking around 6PM).
Chart 5: Seasonal Offshore Wind Energy Output by Hour
South Carolina Wintertime Output South Carolina Summertime Output
40% Annual Average

South Carolina Results
7
Southern Alliance for Clean Energy Summer 2013
Chart 7: Hourly offshore wind output (percentage of peak generation) and hourly Progress Energy demand load curve (percentage of peak load) by month (2006-2008)
June
Ju
ly
Aug
ust
0%
20%
40%
60%
80%
100%
12A
M
1AM
2A
M
3AM
4A
M
5AM
6A
M
7AM
8A
M
9AM
10
AM
11
AM
12
PM
1PM
2P
M
3PM
4P
M
5PM
6P
M
7PM
8P
M
9PM
10
PM
11PM
%Peak Demand %Peak Load
0%
20%
40%
60%
80%
100%
12A
M
1AM
2A
M
3AM
4A
M
5AM
6A
M
7AM
8A
M
9AM
10
AM
11
AM
12
PM
1PM
2P
M
3PM
4P
M
5PM
6P
M
7PM
8P
M
9PM
10
PM
11PM
%Peak Demand %Peak Load
0%
20%
40%
60%
80%
100%
12A
M
1AM
2A
M
3AM
4A
M
5AM
6A
M
7AM
8A
M
9AM
10
AM
11
AM
12
PM
1PM
2P
M
3PM
4P
M
5PM
6P
M
7PM
8P
M
9PM
10
PM
11PM
%Peak Demand %Peak Load
38%
Avg. Capacity Factor
0.51
Hourly Correlation
0.74
Daylight Correlation (6AM-7PM)
28%
Avg. Capacity Factor
0.47
Hourly Correlation
0.42
Daylight Correlation (6AM-7PM)
32%
Avg. Capacity Factor
0.54
Hourly Correlation
0.48
Daylight Correlation (6AM-7PM)
Conclusions
• Sea Breeze Effects are clearly available in North Carolina, South Carolina and Georgia, especially during hot summertime afternoons.
• Offshore and nearshore wind resources can provide valuable peak power – and potentially keep rates in check.
• High value power may make these projects more profitable or better offset costs.
• These resources could be used to help utilities meet peak demand and should be valued as such.
Contact
Thank You!
Chris Carnevale Coastal Climate & Energy Coordinator
Full reports available http://www.cleanenergy.org/seapower