sea-ice information services in the world
TRANSCRIPT

Sea-Ice Information Servicesin the World
Third edition
WMO-No. 574

NOTEThe designations employed and the presentation of material in this publication do not imply the expression of any opinion whatsoever on the part of the Secretariat of the World Meteorological Organization concern-ing the legal status of any country, territory, city, or area, or of its authorities, or concerning the delimitation of its frontiers or boundaries.
© 2006, World Meteorological Organization, Geneva
ISBN 92-63-13574-6

Supplement
No. Dated
Inserted in the publication
by date
1
2
3
4
5
6
7
8
9
10
11
12
13
14
15
16
17
18
19
20
21
22
23
24
25
TABLE FOR NOTING SUPPLEMENTS RECEIVED

V

V
CONTENTS
FOREWORD . . . . . . . . . . . . . . . . . . . . . . . . . . . . . . . . . . . . . . . . . . . . . . . . vii
INTRODUCTION . . . . . . . . . . . . . . . . . . . . . . . . . . . . . . . . . . . . . . . . . . . . . . 1
PART I – GENERAL . . . . . . . . . . . . . . . . . . . . . . . . . . . . . . . . . . . 3
1. The nature of sea ice . . . . . . . . . . . . . . . . . . . . . . . . . . . . . . . . . . . . 3
2. Ice observing methods . . . . . . . . . . . . . . . . . . . . . . . . . . . . . . . . . . . 4
3. Integrated observational systems . . . . . . . . . . . . . . . . . . . . . . . . . . . . . . 6
4. Ice information services . . . . . . . . . . . . . . . . . . . . . . . . . . . . . . . . . . 6
5. International cooperation . . . . . . . . . . . . . . . . . . . . . . . . . . . . . . . . . 7
PART II – REGIONAL AND NATIONAL PRACTICES . . . . . . . . . . . . . . . . . . . . . . 9
NORTHERN HEMISPHERE
North and North-East Asia and North Europe . . . . . . . . . . . . . . . . . . . . . 9
China . . . . . . . . . . . . . . . . . . . . . . . . . . . . . . . . . . . . . . . . . . . . . . . 9
Japan . . . . . . . . . . . . . . . . . . . . . . . . . . . . . . . . . . . . . . . . . . . . . . . . 10
Russian Federation . . . . . . . . . . . . . . . . . . . . . . . . . . . . . . . . . . . . . . . . . 11
North-East Atlantic and Baltic Sea areas . . . . . . . . . . . . . . . . . . . . . . . 13
Denmark . . . . . . . . . . . . . . . . . . . . . . . . . . . . . . . . . . . . . . . . . . . . . . 13
Estonia . . . . . . . . . . . . . . . . . . . . . . . . . . . . . . . . . . . . . . . . . . . . . . . 15
Finland . . . . . . . . . . . . . . . . . . . . . . . . . . . . . . . . . . . . . . . . . . . . . . . 16
Germany . . . . . . . . . . . . . . . . . . . . . . . . . . . . . . . . . . . . . . . . . . . . . . 17
Iceland . . . . . . . . . . . . . . . . . . . . . . . . . . . . . . . . . . . . . . . . . . . . . . . 18
Latvia . . . . . . . . . . . . . . . . . . . . . . . . . . . . . . . . . . . . . . . . . . . . . . . . 19
Lithuania . . . . . . . . . . . . . . . . . . . . . . . . . . . . . . . . . . . . . . . . . . . . . 19
Netherlands . . . . . . . . . . . . . . . . . . . . . . . . . . . . . . . . . . . . . . . . . . . . 21
Norway . . . . . . . . . . . . . . . . . . . . . . . . . . . . . . . . . . . . . . . . . . . . . . 21
Poland . . . . . . . . . . . . . . . . . . . . . . . . . . . . . . . . . . . . . . . . . . . . . . . 22
Sweden . . . . . . . . . . . . . . . . . . . . . . . . . . . . . . . . . . . . . . . . . . . . . . . 23
United Kingdom . . . . . . . . . . . . . . . . . . . . . . . . . . . . . . . . . . . . . . . . . . 24
North America . . . . . . . . . . . . . . . . . . . . . . . . . . . . . . . . . . . . . . 24
Canada . . . . . . . . . . . . . . . . . . . . . . . . . . . . . . . . . . . . . . . . . . . . . . . 24
North American Ice Service . . . . . . . . . . . . . . . . . . . . . . . . . . . . . . . . . . . . 26
United States . . . . . . . . . . . . . . . . . . . . . . . . . . . . . . . . . . . . . . . . . . . . 27
SOUTHERN HEMISPHERE
Argentina . . . . . . . . . . . . . . . . . . . . . . . . . . . . . . . . . . . . . . . . . . . . . 36
Australia . . . . . . . . . . . . . . . . . . . . . . . . . . . . . . . . . . . . . . . . . . . . . . 37
New Zealand . . . . . . . . . . . . . . . . . . . . . . . . . . . . . . . . . . . . . . . . . . . . 37

VI
SEA-ICE INFORMATION SERVICES IN THE wORld
ANNEXES–SAMPLECHARTSANDOUTPUTPRODUCTSOFNATIONALSERVICES 39ANNEX I – Canada . . . . . . . . . . . . . . . . . . . . . . . . . . . . . . . . . . . . . . . . . 41
ANNEX II – China . . . . . . . . . . . . . . . . . . . . . . . . . . . . . . . . . . . . . . . . . 48
ANNEX III – Denmark . . . . . . . . . . . . . . . . . . . . . . . . . . . . . . . . . . . . . . . 51
ANNEX IV – Estonia . . . . . . . . . . . . . . . . . . . . . . . . . . . . . . . . . . . . . . . . 53
ANNEX V – Finland . . . . . . . . . . . . . . . . . . . . . . . . . . . . . . . . . . . . . . . . 54
ANNEX VI – Germany . . . . . . . . . . . . . . . . . . . . . . . . . . . . . . . . . . . . . . . 56
ANNEX VII – Japan . . . . . . . . . . . . . . . . . . . . . . . . . . . . . . . . . . . . . . . . 58
ANNEX VIII – Norway . . . . . . . . . . . . . . . . . . . . . . . . . . . . . . . . . . . . . . . 60
ANNEX IX – Poland . . . . . . . . . . . . . . . . . . . . . . . . . . . . . . . . . . . . . . . . 61
ANNEX X – Russian Federation . . . . . . . . . . . . . . . . . . . . . . . . . . . . . . . . . . 62
ANNEX XI – Sweden . . . . . . . . . . . . . . . . . . . . . . . . . . . . . . . . . . . . . . . . 67
ANNEX XII – United States . . . . . . . . . . . . . . . . . . . . . . . . . . . . . . . . . . . . 69
ANNEX XIII – North American Ice Service . . . . . . . . . . . . . . . . . . . . . . . . . . . . 80

FOREWORD
Many ocean and sea areas of the world, in addition to the polar seas, are susceptible to sea ice (for example, the Baltic Sea and parts of the Yellow Sea). Sea ice occurs in a wide range of types and forms, and affects signifi-cantly and directly marine transport and navigation. Economic and social developments are engendering significant increases in international shipping, partic-ularly in areas susceptible to sea ice. The specialized meteorological services, which evolved initially in support of local marine users, have since developed into a wide range of sea-ice information services designed to meet many user requirements. The Joint World Meteorological Organization/Intergovernmental Oceanographic Commission Technical Commission for Oceanography and Marine Meteorology (JCOMM) Expert Team on Sea Ice (ETSI) (before 2001 called the Subgroup on Sea Ice – SGSI, of the WMO Commission for Marine Meteorology – CMM) has been the focal point for promoting and coordinating international cooperation in the acquisition, exchange, archival and dissemination of sea-ice information.
The WMO publication Sea-Ice Information Services in the World (WMO-No. 574) was first published in 1981. Following a recommendation of the CMM-XII in 1997, the SGSI undertook a major review of this important publication. As a result, a second fully updated version was published in 2000. Fast progress in sea-ice infor-mation systems, as well as the need for comprehensive sea-ice information, predetermined the decision of the
second session of the JCOMM ETSI in 2004 to start a regular update of the publication on the annual basis. This present revised third version was prepared in 2005–2006 by the ETSI with the support of the WMO Secretariat, and includes contributions from 20 coun-tries from the Northern and Southern hemispheres involved in sea-ice activities.
I believe that this publication will continue to enhance the exchange of information relating to sea ice and sea-ice services for the benefit of many National Meteorological Services, in particular in conjunction with the International Polar Year 2007–2008. In addi-tion, to facilitate provision of operational information to mariners, marine operations and controllers, it will also aid other National Meteorological Services, which are developing their own sea-ice services.
On behalf of the World Meteorological Organization, I would like to express my sincere appreciation to all members of the Expert Team on Sea Ice and other experts from the national ice services for their contribu-tions to the preparation of this valuable publication.
(M. Jarraud)Secretary-General

OMM_APFMinside_E 17-06-51.qxp 10/12/06 12:13 PM Page 4

1
Mariners have known of the existence and perils of sea ice since vessels first ventured into northern regions. The numerous polar expeditions of the nineteenth and twentieth centuries brought new understanding of the types and variability of conditions affecting these vast ocean areas. It was not until misfortune struck the SS Titanic, however, that thoughts of inter-national cooperation in sea-ice information gained any strength. After 1918, increasing emphasis upon navigational safety and the need for agreed shipping routes led to contacts between nations who had estab-lished their own sea-ice observational information systems. Discussions about reporting methods, code forms and symbology (within the confines of the limited extent of observation at that time) continued steadily until 1959. Advances in communications, the advent of aircraft observations and routine report-ing created the basis for the development of sea-ice information services by several nations by the mid-1950s. The first international sea-ice conferences were held and the Commission for Marine Meteorology (CMM) established a working group concerned with sea-ice affairs.
Since that time many further strides forward have been made both in observational and processing tech-niques, and information services are provided now as routine for all the commonly frequented sea-ice regions.
The first edition of Sea-Ice Information Services in the World (WMO-No. 574) was prepared and published by 1981. Since then, due to advances in remote sens-ing, computational means and telecommunications, significant progress has been made in the number and complexity of sea-ice products. In addition changes in the number of sea-ice services and their regions of responsibility have occurred. Following recommenda-tion of the CMM-XII in 1997, the Subgroup on Sea Ice (SGSI) undertook a review of the publication and a second fully updated version was issued in 2000.
Further progress in sea-ice information systems, the need for comprehensive information on sea-ice services and planning for the International Polar Year 2007–2008 predetermined the decision of the SGSI successor – the JCOMMi Expert Team on Sea
Ice (ETSI) – in 2004 to update the publication on an annual basis.
This third edition follows the structure of the previ-ous publications, and has been designed to describe sea-ice services as they are today, and to provide clear factual and updated details of the sources, background, preparation and presentation of these services. Special attention is given to (a) processing and presentation of various satellite imagery; (b) information products based on the results of numerical modelling of the sea-ice cover; and (c) using the Internet to relay sea-ice products to users.
The publication consists of two parts:
Part I – A general description of the nature of sea ice, methods of observation, and the basis of ice-informa-tion services.
Part II – A listing of the sea-ice information services available from 20 nations, given regionally, and in each case detailing:(a) Organization;(b) Data acquisition;(c) Output products;(d) Forecasts;(e) Publications;(f) Mailing and Internet addresses.
These details are supported by 13 annexes contain-ing sample charts and illustrating a wide selection of the products mentioned in Part II, including charts remotely sensed or with numerically modelled back-grounds, complexity, dissemination methods and national and international practices where relevant.
The extent to which sea-ice information services have now developed will be very evident to readers. It is hoped that this third review may in turn, through its users and those involved in related services, itself contribute further to future advances.
i The Joint World Meteorological Organization and Intergovernmental
Oceanographic Commission Technical Commission for Oceanography
and Marine Meteorology.
INTRODUCTION

3

3
1. THENATUREOFSEAICE
Several forms of floating ice may be encountered at sea. The most common is that which results from the freezing of the sea surface, namely sea ice. The other forms are river ice and ice of land origin. River ice is encountered in harbours and estuaries where it is kept in motion by tidal streams and normally presents only a temporary hindrance to shipping. Ice of land origin in the form of icebergs is discussed separately below.
Both icebergs and sea ice can be dangerous to ship-ping and always have an effect on navigation. Sea ice also influences the normal processes of energy exchange between the sea and the air above it. The extent of sea-ice cover can vary significantly from year to year and has a great effect both on adjacent ocean areas and on the weather over large areas of the world. Its distribution is therefore of considerable interest to meteorologists and oceanographers.
1.1 FormationanddevelopmentoFseaice
1.1.1 Icelessthan30cmthick
The first indication of ice formation is the appearance of small ice spicules or plates in the top few centimetres of the water. These spicules, known as frazil ice, form in large quantities and give the sea an oily appearance. As cooling continues the frazil ice coalesces to form grease ice, which has a matt appearance. Under near-freez-ing, but as yet ice-free conditions, snow falling on the surface may result in the sea surface becoming covered by a layer of slush. These forms may be regrouped by the action of wind and waves to form shuga and all are classified as new ice.
With further cooling, sheets of ice rind or nilas are formed, depending on the rate of cooling and on the salinity of the water. Ice rind is formed when water of low salinity freezes into a thin layer of brittle ice which is almost free of salt. Ice rind may be up to 5 cm thick. When water of high salinity freezes, especially if the process is rapid and the wind is very light, the ice has an elastic property which is characteristic of nilas. Nilas is subdivided, according to its thickness, into dark and light nilas; the first one reach thickness of 5 cm, while the second, more advanced stage reaches a maximum thickness of 10 cm. Ice rind, dark and light nilas, may be referred to as nilas ice.
Pancake ice may be formed in the boundary between two water layers of different salinity – the lower layer with a high salinity has a temperature below the freez-ing point of the upper layer of lower salinity. Eventually the pancakes will surface due to buoyancy forces. “False” pancake ice may be formed by the breaking up of nilas, or ice rind, due to the action of wind and waves. It must be noted that the process of pancake ice formation is still poorly investigated due to the lack of observations.
Ice rind, nilas or pancake ice may thicken into grey ice and grey-white ice, the first being 10–15 cm thick and the latter attaining thicknesses of up to 30 cm. These forms of ice are referred to collectively as young ice. Rough weather may break this ice up into ice cakes, pancake ice or floes of varying size.
1.1.2 Ice30cm–2mthick
The next stage of development is known as first-year ice (FY) and is subdivided into thin, medium and thick categories. Thin first-year ice has a thickness of 30–70 cm and is subdivided according to its thickness into thin first-year ice first stage (30–50 cm) and thin first-year ice second stage (50–70 cm). Medium first-year ice has a range of thickness from 70 to 120 cm while in polar areas thick first-year ice may attain a thickness of approximately 2 m by the end of the winter.
1.1.3 Oldice
Thick first-year ice may survive the summer melt season and is then classified as old ice (MY). This cate-gory is subdivided into second-year and multi-year ice depending on whether the floes have survived one or more summers. The thickness of old ice is normally in the range 1.2 to 5 m or more prior to the onset of the melt season. Old ice can often be recognized by a bluish surface colour in contrast to the greenish tinge of first-year ice.
1.2 decayoFseaice
During the winter the ice usually becomes covered with snow of varying thicknesses. While this snow cover persists, almost 90 per cent of the incoming radiation is reflected back to space. Eventually, however, the snow begins to melt as air temperatures rise above 0°C in early summer and the resulting fresh water forms puddles on the surface. These puddles absorb (instead of reflect) around 90 per cent of the incoming radiation
PART I
GENERAL

SEA-ICE INFORMATION SERVICES IN THE wORld
5
and rapidly enlarge as they melt the surrounding snow or ice. Eventually the puddles penetrate to the bottom surface of the floes and are known as thawholes. This decay process is characteristic of ice in the Arctic Ocean and seas where movement is restricted by the coastline or islands. Where ice is free to drift into warmer waters (e.g. the Antarctic and the Labrador Sea) puddling is less prevalent and decay is accelerated by wave erosion as well as warmer air and sea temperature.
1.3 movementoFseaice
Sea ice is divided into two main types according to its mobility. One type is drift ice, which is continually in motion under the action of wind and current stresses; the other is fast ice, attached to the coast or islands, which does not move.
Wind stress in the drift ice causes the floes to move approximately in a downwind direction. The rate of movement due to wind drift varies not only with the wind speed, but also with the concentration of the drift ice and the extent of deformation (see below). In very open ice (1/10–3/10) and open ice (4/10–6/10) there is much more freedom to respond to the wind than in close ice or pack ice (7/10–8/10) and very close ice (9/10–10/10) where free space is very limited. No water is visible within the compact ice (10/10) or consolidated ice (10/10) where the floes are frozen together. Two per cent of the wind speed is a reasonable average for the rate of ice drift caused by the wind in close ice, but much higher rates of ice drift may be encountered in open ice. Since it is afloat, a force is exerted on drift ice by currents that are present in the upper layers of the water, whether these are tidal in nature or have a more consistent direction due to other forces. It is usually very difficult to differentiate between wind- and current-induced ice drift but in any case where both are present the resultant motion is always the vector sum of the two. Wind stress normally predominates the short-term movements, particularly in offshore areas, whereas the average long-term transport is dominated by the prevailing surface currents.
1.4 deFormationoFseaice
Where the ice is subjected to pressure its surface becomes deformed. In new and young ice this may result in rafting as one ice floe overrides its neighbour; in thicker ice it leads to the formation of ridges and hummocks according to the pattern of the convergent forces causing the pressure. During the process of ridg-ing and hummocking, when pieces of ice are piled up above the general ice level, large quantities of ice are also forced downward to support the weight of the ice in the ridge or hummock. The underwater parts may be termed respectively ice keel and bummock. The draught of a ridge can be three to five times as great as its height and these deformations are thus major impediments to navigation. Freshly-formed ridges are
normally less difficult to navigate than older, weath-ered and consolidated ridges.
1.5 icebergs
Icebergs are large masses of floating ice derived from glaciers. The underwater mass and draught of a berg, compared with its mass and height above water varies widely with different composition and shapes of bergs. The underwater mass of an Antarctic iceberg derived from a floating ice shelf is usually less than the underwater mass of icebergs derived from Greenland glaciers. A typical Antarctic tabular berg, of which the uppermost 10–20 m is composed of old snow, will show one part of its mass above the water to five parts below. The ratio for an Arctic berg, composed almost wholly of ice with much less snow is generally smaller, rather one to seven. However, because of their irregu-lar shape the latter icebergs have a height-to-draught ratio averaging one to three.
Icebergs diminish in size in three different ways: by calving, melting and combined melting plus erosion caused by wave action. A berg is said to calve when a piece breaks off; this disturbs its equilibrium, so that it may float at a different angle or it may capsize. Large underwater projections, which may be difficult to observe, are a usual feature of icebergs in any state. In cold water, melting takes place mainly on the water line while in warm water a berg melts mainly from below and calves frequently. It is particularly danger-ous to approach a berg in this state for it is unstable and may fragment or overturn at any time. There are likely to be many growlers and bergy bits around rapidly disintegrating icebergs, which form a particu-lar hazard to navigation.
Weathered bergs are poor reflectors of radar pulses and cannot always be detected by such means. Their breakdown fragments – bergy bits and growlers – are even more difficult to detect with ships’ radar for the background clutter from waves and swell often obscures them. These smaller fragments are especially dangerous to shipping for, despite their low profile they represent sufficient mass to damage a vessel, which comes into contact with them at normal cruis-ing speed. Some growlers consisting of pure blue ice hardly break the sea surface and are extremely difficult to detect.
2. ICEObSERVINGMETHODS
Although broad knowledge of the extent of sea-ice cover has been totally revolutionized by satellite imagery, observations from shore stations, ships and aircraft are still of great importance in establishing the “ground truth” of satellite observations. At present, observations of floating ice depend on instrumental
4

5
PART 1
and, to lesser extent, on visual observations. The instru-mental observations are by conventional aircraft and coastal radar, visual and infra-red airborne and satellite imagery, and more recent techniques, such as passive microwave sensors, laser airborne profilometer, scat-terometer, side-looking (airborne) radar (SLAR/SLR) or synthetic aperture radar (SAR, satellite or airborne).
The four most important features of sea ice, which affect marine operations, are:(a) Its thickness (stage of development);(b) The amount present – concentration, usually esti-
mated according to the tenths or percentage of the sea surface covered by the ice;
(c) The form of the ice, whether it is fast or drift ice and the size of the constituent floes; and
(d) Any movement of the ice.
On a ship or at a coastal station it is obvious that a better view of the ice is obtained if the observation is made from a point as far above the sea as possi-ble. From the bridge of a ship 10 m above the sea, the horizon is about 12 km away and good observations can cover a radius of only 7–8 km. From the top of a coastal lighthouse 100 m above the sea the visual range is almost 40 km and the observation may then cover a radius of 20 km.
Shore locations may provide an ice report several times a day as the ice changes in response to wind and current but the total area of ice being reported is very small. From a ship progressing through the ice, a summary report of the ice encountered during day-time progress may represent an area of the sea ice 15 km wide and 100 km long (assuming a ship’s speed of approximately 5 kt). In some marine areas, such as the Baltic Sea, coastal settlements, lighthouses and ships may be present in sufficient numbers that a reason-able proportion of the ice cover can be reported each day by an organized surface network. In others such as the Gulf of St Lawrence, where the waterways are broad and the shores often unsettled, no shore report-ing system can provide data on more than a very small percentage of the total ice cover. Although surface-based reports can provide excellent detail about the ice, especially its thickness, it is generally recognized that for most areas, the surface reports are not really adequate to describe ice conditions fully.
Reports about the ice cover taken from the air, i.e. heli-copters and fixed-wing aircraft, have the advantage of a much better viewing angle; the platform’s flying speed allows a great deal more of the sea ice to be reported; and problems of remoteness from airports or other suitable landing sites can be overcome by using long-range aircraft. In several countries, ice observers are trained to recognize the various stages of develop-ment of sea ice, to estimate its amount, to note its deformation and the snow cover or stage of decay. All
these data are provided by visual estimatimation and both training and experience are required to make the information reliable.
Comprehensive aerial reporting has its own particular requirements beginning with an accurate navigational system when out of sight of land. Inclement weather – fog, precipitation and low cloud – will restrict or inter-rupt the observations and the usual problems of flying limits at the aircraft base may also be a factor even if the weather over the ice is adequate for observing.
Recent advances in technology are now permitting more precise data to be obtained by aerial observa-tions. SLAR and SAR can provide information, which documents precisely the distribution and nature of the ice in one or two belts along the flight path of the aircraft for distances of up to 100 km on each side. Unlike most other sensors, the radar has the capability of monitoring the ice under nearly all weather condi-tions. It responds mainly to the roughness of the ice surface but the dielectric properties of each ice floe also affect the response.
When no fog or low clouds are present a laser airborne profilometer can be used to measure the height and frequency of ridges on the ice, and under similar conditions an infra-red airborne scanning system can provide excellent information with regard to floe thickness in the ranges below 30 cm.
The advent of earth-orbiting meteorological satellites has added a third, and now the most important and predominant, mode of observing sea ice but again there are some restrictions. The spectral range of the sensors may be visible, infrared, passive or active microwave or a combination of these. Satellite cover-age may be broad at low resolution or cover a narrow swathe at high resolution. In the latter case, data from a particular location may be obtained only at temporal intervals of several days. There is always the problem of rates of data transmission from space and the orbital altitude of the satellite, which affects the range of reception at each receiving station.
In general, most meteorological satellites provide 10–12 passes daily in the polar regions, i.e. complete coverage of polar regions once or twice a day. These satellites provide visible and infrared imagery with resolutions of 250 m–1 km (NOAA AVHRR, METEOR, MODIS, DMSP OLS); and passive microwave and scat-terometer data at coarser resolutions of 6–70 km (AQUA AMSR, NOAA AMSU, DMSP SSM/I, SeaWinds QuikScat). Visible and infrared data do not have cloud-penetrating capability while microwave data are practically cloud independent. Active microwave SAR data (RADARSAT, ENVISAT) are characterized by improved ground resolu-tion (approximately 10–100 m) but a reduced coverage due to narrow swathes and greater revisit time between

6
SEA-ICE INFORMATION SERVICES IN THE wORld
7
exact repeat orbits. Ice services are also awaiting data from new satellites such as Cryosat (altimeter) in 2007 and ALOS (radiometer, SAR) in 2005.
Manual or visual interpretation of imagery from visi-ble and infrared sensors requires a certain amount of skill, for example, a picture element composed of 50 per cent white ice and 50 per cent water will have the same greyness in the visible image as another element in which the whole surface is covered with thin (grey) ice. Snow cover on the ice and puddles on the floes are other complicating factors. Interpretation of SAR images may be even more difficult due to the ambi-guities associated with SAR backscatter from sea-ice features that vary by season and geographic region. Therefore, in recent years automated digital process-ing techniques have been developed to aid in the interpretation of satellite data. Techniques are usually implemented within geographical information systems (GIS) and include automatic and/or interac-tive image georeference, enhancement and various types of image recognition and classification, which are based on data from a single sensor or combination from several ones.
Space-borne sensors can provide precise data on the location and type of ice boundary, concentration or concentration amounts (in tenths or percentages) and the presence or absence of leads, including their characteristics, if radar sensors are used. Less accurate information is provided on the stages of development of the sea ice including the FY/MY ratio, forms, with an indication of whether ice is land-fast or drifting, stages of ice melting and ice surface roughness. Floe motion over approximately 12–24-hour intervals can often be determined through the use of imagery from sequential orbits.
3. INTEGRATEDObSERVATIONALSySTEMS
Any well-designed ice services system must consist of three major components:(a) A surface observation network consisting of in situ
reports and remotely sensed data;(b) A communication system to gather and distribute
the ice information; and (c) A digital data integration, analysis and production
system.
Surface reports from shore stations, ships and drifting buoys provide accurate information on ice amount, thickness, motion and its deformation over rather small areas. When many vessels and fixed observ-ing points are available accurate information can be provided in restricted waterways. Many areas of the Kattegat and Baltic Sea coastline fall into this category
and landline facilities are available for the relay of these reports to national or regional centres.
When waterways are more open or more remote from populated areas, either satellite data or aerial obser-vations must be integrated into the system. Aerial data are normally prepared by the observers in map format as they fly along the prescribed track. An air-to-ship communication line is needed to pass the data directly to vessels in the area. This may be merely a voice channel, a radio facsimile broadcast or a digital network link, which enables radar data or the ice chart itself to be passed to the ships. In most cases, these data are also passed to the ice centre for integration into regional-scale analysis products.
Satellite data are typically passed in real-time (less than six hours) from satellite ground stations to the ice centres via high-speed communication links. Visible, infrared, passive microwave, SAR data are then digitally processed, integrated with meteoro-logical guidance products and ice model output and then analysed by computer, typically using GIS. Image enhancement techniques and various other automated algorithms are often employed in the production of an ice analysis. Ice analyses are produced as charts at varying scales (typically rang-ing up to 1:2,500,000) depending on the size of the area and the level of detail required. The ice charts are made available as data coverages in GIS formats and/or as simple electronic charts in such graphic formats as GIF or PNG, which can be viewed with almost any web browser or graphics viewer. Charts are typically labelled and coloured using the WMO international sea-ice symbology (WMO-No. 259) and Ice Chart Colour Code Standard (WMO-TD-No. 1214). Other ice analysis products include annotated satellite imagery, usually in JPEG and TIFF formats, text messages and electronic charts.
4. ICEINFORMATIONSERVICES
Once the observational material from all sources has been combined into an ice chart which represents exist-ing conditions the ice centre then has the task of relaying the chart to users while it is still timely. The ice data can also be combined with meteorological and ocea-nographic parameters in a prediction model to provide further guidance to vessels in or near the ice.
Relay of charts of existing ice conditions is mostly conducted by radio facsimile or in recent times via a digital network link. Time slots and schedules usually dictate the scale and number of charts provided by the broadcast station in the area of concern. Direct broadcast by the ice centre is obviously ideal but not always feasible.

7
PART 1
Forecasts of ice conditions are difficult to prepare for, besides the drift caused by the wind, the floes are also affected both by residual and tidal currents. The results are complicated, and knowledge of the detail of oceanographic factors is not often available. In some cases the wind drift alone is specified and it is left to individual ships’ captains to interpret this in relation to their own position. Recent advances in computer models for ice prediction are allowing more detailed data to be provided (as in the case of the gulfs of Bothnia and Finland – for example) but these require further facsimile or digital network transmission time, which may not be available.
Usually, ice forecasts are prepared once a day for a period of 24 to 144 hours because they are tied to the frequency of the data input. These are tactical fore-casts, for scheduled radio broadcast to ships which may provide advice on difficult ice conditions form-ing or dissipating, the general motion of the pack, opening and closing of leads, etc. They are strongly influenced by meteorological prediction and should always be used in concert with the weather forecast.
Other longer-range predictions – those covering peri-ods from 7–10 days to 30 days and seasonal predictions – are usually based on climatological and analogue methods. They are more commonly distributed by ground or electronic mail to shipping companies and agents rather than to individual ships.
After the ice data have been processed operationally and used in relation to the existing marine traffic, they can then be passed to a climatological unit of the ice service which compiles and analyses them in relation to averages, and which prepares atlases to be consulted by planners, marine architects and others who deal with longer-term aspects of the ice condi-tions and their effect on human activities.
5. INTERNATIONALCOOPERATION
In some areas of the world a regional approach to ice services is far more economical and efficient than one based solely on national facilities. For example, in North America, a joint service involving the USA and Canada has been adopted as the best method of supporting winter shipping in the Great Lakes. Starting in December 2004, the Canadian Ice Service and the US National Ice Center started jointly produc-ing ice charts, ice hazard bulletins, 30-day forecasts and seasonal outlooks for the Great Lakes under the banner of the North American Ice Service (NAIS). The workload and the data sources for these products are shared between the stated two services. In the coming years, this practice will be extended to encompass all of the ice-covered waters of North America. The similar Baltic Sea Ice Services (BSIS) is under steady
development and includes informational exchange between Denmark, Estonia, Germany, Finland, Latvia, Lithuania, the Netherlands, Norway, Poland, the Russian Federation and Sweden. A common numeri-cal ice-reporting code (the Baltic Sea Ice Code), sea-ice charts (international sea-ice symbols), integrated data broadcasts in clear English and similar shipping control regulations are used. In Finland and Sweden icebreaker assistance is integrated in the Gulf of Bothnia. In special situations, such as when the Baltic Sea is totally ice covered, all icebreaker assistance in the Baltic Sea is integrated, with the common aim of supporting marine traffic. This is done under the development of BIM (Baltic Icebreaking Management), which is the cooperation body of the Baltic Sea icebreaking organizations. The Global Monitoring for Environment and Security (GMES)’s, ICEMON and Northern View projects (http://earth.esa.int/gmes/) include partners from federal services as well as from research and industrial communities and are aimed at the implementation of a coherent operational ocea-nography system for the high latitudes, consisting of sea ice, meteorological and oceanographic services.
On a larger scale the WMO/IOC JCOMM Expert Team on Sea Ice (ETSI) has been instrumental in developing an internationally accepted terminology, formats to exchange operational and archived data on sea ice and other guidance material. To this effect the ETSI also collaborates with other international sea-ice groups – the International Ice Charting Working Group (IICWG) and the Baltic Sea Ice Meeting (BSIM).
The international sea-ice terminology including an illustrated glossary and a set of chart symbols was developed and first published in 1971 in English, French, Russian and Spanish (WMO Sea-Ice Nomenclature, WMO-No. 259) with later additions and corrections introduced in 2004. From November 2004 an electronic version of the nomenclature (prede-fined English, French, Russian and Spanish versions in alphabetic/subject order, equivalents, WMO/XML-style, search/selection option), is available at (http://www.aari.nw.ru/gdsidb/XML/nomenclature.asp). A set of formats was designed for the archive mode sea-ice information exchange (SIGRID, WMO 1989, SIGRID-2, WMO 1994).
In cooperation with IICWG, two JCOMM Technical Report Series documents – SIGRID-3: A Vector Archive Format for Sea-Ice Charts (WMO/TD-No. 1214) and Ice Chart Colour Code Standard (WMO/TD-No. 1214) were prepared and issued in 2004. Both documents are avail-able as hard copy by request from the WMO Secretariat or in electronic form from the JCOMM publication web page (http://www.wmo.ch/web/aom/marprog/).
Until the 1980s, most ice services were directed towards shipping and offshore exploration. As a

8
SEA-ICE INFORMATION SERVICES IN THE wORld
9
result, the needs were very specific but national or regional in nearly every case. With more inter-est and study being directed towards the world’s climate in recent years, there is a growing need for international data exchange for use by meteorologi-cal and oceanographic researchers. This required the creation of data banks at a coarser scale than in operational services. Within the WMO project, Global Digital Sea Ice Data Bank (GDSIDB), which started in 1989, historical sea-ice information for the major part of the 20th century was archived in electronic form due to collaborative efforts of several ice services, institutions and data centres (from Argentina, China, Canada, Denmark, Finland, Japan, the Russian Federation, Sweden and the USA). Presently, the GDSIDB has two archiving centres,
located at the Arctic and Antarctic Research Institute, St Petersburg, Russian Federation (http://www.aari.nw.ru/gdsidb) and the National Snow and Ice Data Center, Boulder, USA (http://nsidc.org/noaa/gdsidb) and holds 7- or 10-day-period mapped ice data for the Arctic starting from March 1950 and for the Antarctic from January 1973 and to near the present for both regions. From 1970s GDSIDB ice charts may serve as a ground-truth to SSM/I products or be the unique source of data on ice conditions and climate for before 1978. During 2002–2003 the first blend-ing technique for Northern Hemisphere GDSIDB charts was developed and the resulting blended data set presently contains the greatest amount of ice data for 1950–1998. The product is scheduled to be extended as new data become available.

9
NORTHERN HEMISPHERE
NORTH AND NORTH-EAST ASIA AND NORTH EUROPE
CHINA1. OrganizationThe national ice service is provided by the National Marine Environment Forecast Centre (NMEFC), State Ocean Administration (SOA). Major users of the serv-ices are the China Offshore Oil Bohai Corporation (COOBC) and coastal and harbour activities. In the period from December to March, ice observation and forecasting services are provided for the Bohai Sea and the northern Yellow Sea. The ice services for local operations and specific tasks are provided by the Group of Sea Ice Management (GSIM) of the COOBC. An ice forecasting service is also provided by the Qingdao Marine Forecasting Observatory (QMFO) of SOA.
2. DataacquisitionSea-ice type, thickness, concentration and tempera-ture are operationally measured according to “The Specification for Offshore Observations” (GB/T 14914-94, SOA) at 11 coastal stations along the Bohai Sea and the northern Yellow Sea. Icebreakers are used by the Navy and COOBC for operational observa-tions of sea-ice edge, thickness and type according to “The Specification for Oceanographic Survey” (GB/T 12763-91, SOA) and for special surveys. Ice condition reports are also provided by SOA patrol ships. The ice temperature, thickness and type are obtained from aerial remote sensing and the aerial survey of sea ice is provided as one of the operational observations during January to February.
The North Sea Branch (Qingdao) of SOA manages the operation of a dedicated aircraft equipped for ice reconnaissance missions in the Liaodong Gulf, Bohai Gulf, Laizhou Bay and in the shore of northern Yellow Sea. The helicopter reconnaissance flight is managed by the COOBC for special missions. Radar imagery from Bayuquan station of SOA and real-time ice data at the platform JZ-20-2 (40°27’N, 121°17’E) in the Liaodong Gulf are provided daily. The visible and infrared satellite imagery from NOAA (AVHRR) and the MODIS imagery from both satellites of the EOS series (TERRA and AQUA) are received by the NMEFC. The MODIS imagery has been applied in
sea-ice operational monitoring and numerical sea-ice forecasting for the Bohai Sea since the winter of 2002; the precision of sea-ice monitoring has been improved with its high resolution.
3. Outputproducts(a) Chart output
A remote sensing image, showing sea-ice condi-tions in the Bohai Sea, is transmitted daily by e-mail or facsimile to each user (Figure II-1, Annex II). An analysed chart of ice thickness, area and edge at the same scale is prepared daily and transmitted by the NMEFC (Figure II-2, Annex II). The fifth-day sea-ice thickness and concentration forecast charts (Figure II-3 and Figure II-4, Annex II), with the PIC ice model, and the forecast of ice drift (arrow) and thickness (isoline) by the opera-tional ice mode (Figure II-5, Annex II), covering the Bohai Sea, are prepared daily by the NMEFC and transmitted by e-mail or facsimile to COOBC, shipping companies and other users.
(b) Coded outputForecasted fields of ice concentration, thickness and velocity at grid points in tenths of degrees of latitude and longitude, at 12-hour intervals up to 120-hour and analysed fields are transmitted daily by computer network.
(c) Plain language(i) Plain-language ice information with images
and a 10-day outlook of ice conditions in the Bohai Sea and the northern Yellow Sea are prepared by the NMEFC and are disseminated by closed-circuit television and radio every 10 days during winter.
(ii) A long-range outlook for the next winter is prepared and mailed. It is also transmitted by facsimile in October from the NMEFC.
(iii) A 10-day forecast and an outlook up to one month are mailed and transmitted by facsimile for each 10-day and month period from the NMEFC and QMFO respectively.
(iv) A Sea-Ice Management Brief Report includ-ing sea-ice conditions, forecasts of ice and weather for the next week, information about sea-ice monitoring and forecast-ing, as well as suggestion to coastal and offshore operations is prepared by GSIM, and mailed and transmitted by facsimile weekly.
PART II
REGIONALANDNATIONALPRACTICES

SEA-ICE INFORMATION SERVICES IN THE wORld
10 11
4. Forecasts
Numerical sea-ice forecasts for up to five days ahead for the Bohai Sea are prepared daily by the NMEFC using a PIC ice model with fine resolution and a thermo-dynamic-dynamic operational ice model at the same time. The forecast products contain fields of ice thick-ness, concentration and velocity, ice edge, parameters of ice ridge and local estimates of ice thickness and tracks of ice floes near drilling platforms.
The 10-day and the 30-day forecasts are prepared using statistical methods to determine ice edge, and mean and maximum of ice thickness in the Liaodong Gulf, Bohai Gulf, Laizhou Bay and northern Yellow Sea by the NMEFC and QMFO/SOA.
The long-range seasonal outlook is prepared using statis-tical methods to estimate the ice conditions of the Bohai Sea and the northern Yellow Sea the following winter.
5. PublicationsThe China Ocean Annuals, China Marine Environment Annual Report and China Marine Disaster Bulletin (all in Chinese) are annually prepared by SOA. These publications include sea-ice conditions, disasters and activities about sea ice for the year.
6. MailingandInternetaddressesMailing addresses
National Marine Environment Forecast Centre (NMEFC)8 Dahuisi RdHaidian DistrictBeijing, 100081ChinaTelephone: +86 010 62105750Telefax: +86 010 62173620E-mail: [email protected] (Dr Shan Bai)
Qingdao Marine Forecasting Observatory of SOA22 Fushun RoadQingdao, 266033ChinaTelephone: +86 0532 5611238Telefax: +86 0532 5644944E-mail: [email protected] (Dr Mingke Guo)
Group of Sea Ice Managementc/o General Dispatch OfficeChina Offshore Oil Bohai CorporationP.O. Box 501 TangguTianjin, 300452ChinaTelephone: +86 022 25800730Telefax: +86 022 25807504E-mail: [email protected] (Dr Wei Wang)
Internet addresses
NMEFC: http://www.nmefc.gov.cn
JAPAN1. OrganizationSea-ice information services in Japan are provided by two governmental agencies: the Japan Meteorological Agency (JMA) and the Japan Coast Guard (JCG), mainly for fishing, shipping and coastal and harbour activities.
2. DataacquisitionSea ice in the Sea of Okhotsk is formed in November and melts away and disappears in July. Sea ice is at its maximum extent from late February to early March.
Five weather stations of the JMA and seven coast guard stations of the JCG conduct daily visual observations of the amount and the condition of the sea ice. Patrol vessels of the JCG routinely report the sea-ice condi-tions, including types of sea ice, concentration, ice thickness and difficulties of navigation. The JMA and JCG exchange their sea-ice data by telefax and dissem-inate derived products to users.
Aerial observations are carried out around 10 times per year by the JMA in cooperation with the Japan Defense Agency (JDA) and about 10 times per year by JCG aerial observations. Both aerial observation data are used for sea-ice analysis at the JMA and JCG.
The JMA conducts satellite data analysis for sea-ice extent in the Sea of Okhotsk every day in winter using visible and infrared images of the MTSAT, NOAA-17 and NOAA-18 and microwave data of the Special Sensor Microwave/Imager (SSM/I) from the United States Defense Meteorological Satellite Program (DMSP) and the Advanced Microwave Scanning Radiometer (AMSR-E) from Aqua. Since March 2003, synthetic aperture radar (SAR) data from RADARSAT have also been used.
3. Outputproducts(a) Sea-ice condition charts (Figure VII-1, Annex VII)
issued by the JMA are broadcast by meteorological radio facsimile on short wave (call sign: JMH) twice a week (on Tuesday and Friday) from December to May. The charts cover the Sea of Okhotsk, the northern part of the Sea of Japan including Peter the Great Bay, the northern part of the Yellow Sea, the Bo Hai, and the vicinity of Hokkaido, the Kuril Islands and the Kamchatka Peninsula. The charts show sea-ice edges, four classes of sea-ice concentration with a description of sea-ice condi-tions and one-week forecasts in both Japanese and English.

PART II
11
(b) Numerical sea-ice forecast charts, which show the distribution and concentration of sea ice for two and seven days ahead (Figure VII-2, Annex VII), are also broadcast by the JMH twice a week (on Wednesday and Saturday) when the southern edge of sea-ice extent in the Sea of Okhotsk is located south of 48°N. The forecast charts are objectively derived by a numerical sea-ice model, in which the physi-cal processes of sea-ice formation/melting and drift of sea ice due to wind and ocean currents are considered.
(c) The Ice Information Center of the First Regional Coast Guard Headquarters of the JCG also dissemi-nates the daily sea-ice charts around Hokkaido via the Internet (http://www1.kaiho.mlit.go.jp/KAN1/ice_center/ice_center-e.html) in Japanese, English and Russian.
4. Publications(a) The Results of Sea-Ice Observations: an annual
publication of the JMA, which contains the results of the daily visual observations by five weather stations of the JMA, the annual summary of sea-ice conditions with five-day sea-ice charts in the Sea of Okhotsk and five-day sea-ice charts in the polar regions; published on CD-ROM every October.
(b) Kaiyou Gaihou – Kaihyou hen: an annual publication of the First Regional Coast Guard Headquarters of the JCG, which contains the annual summary of observations by seven coast guard stations, patrol vessels and aircraft; published in printed matter (in Japanese).
5. MailingandInternetaddressesMailing address
Office of Marine PredictionGlobal Environment and Marine DepartmentJapan Meteorological Agency (JMA)1-3-4 Otemachi, Chiyoda-kuTokyo, 100-8122Japan
Telephone: +81-3-3212-8341(ext. 5156)Telefax: +81-3-3211-3047E-mail: [email protected]
Japan Coast Guard (JCG)5-3 Minato-machi, Otaru-shiHokkaido, 047-8560 Japan
Telephone: +81-134-27-0118Telefax: +81-134-27-6190Telefax: +81 134-32-9301 (polling mode, Otaru)Telefax: +81 1582-4-5689 (polling mode, Monbetsu)E-mail: [email protected]
Internet addresses
JMA: http://www.data.kishou.go.jp/kaiyou/db/seaice/information.html (in Japanese)JCG, Ice Information Center: http://www1.kaiho.mlit.go.jp/KAN1/ice_center/ice_ center-e.html (Japanese, English and Russian)
RUSSIANFEDERATION1. OrganizationSea-ice information services in the Russian Federation are provided by the Centre for Ice Hydrometeorological Information at the Arctic and Antarctic Research Institute in St Petersburg (AARI), the Hydrometeorological Centre in Moscow (Hydrometcentre) and local hydrometeoro-logical offices in the Arctic, Far-Eastern Russia, Baltic, Black and Caspian seas; all belonging to the Russian Federal Hydrometeorological Service (Roshydromet). AARI provides centralized services mainly for shipping and coastal and harbour activities within the Northen Sea Route, for the Central Arctic Basin and Arctic seas – Greenland, Kara, Laptevs, Eastern-Siberian, Chukha as well as for the seas with the seasonal ice cover – Baltic, White, Bering, Okhotsk, Caspian and also Antarctic seas.
2. DataacquisitionCoastal weather polar stations of Roshydromet make daily visual and instrumental ice observations on sea-ice concentration and stages of ice development, ice thickness, forms of ice, ice drift and other phenom-ena. Icebreakers routinely report the same mentioned main ice parameters plus parameters describing ice navigation.
Before 1994 aircraft ice reconnaissance flights were conducted in the Arctic usually on a monthly basis from November to April and on a 10-day internal during the summer navigation period. Since 1995 aircraft ice reconnaissance flights have been conducted only occasionally during tailored hydrometeorological support of applied and scientific activities. The scope of ice information collected during air-ice reconnaissance includes visual observations both on main ice param-eters (mentioned above excluding thickness and ice drift) as well as discontinuities in sea-ice cover (leads, cracks, etc.) and various surface parameters (hummocks, ridges, snow, contamination, stages of melting, etc.). Collected data are fixed onboard by ice observers in log-books and in mapped form and further are used for sea-ice analysis onboard expeditionary vessels, at AARI and local meteorological offices.
The AARI satellite reception station provides visible and infrared satellite images both from American (NOAA HRPT, EOS TERRA) and Russian (METEOR, OKEAN)

SEA-ICE INFORMATION SERVICES IN THE wORld
12 13
satellites. OKEAN-series satellites also provide SLAR and passive microwave sounding data. All data are further processed within an ice information system, including GIS software and utilized for regional and pan-Arctic sea-ice analysis by AARI. Sample products received at AARI and station reception images are available via the AARI web page.
AARI, Hydrometcentre and the local meteorological offices of the Roshydromet exchange described sea-ice data by facsimile, telex, Inmarsat, Global Star, Iridium and the Internet and disseminate derived products to users. In cases where the AARI operational centre lacks initial data to compile an ice map for a specific area, the necessary information is requested and if available, is obtained within several hours via communicational relays.
For the Baltic Sea ice services, the Russian Federation is represented by the group of marine ice forecasts from the St Petersburg Hydrometcentre of the Northwestern Department of the Hydrometeorological Service (NW Hydromet). The principal information product during the winter season being the daily detailed ice chart for the Gulf of Finland.
3. Outputproducts(a) General sea-ice conditions charts of the Arctic are
available weekly via the AARI web page for public use. Charts depict drifting and fast ice bounda-ries and five classes of sea-ice concentration in the summer period or stages of development in the winter period and are available in graphic GIF format and in digital WMO SIGRID format. A sample sea-ice conditions charts for the Arctic is presented in Figure X-1, Annex X.
(b) Detailed regional sea-ice conditions and forecast charts and coastal sea-ice information in plain language are prepared routinely on weekly or shorter scales and on request by AARI and the local meteorological offices of Rosgydromet and are disseminated via various telecommunication means to captains, shipping companies, local authorities, news media and other users requesting tailored support. Also supplied is a description of sea-ice phenomena and movements. Informational products are relayed to the users both in textual and graphic formats such as GIF or JPEG images and in binary formats such as ARC/INFO export format e00, open format shapefile or S-57 format for electronic nautical charts. Detailed regional sea-ice charts in national coding are also avail-able at monthly intervals via the AARI web site. A sample detailed ice chart for the East Siberian Sea is presented in Figure X-2, Annex X.
(c) Common usage numerical forecast charts of mean daily drift of sea ice, currents and level elevation, winds and wave height (for open water areas) in the Arctic Ocean for six days in advance are
available weekly on the AARI web page for public use. Forecast charts are prepared routinely on the basis of the output from thermo-dynamic and dynamic sea-ice models run at AARI. Sample sea-ice forecast charts for sea-ice drift are presented in figures X-3a and X-3b, Annex X.
(d) Detailed regional sea-ice conditions charts are prepared by AARI at the 7–10 days scale for the Antarctic region to provide tailored support for national activities in the region. A sample chart is given in Figure X-4, Annex X, for the Indian Ocean sector of the Antarctic.
(e) From winter 2002 AARI started to compile weekly ice conditions charts for the Gulf of Finland, Caspian, Okhotsk, Bering seas and the Tatar Strait. A sample charts for the Sea of Okhotsk and the Tatar Strait is presented in Figure X-5, Annex X and for the Caspian Sea together with an anno-tated visible imagery mosaic from MODIS EOS Terra in Figure X-6, Annex X.
(f) Daily sea-ice conditions charts for the Gulf of Finland are compiled by the Hydrometeorological centre in St Petersburg; a sample chart is presented in Figure X-7, Annex X.
4. PublicationsThe following publications are issued by AARI at different periods:
(a) Trudi AANII (AARI Transactions): two to three volumes are published per year;
(b) Problemi Arktiki i Antarktiki (Problems of the Arctic and Antarctic): one to two volumes are published per year;
(c) The quarterly bulletin State of the Antarctic Environment (in Russian and English);
(d) Express information, informational bulletins of the Russian Antarctic expedition, monographs etc.
5. MailingandInternetaddressesMailing addresses
Arctic and Antarctic Research Institute (AARI)Bering Str., 38199397, St PetersburgRussian Federation
Telephone: +7 (812) 352-1520Telefax: +7 (812) 352-2688E-mail: [email protected], [email protected]
Hydrometeorological Research Centre (Hydrometcentre of the Russian Federation)B. Predtechensky per., 11–13123242, MoscowRussian Federation
Telephone: + 7 (095) 252-3448Telefax: +7 (095) 255-1582E-mail: [email protected]

PART II
13
Northwestern Department of Hydrometeorological Service (NW Hydromet)Hydrometeorological Centre of St Petersburg23 Liniya V.O., 2a199106, St PetersburgRussian Federation
Telephone/Telefax: +7 (812) 321-3018.E-mail: [email protected]
Primorsky Directorate of Hydrometeorological Service (Primpogoda)Mordovtseva Str., 3690950, VladivostokRussian Federation
Telephone: +7 (4232) 204974Telefax: +7 (4232) 221750E-mail: [email protected]
Far Eastern Regional Hydrometeorological Research Institute (FERHRI)Fontannaya Str., 24690600, VladivostokRussian Federation
Telephone: +7 (4232) 26-97-88 Telefax: +7 (4232) 22-77-54 E-mail: [email protected]
Internet addresses
AARI:http://www.aari.nw.ru (main page)http://www.aari.nw.ru/clgmi/sea_charts/sea_charts_en.html (weekly ice charts)http://www.aari.nw.ru/clgmi/sea_charts/north/a_seas_e.asp (weekly detailed ice charts)http://www.aari.nw.ru/clgmi/forecast/fc_2.html (fore-cast ice charts)http://www.aari.nw.ru/clgmi/meteo/sinop/sin.htm (Eurasian Arctic synoptic bulletin)
Hydrometcentre of Russia: http://hmc.hydromet.ru/ NW Hydromet: http://adm.meteo.nw.ru Primpogoda: http://www.primpogoda.ru FERHRI: http://www.hydromet.com
NORTH-EAST ATLANTIC AND BALTIC SEA AREAS
DENMARK
Two government institutions in Denmark issue sea-ice information:
(a) The Admiral Danish Fleet is responsible for the Danish Icebreaking Service and ice information for the Danish waters.
(b) The Danish Meteorological Institute is responsi-ble for sea-ice monitoring and information for the Greenland waters.
I. DANISHICESERVICE
1. OrganizationThe Danish Ice Service was transferred from the Danish Ministry of Commerce to the Danish Ministry of Defence in January 1996 and is now operated by Admiral Danish Fleet HQ situated in Aarhus. The Danish Ice Service consists of two parts: the ice reporting and the icebreaking services respectively. The Danish Ice Service assists navigation in Danish waters and harbours. The Danish Ice Service has three icebreakers and some icebreaking tugs at its disposal for icebreaking purposes. The icebreaking service collaborates closely with the German, Swedish and Finnish icebreaking services and all ships entering the area are subject to the same regulations concerning icebreaker assistance in all the countries. The Danish Ice-reporting Service distributes ice information daily (in English and Danish) by the Lyngby coastal radio station. The information contains a short review of the ice and navigational conditions in Danish domestic waters.
2. DataacquisitionVisual surface observations are reported daily from approximately 125 ice observers, who report the ice conditions for around 230 different sections in Danish domestic waters. Typically, visual surface observations are received from harbour authorities, some ferries and all the ships of the Danish Navy including the Danish icebreakers. Satellite images or dedicated flight recon-naissance are not used. Observers report information concerning ice concentration, thickness, type and navi-gational conditions daily to Admiral Danish Fleet HQ.
3. Outputproducts(a) Coded information
Observer-reported information is issued daily at noon on the Admiral Danish Fleet homepage, in the Baltic Sea Ice Code, on the Internet. Coded sea-ice information from 48 areas in Danish waters is issued once a day in the Baltic Code and is distributed by the Lyngby coastal radio station by radiotelephony and radiotelegraphy. Coded sea-ice information is also issued to all other Baltic Sea countries daily by e-mail, telex or telefax. The specific waterways are identified by an alphanumeric code; eight districts of six areas each. Compiled ice charts (Figure III-1, Annex III) are mailed as a weekly (or daily) annex to the Danish ice bulletin.
(b) Plain language information Sea ice reports: a description of the ice conditions at sea, operational areas for icebreakers – issued in Danish and English once a day – are transmitted
SEA-ICE INFORMATION SERVICES IN THE wORld
14 15
nationwide via Denmark Radio and the Lyngby coastal radio station. Sea-ice reports are also trans-mitted via e-mail, telex or telefax to Baltic Sea countries once a day.
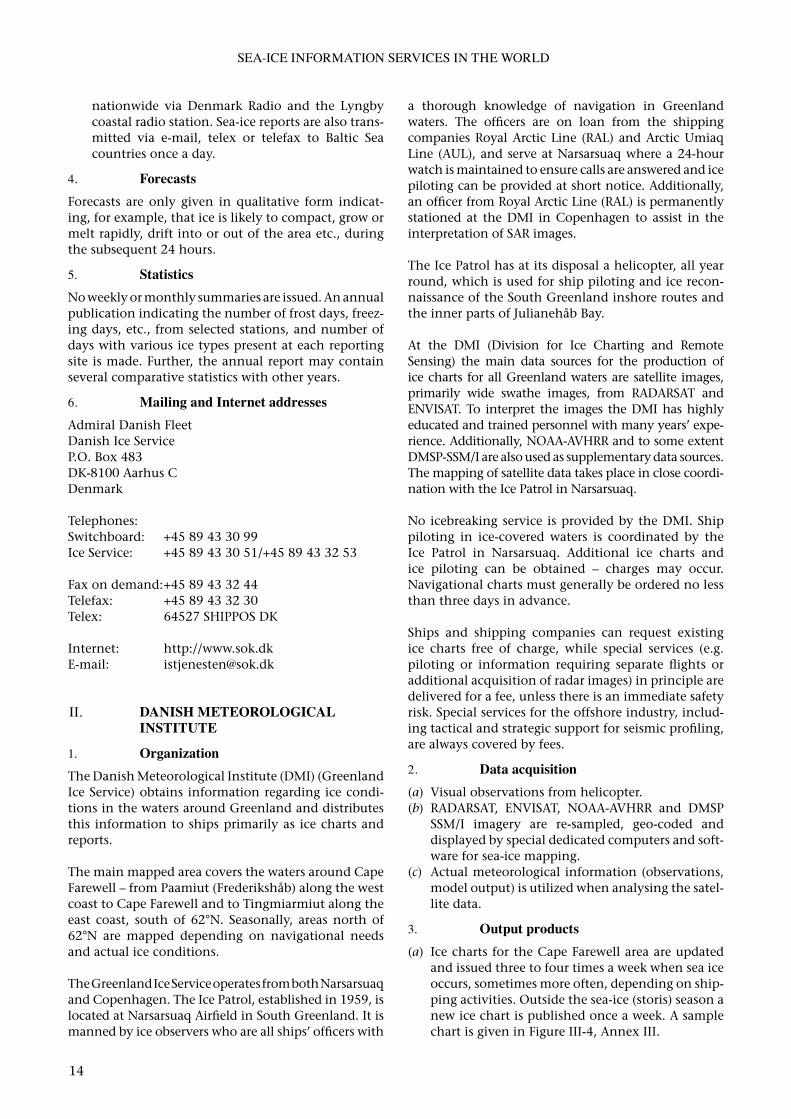
4. ForecastsForecasts are only given in qualitative form indicat-ing, for example, that ice is likely to compact, grow or melt rapidly, drift into or out of the area etc., during the subsequent 24 hours.
5. StatisticsNo weekly or monthly summaries are issued. An annual publication indicating the number of frost days, freez-ing days, etc., from selected stations, and number of days with various ice types present at each reporting site is made. Further, the annual report may contain several comparative statistics with other years.
6. MailingandInternetaddressesAdmiral Danish FleetDanish Ice ServiceP.O. Box 483DK-8100 Aarhus CDenmark
Telephones: Switchboard: +45 89 43 30 99Ice Service: +45 89 43 30 51/+45 89 43 32 53
Fax on demand: +45 89 43 32 44Telefax: +45 89 43 32 30Telex: 64527 SHIPPOS DK
Internet: http://www.sok.dkE-mail: [email protected]
II. DANISHMETEOROLOGICALINSTITUTE
1. OrganizationThe Danish Meteorological Institute (DMI) (Greenland Ice Service) obtains information regarding ice condi-tions in the waters around Greenland and distributes this information to ships primarily as ice charts and reports.
The main mapped area covers the waters around Cape Farewell – from Paamiut (Frederikshåb) along the west coast to Cape Farewell and to Tingmiarmiut along the east coast, south of 62°N. Seasonally, areas north of 62°N are mapped depending on navigational needs and actual ice conditions.
The Greenland Ice Service operates from both Narsarsuaq and Copenhagen. The Ice Patrol, established in 1959, is located at Narsarsuaq Airfield in South Greenland. It is manned by ice observers who are all ships’ officers with
a thorough knowledge of navigation in Greenland waters. The officers are on loan from the shipping companies Royal Arctic Line (RAL) and Arctic Umiaq Line (AUL), and serve at Narsarsuaq where a 24-hour watch is maintained to ensure calls are answered and ice piloting can be provided at short notice. Additionally, an officer from Royal Arctic Line (RAL) is permanently stationed at the DMI in Copenhagen to assist in the interpretation of SAR images.
The Ice Patrol has at its disposal a helicopter, all year round, which is used for ship piloting and ice recon-naissance of the South Greenland inshore routes and the inner parts of Julianehåb Bay.
At the DMI (Division for Ice Charting and Remote Sensing) the main data sources for the production of ice charts for all Greenland waters are satellite images, primarily wide swathe images, from RADARSAT and ENVISAT. To interpret the images the DMI has highly educated and trained personnel with many years’ expe-rience. Additionally, NOAA-AVHRR and to some extent DMSP-SSM/I are also used as supplementary data sources. The mapping of satellite data takes place in close coordi-nation with the Ice Patrol in Narsarsuaq.
No icebreaking service is provided by the DMI. Ship piloting in ice-covered waters is coordinated by the Ice Patrol in Narsarsuaq. Additional ice charts and ice piloting can be obtained – charges may occur. Navigational charts must generally be ordered no less than three days in advance.
Ships and shipping companies can request existing ice charts free of charge, while special services (e.g. piloting or information requiring separate flights or additional acquisition of radar images) in principle are delivered for a fee, unless there is an immediate safety risk. Special services for the offshore industry, includ-ing tactical and strategic support for seismic profiling, are always covered by fees.
2. Dataacquisition(a) Visual observations from helicopter.(b) RADARSAT, ENVISAT, NOAA-AVHRR and DMSP
SSM/I imagery are re-sampled, geo-coded and displayed by special dedicated computers and soft-ware for sea-ice mapping.
(c) Actual meteorological information (observations, model output) is utilized when analysing the satel-lite data.
3. Outputproducts(a) Ice charts for the Cape Farewell area are updated
and issued three to four times a week when sea ice occurs, sometimes more often, depending on ship-ping activities. Outside the sea-ice (storis) season a new ice chart is published once a week. A sample chart is given in Figure III-4, Annex III.

PART II
15
(b) Ice charts, primarily based on RADARSAT, ENVISAT and NOAA-AVHRR, for other areas in Greenland, are produced one to six times a week depending on the actual ice situation and navigational needs (see Figure III-3, Annex III).
(c) Ice reconnaissance via helicopter takes place to generate reports of the ice conditions in South Greenland, as a minimum once a week.
(d) A weekly summary chart for all Greenland waters is published once a week (see Figure III-2, Annex III).
(e) Ice charts follow international standards (egg code) and are published by telefax, INMARSAT, facsimile and Internet. Further, ice information is broadcast by radio, radio links, telex, telephone and e-mail.
4. ForecastsNo forecasts are given.
5. PublicationsNo weekly or monthly summaries are prepared.
6. MailingandInternetaddressesDanmarks Meteorologiske InstitutLyngbyvej 100DK-2100 CopenhagenDenmark
Telephone: +45 39 15 73 40Telefax: +45 39 15 73 00E-mail: [email protected] Internet: http://www.dmi.dk (DMI main web site)Internet: http://www.dmi.dk/dmi/index/gron-land/iskort.htm (ice charts)
Iscentralen NarsarsuaqPostboks 403923 NarsarsuaqGreenland
E-mail: [email protected]: http://iserit.greennet.gl/isc/ice/ (ice charts)
ESTONIA1. OrganizationThe Estonian Meteorological and Hydrological Institute (EMHI) is responsible for the sea-ice information service in Estonia. The service is, in particular, intended to meet the needs of international and Estonian shipping services. Service is also given to all other activities, where sea-ice information is required: fisheries, coastal and harbour activities, meteorological forecasting and climatology.
The ice service in the Baltic begins at the end of October, when ice starts to form, and lasts until the end of May.
2. Dataacquisition
Daily ice information is reported in Baltic Sea Ice Code, from 16 stations, which are situated along the Estonian coast.
In addition to the daily coded information, each station sends some information about the thickness of fast ice with the depth and density of snow cover on it. Most observations are visual.
All meteorological information, such as observa-tions, weather charts, forecasts, are received from the weather service of the EMHI.
Ice information in Baltic Sea Ice Code is received daily via the Global Telecommunications System (GTS) from Finland, Germany, Norway, Poland, Sweden, Latvia, Lithuania and Russia. Ice charts are received by facsimile from Finland and by e-mail from Germany, Sweden, Poland and Russia.
3. Outputproducts(a) Ice charts
The ice bulletin/chart covers the Gulf of Finland, Gulf of Riga, the Irben Strait and the northern part of the Baltic proper. The actual chart contains ice information and sea-surface isotherms of wave height. The symbology used on actual charts is common for all countries around the Baltic Sea and is printed on the chart.
(b) Coded informationA complete listing of Estonian areas in Baltic Sea Ice Code is issued daily and sent by the GTS to Riga.
(c) Plain language information(i) The sea-ice bulletin: a description of the
ice situation at sea and restrictions to navi-gation is issued in Estonian and English and sent daily by fax to Sweden, Latvia, Lithuania and Russia;
(ii) Ice reports, ice charts and ice forecasts are distributed daily by fax or e-mail to users (approximately 20);
(iii) Similar sea-ice bulletins (as in item (i)) are issued in Estonian once a day by Estonian Radio.
A sample ice chart is in given in Annex IV.
4. ForecastsandforecastmethodsAn ice forecast is published daily in the printed sea-ice bulletin. The forecast describes in general terms the expected ice development such as ice drifting, open-ing of leads, areas with ice pressure, ice formation or melting.
An ice information forecast includes: date of ice forma-tion, freeze-over, break-up and ice disappearance up to

SEA-ICE INFORMATION SERVICES IN THE wORld
16 17
30 days in advance. The predictions are produced by statistical methods.
5. PublicationsTables of sea-ice observations from shore stations are prepared as internal reports of EMHI, but not published.
6. MailingaddressEstonian Meteorological and Hydrological Institute (EMHI)(Eesti Meteoroloogia ja Hüdroloogia Instituut)Toompuiestee 24, 10149 TallinnEstonia
Telephone: +372 6660-914Telefax: +372 6660-911E-mail: [email protected] Internet: http://www.emhi.ee/
FINLAND1. OrganizationThe Finnish Institute of Marine Research (FIMR) is responsible for the sea-ice information service in Finland. The operational service started in 1915. The service is intended to meet the needs of national and international shipping as well as other activities where sea-ice information is required, in particular fisheries, coastal and harbour activities, forecasting and clima-tology. The ice season in the Baltic normally begins at the end of October, when ice starts to form in the northernmost archipelagoes of the Bay of Bothnia and lasts until the end of May or beginning of June. Sea surface temperature (SST) charts are published between mid-October and the end of ice season.
2. Dataacquisition(a) Sea ice
Ground truth input data: Finnish and Swedish icebreaker reports several times a day in plain language; daily or weekly coastal station reports from 20–30 stations in plain language; ice charts over observation areas and ice and snow thick-ness profiles; daily or weekly reports from ships in plain language.
Space-borne: all NOAA AVHRR passes in 1.1-km resolution; about 120 RADARSAT ScanSARWide screens per winter in 100-m resolution, and 100–200 ENVISAT ASAR images. MODIS data are in experimental use.
(b) Sea surface temperaturesGround truth input data: twice a week meas-urements from 10 coastal stations; automatic stations, icebreakers; 20–30 merchant vessels with
hull thermometers measuring along tracks cover-ing the Baltic Sea.
Air-borne input data: annually 20–30 reconnais-sance flights by fixed-wind planes with infrared soundings along the track.
Space-borne input data: NOAA AVHRR.
3. Outputproduction(a) Ice charts
Ice charts are issued daily during the ice season, and they are available via the Internet (http://www.fimr.fi/stc/itamerikanta/attachments/jaakartta.pdf) On Mondays and Thursdays SSTs are included with 30-year averages. Charts are telefaxed (hard copies) or e-mailed (soft copies) to tusers daily and on Mondays and Thursdays are also mailed. Charts are available 24-hours a day via Call-fax.
Type of chart (scale, areas, others): Mercator projec-tion, and since 1 January 2006, covering east of 9°00´E the Baltic Sea, Skagerrak and the Swedish Kattegat and Vanern and Malaren lakes. A simpli-fied ice chart over the Baltic Sea is issued once a week and published on the Internet (http://www.iceservice.fi).
(b) Plain language informationThe charts include the position of icebreakers, Finnish, Swedish and Estonian restrictions to navigation, and traffic control information. On Mondays and Thursdays 30-year average ice extent and mean ice thickness and 30-year mean SST.
(c) Bulletins on ice conditionBulletins on ice conditions in the Baltic Sea, including restrictions to navigation, operational areas of icebreakers and traffic information, are e-mailed, mailed, broadcast and telefaxed on request. The Finnish Ice Report in plain language in Finnish, Swedish and English and in the Baltic Sea Ice Code is broadcast, telefaxed, telefaxed by Call-fax, e-mailed, from coastal radio stations on a daily basis and mailed on weekdays only. Coded sea-ice information from 93 areas or fairways in Baltic Sea Ice Code is included on bulletins.
(d) Other information productsDigital satellite images (SAR and AVHRR) sent to Finnish and Swedish icebreakers. High-resolution (500-m) ice thickness charts over the SAR images are available operationally at http://polarview.fimr.fi).
A sample daily ice chart is shown in Figure V-1, Annex V.

PART II
17
4. Forecastsandforecastingmethods
(a) Forecast methods: ice drift model (Finnish-Chinese), thermodynamic model (Finnish-Chinese), HELMI (dynamic-thermodynamic).
(b) Forecasts are provided for the Baltic Sea, 45 hours in advance for ice concentration, level ice thick-ness, total ice thickness, ridged ice density, ridged ice height, ice motion (direction and velocity), and areas of ice compression. Sample charts are given in figures V-2 and V-3, Annex V. Ice forecasts with six parameters in 3-hour time intervals are available on a daily basis at http://polarview.fimr.fi.
(c) Once a week 10-day ice thickness development forecasts are provided to the Finnish Maritime Administration. Twice a week 10-day forecasts for weather and ice conditions over the Baltic Sea are provided for companies, icebreakers and ships.
(d) The Finnish Ice Service responds to enquiries from users and provides a range of specialized fore-casting, consultation and advisory services on a best-effort, cost-recovered basis.
5. Publications(a) Regular – at five-year intervals;(b) Irregular.
6. MailingandInternetaddressesFinnish Institute of Marine Research (FIMR)Finnish Ice Service PO Box 304, (Porkkalankatu 5)FI-00181 Helsinki Finland
Telephone: +358-9-6857 659 (24-h service during ice season), +358-20 4484 488 Telefax: +358-9-6857 638, +358-9-6857 639 Call-fax: 0200 8668, 0200 2668 (operates only in Finland)
E-mail: [email protected]: http://www.fimr.fi/en/palvelut/jaapal-velu.html
GERMANy1. OrganizationThe ice service provided by the Federal Maritime and Hydrographic Agency (BSH) covers the German Bight and the Baltic Sea west of Bornholm during the winter. The agency is separate from the Meteorological Service but both are part of the Federal Ministry of Transport, Building and Urban Affairs. Radio transmission of ice reports and a daily facsimile broadcast of ice charts are provided for fisheries, national and international shipping in the Baltic Sea and for harbour activities, maritime
agencies and off-shore activities. An overall ice report for the whole Baltic Sea and the southeastern North Sea with relevant ice charts is offered to subscribers via mail, telefax, e-mail and the Internet. On request world-wide ice information is provided.
2. DataacquisitionDaily ice information is reported in Baltic Sea Ice Code from 134 areas or fairway sections along the coast of the southwestern Baltic Sea and the German Bight. A selection of these form 54 main areas or fairways grouped in 11 districts. Details are given in WMO-No. 9, Volume D – Information for Shipping. In addition to the coded information, a great many stations perform ice thickness measurements. The other data sources are observations from regular aerial recon-naissance, icebreakers and merchant ships, reported in plain language, from NOAA and MODIS satellite visual/infrared imagery and from AMSR microwave imagery. Reports, data and charts are also exchanged with foreign ice services via telefax and e-mail and via telex (GTS) transmission of plain language reports and coded data. Internet access to ice information prod-ucts of foreign services is greatly used.
A joint web page for the Baltic Sea Ice Services (BSIS) has been developed and established as an independ-ent domain at BSH (http://www.bsis-ice.de).
3. Outputproducts(a) Ice charts
(i) A printed ice chart (black/white and colour) of the ice conditions in the Baltic Sea using the international system of sea-ice symbols is mailed, telefaxed and e-mailed twice a week and presented on the Internet. Type of chart: Mercator projection, Baltic Sea north of 56°N and east of 16°E. If sea ice occurs farther south, charts cover the whole Baltic Sea area.
(ii) A printed ice chart (black/white and colour), showing ice conditions in the western Baltic and German Bight using the international system of sea-ice symbols is mailed, telefaxed and e-mailed three times a week when ice is present and shown on the Internet. Type of chart: Mercator projec-tion, Baltic Sea between 52°30’N and 60°N, 7°E and 15°40’E.
(iii) A facsimile broadcast of the data in (ii) is made daily when ice is present; Mercator projection, Baltic Sea between 52°N and 60°N, 7°E and 16°E.
(iv) A daily facsimile broadcast is (re-)transmit-ting the iceberg charts for the North-West Atlantic provided by IIP (International Ice Patrol) and CIS (Canadian Ice Service), respectively (Figure I-2, Annex I, and Figure XII-I, Annex XII).
SEA-ICE INFORMATION SERVICES IN THE wORld
18 19
Note: charts (i)–(iii) are constructed with the digital ArcMap program. Larger scale (approximately 1:850,000) sub-regional charts are prepared as needed.
Sample ice charts are given in Annex VI.
(b) Coded and plain language information(i) A bulletin describing ice conditions in the
Baltic Sea using plain English and German and the Baltic Sea Ice Code is mailed, telefaxed, e-mailed and presented on the Internet Monday to Friday. An ice outlook for four to six days is included.
(ii) Similar bulletins covering the western Baltic and the German Bights are prepared daily in English and German for telex (GTS) and radio relays as well as for distribution via mail, telefax and e-mail and for presenta-tion on the Internet.
4. ForecastsForecasts of the date of formation of new and young ice are provided for the western Baltic using thermody-manic methods. The analogue method is used for the decay of ice. An ice model simulates the formation, melting and drift of sea ice for the German Bight and western Baltic as well as for the other North Sea and Baltic Sea areas. The forecasts for the seas, computed by the operational ice model, cover 48 hours.
5. PublicationsA publication on the ice season is presented regu-larly on the Internet and in special reports of the BSH. Other publications are prepared only at irregu-lar intervals.
6. MailingandInternetaddressesBSH – EisdienstNeptunallee 518057 RostockGermany
Telephone: +49 (0) 381 4563 782 (and 787)Telefax: +49 (0) 381 4563 949E-mail: [email protected] Internet: http://www.bsh.de/de/Meeresdaten/Beobachtungen/Eis/index.jsp (in German/English)http://www.bsis-ice.de (a joint web page for the Baltic Sea Ice Services)
ICELAND1. OrganizationThe Icelandic Meteorological Office provides all sea-ice information services in Iceland. The Icelandic sea-ice service covers Icelandic waters, defined by the ocean area inside the limit of the economic zone around Iceland.
2. Dataacquisition
Sea ice in Icelandic waters is mainly encountered in the eastern side of the Greenland Strait (Denmark Strait) between Iceland and Greenland and in the Iceland Sea north of Iceland.
Visual observations are collected from lighthouses and coastal meteorological stations, and both visual and radar observations from ships at sea.
Aerial reports, both visual and radar, are made by Icelandic Coast Guard ice reconnaissance aircraft and ice is also reported by commercial aircraft.
Satellite imagery is also received and integrated into the charts. These are mainly NOAA visible and infrared images received many times a day at the forecast depart-ment of the Icelandic Meteorological Office. Additionally, sea-ice charts are received from abroad. Ice charts and satellite imagery on the Internet are also utilized.
3. OutputproductsShip reports are prepared for display on the Internet, as well as Icelandic Coast Guard sea-ice charts giving ice edges and, when available, concentration and stage of development. The area covered is variable within 65–69°N and 11–28°W. Information on the position of ice edges is sent to ships by NAVTEX. Ice charts are sent to customers and other ice centres by fax. Information on sea ice in Icelandic waters is easily accessible through the web site of the Icelandic Meteorological Office.
4. ForecastsRegular, formal ice forecasts are not prepared. However, probability statements on future sea-ice movements and changes in sea-ice extent are made available on request or made public through news media.
5. PublicationsA monthly summary is prepared and included in a climatic bulletin issued by the Icelandic Meteorological Office.
An annual report, Sea Ice off the Icelandic Coasts, is also issued in Icelandic and English.
6. MailingandInternetaddressesIcelandic Meteorological OfficeBustadavegur 9150 ReykjavikIceland
Telephone: +354 522 6000Telefax: +354 522 6001E-mail: [email protected]: http://www.vedur.is

PART II
19
LATVIA1. OrganizationThe Latvian Environment, Geology and Meteorology Agency (LEGMA) provides the national sea-ice service.
The collection, processing and dissemination of operational sea-ice information as well as further ice development forecasts are carried out for the Gulf of Riga and the Latvian economic zone in the Baltic Sea. The ice season in the region begins in November–December, when ice starts to form in the northern part of the Gulf of Riga and in the Bay of Pärnu. The season lasts until the complete decay of the ice in April–May.
The service collaborates with all ice services around the Baltic Sea through operational data exchange using the international Baltic Sea Ice Code.
The major users of sea-ice data are the Latvian Naval Fleet, coast guard, Maritime Rescue and Coordination Centre (MRCC), Maritime Administration, local port authorities, fishing industry and various private companies involved in operations at sea or in harbours.
2. DataacquisitionThe principal data sources are visual observations from the coast and satellite data (visual and infrared imageries).
Visual sea-ice observations are carried out by nine LHMA-operated coastal stations on the Baltic coast and in the Gulf of Riga daily at 0600 UTC during the ice season. The ice observation data (total concentration, stages of ice development, topography, thickness of fast ice and snow depth on it), accompanied by records of sea level, wind, wave, air and water temperatures are transmitted through telecommunication lines to the central office in Riga in coded form. In addition, some plain language information from vessels in the Gulf of Riga comes through the harbour master’s services. Daily ice reports both coded and in plain language, are received from other Baltic Sea ice services using the GTS. Additionally, ice charts covering all the Baltic Sea regions from Sweden and Germany, regional ice charts from Estonia, and ice bulletins from German ice service are received as well.
All the data, mentioned above, are the principal sources of information for analysing the ice condi-tions and producing output products.
3. Outputproducts(a) Coded and plain language information
(i) A daily Latvian Ice Report, both in the inter-national Baltic Sea Ice Code and in plain language (English) are transmitted via the
GTS circuit Riga-Norrköping. The data refer to the main fairways, harbour approaches and harbours in accordance with Latvia’s area of responsibility as defined in the Baltic Sea Ice Code. It includes ice condi-tion data in the harbours of Riga, Liepaja, Ventspils and approaches to them, ice information on the fairways Riga – Irben Strait – Lithuanian sea border.
(ii) A daily plain language (Latvian) ice condi-tion description for the Gulf of Riga and the Latvian coastal area in the Baltic Sea.
(iii) A daily Ice Condition Report for the area around the Baltic Sea in plain English.
Ice charts for the Gulf of Riga and adjacent to Latvia’s Baltic Sea waters were not produced during the 2003–2004 ice season due to technical problems with the HRPT (High Resolution Picture Transmission) satellite image receiver.
4. ForecastsExpected ice development forecasts (in Latvian and English) for the following 10 days for the Gulf of Riga and the Latvian economic zone in the Baltic Sea are produced three times a month. Expected ice condi-tions on the main Latvian fairways are presented in forecasts as well.
5. PublicationsShort ice situation descriptions (in Latvian) are included during the ice season in the LHMA general monthly weather condition summary and can be found at: http://www.meteo.lv/public/index.html.
6. MailingandInternetaddressesLatvian Hydrometeorological Agency165, Maskavas Str. LV- 1019 RigaLatvia
Telephone: +371 7 032 600Telefax: +371 7 145 154E-mail: [email protected] (sea-ice information
service)
Internet: http://www.meteo.lv
LITHUANIA1. OrganizationAt present there are two subdivisions of the Ministry of Environment involved in sea-ice information: the Centre of Marine Research (CMR) and the Klaipeda Department of the Lithuanian Hydrometeorological Service (LHMS). The CMR, besides other observation units in sea hydrology, includes three sea-ice obser-vation posts. Daily observation data are promptly

SEA-ICE INFORMATION SERVICES IN THE wORld
20 21
transmitted to the LHMS Klaipeda Department. From here data exchange is conducted with hydrometeoro-logical services of foreign countries. Data on sea-ice observations are accumulated and archived as well as analysed in the CMR.
Referring to CMR data on sea ice and including extra information, the LHMS provides information and advises on sea-ice conditions as well as on navigation conditions in the Baltic Sea at users’ requests.
2. DataacquisitionThere are three sea-ice observation posts in the Lithuanian coastal area. Observations begin when ice appears and continue until full ice break. The state of the ice at the ice observation posts is observed daily at 0800 local time. When ice break occurs later in the day the observation time is changed to be closer to noon. Under circumstances of poor visibil-ity, the observations are repeated once visibility has improved.
Basic drifting and fast sea-ice characteristics are deter-mined during observations, including ice pollution, snow on ice, ice drift and ice thickness. The sea-ice state, determined from observations, is outlined in diagrams. The daily express information on sea ice from posts is sent by telegram to the LHMS Klaipeda Department.
To ensure safe navigation in the Baltic Sea the LHMS Klaipeda Department picks up the following information:(a) CMR daily sea-ice observation data in the
Lithuanian Baltic Sea coastal area;(b) Daily sea-ice observation data in the Latvian Baltic
Sea coastal area and Gulf of Riga from the Latvian Hydrometeorological Agency;
(c) The sea-ice report of the Estonian Hydrometeorological Institute in the Estonian coastal area Baltic Sea and Gulf of Riga;
(d) The sea-ice report of the Russian Hydrometeorological Service in the Gulf of Finland;
(e) The sea-ice report of the Hydrometeorological Service of Finland in the Bothnia Sea and Bothnian Bay and Gulf of Finland;
(f) Monthly sea-ice forecast from the Latvian Hydrometeorological Agency in the Irben Strait and Gulf of Riga;
(g) All available information on sea-ice distribution and development received from fishing-boats and merchant vessels entering Klaipeda seaport;
(h) Sea-ice map on ice situation in the Baltic Sea and the Belts from the Swedish Meteorological and Hydrological Institute broadcast through Germany;
(i) The sea-ice report taken during air surveys over the Lithuanian economic zone in severe winters.
3. Outputproducts
The LHMS Klaipeda Department publishes informa-tion on sea ice in the Lithuanian coastal zone in a daily marine bulletin. At the request of ships’ owners and masters, according to the information available, maps are provided on the sea-ice situation in the following parts of the Baltic:(a) In the Gulf of Riga (sailing to Riga port);(b) In the Gulf of Finland (sailing to St Petersburg);(c) In the Belt Sea (sailing to the North Sea and
Atlantic Ocean).
4. ForecastsandforecastsmethodsIn addition to the sea-ice observations and infor-mation on sea-ice distribution, the CMR and LHMS Klaipeda Department also carry out observations and forecast the ice situation in the Curonian Lagoon.
The Curonian Lagoon is a very closed freshwater basin connected by a narrow (600–800-m wide) strait with the Baltic. The main Lithuanian river, the Nemunas runs into this lagoon. The northern part of the Curonian Lagoon belongs to Lithuania. This part is significantly influenced by Baltic Sea waters during storms in the autumn and winter season, and the ice formed, often has the sea-ice properties.
There are three ice observation posts in the Lithuanian port of the Curonian Lagoon. Daily express informa-tion on the ice situation there is received by the LHMS Klaipeda Department. This department provides fore-casts and warnings to shipping and fishing companies with the following details:(a) Information on formation of new ice forms;(b) Information on fast ice formation and total freez-
ing of the lagoon;(c) Information on ice break out;(d) Information on total ice-break.
5. MailingandInternetaddressesCMRTaikos Str. 265802 KlaipedaLithuania
Telephone: + 3706 250324Telefax: + 3706 250930E-mail: [email protected]
LHMS Klaipeda DepartmentTaikos Str. 265802 KlaipedaLithuania
Telephone: + 3706 252247Telefax: + 3706 252247E-mail: [email protected]

PART II
21
NETHERLANDS1. OrganizationInstitution providing sea services: Rijkswaterstaat/ Riza.
2. DataacquisitionDaily ice information reported in Baltic Sea Ice Code. Number of areas, regions, stations: 10 stations nationwide.
Other sources of information: NOAA satellite, govern-ment ships. Data exchanged with foreign services daily, via the GTS by fax.
Ice charts are received from Sweden and Germany.
3. Outputproducts(a) Ice charts
Ice charts are issued daily in ice seasons for several areas and are mailed and telefaxed to users.
(b) Coded and/or plain language information: (i) Ice report in Dutch and English;(ii) Conditions in the Baltic Sea: ships,
telefaxed;(iv) Ice bulletins covering other areas: waters at
the Dutch-German border.
4. ForecastsandforecastmethodsForecasts are provided for Netherlands coastal waters for 24 hours.
5. PublicationsRegularly.Irregularly: seasonally.
6. MailingandInternetaddressesRijkswaterstaat/Riza Information and Warning Centre(Infocentrum Binnenwateren)Postbus 17NL-8200 AA LelystadNetherlands
Telephone: +31 320 298-888, +31 320 298-730Telefax: +31 320 298-580E-mail: [email protected]: http://www.infocentrum-binnenwateren.nl
NORWAy
Two government institutions in Norway issue sea-ice information:
(a) The Ice Service of the Norwegian Meteorological Institute is responsible for ice monitoring within
the Atlantic part of the Arctic with the emphasis on Svalbard.
(b) The Ice Service belonging to the Norwegian Coastal Administration is responsible for inform-ing vessels about the ice situation in Norwegian waters in Skagerrak Strait from the Swedish border to Kristiansand.
I NorwegianMeteorologicalInstitute
1. Organization
The Norwegian Ice Service is located in Tromsø and shares offices with the Forecasting Division for Northern Norway, which is in turn part of the Norwegian Meteorological Institute (met.no).
The Ice Service provides daily (working day) ice charts for the Atlantic part of the Arctic, covering the east coast of Greenland to the western coasts of Siberia, with the emphasis on Svalbard.
The main users of the Ice Service are fishing vessels, sail-ing close to the ice edge in northern and southeastern parts of Spitsbergen all year round. The majority of these ships consists of non-ice classed shrimp trawlers that are dependent on good ice information to be able to work and plan their activities in the most safe and cost-effi-cient manner. Cargo and cruise ships are very active during summertime and entering fjords and crossing narrow straits and sounds can be critical due to the high dynamics of sea ice in this area. Good and accurate ice information on the ice conditions is therefore impor-tant, and highly demanded by the users.
The Ice Service analysts study the current conditions primarily via remotely sensed data and provide ice charts, ice-edge information and an overview of the sea surface temperatures.
High-resolution ice charts based on SAR are produced weekly on a preoperational basis. The demand for such a product is very high and in 2005 the Ice Service began delivering these products to users more frequently.
2. DataacquisitionData received from satellites are the main source for analysts, augmented by visual observations and meteorological weather forecasts. The following infor-mational products are used:(a) The EUMETSAT O&SI SAF (Ocean and Sea Ice
Satellite Application Facility) provides the data background for the analysts. These data are based on multi-sensor data, primarily from DMSP SSM/I and NOAA AVHRR products depicting ice concen-tration, ice type and ice edge on a 10-km grid.
(b) NOAA AVHRR imagery downloaded at met.no headquarters in Oslo.
(c) Quickscat data showing ice edge on a 7-km grid.

SEA-ICE INFORMATION SERVICES IN THE wORld
22 23
(d) EOS Aqua AMSR data showing ice concentration.(e) ENVISAT ASAR Global Mode and ASAR wide
swathe data, when available.
3. Outputproducts(a) Ice charts are issued weekly throughout the year
and are mailed and telefaxed to users. The posi-tion of the ice edge is also relayed to users by telex. Type of ice charts used is European Arctic with a scale of 1:7,500,000. A sample chart is given in Figure VIII-1, Annex VIII.
(b) Formatted ice, sea surface temperature and snow data are prepared regularly for use in the HIRLAM weather prediction model.
(c) High-resolution ice charts are issued for the Svalbard area, when data are available. A sample chart is given in Figure VIII-2, Annex VIII.
4. ForecastsandforecastmethodsA forecast model is under development and is being tested on a pre-operational basis.
5. PublicationsPublications are issued both on a regular and irregular basis.
6. MailingandInternetaddressesIstjenestenVervarslinga for Nord-NorgePostboks 63149293 TromsøNorway
Telephone: +47 77 62 14 62Telefax: +47 77 62 13 15E-mail: [email protected]: http://www.met.nohttp://met.no/kyst_og_hav/iskart.html (regular ice charts)http://met.no/satellitt/index.html (satellite imagery, mainly NOAA)http://met.no/radar/index.html (real-time radar imagery for the Baltic Sea and Norwegian coastal waters)
II NorwegianCoastalAdministration
1 Organization
The main task of the Norwegian Coastal Administration Ice Service is to inform vessels about the ice situa-tion in Norwegian waters from the Swedish border to Kristiansand including the Oslofjord.
The Norwegian Ice Service does not include assist-ance by icebreaker to and from ports. The larger ports have icebreaker service in the harbour and for assistance during approach and departure from the port. Please contact local port authorities for information.
2. Dataacquisition
The coast is divided into observation areas that are identified by a code of letters and numbers according to “The Baltic Sea Ice Code”.
3. OutputproductionPlain language ice reports and coded ice observations according to “The Baltic Sea Ice Code” are available and regularly updated: 1 December to 31 March on www.kystverket.no.
4. Forecastsandforecastingmethodsnil
5. MailingandInternetaddressesKystverket Southeast, Ice ServiceServiceboks 625 N-4809 ARENDAL, NORGE
Telephone: +47-3701 9700/ -3701 9718 / -3701 9759Cell phone: +47-4815 4142 / -9593 0261Fax: +47-3701 9701/ -3702 7619E-mail: [email protected]: http://www.kystverket.no
POLAND1. OrganizationThe Ice Service is provided by the Institute of Meteorology and Water Management, Maritime Branch (Instytut Meteorologii Gospodarki Wodnej, Oddzial Morski – OM IMGW), Hydrological Forecast Office in Gdynia. It covers Polish waters.
Ice services are provided for all marine activities (fish-eries, navigation, drilling and harbours).
2. DataacquisitionVisual data are collected from 35 coastal stations and ships. Aerial reconnaissance is made only under very severe ice conditions.
At present OM IMGW receives images from IMGW Krakow from satellites: NOAA – HRPT, Meteosat – HRI, MSG – HRIT and LRIT, FENG YUN – CHRPT.
Details on 21 coastal stations are listed in publication WMO-No. 9, Volume D – Information for Shipping.
Data are also exchanged with foreign ice services via the GTS, mail and fax.
3. Outputproducts(a) A coded ice report is broadcast daily by Witowo Radio
on ice conditions in Polish waters. A plain language report is also provided in Polish and English.
(b) Ice charts (scale 1:4,400,000 in conic projection) of the whole Baltic Sea, the Kattegat and Skagerrak

PART II
23
are prepared twice a week (Tuesday, Friday) in the ice season for distribution by messengers and mail (by fax on request). A sample chart is given in Figure IX-1, Annex IX.
(c) An ice bulletin in plain-language (Polish) giving ice conditions in Polish waters, is prepared daily from Monday to Friday during the ice season for distribution by messenger and mail. It includes coded reports for the open Baltic Sea and coastal waters for all the Baltic countries.
4. ForecastsandforecastmethodsA 35-hour ice forecast for Polish waters is included in the ice bulletins. It uses subjective dynamical methods and a forecast of meteorological conditions.
5. PublicationsDescriptive summaries of sea-ice conditions are published by the Maritime Branch in Gdynia in the year-book, containing hydrological and oceano-graphic data.
6. MailingandInternetaddressesInstytut Meteorologii i Gospodarki Wodnej (IMGW), Oddzial MorskiUl. Waszyngtona 42PL 81-342 GdyniaPoland
Telephone: +48 58 6288 146/+48 58 6288 100 (operator)Telefax: +48 58 620 1641
E-mail: [email protected]: http://www.imgw.pl http://www.imgw.pl/wl/internet/baltyk/bphgdynia_aktualne.html (ice chart)
SWEDEN1. OrganizationThe Swedish Meteorological and Hydrological Institute (SMHI) is responsible for the sea-ice infor-mation service in Sweden. The service is intended to meet the needs for ice breaking and interna-tional shipping as well as other activities where sea-ice information is required, in particular fisher-ies, coastal and harbour activities, meteorological forecasting and climatology. The ice season in the Baltic normally begins at the end of October, when ice starts to form in the northernmost archipelagoes of the Bay of Bothnia and lasts until the end of May or beginning of June.
2. DataacquisitionDaily ice information is reported in Baltic Sea Ice Code from 278 areas or fairway sections along the Swedish coast. A section and/or combination of these form 129 main areas
or fairways grouped in 19 districts. Details are given in the WMO-No. 9, Volume D – Information for Shipping.
Icebreakers report on the ice situation four times a day in plain language. An irregular number of ships provide information at their own initiative or upon request when not assisted by icebreakers. The infor-mation is given in plain language via telex or fax. WMO codes are not used.
As necessary,helicopter ice reconnaissance is carried out by icebreaker deck officers and resulting ice charts are transmitted to SMHI by fax. The normal area of coverage is approximately 40 by 60 nautical miles. No regular ice reconnaissance by fixed-wing aircraft is carried out by SMHI. AVHRR data from NOAA satel-lites is received and processed at SMHI. RADARSAT (mainly ScanSAR Narrow) as well as ENVISAT images are used 4-6 times a week during the major part of the ice season in cooperation with the Finnish ice serv-ice (Finnish Institute of Marine Research). Samples of annotated imagery used in sea-ice analysis are given in Figure XI-2, Annex XI.
All meteorological information, such as observations, weather charts, forecasts etc., is received from the weather service of the SMHI. Ice information in Baltic Sea Ice Code and in plain language is received daily via the GTS from Denmark, Estonia, Finland, Germany, Latvia, Lithuania, Netherlands, Poland and Russia.
3. Outputproducts(a) Ice charts
All ice charts are in Mercator projection and cover the Gulf of Bothnia, the Baltic proper, Gulf of Finland, Gulf of Riga, the Sound and the Belts, Kattegat and the Skagerrak. The scale at 60°N is 1:4,000,000.
Ice charts are issued daily in the ice season and transmitted by telefax, e-mail or the Internet. The Swedish ice chart is retransmitted once a day on radiofacsimile by the German stations Hamburg/Pinneberg and Offenbach/Mainflingen.
The ice chart can also be provided on request to vessels by mobile fax or e-mail. A sample ice chart is given in Figure XI-1, Annex XI.
(b) Ice report/ice bulletinsA sea-ice bulletin – a description of the ice situa-tion at sea, restrictions to navigation, operational areas for icebreakers – is issued in English twice daily from coastal stations and by NAVTEX and once daily by the GTS or telex to Baltic countries. Coded sea-ice information from 129 areas or fair-ways in Baltic Sea Ice Code is included on the GTS. An abridged bulletin (in Swedish only) is issued daily by Swedish Radio Broadcast.

SEA-ICE INFORMATION SERVICES IN THE wORld
24 25
4. Forecastsandforecastsmethods
(a) General five-day forecastsGeneral 5-10 day ice forecasts in text form are provided to customers when requested, normally on a weekly basis. The content is expected ice formation, ice drift, openings or leads, areas with ice pressure and melting.
(b) 10-day ice formation and ice dynamics forecasts Forecasts are based on dynamical methods and are run on the institute’s computer using high-resolu-tion numerical weather forecasts as input. The ice model has a resolution of 1 nautical mile and the forecasted parameters are: ice drift (direction and speed), ice concentration (percentage), changes in ice concentration, ice deformation and amount of ridging.
5. PublicationsA monthly summary with meteorological, oceano-graphical and hydrological conditions is published.
Furthermore a summary of the ice season, includ-ing a description of the ice development month by month, illustrated by ice charts, is produced. It gives a statistical summary of selected fairways, a weather summary and sea surface temperature statis-tics. It also includes a summary of the icebreaking activities.
6. MailingandInternetaddressesSwedish Meteorological and Hydrological Institute (SMHI)Operational Oceanography DepartmentS - 601 76 NorrkopingSweden
Telephone: +46 (0)11 495 8533Telefax: +46 (0)11 495 5023E-mail: [email protected] Internet: http://www.smhi.se/iceproducts
UNITEDKINGDOM1. OrganizationSince the first issue of the WMO publication Sea-Ice Information Services in the World (1981) the UK Met Office is not producing routine sea-ice analyses. No sea-ice information is available.
2. MailingaddressMeteorological OfficeFitzRoy RoadExeterDevon EX1 3PBUnited Kingdom
Telephone: +44 (0)1392 885680Telefax: +44 (0)1392 885681
E-mail: [email protected] Internet: http://www.metoffice.gov.uk
NORTH AMERICA
CANADA1. OrganizationThe Canadian Ice Service (CIS), a division of the Meteorological Service of Canada in the Department of Environment, is a centre of expertise for ice related infor-mation for all of Canada and its surrounding waters. The Ice Service cooperates closely with the Canadian Coast Guard which operates Canada’s fleet of icebreakers to assist marine transportation in Canadian waters.
The Canadian Ice Service promotes safe and efficient maritime operations and protects Canada’s environ-ment by providing reliable and timely information about ice conditions in Canadian waters. For example, the Ice Service provides timely warnings of icebergs and ice conditions that pose immediate threats to ships, ports and other marine operations; advises on ice conditions in shipping routes for navigators; provides information to help shipping, fishing and offshore operators plan their seasonal operations in a safe and efficient manner.
To meet its mission, the Canadian Ice Service collects and analyses data on ice conditions in all regions of the country affected by the annual cycle of pack ice growth and disintegration. In summer, the focus is on conditions in the Arctic and the Hudson Bay region. In winter and spring, attention shifts to the Labrador Coast and East Newfoundland waters, the Gulf of St Lawrence, the Great Lakes and St Lawrence Seaway.
Major users of Ice Service products and services are:(a) The Canadian Coast Guard uses weather and ice
information for marine safety, icebreaking opera-tions and efficient marine transportation;
(b) Port authorities obtain site-specific information on current and long-term ice conditions in ports and shipping routes;
(c) The commercial shipping industry uses ice infor-mation for strategic and tactical vessel passage planning;
(d) Fishing fleets obtain enroute and on-site ice condi-tions for ice-encumbered areas;
(e) The offshore oil and gas companies use iceberg and sea-ice information for exploration and produc-tion, both on-site and in transit;
(f) The marine construction industry uses site-specific current and historical data for offshore and onshore projects, such as bridges and port facilities;

PART II
25
(g) The tourism industry gets technical and general information for the operation of cruise ships and the enjoyment of passengers;
(h) The marine insurance industry uses ice informa-tion for risk assessment for offshore operations affected by ice;
(i) Environmental consultants use ice data, analy-ses and expert advice for environmental impact assessments;
(j) Research scientists use ice information relating to research on transportation, construction, climate change, meteorology, oceanography, biology and socio-economic impacts.
The Canadian Ice Service operates a comprehensive ice information service, encompassing reconnais-sance, analysis and forecasting, ice climatology, data archiving, informatics support and research and development. It has a staff of approximately 80 people working at the Ice Centre in Ottawa, aboard Coast Guard icebreakers and in field offices.
2. DataacquisitionRadar imagery from satellites is the principle data source, augmented by visual observations from fixed-wing aircraft and helicopters. RADARSAT and ENVISAT synthetic aperture radar (SAR) data provides extensive and detailed (up to 30 metres) coverage of ice condi-tions. The Ice Service uses approximately 5,000 SAR images covering over a billion square kilometres annu-ally. Data are received in real-time by two Canadian satellite receiving stations, processed and delivered to the Canadian Ice Service and disseminated to marine users within hours.
Visual and infrared imagery from US polar orbiting satellites is also used extensively in the ice analysis programme. Passive microwave imagery is received daily to provide background information on the general ice distribution at low resolution.
Experienced ice observers are stationed on the major Coast Guard icebreakers and in regional ice offices. They conduct local visual reconnaissance by helicop-ter and transmit the observations to the Ice Centre immediately after the flight. These observed ice charts are posted on the Ice Service web site immediately upon receipt.
The Canadian Ice Service is integrated with the national meteorological network and has access to the necessary meteorological and oceanographic inputs. Cooperation with research institutes, universities and other federal departments also provide other valuable data.
3. OutputproductsandforecastsThe Canadian Ice Service provides its clients and the Canadian public with a variety of accurate and timely
analyses and forecasts of ice conditions ranging from daily bulletins on ice hazards to seasonal outlooks. Information on ice conditions posing immediate threats, such as ice hazard bulletins and special warn-ings for ships, are directly available from the Ice Service web site and through weather and marine radio broadcasts.
Specialized products and services to meet the short-term tactical and longer-range planning needs of clients are also available. These products include detailed ice analysis charts, radar and satellite imagery, image analysis charts and special forecasts covering days to months. These products are distributed in a variety of formats, including mail, e-mail, fax and the Internet.
The Ice Service provides a variety of field services, normally through the Coast Guard, for clients who need specialized ice information. Ice Service special-ists provide field support to clients on shore and aboard ships, including briefings on ice conditions, direct analysis of satellite images and special visual observations.
The Canadian Ice Service has expertise in ice modelling, remote sensing and climatological ice conditions in and around Canada. It supports research and develop-ment by scientists working in government, universities and the private sector. Drawing on the Canadian Ice Service national ice data archive, ice analysts work directly with clients to identify and analyse appropri-ate climatological ice information and provide advice on historical ice and iceberg conditions.
Ice information products and services are provided in those areas of Canada’s waters where there is marine activity in the vicinity of sea ice. Arctic areas are active from June to November while southern areas, includ-ing the Gulf of St Lawrence and the Great Lakes are active from December to May.
(a) Ice chartsIce charts graphically illustrate ice or iceberg conditions at a particular time, presenting data by means of a standard international code. Charts may be used for strategic and tactical planning. Charts available from the Canadian Ice Service include:(i) Regional Weekly Ice Chart (Figure I-1,
Annex I);(ii) Daily Iceberg Analysis Charts (Figure I-2,
Annex I);(iii) Daily Ice Analysis Charts (Figure I-3,
Annex I);(iv) Ice Reconnaissance Charts (Figure I-4,
Annex I);(v) RADARSAT Image Analysis Charts (Figure
I-5, Annex I).

26
SEA-ICE INFORMATION SERVICES IN THE wORld
27
(b) BulletinsBulletins provide advice on present and forecast ice or iceberg conditions in simple text format. The following bulletins are available from the Canadian Ice Service:(i) Daily Ice Hazard Bulletins (Figure I-6, Annex I);(ii) Daily Iceberg Bulletins;(iii) Daily St Lawrence River Ice Bulletins;(iv) 30-day Ice Forecast Bulletins;(v) Seasonal Ice Summary;(vi) Seasonal Ice Outlook.
(c) ImagesIn preparing the charts and bulletins, the Canadian Ice Service uses an extensive array of satellite data. Raw images are available to users depending on their ability to receive image data:(i) Visual/infrared satellite imagery(ii) SAR images from RADARSAT and ENVISAT
(Figure I-7, Annex I)
(d) Weather mapsThe Canadian Ice Service makes available the following weather maps produced by Environment Canada:
(i) Surface Analysis Weather Map;(ii) 500 HPA Height Analysis Map;(iii) Surface Prognostic Weather Map out to 120
hours;(iv) 500 HPA Prognostic Weather Map out to
120 hours;(v) Public and Marine Weather Forecast
Bulletins;(vi) Significant weather depiction charts;(vii) Ocean wave analysis;(viii) 12-, 24- and 36-hour ocean wave
prognosis.
(e) Special servicesThe Canadian Ice Service responds to enquiries from users and provides a range of specialized forecasting, consultation and advisory services on a best-effort, cost-recovered basis. If needs are substantial, the user is referred to the private sector when possible.
4. PublicationsThe Canadian Ice Service has a collection of reference material related to sea ice and icebergs. The following representative publications are available in printed format and on-line as indicated:
(i) Seasonal Summary for Canadian Waters (most recent past season available on-line);
(ii) MANICE – Manual of Standard Procedures for Observing and Reporting Ice Conditions (available on-line);
(iii) Ice Thickness Climatology (1961–1990);
(iv) Melting and Freezing Degree Days (1961–1990);
(v) Sea Ice Climatic Atlas – Northern Canadian Waters 1971–2000 (also in CD) (available on-line);
(vi) Sea Ice Climatic Atlas – East Coast of Canada 1971–2000 (available on-line);
(vii) Lake Ice Climatic Atlas – Great Lakes 1973–2002 (available on-line);
(viii) Annual Arctic Ice Atlas (CD only from 2003) (available on-line);
(ix) Seasonal Outlook for Canadian Waters (current or upcoming season available on-line);
(x) Ice Thickness Data (Original Programme 1947–2002, available on-line);
(xi) Ice Thickness Data (New Arctic Programme 2002 – most recent update, available on-line).
5. MailingaddressCanadian Ice Service – Environment Canada373 Sussex DriveBlock E – 3rd floorOttawa, OntarioCanada K1A 0H3
Telephone: +1 (613) 996-1550 or toll-free in North America +1 (800) 767-2885
Telefax: +1 (613) 947-9160E-mail: [email protected] Internet: http://ice-glaces.ec.gc.ca
NORTHAMERICANICESERVICE1. OrganizationThe North American Ice Service (NAIS) is a joint initia-tive of the US National Ice Center (NIC), the Canadian Ice Service and the International Ice Patrol (IIP) that has grown out of the long-standing cooperation between the three organizations. The primary objec-tive is to provide improved ice information services to users by reducing the potential for confusion caused by multiple, overlapping products coming from different sources. A secondary objective is to gain greater effi-ciency by reducing duplication of effort by the three services.
Starting in December 2004, the CIS and the NIC are jointly producing ice charts, ice hazard bulletins, 30-day forecasts and seasonal outlooks for the Great Lakes under the banner of the North American Ice Service. The workload and the data sources for these products are shared between the CIS and NIC. In 2005, 30-day forecasts and outlooks for the North American Arctic are also being produced collaboratively. In the coming years, this practice will be extended to encompass all

PART II
27
of the ice-covered waters of North America. Eventually, the NAIS envisions common databases and produc-tion systems will facilitate this collaboration.
2. Outputproducts(a) Ice charts issued weekly for the Great Lakes. A
sample chart is given in Figure XIII-1, Annex XIII.(b) Ice hazard bulletins for the Great Lakes in plain
language.
3. Forecastsandforecastmethods30-days forecasts and seasonal outlooks for the Great Lakes.
30-days forecasts and seasonal outlooks for waters surrounding North America in the Arctic.
UNITEDSTATES1. OrganizationIce products and services in the USA are provided through the collective efforts of three Federal Government agencies: the National Oceanic Atmospheric Administration (NOAA), the US Navy (USN) and the US Coast Guard (USCG). Manpower and fiscal resources contributed by each agency are used in the collaborative operation of the National Ice Center (NIC).
The mission of the NIC is: “To provide the highest quality strategic and tactical ice services tailored to meet the operational requirements of US national interests. To provide specialized meteorological and oceanographic services to United States government agencies.” The NIC provides global sea-ice and fresh or brackish water ice information, services and prod-ucts for the US Northeast Coast, the Great Lakes and the Chesapeake and Delaware Bay areas in support of shipping, cryospheric research and other maritime activities in ice-encumbered waters.
NIC ice guidance products and services include: tactical, regional and hemispheric-scale graphical ice analyses, annotated satellite imagery, short and long-term ice forecasts, legacy ice information (1972–present), ice climatologies (produced in collaboration with the National Snow and Ice Data Center (NSIDC)), Optimum Track Ship Routing (OTSR) recommenda-tions, pre-sail ship briefings and ship rider services. NIC Alaskan and Great Lakes ice products are augmented by services provided by the NOAA National Weather Service (NWS) field offices located in Anchorage, Alaska and Cleveland, Ohio, respectively. Additionally, the National Center for Environmental Prediction (NCEP) Ocean Modeling Branch (OMB), the Fleet Numerical Meteorological and Oceanographic Center (FNMOC) and the Naval Oceanographic Office (NAVOCEANO) provide Arctic ice modeling output.
The IIP provides iceberg information for the western North Atlantic Ocean.
2. DataacquisitionNIC ice guidance products are produced in a digital workstation environment using data from polar orbiting satellites, aerial ice reconnaissance missions, ship/shore station reports, drifting buoys, meteoro-logical guidance products, ice model predictions and government partners including national ice serv-ices. Among the presently available operational data sources, satellite imagery now constitutes over 95 per cent of the information received and integrated into NIC ice analysis products. The timing and location of operational activities in or near the ice packs are often dictated by events, whether economic, military or environmental, far beyond the control of the moni-toring agency.
Traditional data collection methods, such as visual aerial ice reconnaissance, require extensive pre-plan-ning, are limited in geographic scope and are not cost effective. Real-time satellite data in the visible, infra-red and microwave bands of the spectrum are now used extensively, and are an essential requirement at the NIC to ensure safety of navigation and protect life and property in ice-covered seas.
The primary remotely sensed data sources used by NIC (by volume) are from the NOAA TIROS-N and Defense Meteorological Satellite Program (DMSP) satellites. Visible and infrared imagery from the TIROS-N Advanced Very High Resolution Radiometer (AVHRR) and the DMSP Operational Linescan System (OLS) are received on a daily basis from the NOAA National Environmental Satellite Data Information Service (NESDIS) and Air Force Weather Agency (AFWA), respectively.
AVHRR data has a 1.1-km spatial resolution at the nadir and is received in the High Resolution Picture Transmission (HRPT) and Local Area Coverage (LAC) transmission modes.
DMSP OLS fine data, which has a 0.55-km spatial reso-lution, is used extensively for detailed regional-scale ice mapping. Unfortunately, all visual and infrared imagery are limited by the extensive cloud cover that frequently obscures the ice pack in the polar regions. Climatologically, cloud cover may be present nearly 80 per cent of the time over the Arctic ice pack and the marginal ice zone during the important summer shipping months.
The NIC has compensated for weather limitations in the polar regions by integrating microwave data into the majority of ice analysis products. These algo-rithms produce 6–25-km gridded mosaic ice maps that assist in the general delineation of the ice edge and

SEA-ICE INFORMATION SERVICES IN THE wORld
28 29
inner pack concentrations in cloud-covered areas. These active (scatterometer) and passive microwave-based products are instrumental in the production of NIC weekly composite Arctic/Antarctic ice maps. Unfortunately, the coarse resolution precludes detailed analyses and great care must be taken for contamination errors induced by surface meltwater and coastlines.
At the NIC, higher resolution, tactical-scale ice anal-ysis products now benefit from the availability and use of Synthetic Aperture Radar (SAR) data from the Canadian RADARSAT and recently from the European ENVISAT satellite.
RADARSAT was the world’s first radar satellite specifi-cally designed to maximize its usefulness for sea-ice monitoring. Of primary importance in this effort is RADARSAT’s C-band ScanSAR Wide mode, which provides these all-weather data in a 500-km wide swathe with 100-m spatial resolution. This wide swathe mode provides a high repeat imaging capabil-ity essential for operational ice monitoring. By virtue of this wide swathe, RADARSAT can image every point on the earth’s surface north of 65°N latitude at least once every day. North of 45°N, the entire globe can be covered in three days or fewer.
The ENVISAT, C-band ASAR instrument provides a similar capability with a 400-km wide ScanSAR mode. The NIC has recently incorporated the ENVISAT ASAR Global Monitoring Mode (GMM) data into its opera-tions as well. Its relatively high resolution (1.0 km) provides an improvement over passive microwave and scatterometer data when available.
The importance of and need for visual ice reconnais-sance data from aircraft has decreased dramatically in conjunction with the growing capabilities of satellites. Used extensively to map sea-ice distribution during the 1970s and 1980s, the use of aerial reconnaissance is now inhibited by limited range at comparatively high costs. On a restricted basis, the NIC continues to employ USCG and USCG Auxiliary aircraft to map ice in the Chesapeake and Delaware Bay areas and for specific special polar operations.
Visual ice reconnaissance and other in-situ data (ship and shore reports) do have great value as “ground-truth data” for validating newly developed automated ice detection and classification algorithms. Visual recon-naissance missions and ships operating in or near the ice also regularly report ice parameters (topography, divergence/convergence and measured ice thickness) that are presently not possible to extract from satellite data. Coastal station reports, regularly received from Alaska and the Great Lakes, describe measured ice thickness, extent of landfast ice and conditions within the immediate offshore ice pack.
The NIC obtains Arctic meteorological and ice drift information from the drifting buoys that comprise the observational data network maintained by the International Arctic Buoy Program (IABP). The IABP drifting buoys report surface air pressure, surface air temperature and positional information approxi-mately hourly via the Service ARGOS Data Collection and Location System (DCLS). These data are made available to the NIC and other weather/ice forecast-ing centres via the GTS. Air pressure and temperature data are used to initialize numerical weather models, which in turn provide input to ice prediction models. The NIC uses air temperature data to compute freezing degree-days and corresponding theoretical ice thick-nesses while buoy positional data are used to validate ice model drift predictions.
The NIC also uses the buoy positional data to track and hindcast the southernmost limit of dangerous Arctic multi-year sea ice. The NIC provides the manage-ment for the US contribution to the IABP including the funding of the University of Washington/Polar Science Center (UW/PSC) to produce quality control-led annual data compilations and derived synoptic field products.
Numerical weather and ice prediction model forecasts are received at the NIC from FNMOC, NWS NCEP and NAVOCEANO. Output from FNMOC’s Navy Operational Global Atmospheric Prediction System (NOGAPS) and NCEP’s Medium Range Forecast (MRF) models assist NIC analysts in forecasting future sea-ice expansion and recession by predicting surface and near-surface wind direction, wind velocity and ther-mal advection patterns.
NAVOCEANO subsequently uses NOGAPS model output and SSM/I ice concentration fields to initialize the Polar Ice Prediction System (PIPS 2.0) model. PIPS 2.0 is a moderate resolution (35-km) ice-ocean coupled model which provides daily forecasts of ice drift velocity, ice thickness, ice concentration and convergence/diver-gence for most of the ice covered seas in the Northern Hemisphere (north of 30°N). Dynamics are based upon the Hibler ice model that couples ice momentum, ice concentration and ice thickness via ice rheology and ice strength formulations. Thermodynamics and ice growth/decay are specified in terms of a three-dimen-sional ocean basin in the Cox ocean model. NCEP MMAB also produces routine ice drift predictions for the Alaskan seas. A new version, PIPS 3.0, will be released within the next year. The NIC has no opera-tional access to Antarctic ice model forecasts.
Information from US Government and international partners consists mainly of satellite data, in-situ observations or detailed ice analyses. RADARSAT data covering the Great Lakes and Baffin Bay are obtained from the CIS in exchange for equivalent amounts of

PART II
29
data in the Western Arctic. Ship reports are routinely received from USCG icebreakers and NOAA survey vessels operating in polar seas. Visual ice observa-tions are received from aerial reconnaissance missions flown by the Danish Meteorological Institute (DMI) in southern Greenland waters and from the US Dept of Interior – Minerals Management Service as part of their annual whale survey each autumn in the Beaufort Sea. The NIC also receives detailed ice analyses in regional seas from the Japanese Meteorological Agency (JMA), Norwegian Meteorological Institute (DNMI), Canadian Ice Service (CIS), Swedish Meteorological and Hydrological Institute (SMHI) and the German Hydrographic Institute.
3. ProductsandservicesThe NIC provides a diverse suite of digital and analogue ice guidance products in support of operations and climate research in the polar regions. Routine NIC ice guidance products include hemispheric and regional-scale ice analyses, alphanumeric text messages, annotated satel-lite imagery, short and long-term ice forecasts, legacy ice information, ice climatologies and iceberg reports. NIC services available via special request include Optimum Track Ship Routing (OTSR) recommendations, pre-sail ship briefings, aerial ice reconnaissance and ship rider support and tactical scale ice analyses.
Sea-ice features of most frequent interest include ice edge position, ice concentration, ice thickness or stage of development, forms (or floe size) of ice, ice motion, location of landfast ice, areas of compression and heavy surface deformation (topography) and the location/orientation of open water or thin ice-covered leads and polynyas. The USCG provides information on North Atlantic icebergs daily. The NIC also tracks large tabular icebergs in the vicinity of Antarctica and maintains a historical database of the date icebergs were sited, position, size of the iceberg and source of the information.
(a) Ice analysis charts The NIC produces twice-per-month regional-scale analyses for all ice-covered Arctic and Antarctic seas. Analyses are done on a bi-weekly basis for the Alaskan waters when there is an ice edge present, and the Great Lakes and weekly for the Ross Sea during the austral summer navigation season, the Baffin Bay during the boreal summer and during the winter for the infrequently frozen Chesapeake and Delaware Bay systems on the US East Coast. Sea-ice analyses are also produced weekly for the Bering Sea and Cook Inlet, Chukchi Sea, Beaufort Sea, Arctic Basin, Barent Sea, Kara Sea and the northern area of the East Greenland Sea.
Prior to 1997, this weekly global analysis product was manually produced on two 1:10,000,000 scale polar azimuthal equidistant/stereographic paper
charts for the Arctic and two 1:16,000,000 scale polar azimuthal equidistant/stereographic paper charts for the Antarctic.
Since 1997, this global analysis product has been produced in a digital format as up to 42 separate Arctic analyses (north of 35°N) and 13 separate analyses in the Antarctic. Scales of these Arctic and Antarctic ice maps vary between 1:3,000,000 to 1:7,000,000 depending on the size of the area. Great Lakes and Chesapeake Bays charts are 1:1,500,000 scale.
All NIC ice analyses are produced through the integration and analysis of all available remotely sensed and in-situ oceanographic/meteorological data. The NIC currently hosts these data on a MS Windows based system using primarily ESRI’s suite of GIS software. All digital ice charts are produced following standard NIC analysis procedures that optimize the use of remotely sensed and in-situ data that vary widely in availability, scale and resolution. Highest priority in the analysis proc-ess is always given to data sources with superior spatial resolution and timeliness of receipt. When available, in-situ observations, SAR, MODIS visible and infrared, OLS fine and AVHRR data are used for detailed mapping while QuikScat and SSM/I data provide general guidance.
NIC bi-weekly to bi-monthly regional and hemi-spheric ice analyses are therefore often “composite analyses” since they may be derived from several data sources. Spatial differences in data are often subjectively “smoothed” during the delineation of ice map contours. Temporal differences in data are compensated for by estimating changes in ice conditions using ice model forecasts, surface wind/temperature predictions and ice climatolo-gies. Typically no data older than 72 hours is used in the global ice analysis products. Date and time of data acquisition as well as the percentage of each data type used in weekly composite analyses are documented in a metadata narrative and in the spatial data files.
Digital formats of these ice analyses include: a) simple electronic charts in JPEG format which can be viewed with almost any web browser and/or graphics viewer, b) GIS-compatible ESRI Feature Class Geodatabase files; ESRI ARC/INFO .e00 export format coverages and c) WMO “SIGRID 3 WMO Vector Archive Format For Digital Sea Ice Charts” (WMO/TD-No. 1214, 2004 – JCOMM Technical Report No. 23). JPEG charts are labelled using WMO international sea-ice symbology.
ESRI spatial data vector files are produced in Polar Stereographic (standard parallel at 60°N) projection
SEA-ICE INFORMATION SERVICES IN THE wORld
30 31
except the Great Lakes and US East Coast charts that are in Lambert Confomal projection. All spatial data files contain sea-ice attribute information coded in the SIGRID 3 attribute format. JPEG and .e00 coverages have an associated text metadata file. SIGRID-3 hemispheric format digital charts (each hemisphere produced every other week) have FGDC/ISO211 compliant metadata as part of the WMO Standard Archive Format. Plans are in place to also produce digital data in the FGDC/ISO211 compliant metadata for all NIC products. NIC JPEG format charts are available in black and white and a colour format that adheres to the concentra-tion colours stipulated in the Ice Chart Colour Code Standard. All sea-ice analyses (in whatever format) are distributed via the NIC Internet web page and by NSIDC in formats required by their clients.
The NWSFO located in Anchorage, AK, produces analyses of ice conditions in Cook Inlet, the east-ern Bering, Chukchi and Beaufort seas three times per week on Monday, Wednesday and Friday. Data sources available for this analysis include in-situ reports and NOAA TIROS AVHRR data. Analysis products are distributed as GIF files via the NWSFO, Anchorage Internet web page. A sea surface temper-ature chart is produced on Tuesday and Thursday.
(b) Alphanumeric text messagesAlphanumeric text messages describing ice condi-tions are routinely generated and distributed for US Department of Defense customers and the NWS in ASCII and the Over-the-horizon Targeting Gold (OTG) Overlay 2 (OVLY2) message format. OTG is the US Navy standard for encoding geographic infor-mation into a man/machine readable format. These ice data messages consist of three sections including: a (LINE) section that contains a series of latitude/
longitude pairs; a narrative (NARR) line identifying and describing the ice feature (e.g. ice edge) and a remarks (RMKS) or text (TEXT) section for other descriptive comments such as a short-term forecast. The SPAROS, DIE and MIZ messages are available on the NIC web site. A complete listing of NIC alphanu-meric text messages is contained in Table 1.
All alphanumeric text messages are distributed via Defense Messaging Service (DMS) or the NIC Internet web page.
(c) Annotated satellite imagery and tactical scale analyses DOD and other authorized customers may request from the NIC tailored, high-resolution (tactical-scale) products that focus on specific geographic areas. These requests often originate from vessels operating either within the ice pack or adjacent to the ice edge. This support is typically of short duration and requires extensive coordination to schedule the collection of appropriate satellite imagery such as Synthetic Aperture Radar (SAR) (in ScanSAR or standard modes). High-resolution imagery (SAR, MODIS and DMSP/OLS) is analysed to aide vessels in the exploitation of the ice cover or more importantly, to avoid the ice and ensure safety of navigation.
Upon request, recommended paths through the ice pack can be provided to shorten vessel transit time resulting in a decrease of overall operating costs. Satellite images annotated with analysis graphics are saved in JPEG format or other generally accept-able formats and may be viewed with a variety of web browsers or graphics viewers. Dissemination of these NIC products is restricted to authorized users via the NIC Internet web page.
PRODUCT FREQUENCY DESCRIPTION
Special Arctic Oceanographic Synopsis (SPAROS) Atlantic and Pacific
Daily (year round) Depicts the ice edge, 80–100 per cent concentra-tion boundary and a 48-hour forecast for limited areas of the Arctic.
Fractures, Leads and Polynasy (FLAP)
As required (year round)
Describes the location and orientation of exploit-able openings or thin ice features in the ice pack.
Daily Ice Edge Daily Ice edge for the Northern and Southern hemispheres.
Marginal Ice Zone (MIZ) Daily Depicts the ice edge, 80–100 per cent concen-tration boundary and a 48-hour forecast for the Northern Hemisphere.
Table 1. NIC alphanumeric text messages

PART II
31
The NWSFO located in Anchorage, AK, distributes annotated NOAA TIROS AVHRR imagery when images are mostly cloud-free and therefore of value to vessels at sea. These image products are distributed as GIF files via the NWSFO, Anchorage Internet web page.
(d) Legacy ice information From the late 1950s to 1971, sea-ice information in the polar regions originated only from scat-tered ship/shore reports and visual observations from limited numbers of US Navy aerial recon-naissance missions. In 1972, the US Navy began to produce routine weekly Arctic sea-ice analyses based almost exclusively on visible/infrared data from the early NOAA polar orbiting satellites (beginning with NOAA-2) and passive microwave information from the DMSP series of satellites (beginning with NIMBUS-5). Routine Antarctic ice analyses began in 1973. In the following years, the NIC exploited a series of different US and foreign satellites to obtain global sea-ice information for all Arctic (north of 45°N) and Antarctic (south of 55°S) seas.
These historical Arctic/Antarctic sea-ice analyses (1972–present) and associated metadata (documenting available data sources) are available in analogue (paper) (1972–1994) and digital formats (1972–present for Arctic charts and from 1997–present for Antarctic charts). Paper atlases are available from the National Climatic Data Center (NCDC), the Defense Technical Information Service (DTIC) and the National Snow and Ice Data Center (NSIDC). Digital ice analysis files (ASCII GIS “export” files in ESRI .e00 format and WMO SIGRID files) are available via CD-ROM from the NSIDC or by contacting NIC through the Internet web page.
Quality controlled digital charts derived from all Arctic and Antarctic legacy ice analyses (1972–present) are available from NSIDC. A separate database of ice analyses (1984–present) is also available for the Yellow Sea, Bo Hai and Korea Bay. Great Lakes ice analyses were produced by NWSFO (Ann Arbor, MI) from 1973–1987 and by the NIC from 1988–present. These analyses are available in analogue or digital format from either the NIC, NSIDC or the Great Lakes Environmental Research Laboratory (GLERL).
(e) Ice climatologiesIn 1986, the NIC issued an Arctic/Antarctic clima-tological ice atlas based on 12 years (1972–1982) of unclassified ice analyses. Statistical parameters were derived on a bi-monthly basis by compositing 25-km gridded fields (SIGRID) of those ice analyses centred closest to the 1st and 15th of each month. In 2000, the Arctic climatology was superseded by a
monthly climatology produced under the aegis of the Gore-Chernomyrdin Commission Environmental Working Group (GCC-EWG). One set of statistics is derived from 19 years (1972–1990) of 12.5-km gridded ice analyses based on a blend of unclassified and formerly classified national security data.
Climatological ice parameters include probability of occurrence of any ice, median ice extent, ice extent extremes (including maximum and mini-mum values) and median ice concentration charts. Arial statistics (in square kilometres) for total ice extent (all grid cells with ice) and ice coverage (grid cells with ice multiplied by tenth’s of concentra-tion) are available for all weekly Arctic/Antarctic ice analyses (1972–1990). A second set of statis-tics is based on the unclassified data set only for the years 1972–1993. In November 2006, a new sea-ice data set and climatology was released by NSIDC. The NIC Sea Ice Chart and Climatology data set is an Arctic sea-ice concentration clima-tology derived from a 33-year chart series from 1972 through 2004 inclusive. The climatology consists of median, maximum, minimum, first quartile, and third quartile concentrations as well as frequency of occurrence of ice at any concentra-tion for 33-year, 10-year, and 5-year periods. Also included are the charts from which the clima-tology was derived. All products are available in EASE-Grid (binary) format with GIF browse files. The climatology products are available in GIS-compatible format as well. In 2007, it is planned that the NIC, in cooperation with the NSIDC, will produce a new set of climatology statistics similar to the recently published Arctic climatology based on the 1972–2004 chart data set for the Antarctic region.
A separate climatology based on 14 years of ice analyses (1984–1997) is also available for the Yellow Sea, Bo Hai and Korea Bay. The output grid cell size was 0.01 degrees, since the units of the coverages were degrees latitude/longitude. The Yellow Sea climatology was produced using a 1-km ground sampling distance, which ensured adequate detail in small inlets and around islands. In 2007, it is planned that the NIC, in coopera-tion with the NSIDC, will produce a new set of climatology statistics based on the 1984–2004 data set for the Yellow Sea.
A Great Lakes ice climatology based on historical ice charts (1960–1979) is available in analogue or digital format from either the NSIDC or GLERL. An updated Great Lakes data set and ice clima-tology (NOAA Great Lakes Ice Atlas, Assel, 2003) based on analyses from 1973–2002 is available from the Great Lakes Environmental Research Laboratory (GLERL).

32 33
(f) Iceberg reports Since 1913, the USCG has been tasked with the management and operation of the IIP. This inter-nationally funded organization monitors and distributes information on the southeastern, southern and southwestern limit of all known ice (LAKI) in the North Atlantic/Grand Banks region of Newfoundland. During the iceberg season (February–August), this information consists of two (every 12 hours) message bulletins and two daily radio facsimile charts illustrating the extent of all known ice.
A 0000 UTC chart is broadcast at 0438 UTC and a 1200 UTC chart is broadcast at 1600 and 1810 UTC. Data sources used in the analysis include visual observations from regular aerial reconnaissance flights (from both US and Canadian sources) and ship reports. Size and time of sighting for all reported
icebergs are routinely entered into an iceberg fore-cast model. Initialized daily with surface wind, ocean current, sea wave and sea surface tempera-ture information, this model predicts iceberg drift and estimated rates of deterioration. Model output is critical in predicting movement and longevity of icebergs in North Atlantic shipping lanes.
Iceberg navigational hazard information is distrib-uted via various broadcasts including telephone and HF facsimile, INMARSAT SafetyNET, SITOR, NAVTEX and the Internet. Broadcast times and frequencies of messages and iceberg graphics are available via the IIP Internet web page. Refer to the annual Announcement of Services for specific product information.
Large tabular icebergs calving from the numerous ice shelves in the Antarctic are identified and tracked by the NIC. Due to the enormous numbers of icebergs
PRODUCT FREQUENCY DESCRIPTION
Special Arctic Oceanographic Synopsis (SPAROS) Atlantic and Pacific
Daily (year round) Depicts the 48-hour forecast of the ice edge location.
Great Lakes 30-day Forecast Twice per month, within three working days of the 1st or 15th (1 Dec–1 Mar).
Graphic and text product produced under the auspices of the North American Ice Service by NIC and Canadian Ice Service (CIS) ice forecasters.
Great Lakes Seasonal (90-day) Outlook
Annually (1 Dec) Depicts climatology and forecast ice edge and inner pack boundaries. Produced under the auspices of the NAIS by NIC and CIS ice forecasters.
West and East North American Arctic 30-day Forecast
Monthly (week of the 1st of each month). Plans are to issue the Arctic 30-day fore-casts twice per month near the 1st and 15th under the auspices of the NAIS in 2005.
Depicts forecast ice edge and inner pack boundaries. Plans are to expand the content after the forecast is produced jointly by NIC and CIS under the auspices of the NAIS.
West Arctic Seasonal (90-day) Outlook
Annually (1 June) Forecasts opening and closing dates of navigational checkpoints and ports in the Chukchi and Beaufort seas and the Western Canadian Archipelago, ranks severity of ice conditions. The outlook is produced cooperatively by the NIC and CIS under the auspices of the NAIS.
Eastern Arctic Seasonal (90-day) Outlook
Annually (1 June) Forecasts opening and closing dates of navigational checkpoints and ports in Baffin Bay, Eastern Canada and the Eastern Canadian Archipelago, ranks severity of ice conditions. The outlook is produced cooperatively by the NIC and CIS under the auspices of the NAIS.
Ross Sea-McMurdo Sound Seasonal (90-day) Outlook
Annually (15 Oct) Depicts climatological and forecast ice edge and inner pack boundaries for the Ross Sea shipping and research season.
SEA-ICE INFORMATION SERVICES IN THE wORld
Table 2. Forecasts issued by the NIC

PART II
33
in this region, candidate icebergs must measure at least 10 nautical miles along the long axis. In most cases, these icebergs are detected and tracked using DMSP/OLS and TIROS/AVHRR visible/infrared imagery and Quikscat scatterometer imagery. All icebergs are also assigned “names” based upon the Antarctic quadrant in which they originate. A text summary of all known icebergs is issued on a weekly basis and input quarterly into a historical archive (1976–present). Both iceberg products are available via the NIC Internet web page.
(g) Special request servicesOther NIC services are available via special request. These services include: Optimum Track Ship Routing (OTSR) recommendations, pre-sail ship briefings and ship rider support. OTSR recommendations, highlight-ing the preferred and safest route through the ice pack are available to all US Government vessels. This support is provided via text message or annotated imagery.
The NIC provides pre-sail ship briefings emphasizing NIC support capabilities and legacy/climatological information for mission planning. On a select basis and dependent upon availability of aircraft, the NIC aerial reconnaissance team provides on-scene visual ice observations. Similarly, enlisted Navy Aerographer mates and civilian analysts are also available for on-scene ship-rider ice interpretation and guidance services.
Samples of output products are given in Annex XII.
4. IceforecastsReal-time analyses of sea-ice conditions are produced through the integration of remotely sensed and in-situ oceanographic and meteorological data. These analyses represent the baseline or starting point from which formation, ablation and drift of sea ice are predicted and assembled into a NIC ice forecast. Predicted changes to these ice conditions range from short-term (24–168 hour) site-specific tactical forecasts to monthly and seasonal (90-day) predic-tions. Theoretical ice thicknesses, weather model output and PIPS 2.0 model output for variable time periods (24–96 hours) along with other model and algorithm output are used to produce short-term forecasts.
These site-specific operational forecasts are used primarily to ensure safety of navigation. In contrast to the specific nature of short-term ice forecasts, seasonal forecasts focus on the expected extent of summer ice cover and the opening/closing dates of coastal shipping lanes. Other forecasts produced by US Government organizations include ice five-day forecasts three times per week on Monday, Wednesday and Friday produced by the NWSFO in Anchorage Alaska for Alaskan waters.
Forecasts issued by the NIC are listed in Table 2.
5. PublicationsNational Ice Center (NIC)
Analyses
(a) Annual Ice Atlases – compilation of weekly sea-ice analyses in paper book format from 1972–1994 for the Arctic, and from 1973–1994 for the Antarctica. Available from the National Climatic Data Center (see paragraph 6 for contact information.)
(b) Ice Observation Handbook – prepared by the NIC Aerial Ice Reconnaissance Unit. It is used as an aid to understanding the characteristics of sea ice. The handbook also contains a description of standard techniques and procedures used in sea-ice obser-vation and reporting.
Climatology
(a) Sea Ice Climatic Atlases – prepared by Naval Oceanographic Command Detachment (NOCD), Asheville NC for NIC. Statistical parameters were derived on a bi-monthly basis by compositing NIC Arctic/Antarctic ice analyses centred closest to the 1st and 15th of each month. Climatological parameters include: probability of occurrence of all ice, mean ice extent, ice extent extremes (maximum and minimum), mean ice concentration, mean ice concentration when ice is present and extent of 5/10th’s or more of ice charts for the Arctic and Antarctic. The Arctic ice summaries (NAVAIR 50-1C-541 and 542) are derived from 574 weekly NIC ice analyses produced from 1972–1982. The Antarctic ice summaries (NAVAIR 50-1C-540) are derived from 521 weekly ice analyses produced from 1973–1982. These are available from the National Climatic Data Center (NCDC) (see paragraph 6 for contact information).
Great Lakes Environmental Research Laboratory (GLERL)
(a) NOAA Atlas – An Electronic Atlas of Great lakes Ice Cover Winters: 1973–2002 – prepared and distrib-uted by GLERL. Climatology based on compilation of historical ice charts (1973–2002); includes the data set. Apart from the Great Lakes climatology, GLERL publishes various ice related publications through its web site (see section 6 for contact information).
National Snow and Ice Data Center (NSIDC)
Analyses
(a) Environmental Working Group Joint US Russian Sea Ice Atlas Version 1.0, 1 September 2000 (EWG).

SEA-ICE INFORMATION SERVICES IN THE wORld
34 35
Contains graphic and digital files of NIC Analyses from 1972–1994. Available from the National Snow and Ice Data Center (see paragraph 6 for contact information).
(b) National Ice Center Arctic sea ice charts and climatologies in gridded format. Edited and compiled by F. Fetterer and C. Fowler. Boulder, Colorado USA: National Snow and Ice Data Center. Contains graphical and digital files of Arctic sea-ice charts series from 1972 through 2004 inclusive.
(c) NSIDC plans to issue a new publication of Antarctic analyses from 1972–2004 in 2007.
Climatology
(a) Environmental Working Group Joint US Russian Sea Ice Atlas Version 1.0, 1 September 2000 (EWG). In 2000, the Gore-Chernomyrdin Commission Environmental Working Group (GCC-EWG) CD was published by NSIDC. The CD contains maxi-mum, mean and median ice climatology. The information is derived from 19 years (1972–1990) of 12.5-km gridded ice analyses based on a blend of unclassified and formerly classified national security data. Climatological ice parameters include probability of occurrence of any ice, ice extent extremes (including maximum and mini-mum values) and median ice concentration charts. Areal statistics (in square kilometres) for total ice extent (all grid cells with ice) and ice coverage (grid cells with ice multiplied by tenth’s of concentra-tion) are available for all weekly Arctic/Antarctic ice analyses.
A second set of statistics is based on the unclas-sified charts from 1972–1993. Available from the National Snow and Ice Data Center (see paragraph 6 for contact information).
(b) National Ice Center Arctic sea ice charts and clima-tologies in gridded format. Edited and compiled by F. Fetterer and C. Fowler. Boulder, Colorado USA: National Snow and Ice Data Center. Contains graphical and digital files of Arctic sea-ice concen-tration climatology derived from a 33-year chart series from 1972 through 2004 inclusive. The climatology consists of median, maximum, minimum, first quartile, and third quartile concen-trations as well as frequency of occurrence of ice at any concentration for 33-year, 10-year, and 5-year periods.
(c) NSIDC plans to issue a new publication of Antarctic climatology for the Antarctic through to the year 2004 in 2007.
(d) Apart from the EWG Climatology, NSIDC publishes various snow and ice related data sets and publi-cations through its web site (see paragraph 6 for contact information).
International Ice Patrol (IIP)
(a) Report of the International Ice Patrol in the North Atlantic – an annual report summarizing the ice, meteorological and oceanographic condi-tions during the North Atlantic iceberg season (February–August). Annual reports are available for the iceberg seasons of 1913 to the present. Reports of research and development projects may also be included in these reports.
(b) Announcement of International Ice Patrol Services – this description of IIP products provides the type of product, the transmission schedule and any special procedures required by the mariner to access IIP information. This announcement is updated in December of each year. The IIP also outlines desired information for iceberg reports from ships. The document is available on the IIP web site, listed in the next section.
6. MailingandInternetaddressesMailing addresses
Director National Ice Center NOAA Satellite Operations Center4231 Suitland Road Washington, DC 20395 USATelephone: +1 (301) 394-3100/3200 (Fax)E-mail: [email protected]
CommanderInternational Ice Patrol1082 Shennecossett RoadGroton, CT 06340-6095USATelephone: +1 (860) 441-2631/-2773 (Fax) E-mail: [email protected]
National Climatic Data CenterFederal Building151 Patton AvenueAsheville NC 28801-5001USATelephone: +1 (828) 271-4800/4876 (Fax)E-mail: [email protected]
National Geophysical Data Center E/GC 325 Broadway Boulder, Colorado 80305-3328 USATelephone: +1 (303) 497-6826/6513 (Fax)E-mail: [email protected]
Defense Technical Information Center Attn: DTIC BCR 8725 John J. Kingman RoadFort Belvoir, VA 22060-6218 USA

PART II
35
Telephone: +1 (703) 767-8274/8228 (Fax) or +1 (800) 225-3842E-mail: [email protected]
National Technical Information Service 5285 Port Royal Road Springfield, VA 22161USATelephone: +1 (800) 553-6847 E-mail: [email protected]/National Weather Service
National Centers for Environmental PredictionCentral Operations Room 301 WWB 5200 Auth RoadCamp Springs, MD 20746USATelephone: +1 (301) 763-8441
User Services – National Snow and Ice Data CenterCIRES Campus Box 449University of ColoradoBoulder, CO 80309USATelephone: +1 (303) 492-1143/1149 (Fax)E-mail: [email protected] E-mail: [email protected]
Fleet Numerical Meteorology and Oceanography Center
Commanding Officer7 Grace Hopper Ave Stop 1Monterey, CA 93943-5501USATelephone: +1 (831) 656-4302/4325
Commanding OfficerNaval Oceanographic Office1002 Balch BlvdStennis Space Center, MS 25922-5001USA24-hour Customer Support: E-mail: [email protected] Telephone: +1 (228) 688-5176Public Affairs:E-mail: [email protected] Telephone: +1 (228) 688-5649/4920 (Fax)
Polar Science CenterApplied Physics LaboratoryUniversity of Washington1013 NE 40th StreetBox 355640Seattle, WA 98105-6698USATelephone: +1 (202) 546-1317/-3142 (Fax)E-mail: [email protected]
Anchorage Forecast Office6930 Sand Lake RoadAnchorage, AK 99502 USATelephone: +1(907) 266-5138/-5188 (Fax)E-mail: [email protected]
Great Lakes Environmental Research Laboratory (GLERL)2205 Commonwealth BlvdRoom 212Ann Arbor, MI 48105-2945
USATelephone: +1 (734) 741-2393/-2055 (Fax)E-mail: [email protected]
National Weather Service Forecast OfficeCleveland, OhioFederal Facilities Building Cleveland Hopkins Airport Cleveland, OH 44135USATelephone: +1 (216) 265-2370E-mail: [email protected]
Air Force Weather AgencyOffice of Public Affairs106 Peacekeeper Drive Suite 2N3Offutt AFB NE, 68113-4039USATelephone: +1 (402) 232-8166/+1 (402) 294-7890E-mail: [email protected]
Internet addresses
NIC: http://www.natice.noaa.gov USCG IIP: http://www.uscg.mil/lantarea/
iip/home.html NCDC: http://lwf.ncdc.noaa.gov/oa/
ncdc.htmlNGDC: http://www.ngdc.noaa.gov/ DTIC: http://www.dtic.mil/ http://www.dtic.mil/dtic/order.html DTIS: http://www.ntis.gov/ NWS/NCEP: http://www.nco.ncep.noaa.gov/ /Drift http://www.nco.ncep.noaa.gov/
pmb/nwprod/analysis/polar/drf/00/index_s.shtml
NWS/NCEP (MRF): http://www.nco.ncep.noaa.gov/pmb/products/mrf/mrfinfo.shtml
NWS/NCEP/MMAB: http://polar.ncep.noaa.gov/seaice/Forecasts.html
NSIDC: http://nsidc.orgFNMOC: https://www.fnmoc.navy.mil/ FNMOC (NOGAPS): https://www.fnmoc.navy.mil/
PUBLIC NAVOCEANO: http://www.navo.hpc.mil/index.html

SEA-ICE INFORMATION SERVICES IN THE wORld
36 37
UW/PSC/IABP: http://iabp.apl.washington.edu http://www.apl.washington.edu/
contact_us/contact.html NWFSO, Anchorage: http://pafc.arh.noaa.gov/index.
php http://pafc.arh.noaa.gov/ice.php GLERL: http://www.glerl.noaa.gov NWFSO, Cleveland: http://www.erh.noaa.gov/er/cle/AFWA: https://afweather.afwa.af.mil/ SAA (RADARSAT): http://lwf.ncdc.noaa.gov/oa/
satellite/satelliteinventories.html
SOUTHERN HEMISPHERE
ARGENTINA1. Organization Sea-ice information and support services in Argentina are provided by the Argentine Navy Meteorological Service (SMARA), a branch of the Naval Hydrographic Service (SHN), and by the icebreaker A.R.A. Almirante Irizar (LOAI), upon request, only when sailing or operat-ing in Antarctic waters (mainly in Weddell and Eastern Bellingshausen seas or near the Antarctic Peninsula). Plain text weekly bulletin describing sea-ice fields is issued by e-mail and posted on the web page of SMARA and SHN. No sea-ice charts or coded information are regularly prepared and transmitted, except for sea-ice edge and iceberg locations (when available) transmitted through the Notice to Mariners for NAVAREA VI.
Ships may obtain sea-ice information or operative support services provided the request is received in advance at SMARA or on board the icebreaker while sailing in Antarctic waters.
2. DataacquisitionData sources are based on low (APT) and high-resolu-tion satellite images, sea-ice observations from shore and ship stations (IILL and IISS codes after NIC, USA), historical and reference operational data obtained from analysis prepared by NIC, USA, and ship sea-ice and iceberg reports.
Six Antarctic Argentine stations report sea ice and icebergs twice a week whilst the Argentine icebreaker and other auxiliary ships report four daily sea-ice observations when sailing or operating in Antarctic waters, and only if sea-ice concentrations are equal or greater than 1/10.
Visual aerial reports (most of them from helicopters based on the icebreaker) are drafted during glaciologi-cal exploration flights (non routine).
3. OutputproductsThe following information is available upon request for Weddell Sea zones, as well as those of adjacent waters
of the Antarctic Peninsula, Eastern Bellingshausen Sea and sub-Antarctic waters of adjacent South Atlantic and Pacific oceans:
(a) Routine weekly plain text sea-ice bulletin issued by SMARA(i) Describing sea-ice fields of night areas: pasaje
Drake (Drake Passages), islas Orcadas del Sur y adyacencias (South Orkney Islands and surrounding), Mar de la Flota e islas Shetland del Sur (Bransfield Strait and South Shetland Islands), canales hasta isla Belgrano (channels up to Adelaide Island), Bellingshausen y bahia Margarita (Bellingshausen Sea and Marguerite Bay), estrecho Antartic y Golfo Erebus y Terror (Antartic Sound and Erebus and Terror Gulf), Weddell general (Weddell general), Weddell NW (Northwestern Weddell) and Weddell Sur (Southern Weddell).
(ii) Sea-ice edge to 00 to 131°W.(iii) Iceberg positions in NAVAREA VI (south of
latitude 35°50’S up to Antarctic coasts and from South American coasts up to longi-tude 20°W).
(b) Other coded and plain language information(i) Sea-ice edge position and concentrations,
openings, stages of development, sea-ice fields under processes of pressure and areas of weakness may be provided by the Glaciological Division in Buenos Aires for specific locations, in plain language or coded messages.
(ii) Sea-ice edge position, openings and a sea-ice concentration outlook may be provided by the icebreaker A.R.A. Almirante Irizar while sailing or operating in Antarctica (see paragraph 1).
4. ForecastsSea-ice forecasts, mostly constrained to specific loca-tions, are prepared upon request in plain language by SMARA’s Glaciological Division at Buenos Aires. The forecasts specially refer to sea-ice edge movement, changes in concentrations, areas of pressure and zones of weakness.
5. PublicationsThere are no regular publications, however, two sea-ice atlases have been published for Antarctic waters between 0°W and 90°W; one covering the period 1972–1990 and the other for 1973–1982. Statistics on sea-ice boundaries for nonstandard periods since 1972 may be compiled and made available to users.
6. MailingandInternetaddressesServicio Meteorológico de la Armada Argentina, Glaciología

PART II
37
Edificio Libertad Comodoro Py 2055, 15-37C1104BEA Buenos AiresArgentinaTelefax: +54 11 43172309 E-mail: [email protected] [email protected] Internet: http://www.hidro.gov.ar
Icebreaker A.R.A. Almirante IrizarAntarctic HF frequency: 4490 KhzVHF frequency: channel 16Telephones: Inmarsat phones: A 1540117 (Telephone–Telex – Data)Iridium: 00 8816 41417907Satelital: +54 11 45116151/52MOVICOM: +54 11 40446200E-mail: [email protected]
AUSTRALIA1. OrganizationDuring the Austral summer (approx November to March) the Antarctic Meteorological Centre at the Australian Station, Casey, Antarctica, provides on request sea-ice concentration analyses for any Antarctic coastal area between around 180°E and 20°E. These analyses are provided via e-mail.
NOAA satellite AVHRR imagery of the following coastal areas are routinely updated on the World Wide Web (currently provided to registered users, but subject to change): Terra Nova Bay area, Cape Adare, Dumont D’Urville area; Wilkes Coast area, Sabrina coast area, Casey area, Shackleton Ice Shelf area, West Ice Shelf area,
Davis area, Mawson area, Enderby Land area, Ragnhild Coast area. These images include both infrared and visi-ble AVHRR data during the Austral summer and infrared data only during the Austral winter. The images on the web are in GIF format.
As of 2004 the International Antarctic Weather Forecasting Handbook had been prepared under the auspices of a number of organizations, including the British Antarctic Survey (BAS), the Australian Bureau of Meteorology, the Scientific Committee on Antarctic Research (SCAR), the WMO International Commission on Polar Meteorology and the Council of Managers of National Antarctic Programmes (COMNAP), and is available in hardcopy version and in PDF format (at http://www.bom.gov.au/weather/ant/handbook/handbook.shtml).
2. MailingandInternetaddressesBureau of Meteorology Tasmania/Antarctica RegionGPO Box 727, Hobart111 Macquarie StreetAUSTRALIA, 7001Telephone: +61 3 6221 2021Telefax: +61 3 6221 2080Internet:http://www.bom.gov.au/weather/ant/ (Antarctic and Southern Ocean Weather)http://www.bom.gov.au/weather/tas/inside/amc/satindex.shtml (satellite imagery)
NEWZEALAND
Since the first edition of the WMO publication Sea-Ice Information Services in the World (1981) the New Zealand meteorological service is not producing routine sea-ice analyses. No sea-ice information is available.


ANNEXES
SAMPLE CHARTS AND OUTPUT PRODUCTS
OF NATIONAL SERVICES


41
Figure I-1 – Regional weekly ice chart for the Eastern Canadian Arctic for 1 January 2004.
ANNEX I
CANADA
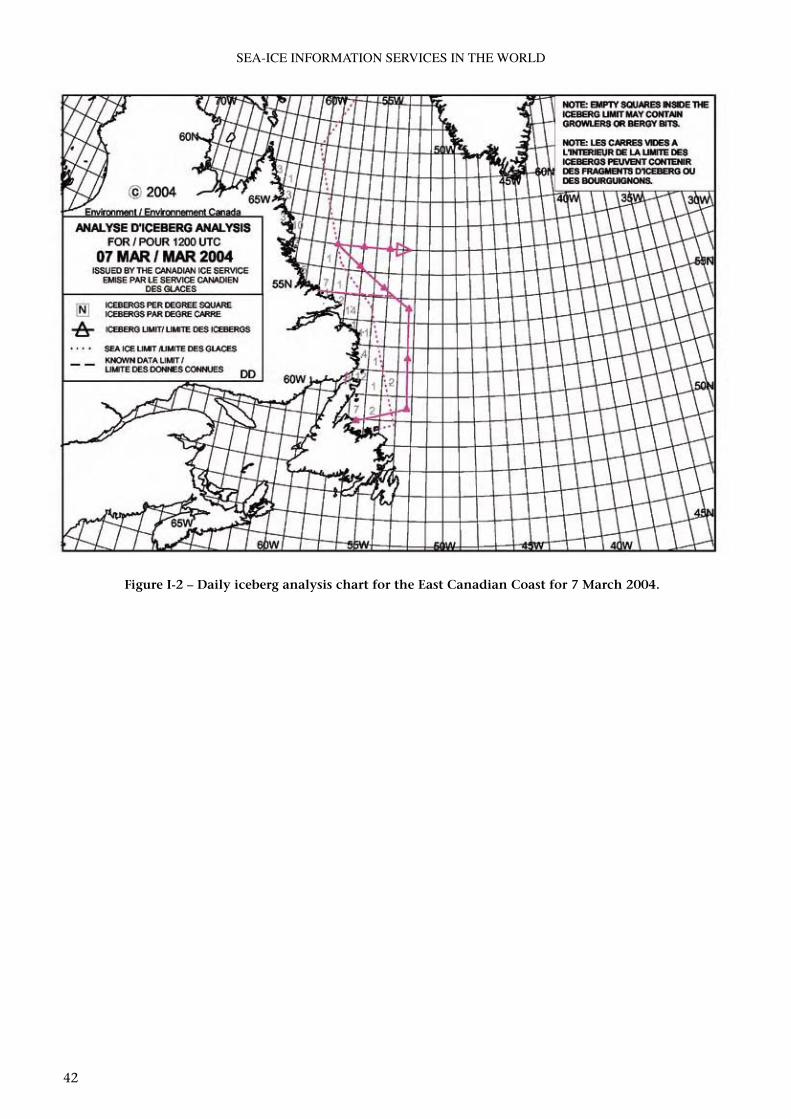
SEA-ICE INFORMATION SERVICES IN THE wORld
42
Figure I-2 – Daily iceberg analysis chart for the East Canadian Coast for 7 March 2004.

ANNEX I – CANAdA
43Figure I-3 – Daily analysis chart for Newfoundland.

SEA-ICE INFORMATION SERVICES IN THE wORld
44
Figure I-4 – Ice reconnaissance chart for the Gulf of Boothia for 12 September 2004.

ANNEX I – CANAdA
45
Figure I-5 – RADARSAT image analysis chart for the Labrador Coast for 9 March 2004.

SEA-ICE INFORMATION SERVICES IN THE wORld
46
Figure I-6 – Daily Ice Hazard Bulletin for Newfoundland area for 28 February–1 March 2005.
Newfoundland
FICN18 CWIS 281449 ICE HAZARD BULLETIN FOR THE EAST COAST OF NEWFOUNDLAND AND LABRADOR ISSUED BY ENVIRONMENT CANADA AT 1500 UTC SATURDAY 28 FEBRUARY 2004 FOR TODAY AND SUNDAY. THE NEXT SCHEDULED BULLETIN WILL BE ISSUED AT 1500 UTC SUNDAY.
ICE EDGE AT 1500 UTC ESTIMATED FROM NEWFOUNDLAND NEAR 4955N 5530W TO 4955N 5500W TO 5010N 5400W TO 5335N 5135W TO 5405N 5150W TO 5525N 5415W TO 5615N 5815W TO 6125N 6030W THEN NORTHEASTWARD.
SOUTH COAST SOUTHEASTERN GRAND BANKS NORTHERN GRAND BANKS FUNK ISLAND BANK. ICE FREE.
EAST COAST. OPEN WATER.
NORTHEAST COAST. 3 TENTHS MAINLY GREYWHITE ICE WITH 1 TENTH FIRST YEAR ICE SHOREWARD OF THE ICE EDGE. ELSEWHERE OPEN WATER.
BELLE ISLE BANK. 6 TENTHS MAINLY FIRST YEAR ICE WEST OF THE ICE EDGE. EAST OF THE ICE EDGE ICE FREE.
BELLE ISLE EASTERN HALF. 9 TENTHS MAINLY FIRST YEAR ICE.
SOUTH LABRADOR COAST. ICE WARNING IN EFFECT. STRONG ICE PRESSURE ALONG THE COAST BETWEEN CARTWRIGHT AND SPOTTED ISLAND IS EXPECTED TO CONTINUE THROUGH SUNDAY. 9 PLUS TENTHS MAINLY FIRST YEAR ICE.
MID LABRADOR COAST. ICE WARNING IN EFFECT. STRONG ICE PRESSURE ALONG THE COAST SOUTHEAST OF HOPEDALE IS EXPECTED TO CONTINUE THROUGH SUNDAY. 7 TENTHS MAINLY FIRST YEAR ICE WITH A TRACE OF OLD ICE. COMPACTED FIRST YEAR ICE ALONG THE COAST.
SOUTH LABRADOR SEA. WEST OF THE ICE EDGE 4 TENTHS MAINLY FIRST YEAR ICE. ELSEWHERE MAINLY BERGY WATER.
CONTACT ECAREG CANADA VIA MARINE RADIO FOR ROUTING ADVICE. THE EAST COAST ICE ANALYSIS CHARTS CAN BE COPIED ON CFH AT 2222 UTC AND 0001 UTC AND ON VCO SYDNEY AT 1142 UTC AND 2331 UTC.
END/NH

ANNEX I – CANAdA
47
Figure I-7 – RADARSAT imagery for Lake Erie.

48
Figure II-1 – Sea-ice condition in the Bohai Sea on 11 February 2005 by the MODIS of TERRA (EOS).
Figure II-2 – The analysed chart of ice thickness and edge of the Bohai Sea on 11 February 2005.
ANNEX II
CHINA

ANNEX II – CHINA
49
Figure II-3 – The fifth-day forecast of ice thickness from 20 February 2005 in the Bohai Sea by the PIC ice model.
Figure II-4 – The fifth-day forecast of ice concentration from 20 February 2005 in the Bohai Sea by the PIC ice model.

SEA-ICE INFORMATION SERVICES IN THE wORld
50
Figure II-5 – The fifth-day forecast of ice drift (arrow) and thickness (isoline) from 20 February 2005 in the Bohai Sea with the operational ice model.

51
Figure III-1 – Ice chart for Danish Waters.
ANNEX III
DENMARK

SEA-ICE INFORMATION SERVICES IN THE wORld
52
Figure III-2 – Weekly ice analysis for Greenland waters, 20 March 2005
Figure III-4 – Cape Farewell ice chart for 28 April 2004.
Figure III-3 – West Greenland ice chart for 19 March 2005.

53
Figure IV-1 – Ice chart for the Gulfs of Finland and Riga for 16 March 2005.
ANNEX IV
ESTONIA

54
Figure V-1 – Daily ice chart for the Baltic Sea for 26 February 2005.
ANNEX V
FINLAND

ANNEX V – FINlANd
55
ANNEX V
FINLAND
Figure V-2 – Ice concentration and drift forecast for 10–13 March 2005 (t+12h, +24h, +36h
and 48h).
Figure V-3 – Cumulated ice ridging forecast for 10-13 March 2005 (t+12h, +24h, +36h and 48h).

56
Figure VI-1 – Ice chart for the Baltic proper northward of 56°N, 9 March 2006.
ANNEX VI
GERMANy

57
ANNEX VI – GERMANY
ANNEX VI
GERMANy
Figure VI-2 – Ice chart for the southern Baltic west of 15°E, 7 February 2006.
Figure VI-3 – Detailed ice chart of the German Baltic coast, 28 February 2006.
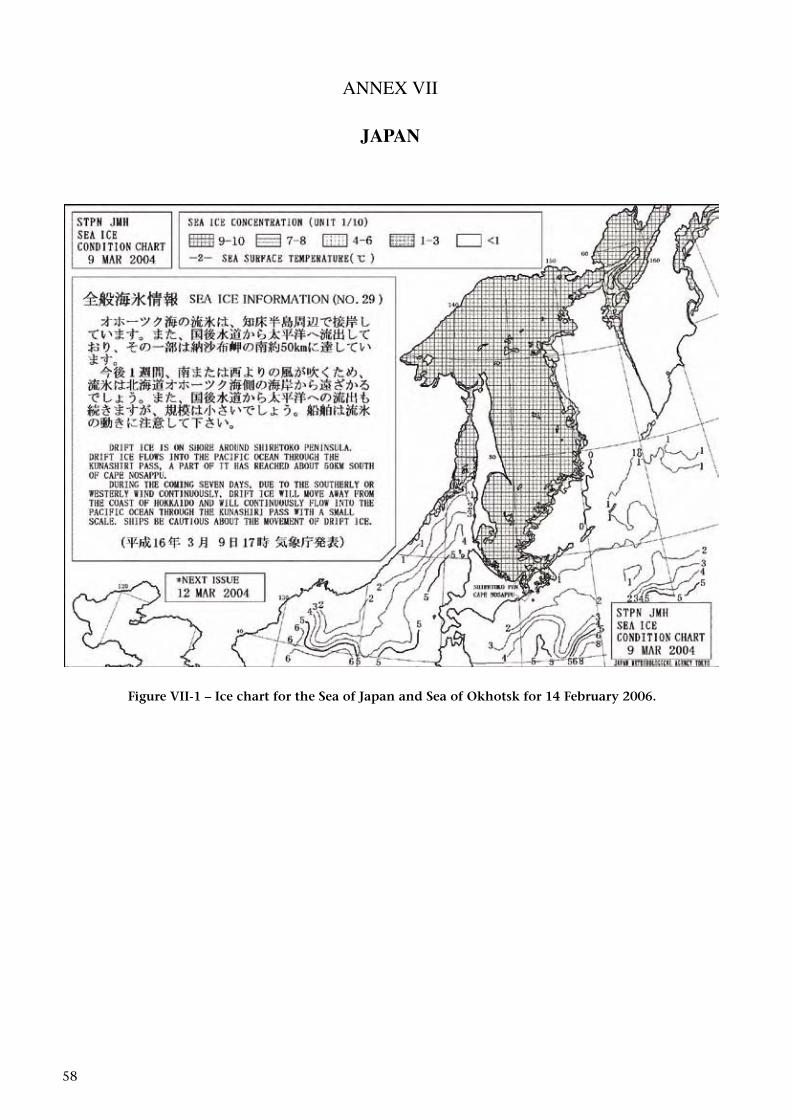
58
Figure VII-1 – Ice chart for the Sea of Japan and Sea of Okhotsk for 14 February 2006.
ANNEX VII
JAPAN

ANNEX VII – JAPAN
59
Figure VII-2 – Ice condition forecast charts for 17 and 22 February 2006 for the southern part of the Sea of Okhotsk (initial conditions from 15 February 2006).

60
Figure VIII-1 – Weekly ice chart for the Atlantic sector of the Arctic for 2 March 2005.
Figure VIII-2 – High-resolution ice chart for the Svalbard area for 22 February 2005.
ANNEX VIII
NORWAy

61
ANNEX VIII
NORWAy
Figure IX-1 – Ice chart for the Baltic proper for 22 February 2005.
ANNEX IX
POLAND

62
Figure X-1 – Common usage ice chart for the Arctic for 1–2 March 2005.
Figure X-2 – Detailed ice chart for the East Siberian Sea for 28 February–2 March 2005.
ANNEX X
RUSSIANFEDERATION

63
ANNEX X– RUSSIAN FEdERATION
Figure X-3 – Forecast charts for the Arctic sea-ice drift (a) and currents and level elevation (b), 10 February 2005.
Figure X-4 – Regional ice chart for the Indian Ocean sector of Antarctic for 1–10 September 2004.
(a) (b) )b( )a(

64
SEA-ICE INFORMATION SERVICES IN THE wORld
Figure X-5 –Detailed ice chart for the Sea of Okhotsk and Tatar Strait for 14–15 February 2005.

65
ANNEX X– RUSSIAN FEdERATION
Figure X-6 – Annotated visible imagery from MODIS EOS Terra (mosaic of channels 1, 2 and 4) and detailed ice charts for the Caspian Sea for 14–15 February 2005.
(b)
(a)
(b)

66
SEA-ICE INFORMATION SERVICES IN THE wORld
Figure X-7 – Daily ice chart for the gulfs of Finland and Riga for 3 March 2004.
ANNEX XI
SWEDEN

67Figure XI-1 – Ice conditions and sea surface temperature chart for the Baltic Sea for 10 March 2005.
ANNEX XI
SWEDEN

68
SEA-ICE INFORMATION SERVICES IN THE wORld
(b) RADARSAT (ScanSAR Wide mode) from 8 March 2005. Captured and processed by KSAT in Tromsø, Norway, and re-processed by Finnish Institute of Marine Research. By courtesy of RADARSAT
International.Figure XI-2 – Samples of annotated imagery used by SMHI.
(a) Mosaic of NOAA AVHRR channels 1, 2 and 4 for 1 April 2004. Captured and processed at SMHI.
(a)
(b)

69
Figure XII-1 – Iceberg chart produced by the US Coast Guard International Ice Patrol for 14 May 2004.
ANNEX XII
UNITED STATES

70
SEA-ICE INFORMATION SERVICES IN THE wORld
Figure XII-2 – Alphanumerical text message and corresponding graphical output for the ice edge position (Daily Ice Edge (DIE)) from 17 March 2005.

71
ANNEX XII– UNITEd STATES
Figure XII-3 – Superimposed NOAA AVHRR and RADARSAT imagery for the Bering Sea for 23 December 1998.

72
SEA-ICE INFORMATION SERVICES IN THE wORld
Figure XII-4 – Ice chart for the Eastern Bering Sea for 9–10 March 2006.

73
ANNEX XII– UNITEd STATES
Figure XII-5 – Black and white ice chart for the Chukchi Sea for 06–10 March 2006.

74
SEA-ICE INFORMATION SERVICES IN THE wORld
Figure XII-6 – Ice chart for the Northern Chesapeake Bay for 25 January 2005.

75
ANNEX XII– UNITEd STATES
Figure XII-7 – Ice chart for the Ross Sea Central for 6–10 March 2006.

76
SEA-ICE INFORMATION SERVICES IN THE wORld
Figure XII-8 – Northern Hemisphere sea-ice analysis from ESRI ArcView for 14–18 February 2005.

77
ANNEX XII– UNITEd STATES
Figure XII-9 – Annotated special support product DMSP/OLS visible satellite image depicting tabular icebergs and sea ice in the Ross Sea on 1 February 2005 at 2032 UTC.
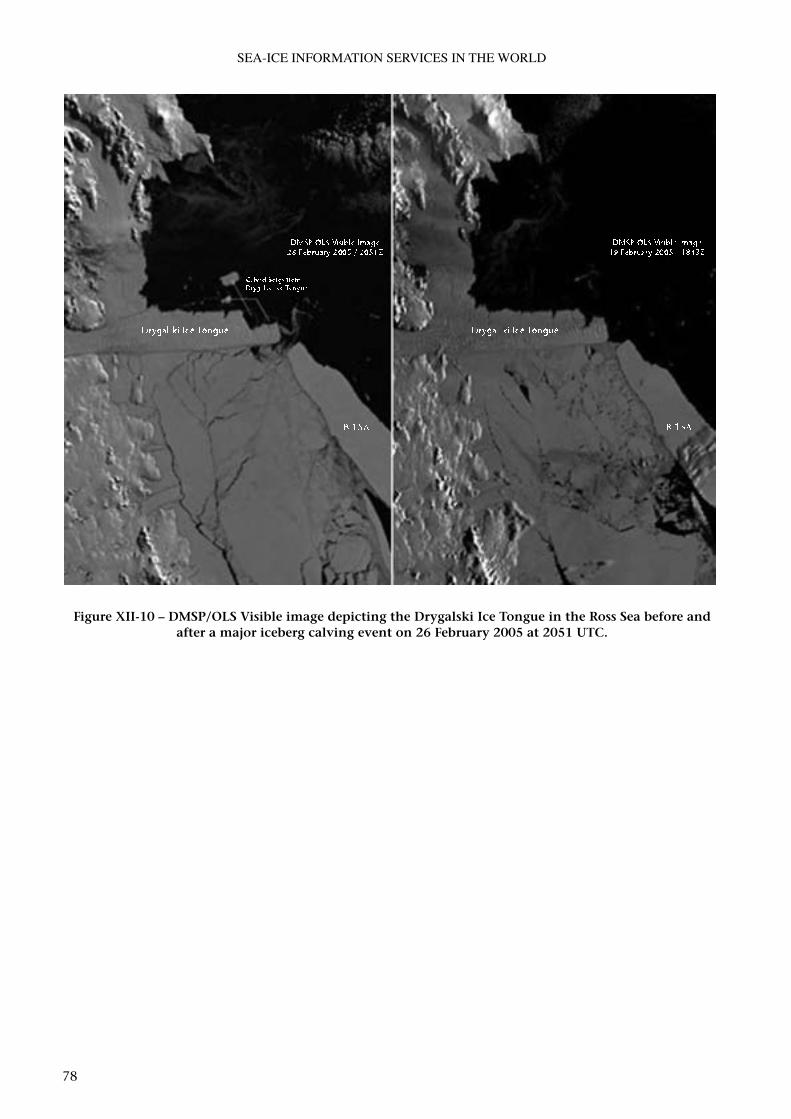
78
SEA-ICE INFORMATION SERVICES IN THE wORld
Figure XII-10 – DMSP/OLS Visible image depicting the Drygalski Ice Tongue in the Ross Sea before and after a major iceberg calving event on 26 February 2005 at 2051 UTC.

79
ANNEX XII– UNITEd STATES
Figure XII-11 – Annotated special support product MODIS visible satellite image depicting the ice cover in the Potomac River, Maryland on 2 February 2004 at 1545 UTC.

80
Figure XIII-1 – NAIS ice chart for the Eastern Great Lakes for 10 March 2005.
ANNEX XIII
NORTHAMERICANICESERVICE