sea area 6 technical report – plankton ecology of the ... · the plankton can be simply divided...
TRANSCRIPT

SEA area 6 Technical Report – Plankton Ecology of the Irish Sea
K. Kennington & W. Ll. Rowlands
University of Liverpool Port Erin Marine Laboratory
Breakwater Road Port Erin
Isle of Man IM9 6JA

1
SEA area 6 Technical Report – Plankton Ecology of the Irish Sea
K. Kennington & W. Ll. Rowlands
University of Liverpool Port Erin Marine Laboratory
Breakwater Road Port Erin
Isle of Man IM9 6JA
This documents was produced as part of the UK Department of Trade and Industry’s offshore energy Strategic Environmental Assessment programme. The SEA programme is
funded and managed by the DTI and coordinated on their behalf by Geotek Ltd and Hartley Anderson Ltd.
Crown Copyright, all rights reserved

2
CONTENTS 1 INTRODUCTION ......................................................................................................3 2 STUDY AREA ............................................................................................................4 3 BIOLOGICAL BACKGROUND..............................................................................6 4 PHYSICAL PROCESSES AFFECTING THE PLANKTON ...............................8
4.1 Nutrient Salts ......................................................................................................9 5 PHYTOPLANKTON ...............................................................................................13
5.1 Bulk Chlorophyll Analysis...............................................................................13 5.2 Regional Variation in Chlorophyll concentrations. ......................................15 5.3 Phytoplankton Community Structure ............................................................18
5.3.1 Typology A: Regions of Freshwater Input (ROFI’s) .................................18 5.3.2 Typology B: Coastal Frontal Zones............................................................19 5.3.3 Typology C: Offshore Mixed Waters.........................................................19 5.3.4 Typology D: Offshore Waters of Transitional Stability.............................19 5.3.5 Typology E: Offshore Seasonally Stratified Waters ..................................19
5.4 Phytoplankton Blooms and Harmful Algal Events .......................................21 6 NANOPLANKTON..................................................................................................22 7 MICROZOOPLANKTON ......................................................................................24 8 ZOOPLANKTON.....................................................................................................25
8.1 Community composition. .................................................................................25 8.2 Copepods in the Irish Sea ................................................................................26
8.2.1 General composition...................................................................................26 8.2.2 Calanus species ..........................................................................................29
8.3 Other Crustaceans............................................................................................33 8.3.1 Decapod larvae ...........................................................................................33 8.3.2 Cladocera ....................................................................................................33 8.3.3 Cirripede .....................................................................................................36 8.3.4 Euphausids..................................................................................................36
8.4 Larvaceans ........................................................................................................37 8.5 Molluscs, echinoderms & bryozoans .............................................................37
8.5.1 Molluscan larvae.........................................................................................37 8.5.2 Echinoderm larvae......................................................................................38 8.5.3 Bryozoans (Cyphonautes)...........................................................................40
8.6 Annelids .............................................................................................................40 8.6.1 Polychaete larvae........................................................................................40 8.6.2 Tomopteris ..................................................................................................41
8.7 Chaetognaths.....................................................................................................43 8.8 Gelatinous zooplankton....................................................................................43
9 RESTING STAGES IN SEDIMENTS AND BALLAST WATER......................46 9.1 Resting stages ....................................................................................................46 9.2 Ballast waters ....................................................................................................47
10 CONTAMINANTS AND POLLUTION AFFECTING PLANKTON............48 10.1 General pollutants ............................................................................................48 10.2 Oil pollution ......................................................................................................48
11 CLIMATIC INFLUENCE ON PLANKTON ECOLOGY...............................50 12 CONCLUSIONS...................................................................................................53 13 AKNOWLEDGEMENTS....................................................................................54 14 REFERENCES .....................................................................................................55 15 APPENDIX ...........................................................................................................61

3
1 INTRODUCTION The purpose of this report is to give an overview of plankton ecology in SEA area 6 of the Irish Sea, and the processes that can affect it. Information has been obtained from both current and historical research to give an understanding of the current state of the Irish Sea and any changes that have occurred to the plankton ecology over time. The information herein is a contribution to an information base for the Strategic Environmental Assessment of the Irish Sea. The Irish Sea is relatively small in size with an area of about 58,000 km2. In general it is a relatively shallow basin, ranging in depth from 20-100m, however, there is a deep channel, (>100m), extending north-south in the western part of the Irish Sea which reaches a maximum depth of 315m in Beauforts Dyke. This deeper channel connects with the Celtic Sea via St George's Channel in the south, and with the Malin Shelf through the North Channel. Water moves into the Irish Sea from the Atlantic Ocean through the St George's and North Channels (Vincent et al., 2004). With oil and gas fields in the eastern Irish Sea, busy shipping activity and the presence of nuclear power stations, the Irish Sea is not just commercially important but could be prone to high levels of pollutants. Therefore, the aim of this report was to provide the Department of Trade and Industry with biological data on the planktonic community of this region, as part of the Strategic Environmental Assessment (SEA area 6). Topics covered in this report are the compositions of phytoplankton and zooplankton populations, and processes affecting them both as natural and man-made interactions. To carry out this report a variety of data has been used ranging from the historical data sets of Johnson et al. (1924), to present day studies. Much data was obtained from the Sir Alister Hardy Foundation for Oceanic Science (SAHFOS), using their Continuous Plankton Recorder (CPR) data. Other sources of information include data from the Port Erin Marine Laboratory’s long-term Cypris monitoring station (1954-2005), and a comprehensive zooplankton data set from Dr. R.D.M. Nash (unpublished data) spanning the last decade. To compliment these records, a wide range of scientific literature was also used to fill as many gaps in data as possible. These sources of information give a relatively comprehensive review of plankton ecology in the Irish Sea.

4
2 STUDY AREA This study is a review of the plankton in the SEA area 6, the boundaries of which are shown in Figure 2.1. However, much of the data obtained also encompasses the area to the east of southern Ireland outside the SEA area 6 region.
Figure 2.1. Chart showing the limits of SEA area 6 (in red). Much of the diagrammatic planktonic distribution and abundance data were obtained from the Sir Alister Hardy Foundation for Oceanic Science (SAHFOS), using data from their Continuous Plankton Recorder (CPR) surveys of the Irish Sea. However, although over 4000 data points were obtained from CPR data in the Irish Sea some regions of SEA area
5
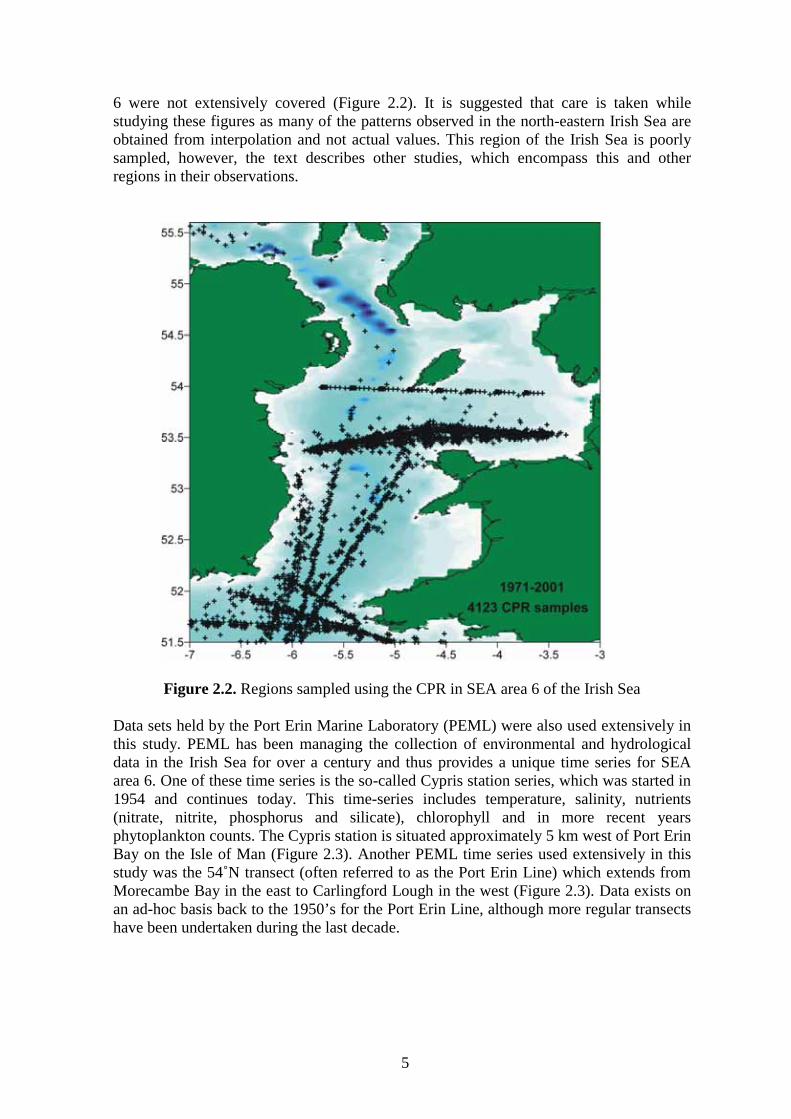
6 were not extensively covered (Figure 2.2). It is suggested that care is taken while studying these figures as many of the patterns observed in the north-eastern Irish Sea are obtained from interpolation and not actual values. This region of the Irish Sea is poorly sampled, however, the text describes other studies, which encompass this and other regions in their observations.
Figure 2.2. Regions sampled using the CPR in SEA area 6 of the Irish Sea Data sets held by the Port Erin Marine Laboratory (PEML) were also used extensively in this study. PEML has been managing the collection of environmental and hydrological data in the Irish Sea for over a century and thus provides a unique time series for SEA area 6. One of these time series is the so-called Cypris station series, which was started in 1954 and continues today. This time-series includes temperature, salinity, nutrients (nitrate, nitrite, phosphorus and silicate), chlorophyll and in more recent years phytoplankton counts. The Cypris station is situated approximately 5 km west of Port Erin Bay on the Isle of Man (Figure 2.3). Another PEML time series used extensively in this study was the 54˚N transect (often referred to as the Port Erin Line) which extends from Morecambe Bay in the east to Carlingford Lough in the west (Figure 2.3). Data exists on an ad-hoc basis back to the 1950’s for the Port Erin Line, although more regular transects have been undertaken during the last decade.

6
-6.5 -6 -5.5 -5 -4.5 -4 -3.5 -3 -2.5
52.5
53
53.5
54
54.5
55
MB3
MB2MB1
EFGHAIJKL
CYPRIS
WhitehavenSt Bees Head
BurrowHead
NorthChannel
Morecambe Bay
CarlingfordLough
LiverpoolBay
SolwayFirth
Wales
England
Scotland
Eire
Northern Ireland
Isle ofMan
Cardigan Bay
Anglesey
Belfast Lough
Strangford Lough
Key
54 degree North stations
Liverpool Bay Surveys (EA)Solway Transect (EA/PEML)
Cumbria coast surveys (EA/PEML)
WISPER stations (PEML)
Figure 2.3. Positions of Port Erin Marine Laboratory’s long-term monitoring sampling stations and other surveys, with Dr R.D.M. Nash’s western Irish Sea zooplankton survey area shown as green box to the west of the Isle of Man. 3 BIOLOGICAL BACKGROUND The term plankton is taken from the Greek verb meaning “to wander” and refers to organisms whose powers of movement are insufficient to prevent them from being moved by water currents. The plankton can be simply divided into two major components; the plant plankton and the animal plankton, referred to as the phytoplankton and zooplankton respectively. The phytoplankton is of great importance as these are the primary producers of the oceans and thus provide the principal source of primary nutrition for organisms such as the zooplankton. As primary producers the phytoplankton require light to perform photosynthesis. However, due to an exponential reduction in light intensity with depth in seawater, phytoplankton abundance is greatest in the upper waters, a region referred to as the photic zone.

7
The phytoplankton itself can be further divided with three orders of algae predominating; the diatoms, the dinoflagellates and the smaller flagellates. The diatoms are autotrophic (produce energy from photosynthesis) and generally range in size from 15 to 400µm. Diatoms are characterised by their siliceous cell or frustule. The diatom frustule is composed of two overlapping valves that fit together much like a pill-box or petri-dish. The dinoflagellates are generally heterotrophic, so rely on preformed organic matter, though some are also capable of photosynthesis. They are of a similar size to the diatoms but have a larger portion of smaller forms. The dinoflagellates can be further sub-divided into naked and armoured forms. Both forms are capable of locomotion by means of two whip-like appendages called the flagella. Smaller flagellates make up part of the nanoplankton (organisms 2-20µm in diameter) and picoplankton (organisms 0.2-2µm in diameter), along with bacteria, fungi and a number of the smallest diatoms and dinoflagellates. Although they are small is size they are thought to make a considerable contribution to primary production, and act as an important food source for many larvae (Tait, 1992; Mandali de Figueiredo, 2003). The zooplankton is the ”animal” constituent of the plankton and contains a wide variety of organisms. These organisms can be divided into holoplankton and the meroplankton. The holoplankton consists of permanent members of the plankton where all developmental stages are retained in the plankton. The meroplankton are temporary members of the plankton where only some developmental stages are within the plankton, such as the eggs or larvae of an organism. By far the most abundant element of the zooplankton are the copepods, which are small holoplanktonic crustaceans ranging in size from 0.5mm to 6.0mm. These are generally herbivores feeding on phytoplankton and are themselves the main food source for a great many organisms higher in the food chain such as larval and juvenile fish. The copepods can be divided into the calanoids, cyclopoids and harpacticoids by body shape, of which the calanoids are by far the most abundant. Other crustaceans also form an important constituent of the zooplankton, the majority of which are the larval forms of large benthic crustaceans such as crabs, and are therefore in the meroplankton. Other such meroplanktonic animals include polychaete larvae and echinoderm larvae, as adult forms are also benthic. However, it is not only organisms that lead to a benthic lifestyle in the meroplankton, as fish eggs and larvae are also included (referred to as the ichthyoplankton), due to the fact that they are only part of the plankton during their pelagic egg and larval stages. The gelatinous zooplankton, can also be important in the zooplankton and include, larvaceans, salps, doliolods, ctenophores and coelentrates. These organisms are generally carnivorous, feeding upon other zooplankton such as copepods and fish larvae. There importance is due to the fact that ctenophores and medusoid stages of cnidarians (coelentrates) can exhibit rapid growth to form large swarms which can lead to a significant predatory effect on copepods and fish larvae (Bunn et al., 2000).

8
All the plankton are linked together in a complex food web, a simplified version of which is shown in Figure 3.1. The importance of understanding this web is that any disruption to one element could have a causal effect, being detrimental to all other organisms.
Figure 3.1. Simplified planktonic food web showing direction of consumption (black lines) and recycling of waste material (red lines), where breakdown products from phytoplanktonic groups also include the phytodetritus. 4 PHYSICAL PROCESSES AFFECTING THE
PLANKTON In order to gain some understanding of the plankton dynamics of the Irish Sea it is necessary to give a brief overview of some of the physical processes that can control fluctuations in plankton population dynamics. This overview is meant as a brief

9
introduction to the hydrodynamics and chemical regimes of the Irish Sea and is by no-means exhaustive in its approach. For more detailed information see Irish Sea Study Group (1990), Dickson and Boelens (1988) and Hartnoll (2000). A recent review of Irish Sea Nutrients and Phytoplankton has recently been published (Gowen & Stewart, 2005, in press) and provides a more detailed information on the historical basis of research of this type in the Irish Sea. Two additional important references containing information on the plankton ecology of Irish Sea waters are those produced by OSPAR (2000) and the Marine Institute of Ireland (1999). The Irish Sea is relatively small in comparison with other UK seas, and with a volume of only (approximately) 2500km3 this is equivalent to just less than 10% of the North Sea. Despite this small size the Irish Sea exhibits large regional differences in bathymetry, hydrology, nutrient chemistry and ecology. Waters to the south of the Irish Sea share many characteristics with the Celtic Sea. Waters in the western Irish Sea are generally deeper (>100m), have higher salinity values, shorter residence times and become stratified during the summer months. A gyre with a strong thermocline also develops in the mid-western Irish Sea, between the Isle of Man and Ireland during the summer months. Eastern Irish Sea waters on the other hand, tend to be shallower (<50m), have longer residence times and are much more heavily impacted by freshwater discharge which results in reduced salinities and higher winter nutrient salt concentrations than waters found in the west. Waters entering the Irish Sea primarily do so through the St Georges Channel in the South, but there is also exchange with Atlantic water through the North Channel. Water transport through the sea is generally considered to be northwards (Bassett, 1909). However, the movement of seawater within the Irish Sea is highly variable. Waters in the eastern Irish Sea generally have a weaker and more varied circulation than those to the west. In this region wind strength and direction have a greater impact than those in the western Irish Sea. Waters influenced by riverine discharges from the Solway Firth flow westwards past Burrow Head and also southwards past St Bees Head. Under low wind conditions these waters then flow clockwise around Liverpool Bay, however, during storm events this flow within Liverpool Bay is reversed (Irish Sea Study Group, 1990). 4.1 Nutrient Salts In order for a phytoplankton population to be successful, certain micro and macro-nutrients are required in high enough concentrations to support population growth. In the marine environment, nitrogen is generally considered to be the limiting macro-nutrient although phosphorus and silicon are also required in varying quantities by certain phytoplanktonic groups. The following section briefly outlines the seasonal, geographical and temporal changes in concentrations of dissolved available inorganic nitrogen (DAIN) and phosphorus (DAIP) in the Irish Sea. The origin of nutrient salts in the Irish Sea are from Atlantic, riverine and atmospheric sources. Gowen and Stewart (2005 in press) have recently calculated that the freshwater input of nitrogen (as DAIN) into the Irish Sea is of a similar magnitude to the natural marine input. This contrasts with other UK coastal seas such as the North Sea where the supply of Atlantic nitrogen represents 70% of the total input. The majority of the freshwater nutrient input occurs in the eastern Irish Sea where a strong conservative relationship between winter nutrient salt concentrations and salinity exists (Figure 4.1).

10
31 32 33 34 35
0
10
20
30
31 32 33 34 35
0
10
20
30
31 32 33 34 35
0
10
20
30
26 28 30 32 34
0
20
40
60
Coef of det (R2) = 0.871977
February 1996 Cumbrian Coast
Coef of det (R2) = 0.0775955
March 1997 Cumbrian Coast
Coef of det (R2) = 0.676506
January 1998 Cumbrian Coast
January 1999 Cumbrian Coast
Coef of det (R2) = 0.423283
Salinity Salinity
SalinitySalinity
DA
IN
DA
IN
DA
IN
DA
IN
Figure 4.1. The relationship between winter Dissolved Available Inorganic Nitrogen (DAIN) concentrations (µM) between 1996-1999 in the eastern Irish Sea (from Kennington et al., 2002). It can be seen from Figure 4.1 that the winter nutrient concentrations along the Cumbrian coastline between 1996 and 1999 were strongly related to salinity. The apparent breakdown in the nutrient:salinity relationship during 1997 was possibly a result of the later sampling date which may have occurred after onset of the spring bloom and subsequent modification by the phytoplankton flora. Kennington et al. (1998) suggested that this breakdown in the nutrient:salinity relationship was also a response to local weather conditions prior to sample collection. Winter concentrations of both DAIN and DAIP are highest in the coastal waters between Liverpool Bay and the Solway Firth (Figure 4.2) reflecting the high nutrient loading from rivers draining into the region. Concentrations in the western Irish Sea are significantly lower although certain coastal water-bodies (e.g. Belfast Lough) also have high nutrient loadings during the winter months. Figure 4.3 shows data from the Port Erin Marine Laboratory’s long term monitoring station, Cypris. Figure 4.3a, shows the winter record of dissolved available inorganic nitrogen (DAIN) between 1962 and 2000. Allen et al. (1998) analysed the Cypris data-set for the period 1954-1994 and concluded that the increase in DAIN during the 1960’s and 1970’s was evidence for eutrophication during the latter half of the 20th century. It can be seen from Figure 4.3b that dissolved available inorganic phosphorus (DAIP) concentrations increased during the 1960’s and 1970’s before levelling off and in recent years declining. This increase has been associated with increased riverine concentrations (Gowen et al., 2002), although Evans et al. (2003) suggested that climate variation may

11
also influence nutrient levels in the Irish Sea. More recently Kennington et al. (unpublished data) have shown that nutrient concentrations recorded at the Cypris station are linked to the North Atlantic Oscillation (see Section 11).
Figure 4.2. Thematic plots of winter DAIN (6a) and DAIP (6b) concentrations for key regions of the Irish Sea. (After Kennington et al., 2002).
a)
b)
12
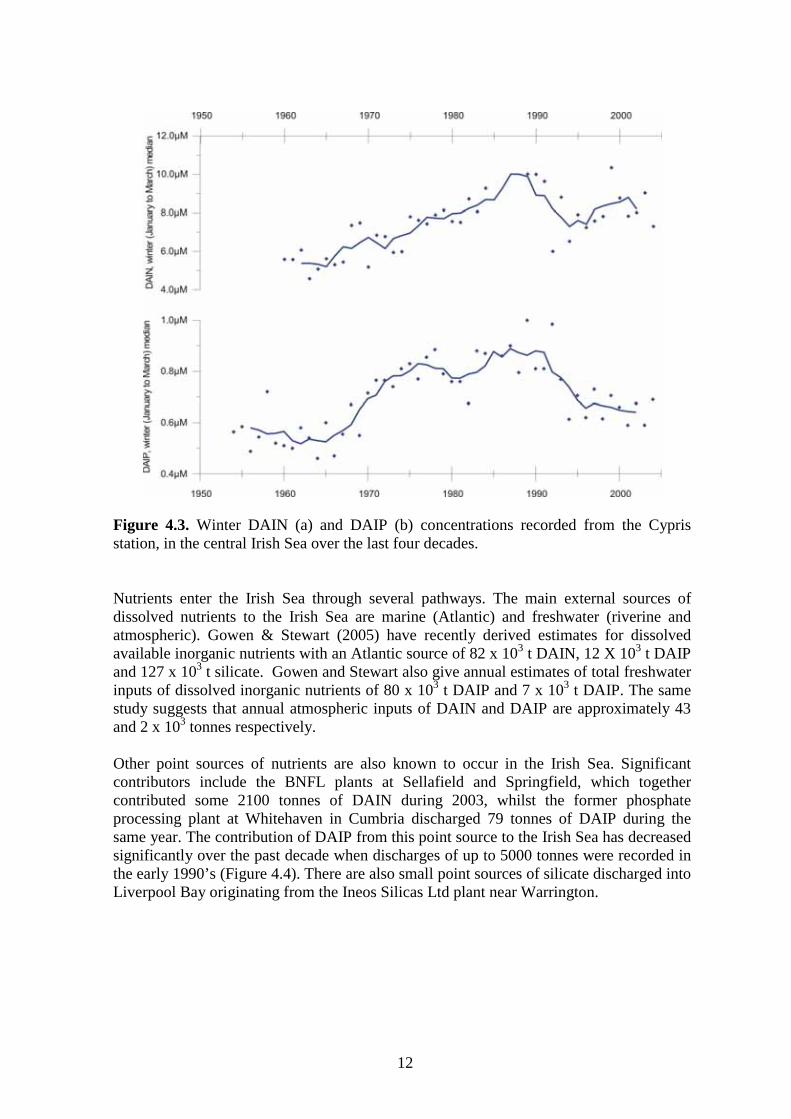
Figure 4.3. Winter DAIN (a) and DAIP (b) concentrations recorded from the Cypris station, in the central Irish Sea over the last four decades.
Nutrients enter the Irish Sea through several pathways. The main external sources of dissolved nutrients to the Irish Sea are marine (Atlantic) and freshwater (riverine and atmospheric). Gowen & Stewart (2005) have recently derived estimates for dissolved available inorganic nutrients with an Atlantic source of 82 x 103 t DAIN, 12 X 103 t DAIP and 127 x 103 t silicate. Gowen and Stewart also give annual estimates of total freshwater inputs of dissolved inorganic nutrients of 80 x 103 t DAIP and 7 x 10³ t DAIP. The same study suggests that annual atmospheric inputs of DAIN and DAIP are approximately 43 and 2 x 10³ tonnes respectively. Other point sources of nutrients are also known to occur in the Irish Sea. Significant contributors include the BNFL plants at Sellafield and Springfield, which together contributed some 2100 tonnes of DAIN during 2003, whilst the former phosphate processing plant at Whitehaven in Cumbria discharged 79 tonnes of DAIP during the same year. The contribution of DAIP from this point source to the Irish Sea has decreased significantly over the past decade when discharges of up to 5000 tonnes were recorded in the early 1990’s (Figure 4.4). There are also small point sources of silicate discharged into Liverpool Bay originating from the Ineos Silicas Ltd plant near Warrington.

13
YEAR
Figure 4.4. Contribution of some industrial loadings of DAIN, DAIP and Silicate (as tonnes/yr-1, log scale) into the eastern Irish Sea 1991-2003.
5 PHYTOPLANKTON 5.1 Bulk Chlorophyll Analysis As the phytoplankton are plants they contain chlorophyll, thus the chlorophyll content of marine waters gives a proxy measurement of the phytoplankton biomass that can be found in these waters at any given time. Figure 5.1, shows the maximum and mean summer chlorophyll concentrations recorded from the Cypris station in the central Irish Sea between 1966 and 2003. It can be seen that there was an underlying increase in chlorophyll concentration between the mid 1960’s and the early to mid 1990’s, after which time concentrations appear to have decreased. The fluctuation in summer chlorophyll concentrations recorded at the Cypris station follow the general fluctuations in mean winter nitrogen and phosphorus recorded over the same time interval in the central Irish Sea.

14
Figure 5.1. Maximum (a) and mean (b) summer (April to August inclusive) chlorophyll concentrations (µg/litre) at the Cypris Station surface waters, 1966 to 2003. Five year running means (solid line) and long-term means (broken line) are shown (after Shammon et al., 2004). Figure 5.2 (a&b) shows the monthly average water column and raw chlorophyll concentrations measured at the Cypris station between 1966 and 2002. Background winter chlorophyll concentrations are generally less than 0.5µg/litre. For the purpose of this report, the major period of phytoplankton production has been taken as the period through the spring and summer where chlorophyll values are higher than 1.5µg/litre. This boundary has been highlighted on the contour plots. It can be seen that during the 1960’s through to the 1980’s, the duration of the spring/summer phytoplankton bloom at Cypris was significantly shorter than for the period representing the late 1980’s through to the mid to late 1990’s. In addition the intensity of the spring bloom appears also to have increased during late 1980’s to the mid 1990’s, with maximum concentrations occurring during April 1990. Observations of the onset of the spring bloom over the duration of the Cypris dataset also shows that there has been some considerable variation in the timing of this event. Figure 5.2c displays the phytoplankton colour index derived from the Continuous Plankton Recorder for the whole of SEA area 6 between 1970 and 2001. It can be seen that the number of months the colour index reads 0.5 or more has steadily increased since the 1990’s, this suggests an increase in length of the phytoplankton production period since this time. However, evidence for this from the Cypris time-series suggests a reduction in the growth season length since the mid 1990’s.
15
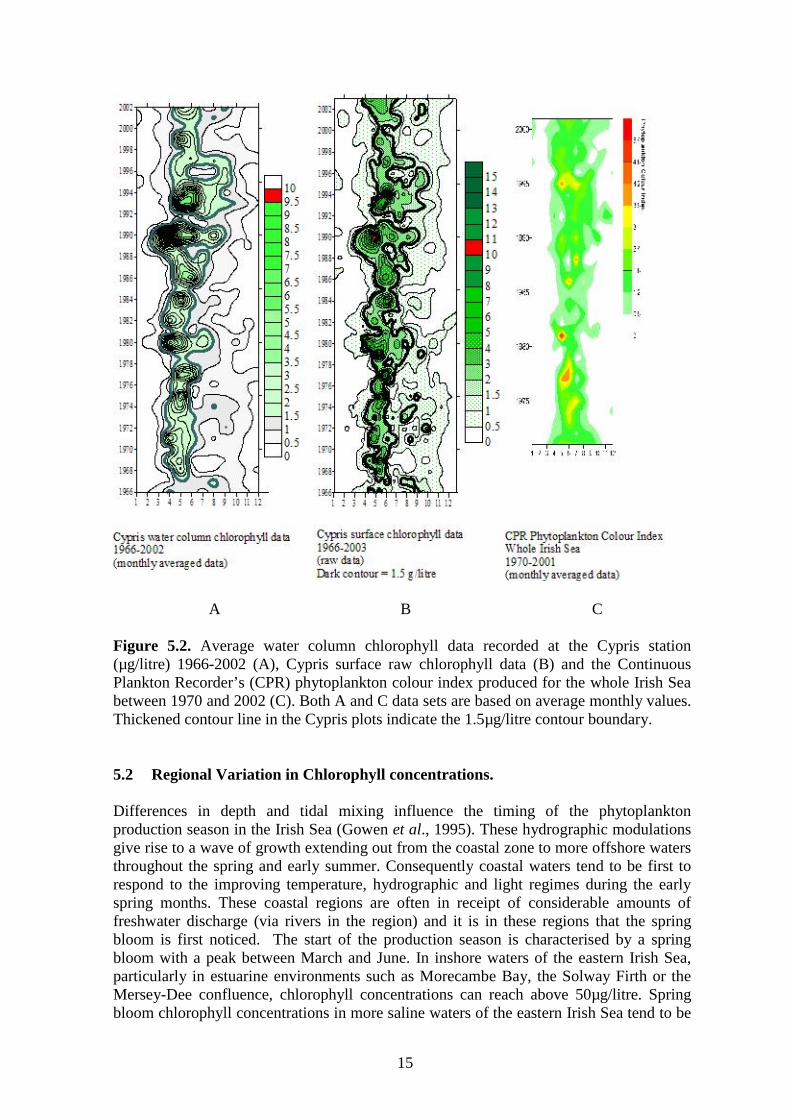
A B C Figure 5.2. Average water column chlorophyll data recorded at the Cypris station (µg/litre) 1966-2002 (A), Cypris surface raw chlorophyll data (B) and the Continuous Plankton Recorder’s (CPR) phytoplankton colour index produced for the whole Irish Sea between 1970 and 2002 (C). Both A and C data sets are based on average monthly values. Thickened contour line in the Cypris plots indicate the 1.5µg/litre contour boundary. 5.2 Regional Variation in Chlorophyll concentrations. Differences in depth and tidal mixing influence the timing of the phytoplankton production season in the Irish Sea (Gowen et al., 1995). These hydrographic modulations give rise to a wave of growth extending out from the coastal zone to more offshore waters throughout the spring and early summer. Consequently coastal waters tend to be first to respond to the improving temperature, hydrographic and light regimes during the early spring months. These coastal regions are often in receipt of considerable amounts of freshwater discharge (via rivers in the region) and it is in these regions that the spring bloom is first noticed. The start of the production season is characterised by a spring bloom with a peak between March and June. In inshore waters of the eastern Irish Sea, particularly in estuarine environments such as Morecambe Bay, the Solway Firth or the Mersey-Dee confluence, chlorophyll concentrations can reach above 50µg/litre. Spring bloom chlorophyll concentrations in more saline waters of the eastern Irish Sea tend to be
16
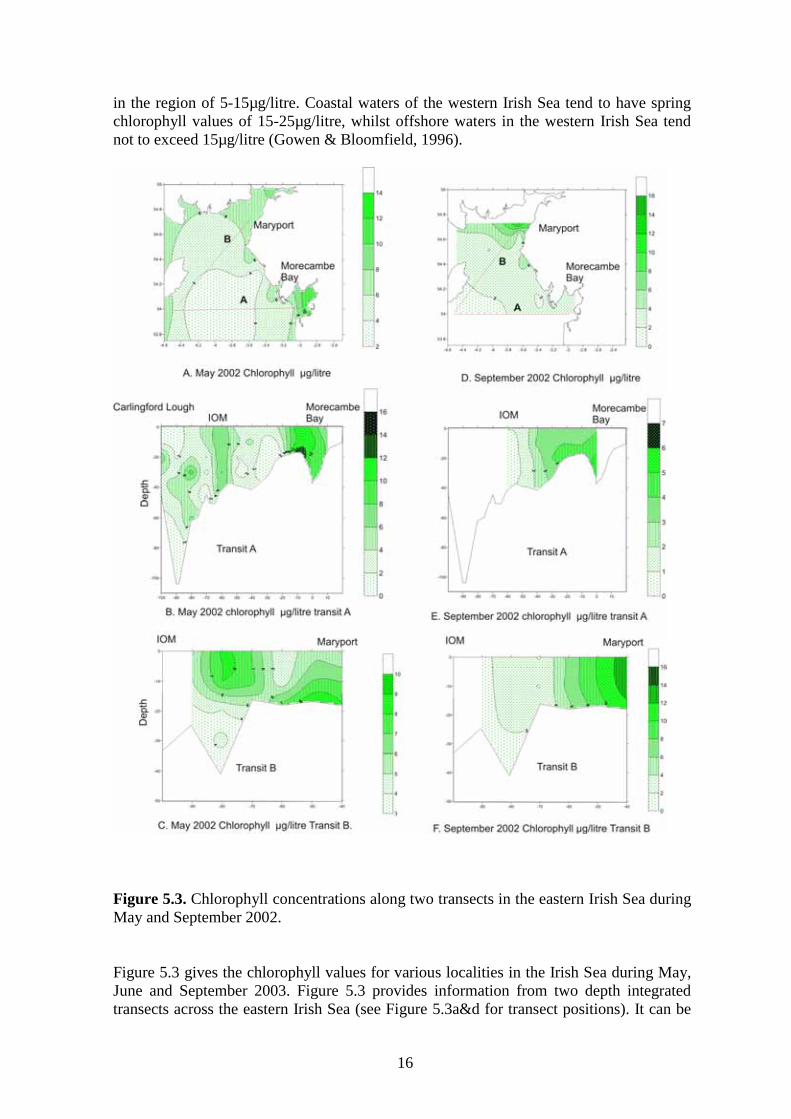
in the region of 5-15µg/litre. Coastal waters of the western Irish Sea tend to have spring chlorophyll values of 15-25µg/litre, whilst offshore waters in the western Irish Sea tend not to exceed 15µg/litre (Gowen & Bloomfield, 1996).
Figure 5.3. Chlorophyll concentrations along two transects in the eastern Irish Sea during May and September 2002. Figure 5.3 gives the chlorophyll values for various localities in the Irish Sea during May, June and September 2003. Figure 5.3 provides information from two depth integrated transects across the eastern Irish Sea (see Figure 5.3a&d for transect positions). It can be

17
seen from these plots that highest chlorophyll concentrations are recorded from waters within Morecambe Bay and the Solway Firth during May and September 2002. Such waters tend to have higher chlorophyll concentrations throughout the production season owing to nutrient recharge brought about through riparian discharges. In the western Irish Sea the spring bloom develops between March and May (Gowen & Bloomfield, 1996), and by June the phytoplankton populations begin to decline across the region as a whole. By this time the western central Irish Sea develops a strong thermocline, which is associated with the development of the western Irish Sea gyre. After stratification has been established within this region, the nutrient salts are soon consumed by the phytoplankton and greater phytoplankton biomass is often found at depth where nutrient exchange across the pycnocline still stimulates production (Figure 5.4a).
Figure 5.4. Chlorophyll concentrations along the 54˚N transect during June 2002, note the presence of the sub-surface chlorophyll maximum in the western Irish Sea (A). Chlorophyll concentrations in Liverpool Bay during May (B) and September (C) 2002. As mentioned previously highest chlorophyll concentrations during the spring bloom are recorded from regions of freshwater exchange such as the loughs and estuaries of the Irish Sea. Highest concentrations in the region as a whole tend to be found in Liverpool Bay, particularly in waters associated with the Dee, Ribble and Mersey estuaries. Gowen et al. (2000) reported concentrations in this region of up to 44µg/litre during May1997, whilst

18
Kennington et al. (2004) reported concentrations of over 50µg/litre during May 2002 (Figure 5.4b). Chlorophyll concentrations within Liverpool Bay remain relatively high throughout the seasonal production period (Figure 5.4c), and this has led to concerns over the potential for eutrophication of the Bay in the future (OSPAR 2002). 5.3 Phytoplankton Community Structure As has previously been stated the Irish Sea has great diversity with respect to hydrology, nutrient chemistry and ecology. The monitoring programmes undertaken at the University of Liverpool’s Port Erin Marine Laboratory (PEML) currently have records of over 70 species/species groups of diatoms and 60 species/species groups of dinoflagellates collected from the northern Irish Sea. The true number of phytoplankton species in the Irish Sea is certainly higher and new species recordings for the area are regularly made. This section of the report will endeavour to take into consideration the variation in water-mass characteristics and high species diversity found in the Irish Sea. Distinct regions that have similar characteristics with regard to hydrology, nutrient chemistry etc. have been identified using data collected by PEML, the Department of Agriculture and Rural Development Northern Ireland (DARDNI) and the UK’s Environment Agency (NW region). Using these data, 5 key regions or ecohydrodynamic typologies (Figure 5.5) have been identified (Anonymous 2004a&b). Typological differences with regard to DAIN and chlorophyll are given in Figure 5.6, with seasonal differences in the diatom and dinoflagellate abundances given in Figure 5.7.
Figure 5.5. Map of the Irish Sea showing the positions of the 5 ecohydrodynamic typologies (from data in Gowen et al., 1995; Kennington et al., 2003; 2004; 2005a; as reported in Anonymous, 2004a&b). 5.3.1 Typology A: Regions of Freshwater Input (ROFI’s) This typology includes the embayments and other inshore waters, which collectively are known as ROFI’s (Regions of Freshwater Input). Examples of this typology in the Irish Sea are Belfast, Carlingford and Strangford Loughs, Morecambe Bay, Solway Firth and southeast Liverpool Bay. This typology is characterised by low salinity, non-thermally stratified conditions with high winter nutrient concentrations. The phytoplankton growth season is the longest of all ecohydrodynamic typologies lasting 6 to 7 months. Diatoms

19
are abundant throughout the growth season. Dinoflagellates peak initially in early summer with highest abundances occurring during late summer. Nanoflagellate abundances can be high in ROFI’s with peak abundances generally occurring after silicate has been depleted from the water column. 5.3.2 Typology B: Coastal Frontal Zones These waters are found in the proximity of near-shore transitions from mixed or more persistently stratified waters (e.g. the salinity front in Liverpool Bay and the tidal mixing fronts associated with the coastal zone). Type B waters have salinities between 30 and 33 and moderately high winter nutrient concentrations, owing to their proximity to ROFI’s. Although these waters are generally well mixed, haline stratification can still occur during periods of high river run-off. The phytoplankton growth season lasts for 5 to 6 months, with diatom abundance showing a distinctive spring peak. The dinoflagellates also show an initial increase in abundance during the spring but become more abundant during late summer. 5.3.3 Typology C: Offshore Mixed Waters These waters are characterised by high salinity (>34) and moderate winter nutrient conditions. Waters in this typology are generally well mixed, although a weak thermocline can develop during extended times of fine weather. This typology has a reasonably short production season of between 3 to 4 months and includes a distinctive peak in all algal groups during the spring. 5.3.4 Typology D: Offshore Waters of Transitional Stability This typology refers to waters that stratify regularly, although stratification is usually weak or intermittent. Such waters are found in the central eastern Irish Sea and around the gyre in the western Irish Sea. Waters of this type have moderately high salinity levels (>33) and moderate winter nutrient concentrations. The phytoplankton season is similar to that of typology C, although all algal groups are generally more abundant in type D waters. 5.3.5 Typology E: Offshore Seasonally Stratified Waters This typology represents waters that are thermally stratified during the summer months, a good example of which are waters within the western Irish Sea gyre. Salinities in this typology are high, owing to the reduced influence of freshwater run-off. This typology also has moderate concentrations of winter nutrient salts. The phytoplankton season in this zone varies considerably. Dominant phytoplankton species recorded from ecohydrodynamic typologies A to D are given in Appendix I.

20
Figure 5.6. Seasonality of chlorophyll and DAIN for Ecohydrodynamic typologies A-D (from Kennington et al., 2002).

21
Figure 5.7. Seasonal differences in dinoflagellate (red line) and diatom (histograms) abundances at ecohydrodynamic typologies A-D for 2001. 5.4 Phytoplankton Blooms and Harmful Algal Events Monospecific (or near monospecific) blooms are common in the Irish Sea. During 2001 the diatom bloom in the eastern Irish Sea was dominated by Leptocylindrus danicus and L. minimus, which together represented over 60% of the total assemblage (Kennington et al., 2003). However, the spring bloom is a natural event and records of nuisance events caused by the excessive growth of diatoms are rare for the Irish Sea. Post diatom bloom silicate depletion can cause the dominance of flagellates and in particular Phaeocystis spp., which have formed dense blooms during May and June in the eastern Irish Sea (Jones & Haq, 1963; Kennington et al., 1997; 1999). Records of blooms of Phaeocystis date back to the last century. However, since their occurrence is unpredictable it is difficult to compare changes in overall abundance with time (Hartnoll et al., 2002). Another bloom forming flagellate recorded from Irish Sea waters is the bioluminescent dinoflagellate Noctiluca scintillans. Extensive blooms of this species were reported in the eastern Irish Sea during 1997, extending from Morecambe Bay and the Mersey Estuary towards the Isle of Man (Shammon et al., 1997; Gowen et al., 2000). These species can form spectacular red-tides and have the potential to remove oxygen from the water column after the bloom dies back. Another dinoflagellate which has caused red-tides in

22
the Irish Sea is Karenia mikimotoi (=Gyrodinium aureolum). This species was responsible for the death of benthic animals on the Welsh coastline (Helm et al., 1974) and of farmed fish in one of the Firth of Clyde’s sea-lochs (Jones et al., 1982). The majority of toxin producing algae (TPA) are flagellates. An exception is Pseudonitzschia spp., which is a genus of diatom known to cause Amnesic Shellfish Poisoning (ASP). Pseudonitzschia spp. have been recorded from the Irish Sea and is thought to have been the organism responsible for shellfish bed closures along the Scottish and Irish coast during 1999. The majority of toxin producing algae do not need to be in bloom-state to be of risk to the marine environment and fisheries. Species such as Dinophysis acuta, D. acuminata, D. norvegicus and Alexandrium spp. can be toxic at concentrations of just a few hundred cells per litre. All of these species occur regularly in the Irish Sea, albeit in relatively low concentrations. A full list of toxin producing and nuisance algae recorded from the Irish Sea is given in Table 1 below.
Table 5.1. Species of toxic and nuisance algae recorded from the Irish Sea (updated from Gowen and Stewart, (2005 in press)) 6 NANOPLANKTON The nanoplankton include all organisms in the size range of 2-20µm. This group contains organism belonging to the pymnesiophytes, prasinophytes, chaenoflagellates and cyanobacteria amongst others. Figure 6.1 shows the seasonal abundance of all nanoflagellates recorded from ecohydrodynamic typologies A-D in the Irish Sea during 2001. It can be seen from this figure that typologies A and B have highest concentrations during the spring and a second peak during the summer months The initial spring peak in

23
concentrations generally occur after the winter silicate concentrations have been exhausted by the diatoms. Within both of these typologies the season of nanoflagellate abundance lasts for several months during the period of low silicate concentration. Typologies C and D which represent open mixed water and weakly stratified environments, tend to have a smaller initial spring peak in concentrations with maximum abundances occurring during the summer months. Again there is a close coupling between nanoflagellate abundance and silicate depletion.
Figure 6.1. Seasonal concentrations of ciliates and nanoflagellates in Ecohydrodynamic typologies A-D during 2001.

24
7 MICROZOOPLANKTON This planktonic group contains zooplanktonic organisms in the size range of 2-200µm. Examples of microzooplankton include the ciliates, tintinnids and rotifers. Although little work has been carried out into this size class of zooplankton in the Irish Sea some data are available (Edwards & Burkhill, 1995). Edwards and Burkhill (1995) showed that interannual variability in microzooplankton abundances was observed between 1987-1992, with numbers greatest in the April and May of 1987 and 1988. Variability of microzooplankton composition was also seen in relation to depth. Ciliates were seen to dominate surface waters (at 60% of the population) while tintinnids and dinoflagellates dominated (at 60% of the population) when a depth of 80m was reached. Effects of water column stability were observed with microzooplankton abundance greater in the stratified and frontal waters of the western Irish Sea compared to the mixed waters of the east. Also noted was a difference in size fractions of microzooplankton across the Irish Sea being >50µm in the western but <50µm in the eastern, a fact related to the greater amount of particulate matter in the eastern Irish Sea (Edwards & Burkhill, 1995). Further work carried out in 1996 (Montagnes, et al., 1999), looked more intensely at ciliate populations and reflected the observations of Edwards and Burkhill (1995), with increased patches of abundance at frontal regions, and similar species composition Further work has also been carried out with specific reference to the tintinnids in the northern Irish Sea. Although tintinnids in the Irish Sea are relatively low in abundance compared to other regions, 10 different species were observed of which Stenosemella nivalis dominated at >90% of the population. However, no pattern of abundance in relation to hydrographical and biological features of this area was observed except a clear minimum in early summer (Graziano, 1989).
The importance of these smaller zooplanktonic size fractions is that they are an essential part in recycling nutrients into the planktonic food web. However, recent studies have shown that the microzooplankton are an essential food source for first feeding fish larvae, thus there numbers could be critical in effecting larval fish mortality rates (Mandali de Figueiredo, 2003).
Figure 6.1 shows the seasonal abundances of ciliates for ecohydrodynamic typologies A-D in the Irish Sea. It can be seen that greatest abundances are generally recorded from typologies A and B that are located along the coastal fringe. Maximum abundances of ciliates at these locations tend to occur during spring and early summer. Concentrations at typologies C and D tend to be highest during the high summer. It can be seen from Figure 6.1 that there is a close coupling between the concentrations of ciliates and the concentrations of nanoflagellates in the Irish Sea as a whole.

25
8 ZOOPLANKTON The zooplankton are the animal constituent of the plankton, some are herbivores, feeding upon phytoplankton, while others are carnivorous feeding upon other members of the zooplankton. The zooplankton contains a very wide range of organisms and below is an overview of those found in the Irish Sea, as taken from both recent and historical data. 8.1 Community composition.
Table 8.1. Composition of zooplankton in the Irish Sea with organisms found at >1% composition of their group (taken from western Irish Sea data set Richard Nash, unpublished). From the observed zooplankton community in the western Irish Sea (Table 8.1) it is noted that copepods form the greatest proportion at nearly 70% of all the zooplankton. Of these copepods it is the smaller species of P. elongatus, T. longicornis and A. clausi that dominate. This population pattern is reflected in other areas of the Irish Sea such as the North Channel (Gowen et al., 1998) and the eastern Irish Sea (Graziano, 1988). However, although species composition does not generally differ between eastern and western regions it is noted that a greater abundance of copepods is found in the western Irish Sea (Graziano, 1988). The major zooplankton groups observed in the Irish Sea are investigated individually below.

26
8.2 Copepods in the Irish Sea 8.2.1 General composition The copepod population is almost entirely of the sub-order calanoida, however, Oithona sp. of the sub-order cyclopoida are observed in great enough numbers to also be classed as an important species as noted previously (Lee, 1971; Graziano, 1988). The significance of the copepods is that they constitute the major prey items for the larvae of many commercial fish species. Not only is their abundance important but also the size range and species present due to the fact that fish larvae at first feeding eat copepod nauplii, but as they grow they take larger prey items. A good example of this is shown by the gadoids (e.g. cod, haddock and whiting) where with increasing body size, their prey items change from nauplii to smaller copepods (e.g. Pseudocalanus elongatus, Acartia clausi and Temora longicornis) then almost exclusively to the large Calanus species of copepod (Economou, 1991). The presence of copepods for these feeding larvae is essential as the larvae are dependent on these copepods at a critical stage in their lifecycle, where they are prone to high mortalities (Hjort, 1914; Jordaan & Brown, 2003). Therefore a plentiful food supply is vital in the survival of these larvae and thus the eventual recruitment of these larvae to their respective stocks. General copepod distributions in the Irish Sea from CPR data for all major species from 1971 to 2001 (Figure 8.1) show a consistent pattern of elevated numbers west of the Isle of Man. As mentioned previously there is a deepwater trench (>100m) in this region and seasonal stratification of the water column is observed during spring and summer, caused by weak tidal currents in this area (Simpson, 1971). As a result of this stratification, a dome of cold dense water becomes isolated beneath a strong thermocline. This dome is flanked by strong horizontal density gradients, which provide baroclinicity and so drive a cyclonic (anticlock-wise) gyre (Hill et al., 1994). This gyre has been shown to retain organisms within this region (Hill et al., 1996; Dickey-Collas et al., 1997; Gowen, et al., 1997) and could be one reason for elevated copepod abundances found here. Another generalised distribution pattern shown by the copepods from this CPR data is their very low abundance between the latitudes of 52.5oN and 53.5oN (Figures 8.1 & 8.3a&b). This pattern is true for most species, however, T. longicornis and Para/Pseudocalanus were shown only to inhabit the northern Irish Sea while Calanus finmarchicus, was seen not to inhabit the eastern Irish Sea. However, other reports have noted the presence of C. finmarchicus in the eastern Irish Sea (Scrope-Howe & Jones, 1985; Graziano, 1988), though at low abundances. Distribution diagrams (Figure 8.1) also show that A. clausi, Oithona sp. and T. longicornis have a substantial abundance at the mouth of Morecambe Bay. It is known that both A. clausi and Oithona sp. are resistant to low salinities (Newell & Newell, 1977), thus the abundances of these copepods in these nutrient rich reduced salinity waters are explained. While the large abundance of T. longicornis in this region has been previously reported (Lee, 1971).

27
a) b) c)
d) e)
Figure 8.1. Irish Sea distributions of a) Pseudo/Paracalanus spp., b) Acartia spp., c) T. longicornis, d) Centropages spp. and e) Oithona spp. from CPR data taken from 1971 to 2001, with copepods listed in descending order of abundance. Note extrapolation of data to north-eastern Irish Sea where no CPR sample points were taken.

28
a) b)
c) d)
Figure 8.2. CPR data showing average yearly copepod abundances in the Irish Sea (a & c) and averaged seasonal distributions (b & d) for Acartia spp., Centropages spp., Oithona spp., Pseudo/Paracalanus and T. longicornis.

29
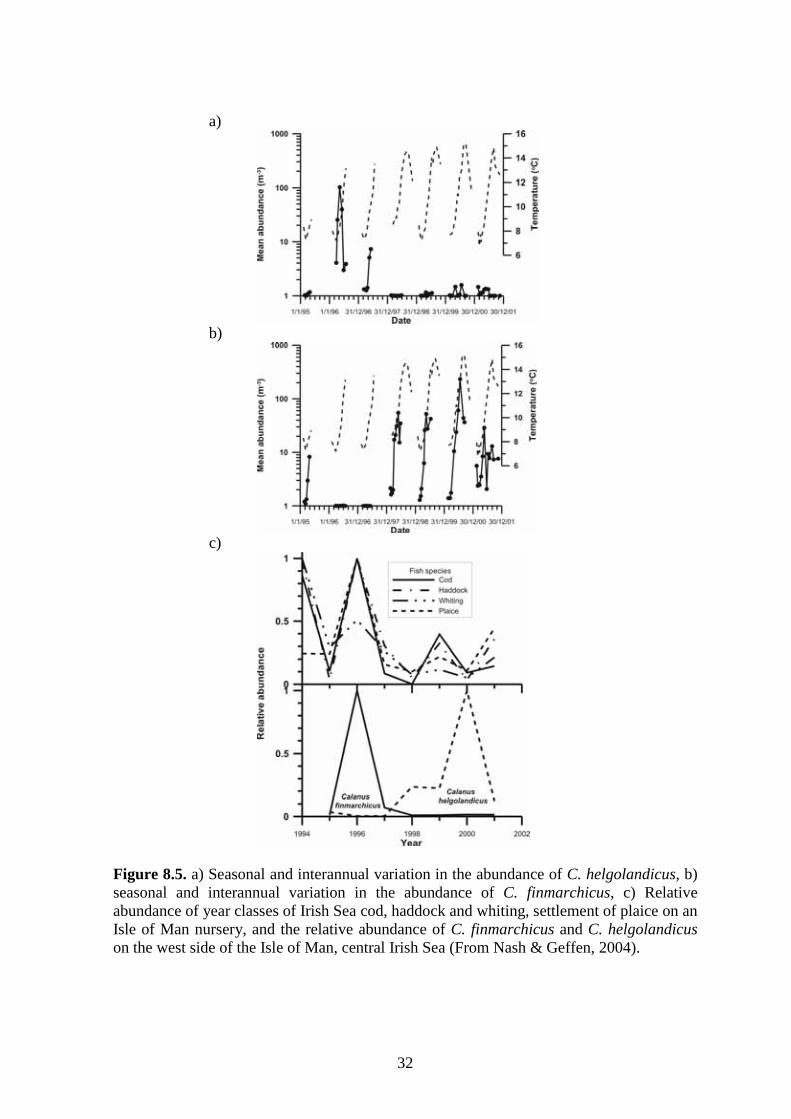
The abundance of all copepods varies throughout the year in relation to their food; the phytoplankton. This seasonal pattern of abundance is shown by all species (Figure 8.2b&d) with lowest numbers over the winter months and maximum abundances observed during spring and summer. However, it is noted that the seasonal abundances of individual copepod species differ, being most obvious in the two Calanus species. It is clearly seen (Figure 8.3c&d) that C. finmarchicus tends to reach its peak abundance earlier in the year compared to C. helgolandicus, a matter discussed in more detail later as also shown by Nash and Geffen (2004). From CPR averaged copepod abundance data for the whole Irish Sea (Figure 8.2a&c), it is noted that the majority of species observed have shown a decline in abundance from the 70’s to the present. This is the case for all species studied except Centropages sp. whose abundance has remained relatively stable throughout this time period. 8.2.2 Calanus species Although copepod composition in the Irish Sea is dominated by small species, of particular note in the Irish Sea are the Calanus species of copepod. As previously stated these play an important role as prey items for larger fish larvae, but their relative abundance in the Irish Sea is low (Nash & Geffen, 2004) when compared to other regions of water (e.g. the North Sea). However, as already mentioned their numbers are elevated in the gyre west of the Isle of Man (Figures 8.3a&b) possibly due to its retentive effect (Gowen, et al., 1997). There are two species of Calanus present in the Irish Sea C. finmarchicus and C. helgolandicus though in general C. helgolandicus is more abundant (Figure 8.4a). C. finmarchicus is a cold temperate water species while C. helgolandicus is a warmer water species, though both species show considerable spatial and temporal inter-annual variability in abundance (Gowen et al., 1997). In the Irish Sea the NAO (North Atlantic Oscillation) has been shown to affect Calanus spp. abundances. A positive NAO leads to high C. helgolandicus numbers and a negative NAO to high numbers of C. finmarchicus (Figures 8.5a&b). The importance of this is that it has been suggested that high C. finmarchicus abundances could lead to high gadoid numbers, as was the case in the Irish Sea in 1996 (Figure 8.5c), (Nash & Geffen, 2004). This has already been implied for the North Sea where one parameter explaining lower cod recruitment was suggested as a change in the population of Calanus from C. finmarchicus to C. helgolandicus (Beaugrand et al., 2003). A determining factor of this effect could be the higher abundances of C. finmarchicus earlier in the year compared to C. helgolandicus. It has been suggested that the earlier peaking C. finmarchicus are present in the water column at the time when cod larvae require that size range of prey (Beaugrand et al., 2003).

30
a) b)
c) d)
Figure 8.3. From CPR data showing the spatial distributions of a) C. finmarchicus b) C. helgolandicus from 1971 to 2001 and the seasonal distributions of c) C. finmarchicus d) C. helgolandicus since 1970 in the Irish Sea.

31
a)
b)
Figure 8.4. The average annual abundance (a) and average seasonal abundance (b) of C. helgolandicus and C. finmarchicus in the Irish Sea taken from CPR data.
32
a)
b)
c)
Figure 8.5. a) Seasonal and interannual variation in the abundance of C. helgolandicus, b) seasonal and interannual variation in the abundance of C. finmarchicus, c) Relative abundance of year classes of Irish Sea cod, haddock and whiting, settlement of plaice on an Isle of Man nursery, and the relative abundance of C. finmarchicus and C. helgolandicus on the west side of the Isle of Man, central Irish Sea (From Nash & Geffen, 2004).

33
8.3 Other Crustaceans 8.3.1 Decapod larvae There are a great number of decapods (crab, shrimp, etc) and associated larvae in the Irish Sea (eight-nine species recorded in waters around the Isle of Man (Bruce et al., 1963)), so the larvae have been grouped as a whole to avoid lengthy analysis. From the CPR distribution plots (Figure 8.6a) it can be seen that decapod larvae are abundant throughout the Irish Sea, however, it is noted that maximum abundances are found in the Morecambe Bay area. This is in agreement with Williamson (1956a) who noted all species were more common in shallow waters especially in the eastern Irish Sea, with the western region yielding lower abundances. White et al. (1988) looked specifically at the larvae of the decapod Nephrops norvegicus and noted larval abundances were greatest in the western Irish Sea. This was again shown by Dickey-Collas et al. (2000) suggesting production in the eastern Irish Sea was only 5% of that in the west. White et al. (1988) suggested that this was due to the adults being confined to muddy substrates, a feature of the sediment in this region. Seasonal abundances of decapod larvae appear very strong from the CPR data (Figure 8.7a), with few numbers over the winter months and a large peak from June to August (Graziano, 1988). A reduced abundance is also shown by CPR data for the last 30 years (Figure 8.7c), where a steady decline in decapod larval numbers has been seen since the 1970’s. 8.3.2 Cladocera These are small crustaceans with only two genera commonly found in British waters; Pondon and Evadne (Newell & Newell, 1977). In the Irish Sea four species are found E. nordmanii, P. intermedius, P. polyphemoides and P. leuckarti, of which only E. nordmanii and P. intermedius are common (Williamson, 1956a; Graziano, 1988) with E. nordmanii being most abundant (Lee, 1971).

34
a) b) c)
d) e) f)
Figure 8.6. Irish Sea CPR distribution data for a) decapod larvae, b) cladocera, c) cirripede larvae, d) euphausid larvae, e) larvaceans and f) mollusc larvae taken as average abundances over a 30 year sample period. Note extrapolation of data to north-eastern Irish Sea where no CPR sample points were taken.

35
a) b)
c) d)
Figure 8.7. CPR data showing average yearly abundances in the Irish Sea (a & c) and averaged seasonal distributions (b & d) for amphipods, cirripede, cladocera, cyphonautes, decapod larvae and euphausid larvae.

36
From CPR distribution plots (Figure 8.6b) it can be seen that the cladocerans are mostly limited to the north with maximum abundances found west of the Isle of Man. It has also been suggested that their distribution especially in the eastern Irish Sea is dependant on currents in this region (Lee, 1971). Seasonal abundance plots from CPR data (Figure 8.7d) are in agreement with previous studies (Williamson, 1956a; Lee, 1971; Graziano, 1988), with peaks in abundance of both species occurring in May/June, and very low counts over the winter months. From CPR long-term abundance plots (Figure 8.7b) it is noted that cladoceran abundances although highly variable have remained relatively stable over the last 30 years. 8.3.3 Cirripede The cirripedes are a group of crustaceans, which include the barnacles (Newell & Newell, 1977). In the Irish Sea historical data (Scott & Chadwick, 1924) suggests that the most common cirripede larvae are those of Balanus balanoides, however more recent reports site these larvae as a whole group “the cirripede larvae”. Information in the Irish Sea is limited, but as can be seen from Figure 8.6c, it appears that the cirripedes are mostly limited to the northern Irish Sea with abundances greatest west of the Isle of Man. However, it is noted that CPR data points were few in the eastern Irish Sea, so care must be taken when interpreting the data from this region. The general low cirripede abundance seen from CPR data in the Irish Sea could be accounted for due to the offshore sampling strategy whereas greatest cirripede abundance will generally be observed in inshore waters. Average abundances of cirripedes in the Irish Sea have shown little change since the 1970’s (Figure 8.7b) and a strong seasonal cycle is also shown (Figure 8.7d) as has been suggested previously (Scott & Chadwick, 1924; Graziano, 1988). 8.3.4 Euphausids The euphausids are pelagic shrimp-like crustacea, often referred to as “krill”. Around the British Isles only a few species occur and in the Irish Sea this is limited to Meganyctiphanes norvegica and Nyctiphanes couchii (Williamson, 1956a). M. norvegica is an oceanic species which is found over a broad range of depths while N. couchii is a shallow water species and used as an indicator of mixed coastal and oceanic waters (Newell & Newell, 1977). The CPR general distributions of euphausid larvae (Figure 8.6d) show relatively low abundances in the Irish Sea, with numbers in the east lower than those in the west, as observed previously (Williamson 1956a). However elevated abundances are noted off the coasts of southern Ireland. From CPR data (Figure 8.7c) of euphausid larvae seasonal distributions, two peaks in abundance are observed, one in June and one in October. An explanation for this pattern can be suggested from the spawning times and strategies of M. norvegica and N. couchii. Firstly it is known that M. norvegica releases its eggs into the sea while N. couchii retain their eggs beneath the thorax until development of the larvae (Newell & Newell, 1977). Secondly, M. norvegica spawns slightly earlier (April to May) compared to N. couchii
37
(April to June) (Williamson, 1956a). Finally the majority of euphausid larvae in the Irish Sea arrive by the northward currents from the large populations found to the south of Ireland (Figure 8.6d). Therefore it can be suggested the first peak of euphausid larvae observed is an influx of M. norvegica into the Irish Sea and the second peak is of N. couchii (Williamson, 1956a). Finally from average Irish Sea abundance data (Figure 8.7a) there is again the suggestion of a steady decline in numbers since the 1970’s. 8.4 Larvaceans The larvaceans or appendicularians are a group of small pelagic tunicates, they are filter feeders (Barnes & Hughes, 1988), with a wide distribution around the British Isles (Tait, 1992). Reports from the Irish Sea have shown the presence of two species Oikopleura dioica and Fritillaria borealis (Williamson, 1956a; Lee, 1971; Graziano, 1988). From CPR distribution data (1971-2001) it can be seen that the larvaceans are common throughout the Irish Sea (Figure 8.6e) with large peaks in abundance in the Liverpool Bay/Morecambe Bay area and to the west of the Isle of Man. However, abundances in the west are thought to be greater than those in the east (Graziano, 1988). In terms of average Irish Sea abundance (Figure 8.9a) there has been a slight increase in numbers observed over the last 30 years. Seasonality of these organisms is also noted (Figure 8.9b) peaking in June with low numbers found over the winter months. However, Graziano (1988) noted that although larvacean numbers were lowest during the winter months, his study found no summer maxima. 8.5 Molluscs, echinoderms & bryozoans 8.5.1 Molluscan larvae These only represent a small percentage of the zooplankton in the Irish Sea (Table 8.1). From the CPR distribution data (Figure 8.6f) they appear to be limited to the coasts of the north-east and north-west, with a hot-spot situated to the south of the region. However, care must be taken in interpreting this data due to poor CPR sampling coverage in certain regions of the Irish Sea. Previous studies have suggested that larval mollusc numbers are greater in the north-western Irish Sea compared to the north-eastern (Scrope-Howe & Jones, 1985; Graziano, 1988). CPR seasonal distribution data (Figure 8.9b) shows a relatively late peak in abundance during September. Previous work by Scott and Chadwick (1924) suggested an early peak in abundance during February/March, as well as this peak later in the year (October/November). Graziano (1988) showed a very irregular seasonal distribution, though a peak in abundance was noted in late summer. Average abundances in the Irish Sea have also been seen to fall over the last 30 years (Figure 8.9a).

38
8.5.2 Echinoderm larvae Almost all the echinoderms (urchins, starfish, etc.) have a pelagic larval stage in their development (Newell & Newell, 1977). Around the Isle of Man over 45 species of echinoderm have been recorded (Bruce et al., 1963), and due to this large number of associated larvae, these have been grouped as “echinoderm larvae”. From CPR distribution plots, it suggests that few echinoderm larvae are present in the Irish Sea, and are limited to the coasts in the north east and north west (Figure 8.8a). Graziano (1988) also suggested a low abundance in the Irish Sea, but noted that numbers in the west were significantly greater than those in the east.
a)
b)
Figure 8.8. Showing (a) the spatial distribution - note extrapolation of data to north-eastern Irish Sea where no CPR sample points were taken - and (b) seasonal distribution of echinoderm larvae in the Irish Sea as taken from CPR data.

39
a)
b)
Figure 8.9. The average annual abundance (a) and average seasonal abundance (b) of echinoderm larvae, larvaceans and molluscan larvae in the Irish Sea, as taken from CPR data.

40
Seasonal distributions from averaged CPR data suggest a peak in abundance around July/August (Figure 8.9b), though the timing of this peak has been shown to vary over the last 30 years (Figure 8.8b). Other reports show peaks in abundance differed in the Irish Sea with a maximum in July for central mixed waters (Lee, 1971) and a peak in March /April for the eastern and western Irish Sea (Lee, 1971; Graziano, 1988). CPR average abundance plots of echinoderm larvae for the past 30 years (Figure 8.9a), show a great deal of temporal variation in numbers, though in general, numbers do not appear to have changed dramatically. 8.5.3 Bryozoans (Cyphonautes) These are the larval forms of the Electra and Membranipora species of bryozoan, which shed eggs into the sea and when hatched give a characteristic triangular shaped larvae, the cyphonautes (Laverack & Dando, 1974). Little information is available for these organisms in the Irish Sea, partly due to their low abundances in the zooplankton. Records of them have been made since 1907 at Port Erin (Scott & Chadwick, 1924), however, these are reported sightings and not actual values of abundance. Average abundances in the Irish Sea appear to have been relatively stable over the last 30 years but with great variability (Figure 8.7b) and are thought to be more abundant in the north-western Irish Sea compared to the north-eastern (Graziano, 1988). Seasonal distributions (Figure 6.7d) show they have a relatively long period of abundance (March – November). 8.6 Annelids 8.6.1 Polychaete larvae Numerous species of polychaete are present around the British Isles with >250 species present around the Isle of Man alone (Bruce et al., 1963). The larvae of individual species have been identified, with over 23 species recorded from Port Erin Bay on the Isle of Man (Gravely, 1909), but in the current study all species are grouped as “polychaete larvae”. The polychaete larvae distributions in the Irish Sea, from CPR data (Figure 8.10), suggest numbers are mostly limited to the eastern Irish Sea. Care must be taken in interpreting this data as this distribution was arrived from extrapolation due to the low CPR sample points in this region. In contrast Graziano (1988) reported greatest numbers in the western Irish Sea while Scott and Chadwick (1924) reported that large numbers were found in Port Erin Bay from the years 1907-1914. From abundances over time (Figure 8.11a) it appears that little has changed since the 1970’s, with the exception of a large peak in numbers during 1986. CPR seasonal distributions of polychaete larvae in the Irish Sea (Figure 8.11b) show a peak in abundance of polychaete larvae in July. However, previous reports suggest a more complex distribution, Scott and Chadwick (1924) found a peak abundance at Port Erin in March; Lee (1971) found peak abundances in July for central sites, March for eastern sites and in

41
May at the North Channel. To conflict with all findings Graziano (1988) found no real pattern in seasonal abundance of polychaete larvae. 8.6.2 Tomopteris Tomopteris are pelagic polychaetes and although holoplanktonic, have been included here as they are annelids in the class polychaeta. These are relatively large (up to 4cm), with only one species having been recorded in the Irish Sea, T. helgolandica (Williamson, 1956a; Bruce et al., 1963; Lee, 1971; Graziano, 1988). Little work has been done on the distribution of T. helgolandica in the Irish Sea, but it has been noted that in the northern Irish Sea, similarly low abundances were recorded in both the east and west (Graziano, 1988). It terms of seasonal abundances CPR data suggests a peak in August (Figure 8.11b).
a)
b)
Figure 8.10. Irish Sea distribution plots of polychaete larvae (a) and chaetognaths (b) from 1971 – 2001 taken from CPR data.

42
a)
b)
Figure 8.11. The average annual abundance (a) and average seasonal abundance (b) of polychaete larvae, Tomopteris spp. and chaetognaths taken from CPR data.

43
8.7 Chaetognaths The chaetognaths are often referred to as the arrow-worms and are active planktonic predators mostly preying upon small crustaceans such as copepods (Todd & Laverack, 1991). Around the British Isles the only species found are of the genus Sagitta (Newell & Newell, 1977). In the Irish Sea, this is limited to three species; S. elegans, S. setosa and S. serratodentata of which only S. elegans and S. setosa are common (Williamson, 1956a; Lee, 1971, Alvarez-Cadena, 1988). The distributions of the chaetognaths in the Irish Sea from CPR data (1971-2001) (Figure 8.10b) show a relatively widespread abundance with lowest numbers in the southern Irish Sea and a peak in abundance found near Morecambe Bay, though Graziano (1988) found no difference in abundance between the eastern and western regions. Seasonality is shown from CPR data (Figure 8.11b) with numbers peaking during the spring/summer months and lowest values recorded during the winter, as also suggested by Graziano (1988) and Alvarez-Cadena (1988). On a species level, S. serratodentata is quite uncommon but was reported in the northern Irish Sea in 1950 (Fraiser, 1952) with it’s presence attributed to an unusually strong south-going current through the North Channel (Williamson, 1956a). The distribution of S. setosa in the Irish Sea is limited during May and virtually the entire population occurs within Liverpool Bay. It spreads rapidly during June to the east coast of the Isle of Man and is common throughout the eastern Irish Sea from July to December. S. elegans generally occurs in the deeper parts of the western Irish Sea, where it spreads east to the inner parts of Liverpool Bay in the winter months and the outer parts in the spring and summer, with numbers in the east restricted during late autumn (Williamson, 1975). A more recent study (Dickey-Collas et al., 1996) of S. elegans has suggested that breeding occurs in the western Irish Sea from February to September. Dickey-Collas et al. (1996) suggests that the gyre in this region retains the population in this area over the summer. This allows this population to produce more eggs than those in the mixed and inshore regions of the western Irish Sea. When average abundances of chaetognaths in the Irish Sea are observed from the 1970’s (Figure 8.11a), a worrying trend is noted. It can be seen that there has been a steady decline in numbers over the last 30 years. This dramatic reduction could be explained by the fact that copepods and other small crustaceans are the main prey items for chaetognaths (Pearre, 1980), and as shown previously they too have also fallen in abundance since the 1970’s. 8.8 Gelatinous zooplankton The gelatinous zooplankton covers the coelenterates and ctenophores and can be grouped as macro/megaplankton due to their relatively large sizes. Of the coelenterates, there are oceanic medusa, which have direct development and neritic medusa, which are limited to coastal regions as they have a fixed hydroid stage in their life cycle (Tait, 1992). From historical records a large number of gelatinous zooplankton have been recorded in the Irish Sea (Table 8.2).

44
Table 8.2. Species of gelatinous zooplankton found in the Irish Sea where N.B. – northern boreal, S.B. – southern boreal, B – boreal, C – cosmopolitan, S – southern distributions. (From Russell, 1953) Although many species have been reported historically, recent data are limited with very few studies on gelatinous zooplankton in the Irish Sea. In terms of distributions, Graziano (1988) suggested that abundances in the western and eastern Irish Sea were of a similar size. However, much of the recent data is in the form of personal observations rather than scientific reports and it is noted that some species can produce very large swarms. In the Irish Sea this has been the case with Aurelia aurita, Pelagia noctiluca and the ctenophores, even to the extent of clogging fishing nets (Russell, 1970). For most coelenterates and ctenophores there is a seasonal cycle of abundance peaking between May and June, with very low numbers occurring during the winter months (Graziano, 1988), (Figure 8.12). This seasonality is also shown by coelenterate tissue recorded from CPR data (Figure 8.13), where it is also noted that percent occurrence in the Irish Sea is relatively low, with the exception of a period from 1983 to 1990 where occurrence was high. Not mentioned above are the siphonophores, these are another order of the phylum Coelentrata. These are not individuals as such but a colony of several kinds of well-integrated polymorphic hydroid and medusoid individuals, the most notorious being Physalia physalis, the Portuguese Man-o’-War (Newell & Newell, 1977). Relatively few species are found in British waters and in the Irish Sea this is mostly limited to Velella velella (By-the-Wind Sailor). Although not common, being a warmer water species, V. velella is occasionally seen in large swarms and has been observed on coasts of the southern Irish Sea sporadically with sightings in 1954, 1976-84, 1992 and 2002 (MarLIN, 2003). As previously mentioned coelenterates are capable of swarming in very large numbers. The importance of this is that the majority are carnivorous, and therefore if found in high

45
enough abundances can lead to a significant predatory effect on copepods and fish larvae (Bunn et al., 2000).
Figure 8.12. Seasonal distribution of hydrozoa compared between east and west northern Irish Sea in 1986-7 (Graziano, 1988)
Figure 8.13. Annual seasonal distribution of coelenterata material collected between 1971 and 2000, using CPR data, with years on y axis and months on x axis.

46
9 RESTING STAGES IN SEDIMENTS AND BALLAST WATER
9.1 Resting stages Both phytoplanktonic and zooplanktonic organisms produce resting stages, these can remain in sediments for a considerable period of time before hatching. In the zooplankton most information comes from copepods of which 44 species have been shown to produce two types of eggs, the normal or subitaneous eggs and resting or diapause eggs. The production of these diapause eggs is caused by a change in environmental conditions and is induced by high population densities or a combination of shortening day length and temperature reduction. Once formed these diapause eggs do not develop immediately but sink to the seabed. If buried in the sediment the duration of the resting stage is increased and in some species can remain viable for as long as 40 years. However, in general the resting stages are a seasonal occurrence and hatch-time is measured in months, triggered by a period of cooling. (see review in Mauchline (1998)). In the Irish Sea Acartia spp. Centropages spp. and Temora longicornis are all known to produce diapause eggs (Kasahara et al., 1974; Lindley, 1990). They were found to be most abundant in sediments at a water depth of between 20m and 80m with a low seabed stress and near to tidal fronts. From predictive modelling they are suggested to be highly abundant in the sediments of Dublin bay and the eastern Irish Sea (especially Morecambe Bay and Liverpool Bay), (Lindley, 1990). The main cause of distribution of these eggs is through sedimentation, re-suspension and sediment transport (Lindley, 1990; Mauchline, 1998). The hatching of these eggs is thought to be a critical factor in influencing the overall distribution of these copepods (Lindley, 1990) In the phytoplankton the most common and abundant group of encysting organisms are the dinoflagellates and in the Irish Sea over 45 dinoflagellate cyst taxa have been identified (Marret & Scourse, 2002). These cysts are formed due to either adverse environmental conditions or following sexual reproduction. As with diapause eggs these cysts sink to the seabed but due to their hydrodynamic properties cysts tend to be concentrated in fine rather than coarse sediments (Marret & Scourse, 2002). These cysts are transported a considerable way by water currents, especially during the winter months due to storm re-suspension events (Reid, 1975; Marret & Scourse, 2002). Certain species of diatoms are also able to produce resting stages known as auxospores either as a result of increased environmental stress or as a result of sexual reproduction. An important fact about the distribution of these dinoflagellate cysts in the Irish Sea is that Marret & Scourse (2002) observed cysts of the genus Alexandrium . The relevance of this is that members of this genus are known to produce toxins associated with paralytic shellfish poisoning and therefore, after hatching can cause a bioeconomic risk for the fisheries industry in this area. Another observation was that populations of dinoflagellate cysts differ between water masses and it is possible to identify distinct hydrographic regions from the cyst populations (Reid, 1975; Marret & Scourse, 2002).

47
9.2 Ballast waters The realisation that planktonic organisms can survive ships pumps has been known since the 1890’s where a number of biologists used ship seawater systems to collect plankton samples. However, it was Ostenfeld (1908) who first proposed shipboard transportation of an organism as an explanation concerning the occurrence of the Asian diatom Odontella (Biddulphia) sinensis into the North Sea in 1903 (review in Carlton (1985)). During transport in ballast tanks organisms have to put up with hostile conditions with a lack of light, varying temperatures, and reduced food availability (Carlton, 1985). However, as some planktonic organisms can produce resting stages, there survival in even the harshest conditions and subsequent hatching is of no surprise. A study in Australia (Hallegraeff & Bolch, 1992) surveyed cargo boat ballast tanks and showed 65% were carrying significant amounts of silt in the bottom of their ballast tanks. All of these sediments contained diatoms and diatom auxospores and 50% contained dinoflagellate resting spores that were not endemic to Australian waters. As well as transport in the sediment, Williams et al. (1988) found 22 zooplankton species and 45 other planktonic taxa in ballast water, in cargo vessels operating between Japan and Australia. Therefore, it can be assumed that sediments and water in ballast tanks are an important vector for the spread and introduction of planktonic species. Introduction of such species can lead to the problem of genetic mixing of different stocks and the introduction of new species to an environment (Carlton, 1985). It is also noted that the transport of these organisms can also occur on a smaller scale in domestic traffic, which can rapidly move nuisance species and increase the distributional ranges of species (Lavoie et al., 1999). With specific reference to the Irish Sea little information is available, but it must be assumed that introductions of new species to the North Sea and English Channel may also be represented in the Irish Sea. The introduction of a new species can have unfavourable effects and one such introduction reported in the Irish Sea is the non-indigenous diatom Coscinodiscus wailesii originally from the Pacific and Sea of China. It was first reported in the English Channel in January of 1977 and by June/July of 1978 was found in the eastern Irish Sea and now has a sizable population (Edwards et al., 2001). Although non-toxic, blooms have been reported to produce large quantities of mucilage which attracts sediment particles causing problems to fishermen, such as the clogging and breaking of fishing nets (Boalch & Harbour, 1977). The introduction of new marine species from ballast waters has increased from the 1960’s and is now thought to be responsible for about 20% of all new species introduced to the marine environment in Britain (for a full review of all species identified see Eno et al., (1997)).
48
10 CONTAMINANTS AND POLLUTION AFFECTING PLANKTON
10.1 General pollutants A great number of pollutants and contaminants enter the sea as a result of human activities. These include degradable wastes such as urban sewage, agricultural waste, industrial waste and oil spillages; dissipating waste as inert particulates; and conservative waste such as heavy metals, pesticides and radioactivity. The sources of such inputs can occur from sewage pipes, estuaries/river inputs, shipping, offshore dumping of sewage sludge and other contaminants, dredging and rainout from the atmosphere. The impact of such pollution depends upon the chemical composition, concentration, persistence, bioaccumulation, and recycling characteristics of a substance (Clark, 1986). Although organic wastes would appear not to be too harmful as they are naturally broken down, effects can include pathogens in sewage and eutrophication and oxygen depletion of the water due to increased nutrient and organic carbon loading (GESAMP, 1990). In the Irish Sea recent studies have suggested this very fact, with eutrophication moving offshore into the Irish Sea, as a consequence of a long-term rise in nitrogen and phosphorus (Allen et al., 1998). Inert particles cause the problem that they can increase the turbidity of waters and thus lead to a reduction in primary production by reducing light penetration of the water causing a reduced photosynthetic potential (Clark, 1986). The effect of turbidity is also apparent from marine aggregate extraction and dredging, which can produce a turbidity plume in the water column (Jones et al., 2004). The effect of heavy metals on the plankton is relatively mild, with the exception of organic mercury, as most are not assimilated (Clark, 1986). In phytoplankton, mercury is taken up by passive diffusion and rapidly eliminated, however, in zooplankton mercury accumulates in fatty tissue (GESAMP, 1990). In the Irish Sea generally higher concentrations of mercury are observed in the eastern Irish Sea. This is especially true in areas formerly used for dumping sewage sludge where mercury levels are particularly high (Gardner & Riley, 1973) The effects of radioactivity on the plankton are thought not to be too great (Clark, 1986), however, Merino et al. (2000) showed radioactivity levels in phytoplankton in the Irish Sea to be greatest near Sellafield, decreasing in a westward direction. However, in both phytoplankton and zooplankton the plutonium assimilated was more than 16 years old suggesting that uptake of radioactivity from disturbed sediments and not new releases were the main cause of contamination. 10.2 Oil pollution When considering pollution caused by oil, although short-term effects are easily observed it must be noted that hydrocarbons are a natural constituent of seawater (at about 10ppb (Cormack, 1983)) being produced by both phtyo- and zooplankton. Therefore as a natural source of energy are readily broken down by bacteria and other animals (Parsons et al., 1995).

49
In fact the actual amount of pollution caused by well publicised oil tanker spills is relatively low (Figure 10.1).
Figure 10.1. Sources of oil input into the marine environment (Cormack, 1983)
However these spills do detrimentally affect the environment and within recent years (1989-1998), six shipping incidents (other than large scale spills) involving the discharge of oil have occurred in the Irish Sea, with a total of 43 tonnes of oil released into the marine environment (Jones et al., 2004). Of the very substantial discharges, 3 of the largest 20 spills around the world have occurred in UK waters (Table 10.1), with the Sea Empress occurring in the southern Irish Sea.
Table 10.1. Showing recent large oil spill in UK waters (White & Baker, 1998) The severity of oil pollution depends upon the hydrocarbons involved, as those with the lower boiling points (the aromatics) are most toxic (White & Baker, 1998), but at the same time are lost from the environment most rapidly. Therefore, if polluted a rapid drop in primary production due to these volatile toxic fractions is observed but as these are rapidly lost from the water, production has been shown to start to recover after 3 days (Corner, 1978). Evaporation is the primary process for hydrocarbon removal (especially for the more volatile fractions) from the marine environment (Jordan & Payne, 1980) so the effects of hydrocarbons can vary seasonally, as high temperatures and wind speeds will increase

50
evaporation and reduce the toxicity of oil in the water (Corner, 1978; White & Baker, 1998). Studies of oil pollution have shown that different phytoplankton species have different sensitivities to crude oil, through the inhibition of photosynthesis (review in Corner, 1978). Though it has also been noted that low levels of oil pollution can actually enhance primary production (Kelly, 1999). One important fact is that crude oil pollution can alter the ecosystem structure of the phytoplankton, which in turn can change the structure of the microzooplankton, which represent the next trophic level. However, although less is known about the effects on the zooplankton, it has been noted that crab and lobster larvae are particularly sensitive to hydrocarbons (Corner, 1978). After the Sea Empress disaster the effects of the spill on the plankton were studied (Batten et al., 1998). From this investigation is was noted that no significant effect on planktonic community was seen as no marked changes in major species in phytoplankton or zooplankton occurred. However, barnacle larvae were not seen post spill, thus the zooplanktonic community may have shown a minor population shift from the previous year.
11 CLIMATIC INFLUENCE ON PLANKTON ECOLOGY.
The Earth's climate has warmed by approximately 0.6 °C over the last century. Two main periods of warming have been identified, between 1910 and 1945 and from 1976 onwards. The rate of warming from 1976 has been approximately double that of between 1910 and 1945 and is greater than at any other time during the last millennium. Ecological communities do not, however, respond to approximated global averages. Regional changes, which are highly spatially heterogeneous, are more relevant in the context of the ecological response to climatic change (Climate Change, 2001). Sea surface temperature (SST) measurements of the Irish Sea have been undertaken by the Port Erin Marine Laboratory since 1904. These data show that SSTs have risen by approximately 0.7˚C since records began. The effects of global warming on marine ecosystem functions are only now beginning to be understood, however, regional studies on the Irish Sea specifically are limited. Richardson and Schoeman (2004) investigated the climatic impact on plankton in the Northeast Atlantic and showed how SST warming in this region was accompanied by increased phytoplankton abundance in cooler regions and decreased phytoplankton abundance in warmer regions. This impact was shown to propagate up the food-web through copepod herbivores to zooplankton carnivores because of tight trophic coupling. Future warming of such seas is likely to alter the distributions of both primary and secondary producers and will undoubtedly have knock-on effects throughout the rest of the ecosystem with the possible demise of fish and higher trophic levels in certain seas. The dramatic shift in zooplankton abundance described in section 8 may well be a direct result of recent warming of Irish Sea waters and current research both in the UK and other regions of Europe are currently addressing such phenomena.
51
Year-to-year fluctuations in wintertime air temperatures on both sides of Iceland have often been observed to be out of phase with one another (van Loon & Rogers, 1978). When temperatures are below normal over Greenland, they were above normal in Scandinavia. Simultaneously, coherent fluctuations in temperatures, rainfall and sea level pressure were documented over a region spanning eastwards to central Europe, southwards to subtropical West Africa and westwards to North America (Marshall et al., 2001). This mode of climate variability is known as the North Atlantic Oscillation (NAO) and is defined as the difference in atmospheric pressure between the Icelandic low and Azores high (Hurrell, 1995). The winter NAO index is calculated on the basis of the normalised sea-level pressure differences between the Icelandic low and Azores high from December to March. During NAO positive years the resulting pressure differences are at their greatest. This leads to stronger than normal westerly winds, higher atmospheric temperatures, increased precipitation and increased river flows over north-western Europe (Hurrell, 1995). When the NAO is negative, westerly winds are weaker, precipitation is lower and the winter air temperatures are influenced by the cold low-pressure systems of continental Europe and Asia. It is now firmly established, that the North Atlantic Oscillation has a large climatic influence on the North Atlantic Ocean and surrounding landmasses from North America to Siberia, and from the Arctic Ocean to the equator (Marshall et al., 2001). Changes in the NAO have been associated with a wide range of effects on marine ecosystems. These not only have an influence on the physical and chemical characteristics of the Eastern Atlantic seas (Dickson, 1997; Shorthouse & Arnell, 1997) but also upon the biology of such waters (Fromentin & Planque, 1996; Reid et al., 1998; Hänninen et al., 1999; Ottersen & Stenseth, 2001). This includes changes in the production of zooplankton (Fromentin & Planque, 1996; Nash & Geffen, 2004) and the distribution of fish (Dickson & Brander, 1993; Mann & Drinkwater, 1994). Evidence has also emerged that changes in the phytoplankton community of the North Atlantic are influenced by the NAO such that the monthly mean chlorophyll concentrations have increased between 1945 and 1995 in the central North Sea and central Northeast Atlantic, yet have decreased in waters of the northern Northeast Atlantic (Fromentin & Planque, 1996, Edwards et al., 2001). These large-scale chlorophyll variations have been attributed to regional atmospheric forcing anomalies upon sea temperatures of the Northeast Atlantic, which altered the centre of deep-water convection from the Greenland Sea to the Labrador Sea after 1988 (Dickson et al., 1996). Overall, the North Atlantic Oscillation is now recognised as one of the major controlling factors of basic meteorological variables (surface wind, air temperature, precipitation), which could have large socio-economic impacts on energy, agriculture, industry, traffic and human health throughout the whole of Europe and eastern North America. Kennington et al. (unpublished) have recently shown how the NAO has both direct and indirect influences upon the hydrology, nutrient chemistry and phytoplankton ecology of the Irish Sea. Kennington et al.’s study suggests that the winter nitrate levels in the Irish Sea are primarily driven by freshwater inputs and possibly by the transport of waters with Atlantic origin. These observed fluctuations in nitrate concentration were strongly related to the NAO; during positive NAO years precipitation and river runoff increases subsequently leading to increased nutrient discharge to the Irish Sea from land-based sources (Figures 11.1 and 11.2a&c).

52
Figure 11.1. Salinity values at the Cypris station compared with the NAOI (from Kennington et al. unpublished). Kennington et al.’s (unpublished) study also showed that during high NAO index years (which are associated with the flow of moist and warm air across Europe and consequently warmer winters), seasonal stratification of the water column was established later than for negative years. This appears to be a contributing factor in the timing of the spring chlorophyll maximum, which also occurred later during such years. The effect of such hydro-climatological changes upon higher trophic levels can at this stage only be speculated on. The distributions of two dominant copepod species have been shown to be tied to the NAO in the eastern North Atlantic (Fromentin & Planque, 1996) and the Irish Sea (Nash & Geffen, 2004 see Figure 6.5a&b). However, relatively few studies have looked at the influence of such fluctuations upon fish (Marsh et al., 1999; Dickson & Brander, 1993; Mann & Drinkwater, 1994; Fromentin et al., 1998) or other marine communities. It appears that the North Atlantic Oscillation has a major controlling influence upon the dynamics of phytoplankton (the base of the marine food web) in the Irish Sea. Most likely other north Atlantic shelf seas are also under the influence of the NAO, either directly (via water mass advection, increased storminess etc.) or indirectly (via regulation of freshwater discharge, nutrient inputs to the coastal environment or via changes in the dominant predator (zooplankton) species.

53
Figure 11.2. Correlations between the North Atlantic Oscillation Index and depth of winter mixing (A), surface nitrate concentrations (B), timing of chlorophyll maximum (C), and timing of stratification (D) at the Cypris station since the 1950’s. (from Kennington et al., unpublished) 12 CONCLUSIONS This report summarises information on the ecology of planktonic species found in SEA area 6 of the Irish Sea. From the information presented it can be seen that the Irish Sea is very diverse with regard to not only the physical-chemical regimes operating upon it, but also the ecology of planktonic organisms found there. Data on the nutrient chemistry of the Irish Sea shows that the eastern Irish Sea is more heavily impacted by nutrients owing to freshwater run-off from land, which is far greater in the east than in the western Irish Sea. The analysis of temporal trends in the nutrient data also shows that nutrients increased from the 1950’s to the 1980’s after which time the concentrations have levelled off and in some case declined. Phytoplankton biomass appears to have mirrored the influence of the nutrients both in time and space. Highest biomass (inferred from chlorophyll analysis) is generally found in regions of low salinity and tends to be greatest in the eastern Irish Sea. The temporal chlorophyll analysis also shows that chlorophyll increased from the 1950’s and continued to increase until the 1990’s where a subsequent decrease in concentration has been observed. The phytoplankton community has also been shown to vary throughout the seasons and also within different regions or ‘ecohydrodynamic’ domains of the Irish Sea

54
The zooplankton community of the Irish Sea has also undergone significant change over the last thirty or so years. The most noticeable of these changes being a significant decrease in abundance of most of the species recorded. Some species distributions and abundances have been shown to be influenced by climate and it is highly likely that other species of plankton in the Irish Sea are also affected in this way. Climate or the North Atlantic Oscillation (NAO) more specifically, certainly has a major impact upon the physical-chemical environment of the region and this has a direct influence upon the ecology of planktonic organisms found in the Irish Sea.
13 AKNOWLEDGEMENTS Thanks must be given to David Johns and Martin Edwards at SAHFOS for their input and preparation of the plankton distribution and long-term average figures from CPR data. Also thanks must be given to Dr. Richard Nash Institute of Marine Research, Bergen) for use of his as yet unpublished western Irish Sea zooplankton data and for proof-reading this report. Theresa Shammon and John Slinn (PEML) are also thanked for the use of the Cypris time-series.

55
14 REFERENCES Allen, J.R., Slinn, D.J., Shammon, T.M., Hartnoll, R.G. and Hawkins, S.J. (1998),
Evidence for eutrophication of the Irish Sea over four decades. Limnol. Ogeanogr. 43: 1970-1974.
Alvarez-Cadena, J.N. (1988), Population dynamics and feeding habits of the chaetognaths Sagitta elegans Verril and Sagitta setosa Müller in Manx waters, north Irish Sea. PhD Thesis, Liverpool. pp: 98.
Anonymous. (2004a), Understanding of undesirable disturbance in the context of eurtophication, and development of UK methodology for coastal and marine waters. Stage I project report: What is undesirable disturbance? Published for DEFRA by Napier University, Edinburgh. pp: 200.
Anonymous. (2004b), Understanding of undesirable disturbance in the context of eutrophication, and development of UK methodology for coastal and marine waters. Stage II project report: Measuring undesirable disturbance? Published for DEFRA by Napier University, Edinburgh. pp: 126.
Bassett, H. (1909, unpublished), The flow of water through the Irish Sea. Lancashire Sea Fisheries Laboratory. Report 18: 148-157.
Batten, S.D., Allen, R.J.S. and Wotton, C.O.M. (1998), The effects of the Sea Empress oil spill on the plankton of the southern Irish Sea. Mar. Poll. Bull. 36: 764-774.
Barns, R.S.K. and Hughes, R.N. (1988), An Introduction To Marine Ecology. Blackwell Sciences Ltd. Oxford. pp: 351.
Beaugrand, G., Brander, K.M., Lindley, J.A., Souissi, S. and Reid, P.C. (2003), Plankton effect on cod recruitment in the North Sea. Nature. 426: 661-664.
Bolach, G.T. and Harbour, D.S. (1977), Unusual diatom off the coast of south-west England and its effect on fishing. Nature. 269: 687-688.
Bruce, J.R., Colman, J.S. and Jones, N.S. (1963), Marine Fauna of the Isle of Man. Liverpool University Press. Liverpool. pp: 307.
Bunn, N.A., Fox, C.J. and Webb, T. (2000), A literature review of studies on fish egg mortality: Implications for the estimation of spawning stock biomass by the annual egg production method. Sci. Ser. Tech. Rep., CEFAS, Lowestoft. 111: 37.
Carlton, J.T. (1985), Transoceanic and interoceanic dispersal of coastal organisms: The biology of ballast water. Oceanogr. Mar. Biol. Ann. Rev. 23: 313-371.
Clarke, R.B. (1986), Marine pollution. Oxford University Press. Oxford. pp: 215. Climate Change. (2001). Third Assessment Report of the Intergovernmental Panel on
Climate Change IPCC (WG I & II). Cambridge University Press. Cambridge. Cormack, D. (1983), Response to oil and chemical marine pollution. Applied Science
Publishers. London. pp: 531. Corner, E.D.S. (1978), Pollution studied with marine plankton. Part I. Petroleum
hydrocarbons and related compounds. Adv. mar. Biol. 15: 289-380. Dickey-Collas, M., Stewart, B.M. and Gowen, R.J. (1996), The role of thermal
stratification on the population dynamics of Sagitta elegans Verrill in the western Irish Sea. J. Plank. Res. 18: 1659-1674.
Dickey-Collas, M., Brown, J., Fernand, L., Hill, A.E., Horsburgh, K.J. and Garvine, R.W. (1997), Does the western Irish Sea gyre influence the distribution of pelagic juvenile fish? J. Fish Biol. 51(Supplement A): 209-229.
Dickey-Collas, M., McQuaid, N., Armstrong, M.J., Allen, M. and Briggs, R.P. (2000), Temperature-dependent stage durations of Irish Sea Nephrops larvae. J. Plank. Res. 22: 749-760.

56
Dickson, R.R. (1997), From the Labrador Sea to global change. Nature. 386: 479-481. Dickson, R.R. and Boelens, R.G.V. (1988), The status of current knowledge on the
anthropogenic influences in the Irish Sea. ICES Co-operative Research Report No: 155.
Dickson, R.R. and Brander, K.M. (1993), Effect of changing windfield on cod stocks of the North Atlantic. Fish. Oceanogr. 2: 124-153.
Dickson, R.R., Laiser, J., Meincke, J., Rhines, P. and J., S. (1996), Long-term coordinated changes in the convective activity of the North Atlantic. Prog. Oceanogr. 38: 241-295.
Economou, A.N. (1991), Food and feeding ecology of five gadoid larvae in the northern North Sea. J. Cons. perm. int. Explor. Mer. 47: 339-351.
Edwards, M., Reid, P. and Planque, B. (2001), Long-term and regional variability of phytoplankton biomass in the Northeast Atlantic (1960-1995). ICES J. mar. Sci. 58: 39-49.
Edwards, E.S. and Burkill, P.H. (1995), Abundance, biomass and distribution of microzooplankton in the Irish Sea. J. Plank. Res. 17: 771-782.
Eno, N.C., Clark, R.A. and Sanderson, W.G. (1997), Joint Nature Conservation Committee: Non-native marine species in British waters: a review and directory. Joint Nature Conservation Committee. Peterborough. pp: 136.
Evans, G.L., Williams, P.leB. and Michelson-Jacob, E.G. (2003), Physical and anthropogenic effects on observed long-term nutrient changes in the Irish Sea. Estuar. Coast. Shelf Sci. 57: 1159-1168.
Fraiser, J.H. (1952), The chaetognath and other zooplankton of the Scottish area and their value as biological indicators of hydrographic conditions. Scot. Home Dept., Mar. Res. 2: 1-52.
Fromentin, J.-M. and Planque, B. (1996), Calanus and environment in the eastern North Atlantic. II. Influence of the North Atlantic Oscillation on Calanus finmarchicus and Calanus helgolandicus. Mar. Ecol. Prog. Ser. 134: 111-118.
Fromentin, J-M., Stenseth, N.C., Gjøsæter, J., Johannessen, T. and Planque, B. (1998), Long-term fluctuations in cod and pollack along the Norwegian Skagerrach coast. Mar. Ecol. Prog. Ser. 162: 265-278.
Gardner, D. and Riley, J.P. (1973), Distribution of dissolved mercury in the Irish Sea. Nature. 241: 526-527.
GESAMP. (1990), The state of the marine environment. Blackwell Scientific Publications, Oxford. pp: 146.
Gowen, R.J. and Bloomfield, S.P. (1996), Chlorophyll standing crop and phytoplankton production in the western Irish Sea during 1992 and 1993. J. Plank. Res. 18: 1735-1751.
Gowen, R.J. and Stewart, B.M. (2005 in press), The Irish Sea: Nutrient status and phytoplankton. J. Sea Res.
Gowen, R.J., Stewart, B.M., Mills, D.K. and Elliot, P. (1995), Regional differences in stratification in the western Irish Sea during 1992 and 1993. J. Plank. Res. 17: 753-769.
Gowen, R.J., Dickey-Collas, M. and McCullough, G.M. (1997), The occurrence of Calanus finmarchicus (Gunnerus) and Calanus helgolandicus (Claus) in the western Irish Sea. J. Plank. Res. 19: 1175-1182.
Gowen, R.J., McCullough, G.M., Dickey-Collas, M. and Kleppel, G.S. (1998), Copepod abundance in the western Irish Sea: relationship to physical regime, phytoplankton production and standing stock. J. Plank. Res. 20: 315-330.

57
Gowen, R.J., Mills, D.K., Trimmer, M. and Nedwell, D.B. (2000), Production and its fate in the coastal regions of the Irish Sea: the influence of anthropogenic nutrients. Mar. Ecol. Prog. Ser. 208: 51-64.
Gowen, R.J., Hydes, D.J., Mills, D.K., Stewart, B.M., Brown, J., Gibson, C.E., Shammon, T.M., Allen, M. and Malcolm, S.J. (2002), Assessing trends in nutrient concenrtations in coastal shelf seas: a case study in the Irish Sea. Estuar. Coast. Shelf Sci. 54: 927-939.
Gravely, F.H. (1909), Polychaete larvae of Port Erin Bay. Proc. L'pool biol. Soc. 23: 575-653.
Graziano, C. (1988), Some observations on the plankton of the north Irish Sea. PhD Thesis, Liverpool. pp: 121.
Graziano, C. (1989), On the ecology of tintinnids (Ciliophora: Oligotrichida) in the north Irish Sea. Estuar. Coast. Shelf Sci. 29: 233-245.
Hallegreff, G.M. and Bolch, C.J. (1992), Transport of diatom and dinoflagellate resting spores in ships' ballast water: implications for plankton biogeography and aquaculture. J. Plank. Res. 14: 1067-1084.
Hänninen, J., Vuorinen, I. and Hjelt, P. (1999), Climatic factors in the Atlantic control the oceanographic and ecological changes in the Baltic Sea. Limnol. Ogeanogr. 45: 703-710.
Hartnoll, R.G. (2000), Seas at the millenium: an environmental evaluation. Volume I: The Irish Sea. C.R.C. Sheppard (ed). Pergamon Press. Oxford. pp: 83-98.
Hartnoll, R.G., Kennington, K. and Shammon, T.M. (2002), Eutrophication in the Irish Sea - a threat to biodiversity? In: Marine biodiversity in Ireland and adjacent waters. J.D. Nunn (ed). MAGNI publication number 008. CEDaR, Ulster Museum, Botanic Gardens. Belfast. pp: 121-130.
Helm, M.M., Hepper, B.T., Spencer, B.E. and Walne, P.R. (1974), Lugworm mortalities and a bloom of Gyrodinium aureolum Hulbert in the eastern Irish Sea, Autumn 1971. J. mar. biol. Ass. UK. 54: 857-869.
Hill, A.E., Durazo, R. and Smedd, D.A. (1994), Observations of a cyclonic gyre in the western Irish Sea. Con.l Shelf Res. 14: 479-490.
Hill, A.E., Brown, J. and Fernand, L. (1996), The western Irish Sea gyre: a retention system for Norway Lobster (Nephrops norvegicus)? Oceanologica Acta. 19: 357-368.
Hjort, J. (1914), Fluctuations in the great fisheries of northern Europe viewed in the light of biological research. Rapp. P.-v. Reun. Cons. Perm. int. Explor. Mer. 20: 1-228.
Hurrell, J.W. (1995), Decadal trends in the North Atlantic Oscillation: regional temperatures and precipitation. Science. 269: 676-679.
Irish Sea Study Group, (1990), The Irish Sea: An environmental review. Volume II. Irish Sea Study Group, University of Liverpool Press. London.
Jones, K.J., Ayres, P., Bullock, A.M., Roberts, R.J. and Tett, P. (1982), A red tide of Gyrodinium aureolum in sea lochs of the Firth of Clyde and associated mortalities of pond reared salmon. J. mar. biol. Ass. UK. 62: 771-782.
Jones, L.A., Coyle, M.D., Gilliland, P.M., Larwood, J.G. and Murray, A.R. (2004), Irish Sea Marine Natural Area Profile: A contirution to regional planning and management of the seas around England. English Nature, Peterborough. pp: 101
Jones, P.G.W. and Haq, S.M. (1963), The distribution of Phaeocystis in the eastern Irish Sea. J. Cons. perm. int. Explor. Mer. 28: 8-20.
Jordaan, A. and Brown, J.A. (2003), The risk of running on empty: the influence of age on starvation and gut fullness in larval Atlantic cod (Gadus morhua). Can. J. Fish. Aquat. Sci. 60: 1289-1298.

58
Jordan, R.E. and Payne, J.R. (1980), Fate and weathering on petroleum spills in the marine environment. Ann Arbor Science. Michigan. pp: 174.
Kasahara, S., Uye, S. and Onbé, T. (1974), Calanoid copepod eggs in sea-bottom muds. Mar. Biol. 26: 167-171.
Kelly, L.D., McGuinness, L.R., Hughes, J.E. and Wainright, S.C. (1999), Effects of phenanthrene on primary production of phytoplankton in two New Jersey estuaries. Bull. Environ. Contam. Toxicol. 63: 646-653.
Kennington, K., Allen, J.R., Shammon, T.M., Hartnoll, R.G., Wither, A. and Jones, P. (1997), The distribution of phytoplankton and nutrients in the north-east Irish Sea during 1996. Environment Agency R & D Technical Report E30, Bristol.
Kennington, K., Allen, J.R., Shammon, T.M., Hartnoll, R.G., Wither, A. and Jones, P. (1998), The distribution of phytoplankton and nutrients in the eastern Irish Sea during 1997. U.K. Environment Agency R & D Technical Report E55.
Kennington, K., Allen, J.R., Wither, A., Shammon, T.M. and Hartnoll, R.G. (1999), Phytoplankton and nutrient dynamics in the north-east Irish Sea. Hydrobiologia. 393: 57-67.
Kennington, K., Shammon, T.M., Wither, A., Jones, P. and Hartnoll, R.G. (2002), Nutrient inputs to the Irish Sea: Spatial and temporal perspectives. Hydrobiologia. 475-476: 29-38.
Kennington, K., Shammon, T.M., Kraberg, A., Wither, A., Jones, P. and Hartnoll, R.G. (2003), The distribution of nutrient and phytoplankton in the eastern Irish Sea during 2001. U.K. Environment Agency Technical Report E-1049/TR5.
Kennington, K., Wither, A., Shammon, T.M., Jones, P., Harrison, A., Kraberg, A. and Hartnoll, R.G. (2004), The distribution of nutrient and phytoplankton in the eastern Irish Sea during 2002. U.K. Environment Agency Technical Report E-1049/TR6.
Kennington, K., Wither, A., Shammon, T.M., Jones, P., Harrison, A. and Hartnoll, R.G. (2005a), The distribution of nutrient and phytoplankton in the eastern Irish Sea during 2003. U.K. Environment Agency Technical Report E-1049/TR7.
Kennington, K., Waniek, J., Shammon, T.M., Slinn, D.J., Nash, R.D.M., Prien, P. and Hartnoll, R.G. (unpublished manuscript), Biogeochemical signature of recent climate variability in the Irish Sea.
Laverack, M.S. and Dando, J. (1974), Lecture notes on Invertebrate Zoology. Blackwell Scientific Publications. Oxford. pp: 197.
Lavoie, D.M., Smith, L.D. and Ruiz, G.M. (1999), The potential for intercoastal transfer of non-indigenous species in the ballast water of ships. Estuar. Coast. Shelf Sci. 48: 551-564.
Lee, J.W. (1971), Observations on the vertical distribution of plankton at different stations in the Irish Sea. Ph.D., Liverpool. pp: 228.
Lindley, J.A. (1990), Distribution of overwintering calanoid copepod eggs in sea-bed sediments around southern Britain. Mar. Biol. 104: 209-217.
Mandali de Figueiredo, G. (2003), Trophodynamics of the planktonic community in the coastal areas of the central Irish Sea, with emphasis on fish larvae and their prey. PhD Thesis, Liverpool. pp: 186.
Mann, K.H. and Drinkwater, K.F. (1994), Environmental influences on fish and shellfish production in the northwestern Atlantic. Environ. Rev. 2: 16-32.
Marine Institute Foras Na Mara (1999). Ireland’s Marine and Coastal Areas and Adjacent Seas: An Environmental Assessment. pp 388.
MarLIN (2003), The marine life information network for Britain and Ireland (the MBA). Prepared by Olwen Ager. http://www.marlin.ac.uk/species/velellavelella.htm.

59
Marret, F. and Scourse, J. (2002), Control of modern dinoflagellate cyst distribution in the Irish and Celtic Seas by seasonal stratification dynamics. Mar. Micropaleont. 47: 101-116.
Marsh, R., Petrie, B., Weidman, B., Dickson, C.R., Lodder, R.R., Hannah, J.W., Frank, C.G. and Drinkwater, K. (1999), The 1882 tilefish kill - a cold event in shelf waters of the north-eastern United States? Fish. Oceanogr. 8: 39-49.
Marshall, J., Kushnir, Y., Battisti, D., Chang, P., Czaja, A., Dickson, R., Hurrell, J., McCarthney, M., Saravanan, R. and Visbeck, M. (2001), Review: North Atlantic climate variability: Phenomena, Impacts and Mechanism. Int. J. Climatol. 21: 1863-1898.
Mauchline, J. (1998), Advances in marine biology: The biology of calanoid copepods. J.H.S. Blaxter, A.J. Southward, P.A. Tyler (eds). Academic Press Ltd. London. 33: pp: 710.
Merino, J., Sanchez-Cabeza, J.A., Pujol, L., Leonard, K. and McCubbin, D. (2000), Plutonium activity in plankton: New evidence of hold-up time in Irish Sea sediments. J. Radioanal. Nucl. Chem. 243: 517-524.
Montagnes, D.J.S., Poulton, A.J. and Shammon, T.M. (1999), Mesoscale, finescale and microscale distribution of micro- and nanoplankton in the Irish Sea, with emphasis on ciliates and their prey. Mar. Biol. 134: 167-179.
Nash, R.D.M. and Geffen, A.J. (2004), Seasonal and interannual variation in abundance of Calanus finmarchicus (Gunnerus) and Calanus helgolandicus (Claus) in inshore waters (west coast of the Isle of Man) in the central Irish Sea. J. Plank. Res. 26: 265-273.
Newell, G.E. and Newell, R.C. (1977), Marine Plankton: a practical guide. Hutchinson and Company Ltd., London. pp: 244.
OSPAR (2000), Quality Status Report 2000 Region III- Celtic Seas. OSPAR Commission, London. 116 + xiii pp. ISBN 0 946956 49 9.
OSPAR (2002), Commission Assessment of the eutrophication status of the OSPAR maritime area under the common procedure .
Ottersen, G. and Stenseth, N.C. (2001), Atlantic climate governs oceanographic and ecological variability in the Barents Sea. Limnol. Ogeanogr. 46: 1774-1780.
Parsons, T.R., Takahashi, M. and Hargrave, B. (1995), Biological Oceanographic Processes. Pergamon Press Ltd. Oxford. pp: 330.
Pearre, S. (1980), Feeding by Chaetognathata: The relation of prey size to predator size in several species. Mar. Ecol. Prog. Ser. 3: 125-134.
Reid, P.C. (1975), A regional sub-division of dinoflagellate cysts around the British Isles. New Phytol. 75: 589-603.
Reid, P.C., Edwards, M., Hunt, H.G. and Warner, J. (1998), Phytoplankton change in the North Atlantic. Nature. 391: 546.
Richardson, A.J. and Schoeman, D.S. (2004), Climate impact on plankton ecosystems in the Northeast Atlantic. Science. 305: 1609-1612.
Russell, F.S. (1953), The medusae of the British Isles. Part I. Cambridge University Press., Cambridge. pp: 528.
Russell, F.S. (1970), The medusae of the British Isles. Part II. Cambridge University Press. Cambridge. pp: 284.
Scott, J. and Chadwick, H.C. (1924), The Marine Plankton With Special Investigations Made at Port Erin, Isle of Man During 1907-1914. The University Press of Liverpool Ltd. London. pp: 194.
Scrope-Howe, S. and Jones, D.A. (1985), Biological studies in the vicinity of a shallow-sea tidal mixing front V. Composition, abundance and distribution of zooplankton in

60
the western Irish Sea, April 1980 to November 1981. Phil. Trans R. Soc. Lond. B 310: 501-519.
Shammon, T.M., Slinn, D.J. and Hartnoll, R.G. (1997), Long term studies in the Irish Sea: Environmental Monitoring and contamination. 6th annual report to the Department of the Local Government and the Environment of the Isle of Man., Port Erin Marine Laboratory. University of Liverpool., Isle of Man.
Shammon, T.M., Kennington, K. and Hartnoll, R.G. (2004), Long term studies in the Irish Sea: Environmental monitoring and contamination. Summary of results for the years 2002 and 2003. 11th annual report to the Department of the Local Government and the Environment of the Isle of Man 11th Report., Port Erin Marine Laboratory, University of Liverpool. Isle of Man.
Shorthouse, C.A. and Arnell, N.W. (1997), Spatial and temporal variability in European river flows and the North Atlantic oscillation. Friend '97-Regional Hydrology: Concepts and Models for Sustainable Water Resource Management. Proceedings of the Postonja, Slovenia, Conference, Sept-Oct 1997. IAHS Publication No. 246: 77-85.
Simpson, J.H. (1971), Density stratification and microstructure in the western Irish Sea. Deep-sea Res. 18: 309-319.
Tait, R.V. (1992), Elements of marine Ecology. Butterworth-Heinemann Ltd. Oxford. pp: 356.
Todd, C.D. and Laverack, M.S. (1991), Coastal Maine Zooplankton: a practical manual for students. Cambridge University Press. Cambridge. pp: 106.
van Loon, H. and Rogers, J.C. (1978), Seesaw in winter temperatures between Greenland and Northern Europe. 1. General description. Mon. Weather Rev. 104: 365-380.
Vincent, M.A., Atkins, S.M., Lumb, C.M., Golding, N., Lieberknecht, L.M. and Webster, M. (2004), Marine nature conservation and sustainable development - the Irish Sea Pilot. Report to Defra by the Joint Nature Conservaion Committee, Peterborough. pp: 172.
White, I.C. and Baker, J.M. (1998), The Sea Empress oil spill in context. (Paper presented at the international conference on the Sea Empress Oil Spill 11th - 13th February 1998, Cardiff, Wales). The international Tanker Owners Pollution Federation Ltd. pp: 33.
White, R.G., Hill, A.E. and Jones, D.A. (1988), Distribution of Nephrops norvegicus (L.) larvae in the western Irish Sea: an example of advective control on recruitment. J. Plank. Res. 10: 735-747.
Williams, R.J., Griffiths, F.B., Van der Wal, E.J. and Kelly, L. (1988), Cargo vessel ballast water as a vector for the transport of non-indigenous marine species. Estuar. Coast. Shelf Sci. 26: 409-420.
Williamson, D.I. (1956a), The plankton in the Irish Sea. Bull. mar. Ecol. 4: 87-114. Williamson, D.I. (1975), The zooplankton of Liverpool Bay: Liverpool Bay: An
assessment of present knowledge compiled by members of the Liverpool Bat study Group. NERC publication series C. No 14: 46-48.

61
15 APPENDIX
Table 13.1. Dominant phytoplankton spp. in Ecohydrodynamic Typology A during 2001.
Table 13.2. Dominant phytoplankton spp. in Ecohydrodynamic Typology B during 2001.

62
Table 13.3. Dominant phytoplankton spp. in Ecohydrodynamic Typology C during 2001.
Table 13.4. Dominant phytoplankton spp. in Ecohydrodynamic Typology D during 2001.