se 4 q14 slides final v2
TRANSCRIPT

2014 FOURTH QUARTER EARNINGS UPDATE
February 4, 2015
Spectra Energy Growth from a Position of Strength

2014 Fourth Quarter Update | Growth from a position of strength
Safe Harbor Statement
Some of what we’ll discuss today concerning future company performance will
be forward-looking information within the meanings of the securities laws.
Actual results may materially differ from those discussed in these forward-
looking statements, and you should refer to the additional information
contained in Spectra Energy and Spectra Energy Partners’ Forms 10-K and other
filings made with the SEC concerning factors that could cause those results to
differ from those contemplated in today’s discussion. As this is a joint
presentation, the terms “we,” “our,” and “us” refer to Spectra Energy and/or
Spectra Energy Partners, as appropriate.
Reg G Disclosure
In addition, today’s discussion will include certain non-GAAP financial measures
as defined under SEC Regulation G. A reconciliation of those measures to the
most directly comparable GAAP measures is available on our websites.
2

2014 Fourth Quarter Update | Growth from a position of strength
4Q14 Results – EBITDA
3
Spectra Energy Partners Distribution Western Canada Field Services
• Increased earnings from expansions, mainly related to TEAM 2014 and TEAM South placed into service
• Continued ramp up of volumes on Sand Hills and Southern Hills
• Higher crude transportation revenue, mainly due to increased tariff rates on Express
• Decreased earnings from weaker Canadian dollar
• Lower customer usage due to warmer weather
• Higher Empress earnings mainly due to non-cash MTM gains on commodity risk management program, partially offset by lower NGL sales prices
• Higher G&P revenues • Partially offset by weaker
Canadian dollar
• Decreased earnings from: – Lower NGL and crude prices – Increased NCI as a result of
the MTM effect of hedges and growth from dropdowns at DPM
– Partially offset by increased earnings from expansions
PERFORMANCE DRIVERS FOR THE QUARTER:
Ongoing Segment EBITDA ($MM) 4Q14 4Q13 YTD 2014 YTD 2013
Spectra Energy Partners (1) $444 $369 $1,669 $1,440
Distribution 132 156 552 574
Western Canada 250 215 754 736
Field Services (2) (18) 72 229 343
Other 2 (14) (58) (59)
Ongoing SE EBITDA $810 $798 $3,146 $3,034
Ongoing SEP EBITDA(1) $424 $352 $1,591 $1,391 (1) EBITDA for SEP is different than the EBITDA reported for the Spectra Energy Partners segment within SE. The difference is because SEP reports its own Corporate Other when SEP is reported standalone.
These amounts represent the costs of services rendered by SE in support of SEP. These amounts are included in SE’S Corporate Other at the SE level.
(2) Represents equity earnings of DCP + gains from DPM equity issuances. DCP standalone EBITDA (100%) = $246 for 4Q14 & $307 for 4Q13; $1,182 YTD 2014 & $1,157 YTD 2013

2014 Fourth Quarter Update | Growth from a position of strength 4
Spectra Energy: Distributable Cash Flow
(1) Excludes reimbursable expenditures.
SE Distributable Cash Flow ($MM) 4Q14 4Q13 YTD
2014 YTD
2013 Ongoing EBITDA $810 $798 $3,146 $3,034
LESS: Special items – 11 12 34
Reported EBITDA $810 $787 $3,134 $3,000
ADD:
Equity in earnings of unconsolidated affiliates (24) (100) (361) (445)
Distributions from unconsolidated affiliates 107 116 416 348
Empress non-cash items (60) - (60) -
Other (28) (8) (19) 6
LESS:
Interest expense 158 181 679 657
Distributions to noncontrolling interests 47 40 175 144
Maintenance capex (1) 280 229 751 668
Equity AFUDC 20 16 53 105
Net cash paid/(refund) for income taxes (16) 14 (8) 43
Total Distributable Cash Flow $316 $315 $1,460 $1,292
2014 Fourth Quarter Update | Growth from a position of strength
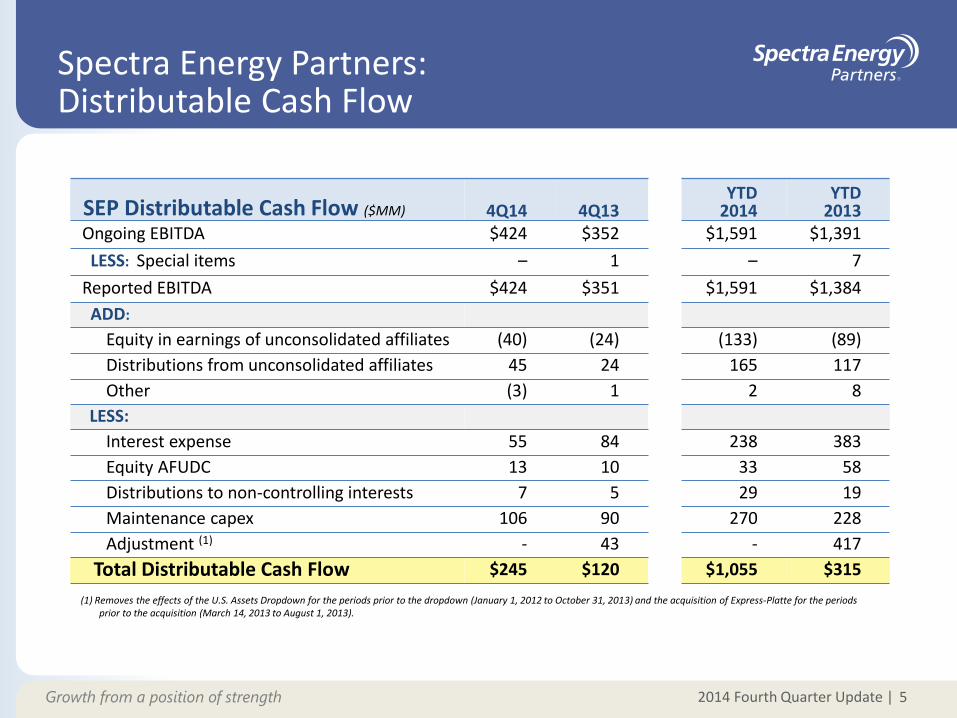
Spectra Energy Partners: Distributable Cash Flow
5
SEP Distributable Cash Flow ($MM) 4Q14 4Q13 YTD
2014 YTD
2013 Ongoing EBITDA $424 $352 $1,591 $1,391
LESS: Special items – 1 – 7
Reported EBITDA $424 $351 $1,591 $1,384
ADD:
Equity in earnings of unconsolidated affiliates (40) (24) (133) (89)
Distributions from unconsolidated affiliates 45 24 165 117
Other (3) 1 2 8
LESS:
Interest expense 55 84 238 383
Equity AFUDC 13 10 33 58
Distributions to non-controlling interests 7 5 29 19
Maintenance capex 106 90 270 228
Adjustment (1) - 43 - 417
Total Distributable Cash Flow $245 $120 $1,055 $315
(1) Removes the effects of the U.S. Assets Dropdown for the periods prior to the dropdown (January 1, 2012 to October 31, 2013) and the acquisition of Express-Platte for the periods prior to the acquisition (March 14, 2013 to August 1, 2013).
2014 Fourth Quarter Update | Growth from a position of strength
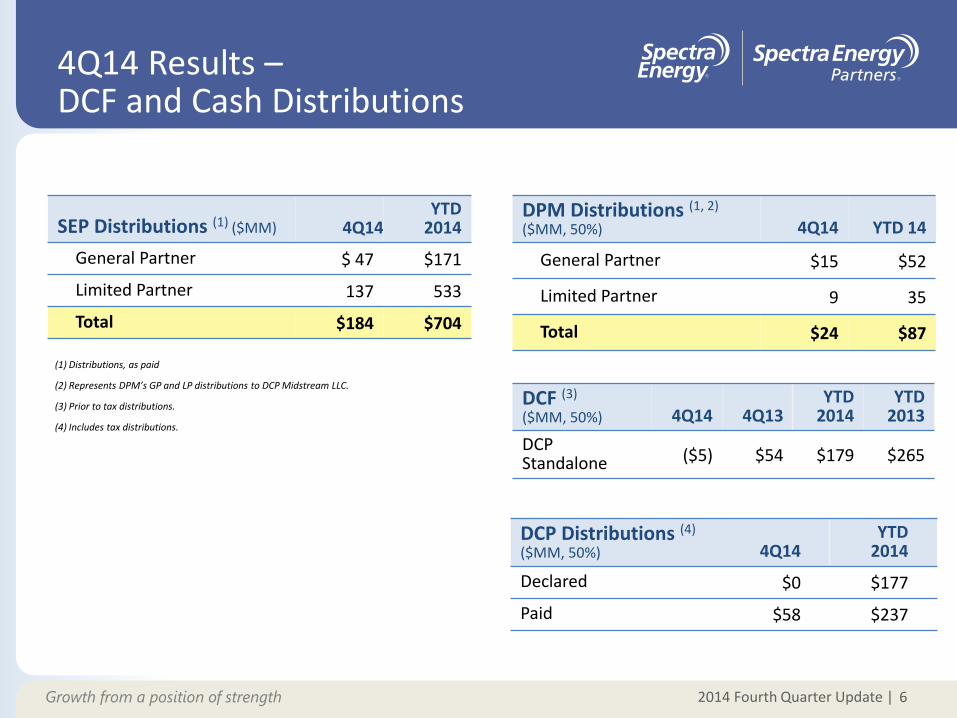
4Q14 Results – DCF and Cash Distributions
6
DPM Distributions (1, 2) ($MM, 50%) 4Q14 YTD 14
General Partner $15 $52
Limited Partner 9 35
Total $24 $87
DCF (3)
($MM, 50%) 4Q14 4Q13 YTD
2014 YTD
2013
DCP Standalone ($5) $54 $179 $265
(2) Represents DPM’s GP and LP distributions to DCP Midstream LLC.
(1) Distributions, as paid
SEP Distributions (1) ($MM) 4Q14 YTD
2014
General Partner $ 47 $171
Limited Partner 137 533
Total $184 $704
DCP Distributions (4) ($MM, 50%) 4Q14
YTD 2014
Declared $0 $177
Paid $58 $237
(4) Includes tax distributions.
(3) Prior to tax distributions.

2014 Fourth Quarter Update | Growth from a position of strength
Strong Finish to 2014
• Solid fee-based businesses continue to perform well
• Strong financial position to enter 2015:
– Strong cash coverage
– Excellent credit metrics
– Investment grade balance sheet
– Multiple financing vehicles to fund growth capex
7
Continued confidence in dividend growth

2014 Fourth Quarter Update | Growth from a position of strength
Financial strength and flexibility & solid growth projects provide solid platform for 2015 and beyond
Exceptional 2014 Results Strongly Position SE for 2015
8
2014 PLAN
$1,460 Distributable
Cash Flow
$3.5B Projects secured with fee-based contracts
1.6x Coverage
at SE
$0.14 Dividend
growth at SE
$1,230 Distributable
Cash Flow
$3.0B Projects secured with fee-based contracts
1.4x Coverage
at SE
$0.12 Dividend
growth at SE
2014 RESULTS
