sdr 2018 - jgl · vizol s/optinol, lactogyn/vagilac/vagisan, normia/adiarin, zerkalin, and...
TRANSCRIPT

1
SDR 2018SUSTAINABLE DEVELOPMENT REPORT FOR 2018

2
GLOBAL DEVELOPMENT PROGRAM BY 2030:17 SUSTAINABLE DEVELOPMENT GOALS

3
JGL DEVOTES PARTICULAR ATTENTION TO THE INTEGRATION OF SIX GLOBAL GOALSIN THE OVERALL BUSINESS AND OPERATIONS PROCESS:
GOAL 14
Preserve and sustainably use
oceans, seas and sea resources
for sustainable development
GOAL 3
Ensure a healthy life and promote
well-being for people of all generations
GOAL 9
Build adaptable infrastructure,
promote inclusive and sustainable
industrialization, and foster innovation
GOAL 8
Promote inclusive and sustainable
economic growth, full employment
and dignified work for all
ONE PART OF THE GOALS IS EMBEDDED IN THE COMPANY’S LONG-TERM STRATEGY, AND THE OTHER PARTS AROSE FROM THE ANALYSES OF KEY STAKEHOLDERS’ NEEDS. THIS REPORT SHOWS OUR EFFORTS IN THEIR IMPLEMENTATION AND PROMOTION.
GOAL 12
Ensure sustainable forms of
consumption and production
GOAL 5
Achieve gender equality
and empower all women and girls

4
GRI STANDARDGENERAL STANDARDS
GRI 102
SPECIFIC STANDARDS
GRI 200 – ECONOMIC TOPICS
GRI 300 – ENVIRONMENTAL TOPICS
GRI 400 – SOCIAL TOPICS
OPINION OF THE COMMISSION OF THE MANAGEMENT BOARD OF THE CROATIAN BUSINESS COUNCIL FOR SUSTAINABLE DEVELOPMENT (HR BCSD)
5
6
29
30
34
47
61
CONTENTS

5
GENERAL STANDARDS

6
102-
14 STATEMENT FROM SENIOR DECISION-MAKER
We will remember the business year 2018 as the year of changes, and according to a wise saying: “If we don't change, we don't grow. If we don't grow, we aren't really living.”
This is the year in which our organisational structure changed. In order to additionally strengthen our operational business and increase cost efficiency, we decided to start the new business cycle with a simpler model of monistic governance. Instead of four executive directors, the new model implies a single executive director who is also a member of the company’s Board of Directors. After a one-year cycle, it has been confirmed that this change further strengthened the interconnectedness of business units within the system and the capability of JGL to adapt more rapidly to market needs and changes that are constant in the globalised market of pharmaceutical products.
However, our main success are positive changes in the market trends of our most important markets and brands. We have strengthened market positions, achieved further profiling and differentiation in strategic areas, and created conditions for further sustainable growth.
The reporting period has been marked by an increase in sales revenue in our core business, i.e. the pharmaceutical part of business (JGL Pharma), by 8 percent compared to the previous period, which was primarily influenced by the increase in sales on the domestic market, the market of Croatia, and key foreign markets of Russia and Ukraine. Along with revenue growth, we have managed to decrease total expenses of our core business by 3 percent and our financial expenses by 24 percent compared to the previous period. In addition to excellent sales results, good price, stock and cost management resulted in an increase in profitability and significantly better business indicators overall, with debt reduction being a particularly important achievement.
It should be noted that operating profitability doubled in 2018 compared
to 2017, leading to conditions in which we were able to express gratitude to our employees and reward them for all their hard work and patience in the midst of this last, and all preceding, years of crisis. Even though this is a great result, we will do even better next year, as we strive to reach and surpass our competitors.
This year will also be remembered for successful projects and initiatives, with the introduction of the new ERP system being the most complex and significant one. Another noteworthy project is “JGL – an energy efficient company” (JGL Energetski učinkovito društvo), co-financed by the European Regional Development Fund as part of the Competitiveness and Cohesion Operational Programme. The project will consist of introducing measures for achieving energy efficiency and using renewable energy sources at JGL Pharma Valley manufacturing facilities in Svilno, and implementing new solutions for improved energy and resource utilisation, all with the aim of reducing the amount of electricity needed to maintain or increase the level of production, increase the share of renewable energy sources in the overall structure of energy sources, and reduce CO2 emissions, which is an important concern for JGL.
In the year before us, we will continue to improve all key business processes, pay even more attention to our employees and strive to further increase their satisfaction and engagement, and to use new business opportunities in the B2C and B2B segments in the best possible way, both for the growth of our company and the professional growth and development of our employees.
We believe in our strengths!
Ivo Usmiani, President of JGL’s Board of Directors

7
102-
110
2-2
1. Organizational profile
NAME OF THE ORGANIZATION
“JADRAN” – GALENSKI LABORATORIJ d.d. / JGL d.d.
JGL GROUP
ACTIVITIES, BRANDS, PRODUCTS, AND SERVICES
JGL’s portfolio includes products of different legislative categories:
• drugs
• medical devices
• cosmetic products (products for general use)
• food supplements
• food for special medical purposes.
Products from the above-mentioned legislative categories have various pharmaceutical forms, including the following:
• pills, pastilles, hard and soft gelatin capsules
• sterile solutions
• compressed formulations (aerosols)
• powders for injections
• powders for oral solutions
• granules
• suppositories
• non-sterile solutions
• ointments, creams and gels
• teas.
Most of the products are produced at JGL’s facilities. Part of the production is contracted to manufacturers with whom the company has developed a partnership. In addition to development and production activities, JGL is also engaged in the wholesale of the above product categories. The company also offers its partners contract manufacturing services, licensing services of JGL products and distribution services (B2B).
The portfolio consists of 160 brands, 460 products, 1,360 variations and 6,000 articles. It is adapted to the specificities of each market and has become recognisable in select market and therapeutic segments, especially in the segments of nasal decongestants based on sea water and ophthalmics in the entire therapeutic spectrum. The most international brand is Aqua Maris, present in more than 20 countries. Other key brands include Meralys/Rinomaris, Dramina, Vizol S/Optinol, Lactogyn/Vagilac/Vagisan, Normia/Adiarin, Zerkalin, and Reflustat.
Within the portfolio of prescription drugs, JGL’s key international segments include dermatology, with a focus on the anti-acne programme, and ophthalmology, with a focus on antiglaucoma drugs.
The sales structure of JGL Pharma by brand in the period from 1 January to 31 December 2018
Aqua MarisMeralys
DraminaVizol S
AknekutanFolacin
LactogynProlife
TIMALENB2B
LATANOXOther
36%7%
6%2%
6%3%
2%3%
1%
1%9%
25%

8
LOCATION OF HEADQUARTERS
Svilno 20, 51000 Rijeka, Republic of Croatia
LOCATION OF OPERATIONS
The company has its headquarters in Rijeka, where production facilities are also located. There are also three other offices in Croatia; in Zagreb, Osijek and Split. Except in Croatia, the company is also present in other markets in Central and Eastern Europe with its operations and products, and outside Europe, the key markets are Russia, Ukraine and Kazakhstan. JGL’s products are present on more than 50 markets.
JGL owns other companies that make up the JGL Group (Adrialab d.o.o., Ljekarna Pablo health institution, Pablo d.o.o. in Croatia, Farmis d.o.o. in Bosnia and Herzegovina, JGL d.o.o. Beograd-Sopot in Serbia, Jadran-Galenski laboratorij d.o.o. Ljubljana in Slovenia, and Jadran LLC Moskva in Russia). The pharmaceutical part of business, i.e. the core business, includes the parent company JGL d.d. and foreign daughter companies.
Key manufacturing activities are located at three addresses:
• JGL d.d. – Svilno 20, 51000 Rijeka, Republic of Croatia
• Adrialab d.o.o. – Pulac 4a, 51000 Rijeka, Republic of Croatia
• JGL d.o.o Beograd-Sopot – Milosava Vlajića 110, 11000 Beograd, Sopot, Serbia
102-
310
2-4
JGL PHARMA
ABROADCROATIA
JGL d.d.
Adrialab d.o.o. Rijeka
Pablo d.o.o. Zagreb
Pablo HI, Rijeka
Farma d.o.o. Sarajevo
Jadran-Galenski laboratorijd.o.o. Ljubljana
JGL North America LLCNew York USA
JGL d.o.o. Beograd-Sopot
Jadran LLC Moskva
Structure of the JGL Group in 2018

9
102-
5
OWNER NUMBER OF SHARES % IN CAPITAL % IN CAPITAL WITH VOTING RIGHTS
Ivo Usmiani 356,834 30.12% 32.20%
Small shareholders 337,435 28.48% 30.46%
Zdravko Saršon 238,496 20.13% 21.53%
Own shares 76,853 6.49% -
Marina Pulišić 41,096 3.47% 3.71%
Eva Usmiani Capobianco 28,732 2.43% 2.59%
Grozdana Božić 28,582 2.41% 2.58%
Vesna Črnjarić 24,162 2.04% 2.18%
Đurđica Miletović Forempoher 19,800 1.67% 1.79%
Sanja Vujić Šmaguc 18,130 1.53% 1.64%
Majid Hejja 14,600 1.23% 1.32%
Total 1,184,720 100.00% 100.00%
The company does not have a majority shareholder.
OWNERSHIP AND LEGAL FORM
The company is a domestically owned joint stock company. At the beginning of 2018, JGL d.o.o. owned 76,996 own shares. By 31 December 2018, JGL purchased another 7,557 and sold 7,700 of its own shares, and on 31 December 2018, the state of own shares in the portfolio amounted to 76,853.
The share capital of JGL d.d. is divided into 1,184,720 shares, 1,107,867 of which are shares with voting rights, while the remaining ones are own shares.
The ownership structure of JGL d.d.

10
102-
610
2-7
Indicator 2018 2017 2016 2015 2014 2013
Self-financing coefficient
48.78% 45.76% 35.08% 31.92% 34.29% 37.80%
SCALE OF THE ORGANIZATION
The total number of employees at the JGL Group level on 31 December 2018
MARKETS SERVED
Key markets are the markets in the CIS region – Russia, Kazakhstan, Ukraine and Belarus, and in the SEE region – Croatia, Bosnia and Herzegovina, Serbia, Slovenia, Montenegro, Kosovo and Macedonia, where JGL is present with its own operations. At the moment, markets with the B2B model make up a smaller share of the revenue, but they are experiencing propulsive growth (EU, the Middle East and North Africa (MENA region), the Association of Southeast Asian Nations (ASEAN)). Through its partners, the company operates on approximately 50 additional global markets.
The parent company JGL d.d. is responsible for the largest share of the revenue (47%), followed by Jadran LLC Moskva with 29%, and the associated company Ljekarna Pablo with 16%. The markets of the Russian Federation, Croatia, Bosnia and Herzegovina, Kazakhstan and Ukraine make up 90% of JGL’s revenue. The Russian Federation and the Croatian market have the biggest influence on the overall business of the entire group. Since Jadran LLC has only started with its activities in 2017, we expect an even larger percentage of the Russian company’s share in the operating revenue of JGL Group in the following period.
was 964 (on 31 December 2017 it was 959), and the number of employees in JGL d.d. was 546.
In 2018, the Group made a total of HRK 799,882,994 in revenue, of which HRK 796,442,539 was from its business activities, and profit before taxation of HRK 20,047,726. There has been an increase in sales revenue of 6%, a decrease in total expenses of 3%, leading to an operating profit. Profit after tax of JGL Group, or the result for the period, amounted to HRK 17,033,047. In 2018, JGL Group had a 48.78% share of capital in sources of funds, which means that it participated in the total sources of financing with 48.78%.
INFORMATION ON EMPLOYEES AND OTHER WORKERS
The total number of employees (except for employees on vocational training) in the JGL Group on 31 December 2018 was 964, in JGL Pharma 793, and in the parent company 546.
The Croatian market is the largest in terms of the number of employees, with 602 employees working within the parent company JGL d.d., the Adrialab company and Pablo Health Institution. The Russian market is the second largest in terms of the number of employees (JGL d.d., Jadran LLC Moskva) with 202 employees.
Out of the total number of employees in the JGL Group, 77% are women, and 23% are men. The percentage of employees with university degrees is 83%, and their average age is 42.
102-
8Key markets of JGL Pharma based on sales in 2018
RussiaCroatia
B2BBosnia
UkraineKazakhstan
BelarusSlovenia
SerbiaOther
43%20%
9%6%6%
5%3%
4%
2%1%
When comparing the 2018 indicator with previous years, it is clear that the self-financing coefficient is more favourable than in the last two years, which is primarily the result of a decrease in net debt, the prepayment of an EBRD loan of HRK 33.2 million, and an earlier start of payment of a CBRD loan.

* At the start of 2018, because of the merger of JGL’s representative office in Bosnia and Herzegovina and the company Farmis d.o.o, one employee remained in JGL’s representative office in Sarajevo, while all others moved to the affiliated company Farmis d.o.o. Sarajevo
JGL GROUP 2016 2017 2018
JGL d.d. 687 522 546
Market of Croatia 377 410 431
Market of Bosnia and Herzegovina
9 7 1*
Market of Macedonia 5 5 5
Market of Russia 211 6* 5
Market of Belarus 16 15 15
Market of Ukraine 33 40 47
Market of Kazakhstan 35 38 41
Market of Kosovo 1 1 1
AFFILIATED COMPANIES 214 437 418
JGL d.o.o. Beograd-Sopot 12 20 18
Farmis d.o.o. Sarajevo 16 21 26
JGL d.o.o. Ljubljana 7 5 6
Adrialab d.o.o. Rijeka 24 24 27
Pablo d.o.o. 2 1 0
Ljekarna Pablo health institution
149 156 144
Jadran LLC Moskva 4 210 197
THE TOTAL FOR THE JGL GROUP
901 959 964
AGE F M
<29 106 50
30–49 543 149
>50 96 20
TOTAL 745 219
AGE F M
<Secondary education 15 6
Secondary education 210 87
Post-secondary education 16 13
University education 485 110
>University education 19 3
TOTAL 745 219
An overview of the number of employees on 31 December 2016, 2017 and 2018 in the JGL Group
An overview of the number of employees in the JGL Group in 2018 according to age and gender
An overview of the number of employees in the JGL Group in 2018 according to professional qualification and gender
11

12
JGL GROUP FIXED-TERM CONTRACT
CONTRACT OF INDEFINITE DURATION
JGL d.d. 64 482
Market of Croatia 45 386
Market of Bosnia and Herzegovina
0 1
Market of Macedonia 0 5
Market of Russia 0 5
Market of Belarus 15 0
Market of Ukraine 2 45
Market of Kazakhstan 2 39
Market of Kosovo 0 1
AFFILIATED COMPANIES 47 371
JGL d.o.o. Beograd-Sopot 1 17
Farmis d.o.o. Sarajevo 11 15
JGL d.o.o. Ljubljana 1 5
Adrialab d.o.o. Rijeka 4 23
Ljekarna Pablo health institution 17 127
Jadran LLC Moskva 13 184
THE TOTAL FOR THE JGL GROUP
111 853
JGL GROUP PART TIME FULL TIME
JGL d.d. 4 542
Market of Croatia 3 428
Market of Bosnia and Herzegovina
0 1
Market of Macedonia 0 5
Market of Russia 0
Market of Belarus 0 15
Market of Ukraine 0 47
Market of Kazakhstan 1 40
Market of Kosovo 0 1
AFFILIATED COMPANIES 24 394
JGL d.o.o. Beograd-Sopot 1 17
Farmis d.o.o. Sarajevo 11 15
JGL d.o.o. Ljubljana 0 6
Adrialab d.o.o. Rijeka 4 23
Ljekarna Pablo health institution 0 144
Jadran LLC Moskva 8 189
THE TOTAL FOR THE JGL GROUP
28 936
An overview of the number of employees in the JGL Group accord-ing to employment contract type in 2018
An overview of the number of employees in the JGL Group according to the type of employment in 2018

13
102-
9 We buy all new transport vehicles with a built-in system for engine shutdown while stopping, thus contributing to lower environmental pollution.
The selection of a new supplier, in addition to all of the above, includes a tendering process, or the necessary fulfilment of all pre-defined technical and commercial conditions for suppliers and products.
There were no significant changes in structure, location, selection, and termination of supplier relationships in the reporting period compared to 2017.
SUPPLY CHAIN
JGL cooperates with a large number of suppliers in its supply chain – a total of 494 during 2018. All suppliers have to meet the high standards of the pharmaceutical industry, and materials and services are only procured from an approved source of consistent quality.
The selection and approval of a new supplier is a complex and lengthy process, starting with supervision and understanding of the quality process of a potential supplier. In addition to initial verification, both new and long-term suppliers are regularly subjected to inspections (every two to three years), where besides the quality system, their overall business is also evaluated. In addition to the formal audits and questionnaires that we regularly send to suppliers, we also evaluate them through everyday work and contacts with them. Relationships with partners are built on trust, mutual understanding and mutual respect of wishes and needs. Establishing a partnership creates the prerequisites for meeting delivery deadlines, and maintaining sustainable and fair prices and the quality of products and services. Partnerships with suppliers are also a prerequisite for supply chain management, which directly affects company savings and profitability.
Particular attention is paid to how much our partners care for the society and the environment, for their employees and other stakeholders. Companies that apply the principles of corporate social responsibility have an advantage during our selection process, which is a necessary prerequisite for our key suppliers. All of JGL’s suppliers are certified according to ISO 9001, a standard that refers to quality management.
Within the supply chain, companies that provide transportation services also have an important role. It is expected from the suppliers to prove themselves with quality, speed, innovation and complete expense transparency. We select companies that regularly service and properly maintain their vehicles and have lower emission levels for harmful gases. In warehouses and in production, we have largely moved from diesel forklifts to electric forklifts, thus directly leading to a reduction in environmental pollution.
102-
10 SIGNIFICANT CHANGES TO THE ORGANIZATION AND ITS SUPPLY CHAIN
MANAGEMENT OF INVESTMENTS IN INFRASTRUCTURE AND SERVICES
• The introduction of a new ERP system
JGL d.d. has successfully completed the project of introducing an ERP business system by the SAP company in record time. The latest generation of the S/4HANA system is based on the innovative technology of an in-memory database, which enables fast access to information, successful handling of business complexities, and adapting to new market demands. This is the first time that the SAP S/4HANA system has been implemented not only in Croatia, but all of Southeast Europe, and the entire go-live project is the first of its kind in Europe in terms of scope and integration with external systems. Its implementation encompassed a wide variety of modules – finance and accounting, controlling, sales and distribution, production planning, maintenance, quality management, human resource management, materials management, complex warehouse management, planning and consolidation, and BI reporting tools.

14
ENERGY MANAGEMENT
• JGL – an energy efficient company
On 18 June 2018, JGL d.d. concluded Grant Agreement number KK.04.1.1.01.0123 for projects financed from funds in the financial period 2014 – 2020 with the Ministry of Environment and Energy and the Environmental Protection and Energy Efficiency Fund for the purpose of implementing the project entitled “JGL – an energy efficient company” (JGL – Energetski učinkovito društvo). Total eligible expenditure for the project amounts to HRK 2,514,426.58, and it is granted for the promotion of energy efficiency and renewable energy sources in companies as grants with the maximum intensity of the de minimis aid of 85% (HRK 807,385.93), and the maximum intensity of the state aid of 45% and 60% (HRK 1,707,040.65). By the end of 2018, JGL d.d. received a grant in the total amount of HRK 326,925.01 on the basis of the first reimbursement application for the period from 18 June 2018 to 18 September 2018. During March 2019, JGL d.d. received a grant in the amount of HRK 409,268.98, on the basis of the second reimbursement application for the period from 18 September 2019 to 18 December 2019.
CUSTOMER HEALTH AND SAFETY MANAGEMENT
• Serialization
In 2018, JGL d.d. invested in equipment related to the serialization project. The investment was worth HRK 11.2 million, and the equipment was financed through financial leasing over a period of five years. This is a complex project of alignment with Directive 2001/83/EC on the prevention of the entry of counterfeit medicines into the legal supply chain with the help of unique identifiers on drug packaging and opening protection. The basis of the alignment is the implementation of an IT software solution and an additional device for the Data Matrix code on product equipment lines.
TRAINING AND EDUCATION MANAGEMENT
Reward system and corporate standards
Several connected activities marked this year’s work on the improvement of the system. Alignment with corporate standards was completed for all job descriptions, complexity levels and reward systems for the markets of Russia, Kazakhstan, Belarus and Ukraine.
A variable pay system (sales incentive) was implemented for all sales and marketing operations in JGL Pharma.
Another activity that took place was the unification and improvement of the corporate system for monthly and quarterly monitoring, control and reporting on the number of employees and related costs, as well as for the creation of an annual realisation forecast. New measurement indicators were introduced, including the fluctuation of the company in relation to market fluctuation, the rate of filled vacancies, and monitoring investments in the existing reward system. All of the above set a better basis for planning needs and investments.
Developmental activities
The long-term developmental programme “More bolje” (We Can Be Better) was continued in 2018. This programme, developed with the aim of strengthening the organisation’s ability to change and adapt to new global trends, has a dual focus:
• “Struka za sutra” (Profession of Tomorrow) encourages employees to supplement their knowledge through part-time university studies and certain specialisations planned as part of the employees’ development plans.
• “Menadžment za danas i sutra” (Management for Today and Tomorrow) is aimed at managers on all levels responsible for managing people. This programme is one of the tools used to increase the understanding of roles and responsibilities of teams and individuals and to undertake specific improvement activities and implement improvements and changes in daily activities.

15
On the regional and local levels, HR teams of the Parent Company, Russia, Kazakhstan, Ukraine and Belarus cooperated on some other projects and activities that marked the year:
• Organised sharing of best practices, through the joint definition of business plans, projects and sales improvements, risk analyses and resolution, on the level of all markets and regions;
• Implementation of the principle of annual paid leave planning and alignment of collective paid leave with the Parent Company, and development of an automated system for this purpose in Russia to increase management efficiency;
• Development and implementation of an e-learning platform and online programme for learning about products and brands intended for sales teams in the markets of Russia, Belarus and Kazakhstan;
• Automated monitoring of the fulfilment of goals for a semi-annual assessment of sales teams on the level of the CIS region;
• Revision of processes and establishment of a new management and organisation method for working with pharmacy chains in Russia, and preparation for the implementation of the principle on the level of the entire CIS region in 2019;
• The entire sales management of the CIS and Black Sea region underwent a cycle of education and training on the principle of working with pharmacy chains;
• Introduction of a model of creative thinking education for the marketing management in the CIS and Black Sea regions;
• Recruitment channels on the level of the Parent Company and the SEE region were strengthened through increased efforts of cooperation with the academic community and through various models such as case study competitions from the real sector, internships and lectures in specific courses, cooperation on professional conferences, knowledge-sharing, cooperation on the development of a paid internship model, etc.;
• Project development with the participation of pharmacy students to cover the field of corporate social responsibility in the widest sense, with the primary purpose of establishing a connection between students and the labour market.
LABOR/MANAGEMENT RELATIONS / OCCUPATIONAL SAFETY MANAGEMENT
Work and activities of the Works Council (WC)
In the course of 2018, the Works Council actively worked on improving work conditions for all JGL employees through continuous processing of workers’ inquiries, active meetings with the Employer, regular sessions, and participation in the organization of internal initiatives.
The cooperation between the employer and the Works Council resulted in the following:
• Each employee received an award of HRK 4,000.00 at the end of the year;
• Field allowance (per diem) was increased in accordance with the currently applicable amounts in Croatia;
• Non-taxable awards were increased to HRK 5,000.00 on the basis of accomplished work results;
• The upper range for the complexity of certain job categories was expanded;
• The number of paid leave days (complexity, work experience, special social conditions, e.g. children under 15 years of age, work conditions – new: sterile conditions and working with chemicals) was increased.
INVESTMENTS, ENERGY AND WATER MANAGEMENT
Care for the community
In the reporting period we supported numerous initiatives, projects and activities organised by associations taking care of those in need, by students and athletes, and we participated as a team in charitable initiatives. Namely, we supported the Croatian Open Championship – Croatia Indoor 2018, the 19th edition of the Fiumanka regatta, Wings for Life World Run, Rent-a-bikeRI bike tour, the Red Noses Clowndoctors organisation, the “Tehnologijada” competition among technology faculties organised by the Faculty of Food Technology and Biotechnology, the “Sredozemna medvjedica” association for the preservation of the monk seal, the League Against Cancer of the

16
Primorje-Gorski Kotar County, the Rijeka Football Club, the Red Cross, the Faculty of Medicine, the NeuRi congress of neuroscience, the association for children and youth with developmental disabilities “Svjetionik”, the “Tete pričalice” project by the “Portić” Association, the Association of Celiac Patients, the “Homo si teć” street race, the Lopača Psychiatric Hospital, “Chemistry Days” of the Faculty of Science, Rijeka Sport’s Association, the Environmental Health Congress, the “Mame&klinci” conference, the Rijeka City Puppet Theatre, the Small Home orphanage in Kenya, the Big Heart to Small Heart association, and many others.
Many citizens of Rijeka participated in our public health action that involved testing for the ragweed allergen, carried out as part of the “Allergic to Allergies” project by the Dermatology and Venerology Clinic team of the Clinical Hospital Centre Rijeka. This was our third annual “Allergic to Allergies” action, and its goal was to increase public awareness about the dangers of ragweed allergy. We participated in two blood drives, as part of our JGL Drop action on 4 June and 3 December, and supported the CroMSIC student association in the first Diving Medicine Summer School for medical students from all over the world.
In May, we organised the fifth beach clean-up activity with the aim of raising awareness of the importance of protecting the Adriatic, under the motto “Vratimo moru dio onoga što nam daje!” (“Let’s return to the sea part of what it gives to us!”). This was also a team-building opportunity for employees working on the implementation of the new ERP system. Along with JGL’s employees, employees from partner companies SAP and S&T also participated in this action.
We brought 2018 to a close with an initiative of collecting toys for the Clinical Hospital Centre Kantrida Children’s Hospital. We collected hundreds of gifts for their little patients, demonstrating our valuable contribution to the community in which we live and work at the end of yet another business cycle.
ECONOMIC PERFORMANCE MANAGEMENT
Financial performance
In 2018, the JGL Group made a total of HRK 800 million in revenue and an operating profit (EBITDA) of HRK 100 million, with the EBITDA margin rate of 12.6%.
Our key success in 2018 was a faster sales growth than the reference market in Croatia, Russia and Ukraine, which enabled the company better price, stock and receivable management. Consequently, indebtedness and net debt were reduced (by prepayment of an EBRD loan), achieving financial stability, liquidity, increased profitability, a solid return on assets and capital, and creditworthiness.
The JGL Group has experienced a noticeable recovery and positive business trend. In 2018, JGL Group aimed to reach the net debt/EBITDA level of 3.5 – 4.0, which was accomplished (3.77).
The JGL Group continues with its set growth and development strategy on sound foundations. The group expects a continuation of double-digit growth and positive trends in 2019.
Portfolio realization
Sales realisation in 2018 in the parent company amounted to HRK 32.5 million pieces of products. A total of 92 first product applications were prepared, 68 first approvals were obtained, and 38 renewals and 340 variations were submitted. Furthermore, two existing DCP procedures were successfully finished, and three new DCP procedures were initiated.
In the period from 1 January to 31 December 2018, 59 products were successfully launched on B2C business markets. Out of that number, 19 products were launched in the SEE region (10 of them in Croatia), while 22 were launched in the CIS region (6 of them in Belarus).
A special emphasis in the increase of professional competences was placed on key brands: Lactogyn, Aqua Maris, Meralys and Vizol S. A total of 17 products were launched within the key brand Aqua Maris, a total of 13 products were launched within the Meralys/Rinomaris brand, and a total of 9 products were launched within the Vizol S/Optinol brand.
Research and development
During 2018, there were a total of 18 active projects in JGL d.d., out of which 14 were in-house development projects, and 4 were related to contract development or production transfer.

17
The first commercial batches of the Aqua Maris Hypertonic BOV nasal spray and Viset eye drops – the first preservative-free product in the EU – were produced for the Croatian market.
Naftifin BOV received a registration decision, the project of developing a syrup for motion sickness entered the registration stage, and the projects of expanding existing nasal sprays (two strengths and two volumes) and introducing a new nasal spray are also in development.
Audits
A total of 20 inspections and audits by business partners were performed at JGL during 2018. The Agency for Medicinal Products and Medical Devices (Hrvatska agencija za lijekove i medicinske proizvode, HALMED) conducted a detailed inspection of our sterile production, which led to the company receiving a new GMP certificate for sterile production. Certification according to new ISO 9001:2015 Quality management systems and ISO 13485:2016 Medical devices norms, enabling a successful transition to new norms in accordance with the legal deadlines, should be pointed out among regulatory inspections.
Globalisation
In 2018, the main business development activities in the parent company were aimed at the development of new partnerships, which led to the execution of 20 new contracts and the launch of 42 standalone products, 23 of which were meant for licensing and distribution, and 19 for contractual production. Regionally, the focus remained on new opportunities within the EU, in accordance with the B2B strategy and expansion projects to the strategic MENA and ASEAN regions.
Investments
In 2018, the Group invested a total of HRK 44,691,102 in long-term assets. Investments in intangible assets amounted to HRK 20,655,244, of which HRK 10,143,333 was related to investments in computer software, HRK 876,701 was used for purchasing licences, HRK 2,221,477 was allocated for registering own products, and HRK 7,413,733 for investments in development projects.
Investments in tangible assets amounted to HRK 24,035,858, of which HRK 397,150 was related to the improvement of functions of buildings owned by JGL. Another HRK 23,638,708 was invested in the purchase of production, IT and transport equipment and furniture. Transactions related to the purchase of used equipment within the JGL Group were excluded from the investment amount.
ENERGY MANAGEMENT
Environmental indicators
Throughout 2018, in the field of environmental protection, JGL d.d. continued to work on improving and increasing employee awareness of environmental protection and energy efficiency measures. With the help of the norm ISO 50001:2011 – Energy management systems, savings in the consumption of all types of energy were successfully controlled and implemented.
The voltage optimisation project at the Svilno 2 site, with a value of HRK 485,460.00, was successfully completed. The project was financed by own resources. Voltage optimisation was achieved by installing a special device, which should lead to an expected reduction in electricity consumption of 302,148 kWh within a year, which is equivalent to the production of 150 tons of CO2 annually.
The Environmental Protection and Energy Efficiency Fund covered 62% of the cost for replacing the roof of the warehouse at Svilno 1. A total of HRK 938,605.00 was invested, and the investment is expected to result in a reduction of 16,600 kWh within a year, which is equivalent to the production of 3.89 tons of CO2 annually.
In the reporting year, JGL d.d. continued its good practice of purchasing electricity made exclusively from renewable sources on all locations in Croatia. JGL d.d. remains one of the select few Croatian companies that further demonstrate their social responsibility and care for the environment in this way, and is proud to be a holder of the “ZelEn – Friend of Nature” mark.

18
102-
1110
2-12
PRECAUTIONARY PRINCIPLE OR APPROACH
In order to protect human health and the environment, JGL is guided by the precautionary approach. When there are threats of serious or irreversible damage to human health or the environment, JGL does not delay in taking the necessary safeguards, even if the danger is not fully scientifically explored.
Risk management is applied appropriately in different processes and activities. Risk management principles should be implemented in project activities, new product development, design of production equipment and space, change management, non-compliance management, production processes and marketing.
For example, a detailed risk analysis is conducted before and during product development. Based on the results of the analysis, a risk management plan is drawn up, which includes risk reduction or elimination and risk control. In certain stages of development, the evaluation of the achieved results must be performed to determine that the individual requirements have been met and the result must be verified before moving to the next stage. Prior to the start of normal production and application of the new product, it is necessary to carry out the validation of the production process in order to confirm that the production process is reliable and that reproducibility is ensured, which means that the production process is always capable of delivering a product of defined quality.
If any changes occur during development (e.g. change of requirements), it is necessary to assess the need for rating, verification and validation of the change. Records are being kept on all stages of development, including risk analysis and developmental changes.
EXTERNAL INITIATIVES
The quality of each product and service is a key priority, and pursuant to the above, a policy of quality and environmental management through
the application of norms and principles, which are based on various legal requirements and other requirements, guidelines, good practices, and recommendations was established:
• Medicinal Products Act and accompanying regulations, OG current issue;
• Medical Devices Act and accompanying regulations, OG current issue;
• Food Act and accompanying regulations, OG current issue;
• Act on General Use Items, OG current issue;
• ISO 9001:2015 Quality Management;
• DS/EN ISO 13485:2016 Quality Management – Medical Devices;
• ISO 22000:2005 Food Safety Management;
• DIN/EN ISO 50001:2011 Energy Management Systems;
• CE certificate (Dir. 93/42/CEE) – Manufacture of medical devices;
• Good Manufacturing Practice of the European Commission, Part I and applicable Annexes;
• Good Distribution Practice of the European Commission;
• FDA cGMP and other applicable documents;
• ICH guidelines applicable to JGL’s business;
• Rules of good manufacturing practice of Russia.
MEMBERSHIP OF ASSOCIATIONS
Membership within Croatian and international organisations and associations provides us with an opportunity to constantly monitor and implement new standards and current educational programs, as well as exchange experience and connections with leading experts in the fields of pharmacy, economics and sustainable development.
• Croatian Business Council for Sustainable Development;
102-
13

19
• Croatian Chamber of Economy;
• CEA’s Association of Medicines Manufacturers;
• The European Generic Medicines Association;
• Croatian Managers’ & Entrepreneurs’ Association;
• Croatian Association for Automatic Identification, Electronic Data Interchange (EDI) and Business Process Enhancement;
• Leader’s Club of Exporters;
• Croatian Pharmaceutical Society;
• Croatian Pharmacological Society;
• Licensing Executives Society;
• Association of the Croatian Business Forum;
• Croatian Health Cluster;
• Croatian Association of the Self-Medication Industry.

20
102-
15 KEY IMPACTS, RISKS, AND OPPORTUNITIES
The strategic focus of the JGL Group is further business internationalisation, key brand globalisation, employee satisfaction, operational efficiency and profitable growth.
Strong market positions on the domestic market and several key export markets where JGL d.d., Adrialab d.o.o. and Pablo Health Institution are present with their operations, enable further organic growth of these companies, both through the existing portfolio of products and services and through new products and services developed, registered and launched on markets through their own efforts.
Another driver is the connection through partnerships with other pharmaceutical companies, which opens up numerous possibilities in different fields, from production, development, registration and quality control to market release. It should be noted that the key condition for these partnerships was enabled by the expansion of production capacities at JGL d.d.
Risks are primarily related to political and economic instabilities in the CIS markets, which are visible primarily in the volatility of local currency exchange rates and oscillations related to consumer purchasing power. A significant net effect of foreign exchange differences was recorded in 2018 compared to the previous period, in the amount of approx. HRK -40.5 million, predominantly due to the volatility of the Russian rouble. Without the effect of exchange rate differences, JGL Group would have made a total of HRK 833.3 million in revenue (an estimated 6% higher revenue compared to normalised total revenue of the Group in 2017). Moreover, the total revenue of JGL Pharma without the effect of exchange rate differences would reach HRK 670.6 million, i.e. it is estimated that it would be 9% higher compared to the normalised HRK 615.2 million in total revenue in 2017.
Although reduced to a minimum, risks that could impact a large number of stakeholders in the event of a drastic drop in sales in the field of economic impacts include the risk of reducing employee compensation, the extension of supplier payment deadlines, the inability to supply markets with adequate drugs, the inability of achieving progress in the development of new products due to a
lack of experts, and the pollution of the sea, a key material in the production of a large part of JGL’s portfolio.
Having in mind the above mentioned, the following risks are continuously analysed for the purpose of their reduction and management: risks related to the industry, competition and the influence of an individual market on sales, risks related to the influence of a particular product on sales, risks related to the manufacturer’s product liability, ecological risks, risks of obtaining and maintaining regulatory approvals for new products, risks related to intellectual property and trademarks, risks related to the security of receivables and payment maturity, supplier risks, exchange rate and interest rate risks, liquidity and indebtedness risks, personnel risks, technological risks, etc.
Following global trends that are primarily related to demographic, economic and trade trends, as well as trends related to the pharmaceutical industry and overall health care, JGL Group also recognizes its opportunities in the area of increasing productivity to successfully address the problems of the ageing population, the increase in the number of chronic diseases, and reducing problems of stretching public finances; a more comprehensive use of renewable energy and more efficient energy consumption as the only way to mitigate the risks arising from the fast-growing demand and limited stocks, as well as their polluting characteristics; with a multi-annual, strictly regulated work experience and interconnectedness with partners and institutions of a wide global network, helping to encourage the availability of high-quality, safe, and effective products for treatment, self-treatment and prevention for every human being.

21
102-
16
3. Ethics and integrity
VALUES, PRINCIPLES, STANDARDS, AND NORMS OF BEHAVIOR
JGL d.d. operates on the principles of lawfulness, disclosure and transparency, prevention of conflicts of interests, efficient internal control, strengthening personal responsibility and corporate social responsibility. These principles are an integral part of the company’s Quality Policy. JGL d.d. does not have its own Code of Corporate Governance, but has decided to implement the Zagreb Stock Exchange Code
(http://www.zse.hr/UserDocsImages/docs/Kodeks_HR.pdf).
JGL d.d’s organisational structure follows the one-tier model, in which the functions of governance and supervision are carried out by the Board of Directors, elected by the General Meeting, while an executive director (appointed by the Board of Directors) represents and manages the company’s operations.
In its business activities, JGL d.d. applies internal policies with clearly defined procedures for the work of the Board of Directors and Executive Director, and clear principles guaranteeing the protection of interests of all stakeholders (e.g. annual and semi-annual reports are available to stakeholders; persons who use or come into contact with privileged information are familiar with the nature and significance of the information and the relevant restrictions; control of the flow of privileged information and the possible abuse of such information has been established).
The Board of Directors of the parent company has established an Audit Committee. In the course of its work, the Committee assesses the quality of the internal control and risk management system, with the aim of properly identifying the main risks the Company is exposed to (including the risks related to compliance with regulations).
102-
18
4. Governance
GOVERNANCE STRUCTURE
JGL d.d. Rijeka has a monistic structure, and the Board of Directors of the company has a leadership and supervisory role. The Board of Directors of JGL d.d. is composed of:
• Ivo Usmiani – President of the Board of Directors,
• Zdravko Saršon – Deputy President of the Board of Directors,
• Marina Pulišić – member of the Board of Directors,
• Grozdana Božić – member of the Board of Directors,
• Eva Usmiani Capobianco – member of the Board of Directors,
• Dorotea Pernjak Banić – member of the Board of Directors, workers’ representative.
During the reporting period, from 1 January 2018 to 31 December 2018, the CEO, who is also a member of the Board of Directors and the person responsible for representing and managing the company’s operations, was:
• Mislav Vučić, Executive Director.
The business address of all members of the Board of Directors, Executive Directors and the new Executive Director is Svilno 20, Rijeka. There is no conflict of interest between the members of the Board of Directors and Executive Directors / Executive Director with regard to the functions and activities performed by them and their personal interests, i.e. their functions and activities outside the company.
In the field of economic, environmental and social impacts, departmental responsibilities are linked to Finance, Accounting and Controlling, Technical Support and Corporate Communications, and the Human Resources Management Department.

22
E X E C U T I V E D I R E C T O R
MANAGEMENT BOARD
Q U A L I T Y
L E G A L A F F A I R S A N D I N T E L L E C T U A L
P R O P E R T Y O F F I C E
ORGANIZATIONAL DESIGN AND PROCESS MANAGEMENT OFFICE
P A B L O D . O . O .
I N T E R N A L A U D I T O F F I C E
M A R K E T I N G A N D
S A L E S
P H A R M A C E U T I C A L A N D T E C H N I C A L
O P E R AT I O N S
H U M A N
R E S O U R C E
M A N A G E M E N T
P O R T F O L I O
M A N A G E M E N T
G L O B A L P R O D U C T
M A N A G E M E N T
S T R A T E G I C
M A R K E T I N GF I N A N C EM A N U F A C T U R E
R E S E A R C H A N D
D E V E L O P M E N T
C I S R E G I O NI n c l u d e s : J a d r a n
d . o . o .
S E E R E G I O N
I n c l u d e s : Fa r m i s d .o .o . J G L S O P OT B E O G R A D d .o .o . J G L
d .o .o . L j u b l j a n a
A C C O U N T I N GS U P P L Y C H A I N
S U P P O R T
G L O B A L
R E G I S T R A T I O N S
C E N T R A L P R O C U R E M E N T
B L A C K S E A R E G I O N
C O R P O R A T E
C O N T R O L L I N G
R E TA I L
“ Z d r a v l j e i l j e p o t a” ( H e a l t h a n d b e a u t y )
T E C H N I C A L S U P P O R T
C O R P O R A T E
F I N A N C E
G L O B A L
B U S I N E S S
D E V E L O P M E N T
M A N A G E M E N T
I T M A N A G E M E N T
C O R P O R A T E C O M M U N I C A T I O N S
O F F I C E
LJEKARNA PABLO HEALTH INSTITUTION
A D R I A L A B D . O . O .
Top organizational structure of the parent company in 2018 is represented below.

23
102-
4010
2-42
102-
43
5. Stakeholder engagement
LIST OF STAKEHOLDER GROUPS
Our stakeholders are employees, doctors and pharmacists, end consumers, partners, suppliers, students, government bodies, the financial community, the local community, the media.
IDENTIFYING AND SELECTING STAKEHOLDERS
During the reporting period, as part of the engagement and selection of key stakeholders in the implementation of the strategy and achieving the company’s overarching goals, we were guided by the implemented Customer Value Proposition approach to the organization of our business, where we consider the end user as the main customer, defining certain groups of doctors and pharmacists as key on certain markets.
In addition, given that employees are the key value of the company, and that they plan, implement, prepare, report, and inform other stakeholders about JGL’s sustainable development goals, they are a key link in this process.
Knowing the importance of investment in the coming generations, strengthening links between the economic and scientific sector, as well as sharing of knowledge and experiences, during the reporting period, we expanded our cooperation with the academic community. We listened to the interests, opinions, attitudes and suggestions of students and included them in this report as the key stakeholders with whom we jointly contribute to the sustainable development of the community.
The process of continuous improvement of the process of managing and making decisions in the direction of sustainable development and growth of the company brings added value for the shareholders and the owners of the company. The sustainable business model and promotion of responsible practices have contributed to increased sales and market share, reduced operating costs, increased attractiveness for investors and financial analysts, which are key elements for the survival of modern
companies in terms of market competition. Company shareholders, who in JGL’s case are company employees, are the key category of the reporting process.
ENGAGED STAKEHOLDERS
• Employees
• Shareholders
• End users
• Doctors/pharmacists
• Students
• Local community
APPROACH TO STAKEHOLDER ENGAGEMENT
Based on conducted research (CSI questionnaires), joint meetings (company visits and tours), surveys and direct inquiries (expert associates in the field, meetings, joint meetings) that were conducted as part of the process of preparing the report, we posed questions to our engaged stakeholders in relation to their needs, expectations and interests in the field of JGL’s economic, social, and environmental impacts.
We conducted our research throughout the whole reporting period:
• Employees (on a continuous basis – at joint events, within the corporate newsletter, during the evaluation of specific CSR activities, etc.);
• Shareholders (officially once a year – at the annual general meeting of shareholders, since shareholders are partly employees; communication with some of them was ongoing);
• End users (on a continuous basis – on public platforms such as social media or an online counselling centre, during promotional activities, through CSI surveys);

24
102-
44 • Physicians/pharmacists (on a continuous basis – expert associates in the field, meetings, joint meetings, agreed company visits and tours);
• Students (several times a year – joint meetings, joint projects);
• Local community (several times a year – joint meetings, joint projects).
KEY TOPICS AND CONCERNS RAISED
Through the whole year of engaging stakeholders, the following material topics and issues were confirmed as key:
• Direct generated economic value and distributed economic value, company liquidity, debt management (market presence management);
• Significant investments in environmental care (energy, water and waste management).
Other material topics according to JGL include:
• The need for more frequent and focused internal and external education programmes (training and education management);
• The need for significant investments in the research and development of own products (consumer health and safety management).
102-
4510
2-46
6. Reporting practice
ENTITIES INCLUDED IN THE CONSOLIDATED FINANCIAL STATEMENTS
Consolidated financial statements of JGL Group are available at https://www.jgl.hr/en/about-us/jgl-today/financial-reports and include the following entities:
• JGL d.d.
• Farmis d.o.o. Sarajevo
• Jadran - Galenski laboratorij d.o.o. Ljubljana
• Adrialab d.o.o. Rijeka
• Pablo HI Rijeka
• LLC Jadran Moskva
• JGL d.o.o. Beograd-Sopot
• Pablo d.o.o. Zagreb
JGL’s non-financial report includes, in part, reports from the parent company JGL d.d., and for the most part (economic and social dimension), the JGL Group’s complete business operations.
DEFINING REPORT CONTENT AND TOPIC BOUNDARIES
The material topics we will report on were determined on the basis of internal and external factors.
The mission of the company is to improve the quality of life with regard to health care, and the strategic guidelines are linked to the internationalization of business, operational efficiency, technological focus, and continuous development of close relationships with customers and partners. At the core of our business are instrumental values that engender togetherness and reject isolation: responsibility towards the whole, the importance of the greater good, equality and inclusion, respect for all lifestyles and unconditional care.

25
Along with the listed internal factors, external factors that have influenced the definition of material topics refer to the directly expressed interests of the stakeholders.
Summing up the answers we received has led us to the following expectations, both our own and those of our key stakeholders, according to which we identified relevant material topics:
• Ensuring drug availability;
• Continuous investment in education;
• Constant care and improvement of investments in environmental protection;
• Inclusion and sharing of knowledge;
• Sustainable financial growth.
JGL Group is associated with impacts through its own activities, but also through activities that are the result of business relationships with other bodies.
LIST OF MATERIAL TOPICS
GRI 200 ECONOMIC TOPICS
• GRI 201 Economic Performance
• GRI 202 Market Presence
GRI 300 ENVIRONMENTAL TOPICS
• GRI 302 Energy
• GRI 303 Water
• GRI 306 Effluents and Waste
GRI 400 SOCIAL TOPICS
• GRI 402 Labour/Management Relations
• GRI 403 Occupational Health and Safety
102-
47
• GRI 404 Training and Education
• GRI 405 Diversity and Equal Opportunity
• GRI 416 Customer Health and Safety
RESTATEMENTS OF INFORMATION
Regarding the information provided in previous reports, but also beyond them, there have been no significant changes in the company.
CHANGES IN REPORTING In relation to the previous reporting period, the only change pertains to the introduction of a new material topic in the report, in the section GRI 400 Social topics – Diversity and Equal Opportunity (GRI 405).
REPORTING PERIOD This is the eleventh edition of JGL’s Sustainable Development Report, which includes a one-year reporting cycle, i.e. the period between 1 January and 31 December 2018.
DATE OF MOST RECENT REPORT On 30 June 2018, the most recent, tenth edition of JGL’s Sustainable Development Report was published. All published JGL Sustainable Development Reports are available on the link https://www.jgl.hr/en/about-us/jgl-in-the-community/sustainable-development-reports.
REPORTING CYCLE JGL has only published the first two reports (2006/2007 and 2008/2009) in the two-year reporting cycle, and from then on, we have continued to report continuously in a one-year reporting cycle.
CONTACT POINT FOR QUESTIONS REGARDING THE REPORT In case of any questions related to this Report, a need for deeper analyses and/or a wider range of data, please contact Dea Demić, Head of Corporate Communications, [email protected].
CLAIMS OF REPORTING IN ACCORDANCE WITH THE GRI STANDARDS This report has been prepared in accordance with the GRI Standards: Core option
102-
4810
2-49
102-
5010
2-51
102-
5210
2-53
102-
54

26
102-
55
102-14 STATEMENT FROM SENIOR DECISION-MAKER 102-1 NAME OF THE ORGANIZATION 102-2 ACTIVITIES, BRANDS, PRODUCTS, AND SERVICES 102-3 LOCATION OF HEADQUARTERS 102-4 LOCATION OF OPERATIONS 102-5 OWNERSHIP AND LEGAL FORM 102-6 MARKETS SERVED 102-7 SCALE OF THE ORGANIZATION 102-8 INFORMATION ON EMPLOYEES AND OTHER WORKERS 102-9 SUPPLY CHAIN 102-10 SIGNIFICANT CHANGES TO THE ORGANIZATION AND ITS SUPPLY CHAIN 102-11 PRECAUTIONARY PRINCIPLE OR APPROACH 102-12 EXTERNAL INITIATIVES 102-13 MEMBERSHIP OF ASSOCIATIONS 102-15 KEY IMPACTS, RISKS, AND OPPORTUNITIES 102-16 VALUES, PRINCIPLES, STANDARDS, AND NORMS OF BEHAVIOR 102-18 GOVERNANCE STRUCTURE 102-40 LIST OF STAKEHOLDER GROUPS 102-42 IDENTIFYING AND SELECTING STAKEHOLDERS 102-43 APPROACH TO STAKEHOLDER ENGAGEMENT 102-44 KEY TOPICS AND CONCERNS RAISED 102-45 ENTITIES INCLUDED IN THE CONSOLIDATED FINANCIAL STATEMENTS 102-46 DEFINING REPORT CONTENT AND TOPIC BOUNDARIES 102-47 LIST OF MATERIAL TOPICS 102-48 RESTATEMENTS OF INFORMATION 102-49 CHANGES IN REPORTING 102-50 REPORTING PERIOD 102-51 DATE OF MOST RECENT REPORT 102-52 REPORTING CYCLE 102-53 CONTACT POINT FOR QUESTIONS REGARDING THE REPORT 102-54 CLAIMS OF REPORTING IN ACCORDANCE WITH THE GRI STANDARDS 102-55 GRI CONTENT INDEX 102-56 EXTERNAL ASSURANCE
6 7 7 8 8 9 10 10 10 13 13 18 18 18 20 21 21 23 23 23 24 24 24 25 25 25 25 25 25 25 25 26 28
GRI CONTENT INDEX
GRI 102: GENERAL DISCLOSURES
GRI STANDARD DISCLOSURE PAGE NUMBER

27
103-1 EXPLANATION OF THE MATERIAL TOPIC AND ITS BOUNDARY 103-2 THE MANAGEMENT APPROACH AND ITS COMPONENTS 103-3 EVALUATION OF THE MANAGEMENT APPROACH 201-1 DIRECT ECONOMIC VALUE GENERATED AND DISTRIBUTED 201-4 FINANCIAL ASSISTANCE RECEIVED FROM GOVERNMENT 103-1 EXPLANATION OF THE MATERIAL TOPIC AND ITS BOUNDARY 103-2 THE MANAGEMENT APPROACH AND ITS COMPONENTS 103-3 EVALUATION OF THE MANAGEMENT APPROACH 202-1 RATIOS OF STANDARD ENTRY LEVEL WAGE BY GENDER COMPARED TO LOCAL MINIMUM WAGE 202-2 PROPORTION OF SENIOR MANAGEMENT HIRED FROM THE LOCAL COMMUNITY
103-1 EXPLANATION OF THE MATERIAL TOPIC AND ITS BOUNDARY 103-2 THE MANAGEMENT APPROACH AND ITS COMPONENTS 103-3 EVALUATION OF THE MANAGEMENT APPROACH 302-1 ENERGY CONSUMPTION WITHIN THE ORGANIZATION 302-2 ENERGY CONSUMPTION OUTSIDE OF THE ORGANIZATION 302-3 ENERGY INTENSITY 302-4 REDUCTION OF ENERGY CONSUMPTION 103-1 EXPLANATION OF THE MATERIAL TOPIC AND ITS BOUNDARY 103-2 THE MANAGEMENT APPROACH AND ITS COMPONENTS 103-3 EVALUATION OF THE MANAGEMENT APPROACH 303-1 WATER WITHDRAWAL BY SOURCE 303-3 WATER RECYCLED AND REUSED 103-1 EXPLANATION OF THE MATERIAL TOPIC AND ITS BOUNDARY 103-2 THE MANAGEMENT APPROACH AND ITS COMPONENTS 103-3 EVALUATION OF THE MANAGEMENT APPROACH 306-1 WATER DISCHARGE BY QUALITY AND DESTINATION 306-2 WASTE BY TYPE AND DISPOSAL METHOD
GRI 200: ECONOMIC TOPICSGRI 201: ECONOMIC PERFORMANCE
GRI 202: MARKET PRESENCE
GRI 300: ENVIRONMENTAL TOPICSGRI 302: ENERGY
31 31 31 32 32 32 32 33 33 33
35 35 36 36 38 39 39 40 40 40 40 41 42 42 42 42 42
GRI 303: WATER
GRI 306: EFFLUENTS AND WASTE
GRI STANDARD DISCLOSURE PAGE NUMBER

28
103-1 EXPLANATION OF THE MATERIAL TOPIC AND ITS BOUNDARY 103-2 THE MANAGEMENT APPROACH AND ITS COMPONENTS 103-3 EVALUATION OF THE MANAGEMENT APPROACH 402-1 MINIMUM NOTICE PERIODS REGARDING OPERATIONAL CHANGES 103-1 EXPLANATION OF THE MATERIAL TOPIC AND ITS BOUNDARY 103-2 THE MANAGEMENT APPROACH AND ITS COMPONENTS 103-3 EVALUATION OF THE MANAGEMENT APPROACH 403-1 WORKERS REPRESENTATION IN FORMAL JOINT MANAGEMENT–WORKER HEALTH AND SAFETY COMMITTEES 403-2 TYPES OF INJURY AND RATES OF INJURY, OCCUPATIONAL DISEASES, LOST DAYS, AND ABSENTEEISM, AND NUMBER OF WORK-RELATED FATALITIES 403-3 WORKERS WITH HIGH INCIDENCE OR HIGH RISK OF DISEASES RELATED TO THEIR OCCUPATION 403-4 HEALTH AND SAFETY TOPICS COVERED IN FORMAL AGREEMENTS WITH TRADE UNIONS 103-1 EXPLANATION OF THE MATERIAL TOPIC AND ITS BOUNDARY 103-2 THE MANAGEMENT APPROACH AND ITS COMPONENTS 103-3 EVALUATION OF THE MANAGEMENT APPROACH 404-1 AVERAGE HOURS OF TRAINING PER YEAR PER EMPLOYEE 404-2 PROGRAMS FOR UPGRADING EMPLOYEE SKILLS AND TRANSITION ASSISTANCE PROGRAMS 404-3 PERCENTAGE OF EMPLOYEES RECEIVING REGULAR PERFORMANCE AND CAREER DEVELOPMENT REVIEWS 103-1 EXPLANATION OF THE MATERIAL TOPIC AND ITS BOUNDARY 103-2 THE MANAGEMENT APPROACH AND ITS COMPONENTS 103-3 EVALUATION OF THE MANAGEMENT APPROACH 405-1 DIVERSITY OF GOVERNANCE BODIES AND EMPLOYEES 405-2 RATIO OF BASIC SALARY AND REMUNERATION OF WOMEN TO MEN 103-1 EXPLANATION OF THE MATERIAL TOPIC AND ITS BOUNDARY 103-2 THE MANAGEMENT APPROACH AND ITS COMPONENTS 103-3 EVALUATION OF THE MANAGEMENT APPROACH 416-1 ASSESSMENT OF THE HEALTH AND SAFETY IMPACTS OF PRODUCT AND SERVICE CATEGORIES
GRI 400: SOCIAL TOPICSGRI 402: LABOUR/MANAGEMENT RELATIONS
GRI 403: OCCUPATIONAL HEALTH AND SAFETY
GRI 404: TRAINING AND EDUCATION
GRI 405: DIVERSITY AND EQUAL OPPORTUNITY
GRI 416: CUSTOMER HEALTH AND SAFETY
48 48 48 49 49 49 50 51
51
102-
56 EXTERNAL ASSURANCE
In accordance with the continuous and comprehensive support of the Croatian Business Council for Sustainable Development (HR BCSD), JGL has, for each published report, sought the opinion of the HR BCSD Management Board to be included in the Report. This issue is no exception, either – HR BCSD is most often called upon when it comes to promoting corporate social responsibility in the Republic of Croatia, and we appreciate their opinions and verification of the Report. The opinion of the HR BCSD Management Board is available on page 62.
PAGE NUMBER GRI STANDARD DISCLOSURE
51 52 53 53 53 54 55 56
57 57 57 57 58 58 58 59 59

29
SPECIFIC STANDARDS

GRI 200:
ECONOMIC TOPICS

31
103-
110
3-2
103-
3
ECONOMIC PERFORMANCE
MANAGEMENT APPROACH DISCLOSURES
EXPLANATION OF THE MATERIAL TOPIC AND ITS BOUNDARY
This topic is material due to its significant economic impacts on stakeholders and local, regional, national and international economic systems. The material nature of the topic is confirmed by the expectations and interests of stakeholders, who place the focus of the company’s business on economic performance.
With the aim of determining significant impacts related to economic performance, the JGL Group conducts systematic monitoring and analysis of its economic performance and reports on it by means of quarterly, semi-annual and annual reports. Economic performance has a significant impact within the entire JGL Group, and outside the Group, it impacts local communities and countries where the Group operates and our business partners.
THE MANAGEMENT APPROACH AND ITS COMPONENTS
JGL manages economic performance through a diverse product portfolio, sales dispersion on existing markets, sophisticated technology and manufacturing processes, investing in highly educated staff, research and development, and opening up new markets.
The long-term strategy of JGL Group is based on increasing the share in sales of other regions and markets and reducing the share of the CIS region. During the reporting period, new markets were opened for licensing business models and several new markets were opened with distribution contracts in the Asia and Middle East clusters. Additional use of technology of sterile forms is realized by projects of simultaneous development of contract manufacturing with partners.
The Group also reduces the risk of securing the collection of claims through the diversification of sales into different markets, the creation of
customer credit ratings, credit limits and ensuring foreign claims.
JGL’s income is significantly exposed to volatility due to a relatively high revenue concentration on a small number of customers. JGL manages this risk through active and frequent communication with key customers, acquiring new customers and tracking relevant competitors and market conditions both locally and internationally.
The Group also uses financial derivatives to hedge against sharp exchange rate fluctuations, manage liquidity risk by maintaining sufficient cash and working capital, and by contracting credit lines that allow quick withdrawal of short-term funds. The Group minimizes the risk of debt by regulating the share of financing with its own resources in relation to financing from other sources.
EVALUATION OF THE MANAGEMENT APPROACH
Mechanisms that the company uses to monitor the management approach effectiveness include external, independent auditing, monitoring the realization of corporate goals, daily metering systems, and analysing and feedback from stakeholders.
200

32
201-
120
1-4
103-
120
210
3-2
DIRECT ECONOMIC VALUE GENERATED AND DISTRIBUTED
AGE 2018 (ooo HRK)
Direct generated economic value 796,742
Net sales revenue 792,009
Revenue from the lease and sale of assets
4,434
Revenue from interest 300
Distributed economic value 682,683
Operating costs 502,166
Salaries and employee benefits 155,800
Payments to providers of capital 19,718
Payments to government 4,653
Investments into the community 346
Economic value retained 114,059
FINANCIAL ASSISTANCE RECEIVED FROM GOVERNMENT
The parent company qualified for state incentives in the amount of HRK 6,753,592.08 in 2018. Incentives were realized through tax deduction based on education, investment, employment of long-term unemployed persons and volunteers, and preferential credit interests.
MARKET PRESENCE
MANAGEMENT APPROACH DISCLOSURES
EXPLANATION OF THE MATERIAL TOPIC AND ITS BOUNDARY
This topic is material due to its significant impact on the economic conditions of employees, on economic systems at the local, regional, national and international levels, and on the assessments and decisions of stakeholders.
With the aim of determining significant impacts related to market presence, JGL Group systematically includes members of local communities into senior management and monitors the impact of their inclusion in its management teams.
Significant impacts related to market presence occur in the entire JGL Group, as well as outside the Group, in local communities and on all markets where the Group operates.
THE MANAGEMENT APPROACH AND ITS COMPONENTS
JGL manages this topic through developing a thriving and cooperative culture oriented towards success by developing leadership and management skills and ensuring the accountability and independence of all employees, on all markets where it has sales operations.
The basic salary is determined on the basis of job value (ten evaluation factors that represent the company’s strategic orientation and corporate culture), which is used to determine the complexity of jobs and levels of responsibility, and an additional scale for the required level of competence of each individual employee (knowledge, skills and delivery level) in a specific position, which is used to establish an employee’s salary.
Based on job value, impact on defining and/or realising the business strategy and goals, and expected levels of impact on creating an additional job value, all of the positions are divided into three categories: management, professional and support.

33
103-
3
Each group of jobs is further defined through three career levels of impact and responsibility.
In 2018, the defined goal of budget allocation to all departments in the parent company was accomplished, while the priority on markets was determined based on sales and marketing operations and top performers.
EVALUATION OF THE MANAGEMENT APPROACH
Employees at JGL progress in their career either hierarchically or, to a larger degree, through the change of responsibilities in their existing workplace, or through internal transfers to other workplaces where they can develop new skills and develop and share existing knowledge with other employees.
Our goal for 2019 is to continue working on a systematic evaluation and to set a preliminary definition of top performers versus potentials, which would be further confirmed through a systematic evaluation with the PM appraisal in 2/2020.
Through the career management system and individual development plans, a total of 46 promotions were realised in JGL Pharma in 2018 and 1Q of 2019, of which 31 were horizontal promotions/internal rotations and 12 vertical were promotions, three of them to managerial positions.
PROPORTION OF SENIOR MANAGEMENT HIRED FROM THE LOCAL COMMUNITY
In the JGL Group, there is no difference in starting salary for men and women, and the business performance of the company is reflected in employee benefits.
Significant places of business are considered to be the markets with the largest number of employees (Croatia and Russia), those that account for more than 95% of the total JGL Group production (Croatia), as well as those with the most significant share in total revenue (Russia and Croatia).
Average gross 1 salary on the JGL market in Croatia decreased by 0.03 percent, but the average net salary increased due to changes in income tax that came into effect on 1 January 2017.
All of the senior management (the Board of Directors, the Executive Director, the first line of directors, managers, and department heads) are employed from the local community in significant places of business, whereby the definition of a local community is the country of the business location. The same applies to the middle and lower management.
JGL CROATIA average gross 1 salary
CROATIA average gross 1 salary in the private sector
JGL RUSSIA average gross 1 salary
RUSSIA average gross 1 salary in the private sector
2017 HRK 11,512.28
HRK 8,023.65
HRK 11,380.35
HRK 6,138.80*
2018 HRK 12,512.22
we do not have reliable data
HRK 13,280.08
HRK 4,373.15*
202-
1 RATIOS OF STANDARD ENTRY LEVEL WAGE BY GENDER COMPARED TO LOCAL MINIMUM WAGE
JGL CROATIA entry level gross 1 wage
CROATIA minimum wage
JGL RUSSIA entry level gross 1 wage
RUSSIA minimum wage
2017 HRK 4,500.00
HRK 3,120.00
HRK 5,528.33
HRK 1,473.36
2018 HRK 4,500.00
HRK 3,439.80
HRK 4,382.37
HRK 1,892.3
*data taken from the Mazars CEE Tax guide
202-
2

34
GRI 300:
ENVIRONMENTALTOPICS

35
103-
130
210
3-2
ENERGY
MANAGEMENT APPROACH DISCLOSURES
EXPLANATION OF THE MATERIAL TOPIC AND ITS BOUNDARY
This topic is material for the JGL Group due to significant ecological and economic impacts related to energy and to shareholders’ expectations and interests in the company’s systematic care about the following:
• Control over energy losses in development, production and distribution through the implementation of preventive methods for network maintenance and investments in the entire system;
• Ensuring the availability of information and data, continuous improvement of methods for the analysis of data on energy source consumption (electricity, water, fuel, gas), and recognizing opportunities and implementing activities for the improvement of energy performance;
• Permanently raising awareness on the importance of energy efficiency among all users;
• Procurement of energy efficient machines, devices and vehicles, and energy services;
• Energy efficiency when designing, upgrading and modernizing the company’s systems;
• Continuous improvements of the energy management system in accordance with the requirements of the ISO 50001:2011 standard;
• Permanent harmonization and intention of surpassing legal and other requirements in the field of energy management, and in all other areas applicable to the business.
THE MANAGEMENT APPROACH AND ITS COMPONENTS
For the fourth year in a row, JGL has successfully managed the energy aspect through the ISO 50001:2011 energy management system.
We are proud certificate holders and we successfully use all available tools in energy management and environmental conservation. We apply the energy management system to the activities of development, production and distribution of medicines, medical devices, cosmetics, food supplements, food for special medical purposes, and other support activities.
To achieve the above, the management define goals for energy system management and provide resources for their attainment. At the same time, participation in the energy management system is a duty of all employees, who have a key role in carrying out the system activities.
Our Energy Management Policy is a public document, available to all employees, partners, and other interested parties.
Consistent energy management governed by the ISO 50001:2011 norm was supplemented by the ZelEn certificate for the purchase of total energy for consumption from renewable sources.

36
103-
330
2-1
EVALUATION OF THE MANAGEMENT APPROACH
The monitoring of the energy management system is carried out by an external audit in accordance with the ISO 50001:2011 standard, based on continuous systems of measurement, analyses and goals that are approved by the Board of Directors, which monitors their realisation.
ENERGY CONSUMPTION WITHIN THE ORGANIZATION
The main energy sources used within JGL are electricity and extra light fuel oil (ELFO). By encouraging sustainable economic growth within the environment, JGL continues to use only electricity produced from renewable sources.
ELFO is a relatively new energy source that has been in use since the opening of the new production plant. Seeing as JGL is not in the position to use a more environmentally friendly energy source due to the remote location of the facility, it will continue to use ELFO for now. In the long run, a facility that uses ELFO as fuel is also prepared to use natural gas as an energy source. The alternative to ELFO is natural gas, and transition to natural gas is planned as soon as possible.
Since mid-2013, JGL has been one of the leading Croatian companies that buys electricity produced exclusively from renewable sources, so it can boast a CO2 specific emission of zero tons.
The ratio of electricity and ELFO consumption in relation to greenhouse gas emissions (tCO2)
Electrical energy ELFO
MWh GJ tCO2* I MWh GJ tCO2*
2011 4.383 15.779 1.213 0 0 0 0
2012 5.080 18.288 1.406 0 0 0 0
2013 5.821 20.956 685** 0 0 0 0
2014 5.749 20.696 0** 0 0 0 0
2015 7.287 26.233 0** 169.000 1.791 6.449 496
2016 8.193 29.495 0** 260.000 2.756 9.922 763
2017 8.769 31.568 0** 247.000 2.618 9.426 725
2018 8.428 30.341 0** 260.000 2.756 9.922 763
* Specific CO2 emissions per kWh of energy produced are 276.75 g/kWh; for ELFO, it is 299.70 g/kWh. Source: Manual for Energy Consultants, UNDP
** On 1 September 2013, a contract was signed with HEP Opskrba for the supply of electricity from renewable sources (ZelEn – Green Energy)

37
Graphic representation of the ratio of electricity and ELFO consumption in relation to greenhouse gas emissions (CO2)
Electrical energy
ELFO
1.600
1.400
1.200
800
600
400
200
0
2011 2012 2013 2014 2015 2016 2017
The energy input is distributed to the following consumers:
• heating/cooling – 26% | • production – 58% | • lighting – 7% | • office equipment – 8% | • other – 1%
tCO2
2018

38
302-
2 ENERGY CONSUMPTION OUTSIDE OF THE ORGANIZATION**
Personal vehicles – petrol Personal vehicles – diesel Transport vehicles – diesel
I MWh GJ tCO2* I MWh GJ tCO2 I MWh GJ tCO2
2015 13.305 138.732 498.139 37.687 112.850 1,196,210 4,306,356 346,458.30 85.888 910.413 3,277,486 263,682.86
2016 12.348 128.422 462.320 34.977 96.330 1,021,098 3,675,953 295,740.61 28.343 300.436 1,081,569 87,015.22
2017 15.407 160.235 576.846 43.642 109.646 1,162,248 4,184,091 336,621.77 26.523 281.144 1,012,118 81,427.68
2018 18.200 189.280 681.408 51.552 126.339 1,339,193 4,821,096 387,870.58 26.523 281.146 1,012,124 81,428.20
Relationship between the consumption of Eurosuper fuel in personal vehicles, diesel fuels in personal vehicles, and diesel fuels in transport vehicles in relation to greenhouse gas emissions (tCO2)
Personal vehicles – petrol
Emission of CO2 greenhouse gases outside the organisation
Personal vehicles – diesel
Transport vehicles – diesel
* Specific CO2 emissions per kWh of energy produced from diesel fuels are 296.45 g/kWh. Source: Manual for Energy Consultants, UNDP
Relationship between the consumption of Eurosuper fuel in personal vehicles, diesel fuels in personal vehicles, and diesel fuels in transport vehicles in relation to CO2 emissions
350.000
300.000
250.000
200.000
150.000
100.000
50.000
02015 2016 2017
tCO2
2018
400.000
** The production of raw materials and waste disposal is performed for JGL by external partners, from which we are not able to obtain data about energy consumption, so only the information which we control, related to distribution transport, i.e. transport and personal vehicles, is listed in this section.

39
302-
3 ENERGY INTENSITY
The energy intensity diagram shows the ratio of power consumption in relation to the number of produced product pieces.
Energy input includes electricity and ELFO.
Energy input (MWh)
Relative energy consumption (MWh/millions of product pcs.)
Energy intensity scheme
REDUCTION OF ENERGY CONSUMPTION
The energy management system has helped us to meet all set goals faster, with more dedication and motivation, and enable growth to match changes within the company.
In the last three years, we have achieved noticeable savings in energy consumption, and therefore a lower emission of harmful substances, and we also consider a higher level of environmental awareness among employees to be a great success, which we accomplished via regular activities and corporate actions.
In addition to measures of good management and investment in equipment, the following measures have also been implemented:
• Improving the thermal properties (insulation) of our facilities;
• Replacement of existing lighting with LED lights;
• Temperature regulation of processes, and operational, storage and office spaces;
• Partial use of wasted heat;
• Solar preheating of hot water and water softening (preventing limescale deposits
on heating elements);
• Replacing a warehouse roof at the production site Svilno 1;
• Replacing the cooler at Svilno 1, sterile solutions plant 1, with a more efficient one;
• Installing additional solar panels for hot water production;
• Installing a voltage optimizer in the substation at the location Svilno 2.
The following improvements were suggested as improvement opportunities in 2019:
• building a 180 kW photovoltaic power station for own use.
302-
4
9.000
8.000
7.000
6.000
5.0004.000
2.000
3.000
1.000
020122011 2013 201620152014 2017
10.000
2018

103-
130
310
3-2
103-
3
WATER
MANAGEMENT APPROACH DISCLOSURES
EXPLANATION OF THE MATERIAL TOPIC AND ITS BOUNDARY
This topic is material for JGL Group due to significant environmental impacts related to water and due to stakeholders’ expectations and interest in the company’s systematic care about:
• Introducing advanced washing and cleaning processes;
• Effective preparation of purified water for industrial needs;
• Use of waste water for watering green areas;
• Controlled water discharge and treatment of water through biological purifiers before its discharge into municipal systems;
• Systematic collection of rainwater from roofs and purified water from the biological purifier.
THE MANAGEMENT APPROACH AND ITS COMPONENTS
Water discharge is controlled and water is treated in biological purifiers before being discharged into municipal systems. Biological purifiers are used at all JGL manufacturing sites. We have a total of three biological purifiers that are regularly refurbished in accordance with new technologies.
Systems for collecting rainwater from roofs and water from the production process of purified water at the production facility Svilno 2 greatly contribute to the reduction of water consumption for the purpose of irrigation of green areas. The mud residue and sludge from the purified water are collected and ecologically disposed of.
EVALUATION OF THE MANAGEMENT APPROACH
Monitoring the effectiveness of the management approach for this topic is implemented through:
• Documentation and data management;
• Management of non-compliances and corrective measures;
• Resource management;
• Analysis and improvement (monitoring, quality review, process performance);
• Risk management and management of opportunities.
WATER WITHDRAWAL BY SOURCE
JGL is supplied with water from the local water supply network and there are no surface flows within the production sites. The implementation of the consumption management system includes control and continuous monitoring of water consumption, resulting in direct savings and reduced consumption.
A sharp increase in water consumption was recorded in 2015 due to the opening of a new production site and testing of different systems, but during the reporting period, the trend visibly stabilized and in 2018, we expect stagnation, i.e. approximately the same consumption as in the previous period.
It is worth pointing out that the discharged water from the clean water production system and rain water from the roof surfaces is accumulated in the collection pool and used for watering the surrounding areas.
303-
1
40

41
303-
3 WATER RECYCLED AND REUSED
JGL is undertaking numerous measures for the reduction of water consumption:
• use of waste water for watering green areas.
Water consumption and relative consumption per produced product in the period from 2011 to 2018
50.000
40.000
30.000
20.000
10.000
0
60.000
2012 20152014 20172011 2013 2016 2018
Total water consumptionin all locations (m3)Rel. water consumption (m3/mil. of pcs.)

42
103-
130
610
3-2
103-
3
306-
1
EFFLUENTS AND WASTE
MANAGEMENT APPROACH DISCLOSURES
EXPLANATION OF THE MATERIAL TOPIC AND ITS BOUNDARY
The topic was chosen as material due to the significant interests of key stakeholders – employees, shareholders, doctors/pharmacists, and end users, especially those who live and work in a tight local community.
The company is associated with impacts through its own activities.
THE MANAGEMENT APPROACH AND ITS COMPONENTS
Through continuous education of its employees, JGL invests maximum effort to reduce and prevent the creation of unnecessary waste.
Within the JGL’s management process for environmental protection, responsible attitude towards waste and the development of a proper waste management culture are top priority for creating a healthy and sustainable business. The JGL team devoted to this segment operates within the Technical Support department and strives to continuously reduce, use and dispose of waste in an environmentally safe manner with a comprehensive waste management approach.
We are expanding a friendly attitude towards environment by encouraging everyone to recycle batteries and paper, avoid using plastic bags, or use materials that have less harmful environmental impacts (eco-bags, eco-paper), and once a year we organize a corporate waste cleaning initiative on the beaches in our local community, in which all categories of employees participate, including top management.
EVALUATION OF THE MANAGEMENT APPROACH
Monitoring the effectiveness of a topic management approach is implemented through:
• Documentation and data management;
• Management of non-compliances and corrective measures;
• Resource management;
• Analysis and improvement (monitoring, quality review, process performance);
• Risk management and management of opportunities.
WATER DISCHARGE BY QUALITY AND DESTINATION
Water discharge is controlled and water is treated in biological purifiers before being discharged into municipal systems. At all JGL manufacturing sites, there are three biological purifiers that are refurbished in accordance with new technologies.
Treated water is discharged to the sewer drainage system and is regularly treated, tested and sampled to ensure that the quality of discharged wastewater is in accordance with the set requirements.
The system for collecting rainwater from roofs and water from the production process of purified water at the production facility Svilno 2 greatly contributes to the reduction of water consumption for the purpose of irrigation of green areas.
WASTE BY TYPE AND DISPOSAL METHOD
JGL produces hazardous and non-hazardous waste in accordance with its production, development and research. Below we show a diagram of the produced hazardous and non-hazardous waste trends.
306-
2

43
300.000
250.000
200.000
150.000
100.000
50.000
0
2015 20172014 2016
Hazardous waste
Non-hazardous waste
Produced waste in the period from 2014 to 2018
t
2018
Types of hazardous waste according to the waste catalogue from the Ordinance on the Waste Catalogue (Official Gazette No. 90/15):
• 18 01 03 – infectious waste
• 07 05 04 – other organic solvents
• 16 05 06 – laboratory chemicals
• 19 08 10 – grease from the separator
• 15 01 10 – packaging containing residues of hazardous substances
• 20 01 21 – fluorescent tubes
• 20 01 35 – discarded electrical and electronic equipment
• 15 02 02 – filters
• 16 07 08 – wastes containing oil
Types of non-hazardous waste according to the waste catalogue from the Ordinance on the Waste Catalogue (Official Gazette No. 90/15):• 18 01 09 – drugs• 15 01 01 – paper and cardboard packaging• 15 01 02 – plastic packaging• 07 05 99 – waste that is not otherwise specified• 07 06 99 - wastes not otherwise specified (glass packaging, plastic, cosmetics)• 15 01 06 – mixed packaging• 20 03 01 – mixed communal waste• 18 01 01 – sharp objects• 20 03 07 – bulky waste• 07 05 14 – aerosols, solid waste• 15 02 03 – filter materials, absorbents• 20 03 07 – bulky waste

44
Name of waste No. Hazardous Quantity in kg
SVILNO 1 SVILNO 2 Pulac TOTAL
Organic halogenated solvents 070503* YES 0
Other organic solvents 070504* YES 1475 1295 2770
Solid wastes containing dangerous substances
070513* YES 0
Infectious waste 180103* YES 7077 150 7227
IT equipment 200135* YES 1 1
Needles for disposal 180101* YES
Contaminated packaging 150110* YES
Air conditioners 160211* YES
El. equipment containing hazardous substances
200121* YES
Fluorescent tubes 150202* YES 75 75
Filter materials 150202* YES 3 3
Production waste 070599 NO
Wastes containing oil 160708* YES 5000 5000
Solutions 070599 NO
Cosmetics 070699 NO 57 57
Packaging (cardboard paper) 150101 NO 9880 1120 11000
Packaging (plastic) 150102 NO
Packaging (wooden) 150103 NO
Packaging (metallic) 150104 NO
Packaging (composite) 150105 NO
Packaging (glass) 150107 NO

45
Name of waste No. Hazardous Quantity in kg
SVILNO 1 SVILNO 2 Pulac TOTAL
Plant material (autoclaved) 070599 NO
Municipal waste 070299 NO
Pharmaceuticals for disposal 180109 NO 8798 57939 819 67556
Waste that is not specified 070699 NO 828 828
Solvents 140603 NO
Syrup 070599 NO 761 761
Aerosols 070514 NO 1800 1800
Filters 070514 NO
Solid waste 070514 NO 11890 11890
Solid and semi-solid waste (medicines)
180109 NO
Solid and semi-solid waste (cos.) 180109 NO
Municipal, mixed 200301 NO
Sludge from settlement tanks 070512 NO
Sludge containing dangerous substances
070511* YES
Separator fat 190810* YES
Mixed packaging 010499 NO
Mobile phones 200135 NO
Sludge from septic 200304 NO
Sludge from purified waste water 070512 NO
Ion exchanger 190905 NO
Resins (regeneration columns) 190905 NO

46
SVILNO 1 SVILNO 2 Pulac TOTAL
hazardous 14116 184 1863 16163
non-hazardous
10958 184154 4139 199251
TOTAL 25074 184338 6002 215414
TOTAL
Name of waste No. Hazardous Quantity in kg
SVILNO 1 SVILNO 2 Pulac TOTAL
Tea 070599 NO
Liquid technological waste 070699 NO
Tablets 070599 NO
Laboratory chemicals 160506* YES 485 34 568 1087
Process waters 070599 NO
Aqua Maris glass 070599 NO 10151 840 10991
Aqua Maris plastic 070699 NO 9109 9109
Iron and steel 170405 NO
Aluminium 170402 NO
Metals 200140 NO
Bulky waste 200307 NO 82800 1360 84160
Pressurised metallic packaging 150111 NO
Discarded equipment 160214 NO
Sludges from treatment 190805 NO
Absorbents, filter materials 150203 NO 571 528 1099
Readily biodegradable oils 130207* YES
Catalysts with dangerous substances 160807* YES
Other acids 060106* YES
Non-chlorinated hydraulic oil 130110* YES
El. waste 200136 NO
TOTAL 25074 184338 6002 215414

47
GRI 400:
SOCIALTOPICS

48
LABOUR/MANAGEMENT RELATIONS
MANAGEMENT APPROACH DISCLOSURES
EXPLANATION OF THE MATERIAL TOPIC AND ITS BOUNDARY
This topic is material due to significant social impacts related to the relationship toward employees and due to stakeholders’ expectations/interest in the company’s systematic care about the relationship between employees and the management.
JGL Group systematically creates, monitors and analyses relationships between employees and the management. This material topic has an impact on the entire JGL Group.
THE MANAGEMENT APPROACH AND ITS COMPONENTS
The field of labour/management relations covers information about channel management and the processes of internal, two-way communication, examining employee attitudes, and providing suggestions.
The key topics to be received by all employees are planned at the level of the Board of Directors, the CEO and senior management team, which includes HR and Corporate Communications representatives.
In this reporting period, work was done on the improvement of the internal communication processes and a change in the internal communication culture (more responsibility assumed by the management). In 2018, managers addressed employees in Croatia twice, and quarterly notices about business results, goals and direction were shared with employees in all markets in writing. During management’s speeches, employees are given the opportunity to raise questions that interest them. A magazine with current topics is sent to all employees in Croatia and Southeast Europe each month, while employees in the markets of Russia, Ukraine, Kazakhstan and Belarus are included in annual reporting.
During the reporting period, the CEO introduced a format called “Dan otvorenih pjata” (Open Plate Day), where once a month seven employees from different
103-
110
3-2
103-
3
business areas, i.e. not in a superior-subordinate relationship, can request to join him for lunch. The format was a big success among employees, which is why it was continued in 2019 as well.
Meetings between the management and teams take place at least once a week or more frequently, as needed. There is a defined policy of meetings of the Board of Directors, which in addition to the president and members includes the CEO and the Works Council representative, who are also members of the Board of Directors.
With the aim of a more frequent communication with employees in all markets, communication through the corporate magazine will be improved through quarterly issues in three languages, while senior management’s live addresses will be recorded and translated in order to be made available to employees in all markets.
EVALUATION OF THE MANAGEMENT APPROACH
Raising the quality of dialogue is a continuous goal of the company, which is analysed through climate and satisfaction research and through the Works Council.
An employee satisfaction survey (climate, culture and engagement survey) was conducted in February 2019 for the year 2018, while a pulse check is planned one year after the survey, and a repeat survey in two years – an improved process has been established after several years.
This ensured the continuity of feedback from employees and the creation of action plans that should result in an increase of employee satisfaction and engagement – KPI included for the first time no longer as a corporate, but rather an individual goal of every manager. The total response was 91.41%.
Special attention was paid to preparing for the communication of results to all employees and to define clear action plans to ensure managers implement them in practice.
The results are presented to employees in a cascade manner, so that directors/managers gather the first team of their subordinated employees and share
402

49
103-
210
3-1
403with them the results of the entire company and of the team gathered on that
occasion.
The action plan is defined by first-line managers, but through the communication of results – employees at lower hierarchical levels receive the opportunity to share their ideas and suggestions that are forwarded to first-line managers, who can then implement them in their final action plan.
In this segment, many challenges still lie ahead for the company, especially in the area of even more intensive encouragement of open and transparent two-way communication.
MINIMUM NOTICE PERIODS REGARDING OPERATIONAL CHANGES
The minimum period of advance notice for significant changes in work defined between the employer and the Works Council is eight days.
More specifically, two months before the significant change that took place on 31 December – entering into a simpler model of monistic governance after the expiry of the term of office of executive directors - the President of the Board of Directors informed all employees about this. Informing the employees took place only two days after the meeting of the Board of Directors, when a decision about the change was made.
During the reporting period, two addresses of the President of the Board of Directors and the CEO for all employees of JGL in Rijeka were arranged, while all other employees on the other markets were provided with a live broadcast, with a simultaneous interpretation for Russian for employees in the CIS region.
This way, all employees had the opportunity to find out about current business results, operating plan and business goals of the company.
OCCUPATIONAL HEALTH AND SAFETY MANAGEMENT APPROACH DISCLOSURES
EXPLANATION OF THE MATERIAL TOPIC AND ITS BOUNDARY
This topic is material for the JGL Group due to significant social impacts related to occupational health and safety and due to reasonable stakeholders’ expectations and interest in the company’s systematic care about occupational safety, ensuring appropriate working conditions for all employees in relation to health and safety, taking necessary measures for achieving safe working conditions for employees, and maintaining the highest possible ecological standards.
With the aim of determining significant impacts related to occupational health and safety, JGL Group analyses and controls health and safety risks and conducts analyses of health and safety incidents. This material topics has an impact on the entire Group, and outside the company, it affects all communities where business activities are carried out on the orders of the employer.
THE MANAGEMENT APPROACH AND ITS COMPONENTS
Health protection and safety at work are important priorities for JGL. Every person has the obligation to promote JGL’s efforts to carry out operations in a safe manner. Responsibility for employees requires the application of the best possible measures to prevent accidents, including: technical planning of workplaces, equipment and processes, safety management and personal behaviour at workplaces. It is everyone’s duty to continuously take care of safety at work.
The Safety at Work Department (Zaštita na radu - ZNR) and Fire Protection Department (Zaštita od požara - ZOP) operate in accordance with JGL’s mission of “improving the quality of life through taking care of health.” As safe work and environment are the prerequisites to achieving that goal, numerous measures were taken and the pre-existing state of occupational safety was implemented in 2018.
402-
1

50
Employee safety and health care are managed in accordance with a number of heteronomic legislative regulations and autoimmune acts that JGL stipulated for the improvement and progress in terms of occupational safety and fire protection, and in terms of environment protection.
Through regular annual reports to the competent bodies (Croatian Occupational Safety Inspectorate, Environmental Protection Agency, Croatian Bureau of Statistics, and others), JGL presented its real state of affairs which shows progress in comparison to the year 2017.
In order to prevent work related injuries, professional diseases or any other diseases related to work, as well as to eliminate potential dangers in work areas, a range of tests and educational programmes were conducted:
• Work safety training
Occupational safety-related knowledge of all employees is constantly being evaluated. In 2018, 20 new employees in JGL received training in the theory and practice of how to work safely, and 35 of them were trained in fire protection. Additional training was organised for managers in order to convey how important health protection and safety at work are to employees and to contribute to the business success of the company.
• Constant health surveillance
JGL has a contractual relationship with an expert team of occupational medicine specialists, who monitor the health of employees on a regular basis through previous, periodic and unscheduled medical examinations, and by participating in danger assessment evaluations. Apart from engaging occupational medical specialists to monitor employee health, JGL provided its employees with an annual physical examination covered by supplementary insurance.
• Taking care of work tools
In 2018, all necessary tests were performed, including those on dangerous machinery and devices, electrical installations, work environment (noise, vibrations, lighting, microclime conditions), and fire protection.
• Internal and external surveillance
Regular internal surveillance was used to monitor occupational safety conditions and to eliminate irregularities in order to prevent unwanted events. In 2018, a number of targeted and complete surveillances were performed and where failures were noticed, instructions were given and deadlines established for their elimination.
• Fire and explosions protection
In addition to regular (quarterly) and periodic (annual) surveillances of fire protection equipment, in 2018 JGL organized a fire drill in accordance with to the existing SOP, and trained new employees in fire protection in cooperation with the Vežica Fire Station.
In the last five years (from 2014 to 2018), a total of 26 work-related injuries were registered. There were no registered cases of occupational disease.
EVALUATION OF THE MANAGEMENT APPROACH
The effectiveness of the management system is carried out through constant analysis and employee feedback. The focus and ultimate goals of JGL’s Works Council in 2018 were specifically related to work safety issues and issues of helping workers in need.
103-
3

51
403-
140
3-2
WORKERS REPRESENTATION IN FORMAL JOINT MANAGEMENT–WORKER HEALTH AND SAFETY COMMITTEES
• Since November 2015, there has been an Occupational Health and Safety Representative in the Works Committee.
• Since January 2017, twenty-one workers have been appointed as direct employer representatives for carrying out occupational safety work within their scope of work.
• At the end of 2018, the Selection Committee and the WC held elections for an occupational health and safety representative; five OHS representatives and five deputy OHS representatives were appointed.
• From now on, in addition to heads of departments/personnel authorised for OHS, employees can direct all of their questions related to occupational safety to OHS representatives.
TYPES OF INJURY AND RATES OF INJURY, OCCUPATIONAL DISEASES, LOST DAYS, AND ABSENTEEISM, AND NUMBER OF WORK-RELATED FATALITIES
The number of injuries was reduced in proportion to the increase in the number of employees. In 2018, six occupational injuries were reported, of which four were at the workplace while performing tasks and work assignments, and two occurred while travelling from the place of residence to the place of work and vice versa.
Of the six injuries, four were classified as minor, and two as more severe, sustained on the way from home to work.
Year At the workplace while performing duties and tasks
On the way from the place of residence to the workplace and vice versa
Total
2014 2 0 2
2015 2 0 2
2016 4 2 6
2017 7 3 10
2018 4 2 6
Number of injuries due to the site of injury in the past five years (2014 – 2018)
403-
3 WORKERS WITH HIGH INCIDENCE OR HIGH RISK OF DISEASES RELATED TO THEIR OCCUPATION
Workers with high risk of diseases related to their occupation are workers in production and quality departments.
In 2018, the average number of employees using a short-term sick leave without replacement was five in the production department and three in the quality department, resulting in the need for overtime work and consequently leading to exhaustion and injuries.

52
An overview of sick leave per business unit in 2018
MT Total sick leave JGL and CIHI
% of total sick leave
Central procurement 2104 5.88
Finalization 3416 9.55
Finances 48 0.13
Registrations 368 1.03
Global product management 504 1.41
Global business management 32 0.09
Market of Croatia 1160 3.24
IT 456 1.28
Research and development 1640 4.59
Quality control 9316 26.05
Corporate controlling 156 0.44
Supply chain procurement 128 0.36
Non-sterile segment 3496 9.78
Customer support 72 0.20
Regulatory affairs 16 0.04
Production maintenance 832 2.33
Accounting 360 1.01
Storage of finished products 208 0.58
Storage of input materials 808 2.26
MT Total sick leave JGL and
CIHI
% of total sick leave
Sterile segment 5408 15.12
Strategic marketing 256 0.72
Technical support 1416 3.96
HR 136 0.38
Portfolio management department 56 0.16
FTO department 32 0.09
Management board 80 0.22
Quality control department 1392 3.89
Manufacturing department 1488 4.16
RBU SE Europe department 192 0.54
Health and beauty 184 0.51
TOTAL 35760 100.00
HEALTH AND SAFETY TOPICS COVERED IN FORMAL AGREEMENTS WITH TRADE UNIONS
JGL does not have an acting union, but rather a Works Council that consults with the employer and initiates actions in support of employees with health problems or on a long-term sick leave.
403-
4

53
103-
140
410
3-2
TRAINING AND EDUCATION
MANAGEMENT APPROACH DISCLOSURES
EXPLANATION OF THE MATERIAL TOPIC AND ITS BOUNDARY
This topic is material due to significant social impacts related to the training and education of employees and due to stakeholders’ reasonable expectations and interest in the company’s systematic care about the engagement of employees, their knowledge and experience in the organisation’s development to the greatest degree possible, as well as about employee contribution, conducting internal and external educations, and programmes for encouraging lifelong employee learning.
With the aim of determining significant impacts related to employee training and education, the Group monitors and analyses investments in training and education.
This material topic has an impact on the entire JGL Group, and outside the company, it affects all local communities and countries where the company operates.
THE MANAGEMENT APPROACH AND ITS COMPONENTS
In 2018, we continued with the development of this area, and with the implementation of a new software solution (SAP LMS), we secured conditions for increasing the quality of the provision, monitoring and analysis of development tools and topics. Work is currently in progress on the development of contents to be implemented by the end of 2019 through management and employee training.
All other practices are in use: an annual training plan in Excel, created in the first part of the year, with monthly monitoring of the plan’s implementation.
Educational needs are assessed primarily by managers of individual employees, and they depend on new workplace requirements, the use of new equipment or software or a person’s planned participation in a project for which new knowledge is required.
HR additionally proposes training needs for specific employees if such needs are identified, e.g. through an internal competition, and a part of the needs is planned
after establishing annual goals for employees.
As part of the Sales Force Effectiveness programme, annual assessments of professional associates in the field are made, and training is proposed following these assessments as well.
A training plan is made by the HR manager in cooperation with the HR team and other managers. Its implementation is monitored by the HR team. We currently do not have a formally defined long-term strategy for employee development. It is our plan to continue to work on individual development plans for certain positions of strategic importance for the company throughout 2019. In 2019/2020, we also plan to revise, update and focus on the talent management and career development programme.
EVALUATION OF THE MANAGEMENT APPROACH
All external educators/trainers (especially in the organisation of group workshops) have the obligation to create tailor-made questionnaires for the assessment of acquired knowledge, to implement them through follow-up workshops/questionnaires for participants and managers, and to conduct workshops to educate managers on how to monitor their employees.
An e-learning course has been developed in cooperation with students from the Faculty of Economics in Rijeka as a pilot project supported by the Production Department. An interactive and dynamic modular course has been created for a topic that is not available through any educational institution and (almost) all new employees in the Production Department have to complete it. So far, one person has been responsible for this knowledge transfer.
Development goals have KPIs to avoid a subjective approach to the assessment of development. 10% of development programmes are educations and trainings, and they include defined “before” and “after” measures, e.g.knowledge tests. 30% of development programmes involves mentoring and coaching that includes an assessment of effects and a mentor’s assessment, as well as a before-and-after assessment arising from the performance agreement, the results of a 360-degree feedback, or the results of an organisational climate measurement. 60% of
103-
3

54
development is learning on the job and the results measured are those related to the performance agreement and participation in projects. 90% of educations include a link with programme performance indicators and they arise from the performance agreement.
All development programmes are monitored in terms of their success through the analysis of the competency gap. An additional connection has been created between individual KPIs and business goals and results (NMM, brand awareness, net sales, gross 3, OpEx/CapEx realisation, BSC goals realisation) for one department (seven employees).
For around 20% educations/developmental activities, a quality analysis has not been made, and those are generally activities related to internal educations and legal seminars that are not analysed, but rather implemented (visible) through work.
During the last reporting period, new ways of monitoring performance were introduced through Sales Force Effectiveness (SFE), a tool used to monitor the competency level of the sales force. This tool includes an initial assessment of associates, definition of a development plan, and an annual evaluation of competencies required for work. The Development Centre (DC) has been established for key positions, where over the course of two days participants undergo a complete assessment of their competency level and readiness to take over another position as part of the company’s Talent Management programme.
Following the assessment, individual development plans (IDPs) are set, which are used to measure performance based on defined measures for specific positions.
All practices from the previous period were maintained in this reporting period. Almost all in-house trainings have an integral follow-up system. The success of particular trainings is also measured through efficiency and accomplished goals in particular workplaces. The success of the development programme is monitored on the basis of employee development plans and the newly acquired skills and knowledge that allow employees to progress in their workplace both horizontally and vertically.
In 2019, our goal is to introduce a new mentorship programme that would encourage the education of experts within JGL and mentor certification. With the aim of encouraging the transfer and sharing of internal knowledge, experience and know-how to existing and new employees, students and trainees, mentors will undergo professional training (including core competency = ambassadors of JGL value) in order to become certified and recognisable in the system in that field and to be known as role models of JGL culture.
AVERAGE HOURS OF TRAINING PER YEAR PER EMPLOYEE
All employees have the option to undergo training. The company provides all types of training: professional, legal, soft skills, managerial education, etc.; based on and in accordance with needs and the financial budget.
At the level of JGL d.d., 78 percent of employees underwent some form of training in 2018, and 61 percent of employees underwent some form of supplementary training. At the level of JGL Pharma, 80 percent of employees underwent some form of training, and 95 percent underwent some form of supplementary training.
404-
1
Total investments in professional development and total number of training hours at JGL Pharma in 2018
Year Total investments in internal training (HRK)
Total investments in external training (HRK)
Total hours of internal training
Total hours of external training
2018 382,063 969,582 8,053 11,242

55
then adding the hours of all employees by department and sector.
The number of hours of professional development per employee is calculated using the formula: total number of hours/total number of employees in the company (separately for internal and external training).
PROGRAMS FOR UPGRADING EMPLOYEE SKILLS AND TRANSITION ASSISTANCE PROGRAMS
The company provides 3 scholarships for postgraduate, doctoral and specialist studies, with a focus on business needs and the interests of employees, and it also provides an MBA program for managers each year.
During the reporting period, a total of nine employees from the parent company and Adrialab d.o.o. Rijeka completed, started or attended some of the programs aimed at acquiring new skills.
404-
2
JGL Group 2017 2018
JGL Croatia HRK 2,971 HRK 2,026
JGL Ukraine HRK 2,777 HRK 3,392
JGL Belarus HRK 0 HRK 380
JGL Kazakhstan HRK 3,601 HRK 3,638
LLC Jadran Moskva HRK 2,063 HRK 1,258
Farmis d.o.o. Sarajevo HRK 2,300 HRK 127
JGL d.o.o. Beograd-Sopot HRK 1,200 HRK 88
Adrialab d.o.o. Rijeka HRK 1,000 HRK 1,100
Average HRK 1061 HRK 1501
Average training costs per employee in the JGL Group in 2017 and 2018
Along with specific internal training, a large number of employees participated in the training of new employees through knowledge sharing at work. This was particularly important in 2018, and due to the focus on the SAP project, the number of hours and costs were not recorded.
Additionally, a significant amount of time and financial resources were allocated to educating employees in the use of SAP and serialisation, which has also not been indicated separately because it was part of the project budget.
Hours of professional development are recorded separately for each employee (who attended the education, and for how long) and include all forms of professional development for which duration can be determined.
The total number of hours of professional development for a certain period of time is calculated by adding up the hours for each employee and
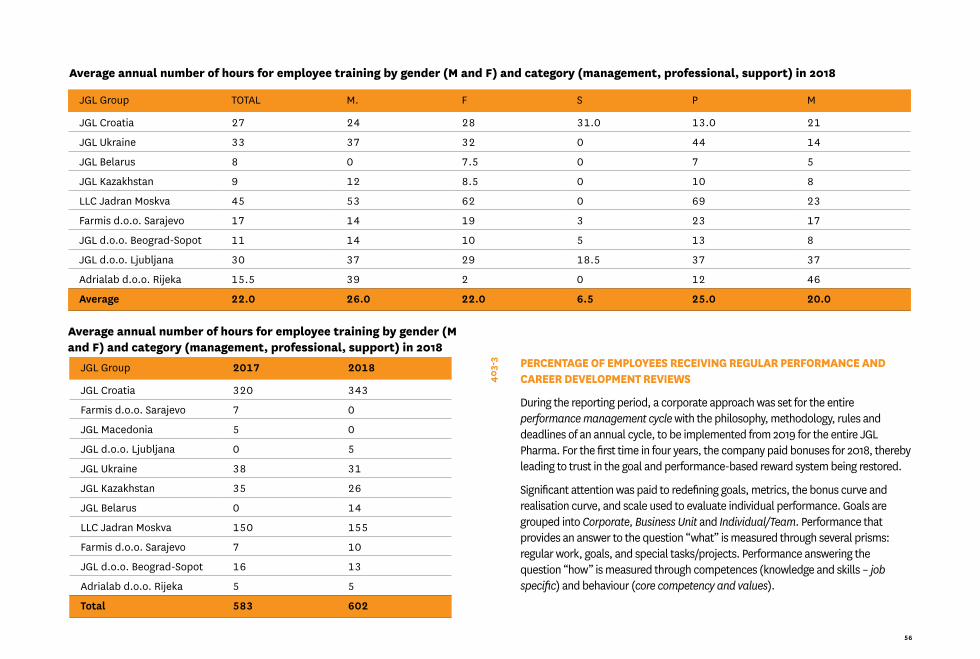
56
JGL Group TOTAL M. F S P M
JGL Croatia 27 24 28 31.0 13.0 21
JGL Ukraine 33 37 32 0 44 14
JGL Belarus 8 0 7.5 0 7 5
JGL Kazakhstan 9 12 8.5 0 10 8
LLC Jadran Moskva 45 53 62 0 69 23
Farmis d.o.o. Sarajevo 17 14 19 3 23 17
JGL d.o.o. Beograd-Sopot 11 14 10 5 13 8
JGL d.o.o. Ljubljana 30 37 29 18.5 37 37
Adrialab d.o.o. Rijeka 15.5 39 2 0 12 46
Average 22.0 26.0 22.0 6.5 25.0 20.0
Average annual number of hours for employee training by gender (M and F) and category (management, professional, support) in 2018
Average annual number of hours for employee training by gender (M and F) and category (management, professional, support) in 2018
JGL Group 2017 2018
JGL Croatia 320 343
Farmis d.o.o. Sarajevo 7 0
JGL Macedonia 5 0
JGL d.o.o. Ljubljana 0 5
JGL Ukraine 38 31
JGL Kazakhstan 35 26
JGL Belarus 0 14
LLC Jadran Moskva 150 155
Farmis d.o.o. Sarajevo 7 10
JGL d.o.o. Beograd-Sopot 16 13
Adrialab d.o.o. Rijeka 5 5
Total 583 602
403-
3 PERCENTAGE OF EMPLOYEES RECEIVING REGULAR PERFORMANCE AND CAREER DEVELOPMENT REVIEWS
During the reporting period, a corporate approach was set for the entire performance management cycle with the philosophy, methodology, rules and deadlines of an annual cycle, to be implemented from 2019 for the entire JGL Pharma. For the first time in four years, the company paid bonuses for 2018, thereby leading to trust in the goal and performance-based reward system being restored.
Significant attention was paid to redefining goals, metrics, the bonus curve and realisation curve, and scale used to evaluate individual performance. Goals are grouped into Corporate, Business Unit and Individual/Team. Performance that provides an answer to the question “what” is measured through several prisms: regular work, goals, and special tasks/projects. Performance answering the question “how” is measured through competences (knowledge and skills – job specific) and behaviour (core competency and values).

57
discriminatory behaviour. Through various seminars and educations, the HR department has learned more about respecting diversity and preventing discrimination in the workplace.
In 2018, there were no reports of direct discrimination in the company.
In the following periods, the company’s goal is to adopt the JGL Code of Conduct, which will define more clearly the elements of discrimination and expected levels of integrity, ethics and professional conduct, reporting methods, and measures to be taken in the event of non-compliance. The idea is for this document to be an integral part of the core competency profile for the certification of mentors in 2019, and from there, the initiative should spread further. There is a proactive approach in place for every noticed or reported inappropriate behaviour, and we have noticed the employees’ increased willingness to bring attention to them. A new software has enabled the monitoring of the structure of employed candidates in selection processes. After the JGL Code of Conduct is adopted, educations aimed at managers will be organised.
EVALUATION OF THE MANAGEMENT APPROACH
With the aim of determining significant impacts related to diversity and equal opportunities, the Group has a record of diversity, but there are no clearly defined criteria for monitoring diversity on the basis of structures of employed candidates in selection processes, access to development programs according to diversity criteria, or the number of promotions according to diversity criteria.
DIVERSITY OF GOVERNANCE BODIES AND EMPLOYEES
The six people that make up JGL’s Board of Directors can be distributed into the following gender and age categories:
• Women (4) – 66.66%
• Men (2) – 33.33%
• Under 30 years of age (0) – 0%
• Between 30 and 50 years of age (2) – 33.33%
Both in theory and in practice (through the tool and application), a strong relationship was established between goals and competences (what and how) in the overall employee evaluation, which is a precondition for a more objective way to manage performance, rewards (bonus, salary, stimuli), and employee development. Due to a transition to a new tool (HR.net-SAP) in 2018, goals were set for 100% of senior-level employees (corporate + BU), and bonus payments were made on that basis. For 90% of employees, we have a documented and archived work performance assessment. In 2019, our goal is to again cover 100% of employees, but with 100% of archiving.
DIVERSITY AND EQUAL OPPORTUNITY
MANAGEMENT APPROACH DISCLOSURES
EXPLANATION OF THE MATERIAL TOPIC AND ITS BOUNDARY
This topic is material due to significant social impacts related to diversity and equal opportunities and due to stakeholders’ expectations and interest in the company’s systematic care for encouraging diversity in the organisation, at managerial positions, and when hiring new employees.
This material topic has an impact on the entire JGL Group, and outside the company, it affects all local communities and countries where the company operates.
THE MANAGEMENT APPROACH AND ITS COMPONENTS
Legally prescribed documents have been prepared for the prevention of discrimination and encouraging diversity in the workplace (as part of JGL’s Work Regulations):
• The protection of workers’ health and privacy;
• The procedures and measures for the protection of workers’ dignity.
Although there is no procedure for taking action in the event of discrimination, two persons have been appointed within the HR department that can record discrimination complaints. The company has an open door policy and the employees have adopted a habit of reporting
103-
140
510
3-2
103-
340
5-1

58
• Over 50 years of age (6) – 66.66%
The 964 employees employed by JGL Group can be distributed into the following gender and age categories:
• Women (745) – 77.28%
• Men (219) – 22.72%
• Under 30 years of age (156) – 16.18%
• Between 30 and 50 years of age (692) – 71.79%
• Over 50 years of age (116) – 12.03%
RATIO OF BASIC SALARY AND REMUNERATION OF WOMEN TO MEN
Basic salaries and remuneration for men and women in the JGL Group are equal in all categories in significant places of business, and there are no differences among genders in any evaluation segment, including this one.
Significant places of business are considered to be the markets with the largest number of employees (Croatia and Russia), those that account for more than 95% of the total JGL Group production (Croatia), as well as those with the most significant share in total revenue (Russia and Croatia).
405-
2
103-
141
610
3-2
CUSTOMER HEALTH AND SAFETY
MANAGEMENT APPROACH DISCLOSURES
EXPLANATION OF THE MATERIAL TOPIC AND ITS BOUNDARY
The topic was chosen as material due to the significant interests of all key stakeholders – employees, end users, doctors and pharmacists, students, shareholders. The company is associated with impacts through its own activities, but also the bodies within the supply chain.
THE MANAGEMENT APPROACH AND ITS COMPONENTS
The realisation of products and services within the JGL broadly encompasses processes of planning, research and development, procurement, production, quality control, product and service delivery, wholesale traffic and appropriate supporting processes. For this reason, proper management and control of these processes is essential for the realisation of products and services that will meet all applicable requirements.
No series of JGL products may be placed on the market before being formally released on the market and/or approved for sale or delivery to the customer, which ensures that the product is effective, safe for use, healthy to use, and properly equipped, all in accordance with applicable legal regulations, internal requirements and regulatory requirements, with respect to the legislative category.
In addition, national regulatory authorities have adopted a large number of laws and regulations in the field of pharmaceutical industry that regulate testing, approval, production, import, export, labelling and marketing of drugs, and verification of safety and efficacy of pharmaceutical products. JGL’s sophisticated production facilities, equipment and manufacturing processes guarantee JGL acquisition and maintenance of regulatory approvals for new products. The Group follows trends in the field of pharmaceutical preparations and invests in new technologies each year, as needed. New high-quality equipment, modern manufacturing processes and quality controls ensure that each product is of the highest quality and thus minimizes the risk of potential damage to health and safety of customers.

59
103-
3 EVALUATION OF THE MANAGEMENT APPROACH
Quality management system processes at JGL are processes that are key to achieving, maintaining, and improving product quality and other processes, i.e. processes that will meet the expectations of interested parties, including key stakeholders.
• Documentation and data management;
• Change management;
• Management of non-compliances and preventive/corrective measures;
• Validation and qualification management;
• Resource management;
• Measurement, analysis and improvements (includes management evaluation, internal audit, independent supervision, quality review, process performance and raw material and product testing);
• Supplier management;
• Risk management and management of opportunities;
• Release of products into circulation.
Quality management system processes are implemented, depending on their suitability, in all key and supporting processes.
ASSESSMENT OF THE HEALTH AND SAFETY IMPACTS OF PRODUCT AND SERVICE CATEGORIES
At JGL, drugs are produced in accordance with GMP and GDP requirements, medical devices in accordance with the requirements of the ISO 13485 standard, nutritional supplements and food for special medical purposes in accordance with the ISO 22000 standard, and cosmetics in accordance with the ISO 22716 standard. The products also meet other applicable regulatory requirements and requirements of the profession.
416-
1
In the reporting period, assessment were made to improve impacts on health and safety for all product categories (100 percent).
Drugs
• Medicinal Products Act (Official Gazette No. 76/13)
• Act on Amendments to the Medicinal Products Act (Official Gazette No. 90/14)
• Ordinance on Granting Marketing Authorisations for Medicinal Products (Official Gazette No. 83/13)
• Ordinance on Pharmacovigilance (Official Gazette No. 83/13)
• Guideline on Good Pharmacovigilance (GVP)
• Ordinance on Benchmarks for the Classification of Medicinal Products and on the Prescription and Dispensing of Prescription Medicinal Products (Official Gazette No. 86/13)
• Ordinance on Essential Requirements, Classification, Registration of Manufacturers in the Register of Medical Device Manufacturers, Registration of Medical Devices in the Register of Medical Devices and Conformity Assessment of Medical Devices (Official Gazette No. 84/13)
• Ordinance on the Quality Control of Medicinal Products (Official Gazette No. 60/14)
• Ordinance on the Conditions for Granting Permits to Specialised Retail Sales Outlets of Medicinal Products (Official Gazette No. 122/14)
• Ordinance on the Suspension of the Placement on and Withdrawal of Medicinal Products from the Market (Official Gazette No. 122/14)
• Ordinance on Clinical Trials on Medicinal Products and on Good Clinical Practice (Official Gazette No. 25/15)
• Ordinance on the Manner of Advertising Medicinal Products (Official Gazette No. 43/15)

60
• Ordinance on the Marketing, Labelling and Advertising of Traditional Herbal Medicinal Products (Official Gazette No. 89/10)
Cosmetics
• Regulation (EC) No 1223/2009 of the European Parliament and of the Council of 30 November 2009 on cosmetic products
• Commission Regulation (EU) No 655/2013 of 10 July 2013 laying down common criteria for the justification of claims used in relation to cosmetic products
Food supplements
• Ordinance on Dietary Supplements, OG 126/13
• Decision on declaring the Law on Nutrition and Health Claims, and Foods Enriched with Nutrients, OG 39/13
• Ordinance on substances that may be added to the food and used in the manufacture of food and substances whose use is prohibited or restricted, OG 160/13
• Act on Informing the Consumer about Food, OG 56/13; 56/16
• Ordinance on Informing the Consumer about Food, OG 8/13
• ISO 22000: 2005
Medical devices
• Medical Devices Act, OG 76/13
• Ordinance on Essential Requirements, Classification, Registration of Manufacturers in the Register of Medical Device Manufacturers, Registration of Medical Devices in the Register of Medical Devices and Conformity Assessment of Medical Devices, OG 84/13
Ordinance on Monitoring Adverse Incidents Related to Medical Device, OG 125/13
• ISO 13485: 2012
• EN ISO 15223-1: 2012
• EN 1041:2008+A1 2013
Although drugs approved for the market are safe for use and of the appropriate quality, side effects may occur, even with the use of over-the-counter drugs. Therefore, the Agency for Medicinal Products and Medical Devices of Croatia (HALMED) continually invites healthcare professionals and patients to report any suspected side effects of drugs and thus actively contribute to the monitoring and maintaining of drug safety. Authorisation holders continually monitor any updates regarding the safety of use in order to implement them in their system in a timely manner and to include new information in the patient information leaflet so that patients have all of the relevant and current information at their disposal.
Patients should inform their doctor, pharmacist or other healthcare workers they come into contact with about all suspicions of drug and vaccine side effects. Also, any suspicions of side effects can be reported directly to HALMED:
• 2018 – 215: serious (116), non-serious (97)
• 2017 – 180: serious (99), non-serious (81)
• 2016 – 107: serious (34), non-serious (73)
• 2015 – 68: serious (10), non-serious (58)
• 2014 – 48: serious (12), non-serious (36)
• 2013 – 19: serious (5), non-serious (14)
The number of reported side effects is increasing due to the improvement of the pharmacovigilance system in the Republic of Croatia, HALMED’s educational activities, and the connection with the Poison Centre, which provides information about reported side effects and drug overdoses.
The principle of continuous improvement is the key element of JGL’s management, development and success. Management ensures continuous improvement of the quality system efficiency through the use of communication, system evaluation by management, auditors, validation and verification activities, risk management and corrective and preventive procedures.

61
OPINION OF THE COMMISSION OF THE MANAGEMENT BOARD OF BCSD CROATIA

62
OPINION OF THE COMMISSION OF THE MANAGEMENT BOARD OF BCSD CROATIA ON JGL D.D.’S SUSTAINABILITY REPORT FOR 2018
The Commission of the Management Board of BCSD Croatia has analysed JGL d.d.’s Sustainability Report for 2018 and concluded that it includes key requirements of the Global Reporting Initiative (GRI) Standards, and confirmed the compliance of the Report with GRI Standards – Core option. Just like last year, the Commission has expressed a positive opinion of JGL’s extremely detailed approach to reporting in accordance with GRI 103 – Management Approach, a standard that requires an organisation’s detailed approach to the management of its material topics.
This year’s report is once again outstanding, drawing attention already with its carefully structured appearance, as well as pictures connected with the topics. The text is well-organised, easy to read, and clear.
It is commendable that the report refers to sustainable development goals at its very beginning. However, the report lacks a clearer connection and arguments for the selection of particular goals to which JGL pays special attention.
The following part contains information in accordance with the requirements of GRI 102 – General Disclosures. The section begins with a statement by Ivo Usmiani, President of JGL’s Board of Directors, and continues with Disclosure 102-15 – Key impacts, risks, and opportunities. The Commission suggests that JGL add more topics related to sustainability in both disclosures, to evaluate and present key sustainability risks arising from business activities, and to describe the possibilities to manage these risks in order to reduce or eliminate them. The term “impact” in a sustainability report always refers to the company’s environmental and social impacts, unless otherwise specified.
The following part is an overview of technical information, including information on the supply chain. The Commission holds that there is room for improvement in integrating sustainability principles into the supplier
selection and evaluation process to a greater degree, i.e. in describing this process in more detail in the report.
The disclosures that follow are topic-specific and supplemented with disclosures and requirements under GRI 103 – Management Approach, in a way that the management approach and method are described in detail for each standard or each selected material topic. This detailed and consistent approach to reporting based on GRI requirements is outstanding and offers a very clear picture of the way in which the company deals with its non-financial impacts, which is why we would once again like to commend JGL for taking this approach in its report.
Specific disclosures for selected material topics provide information about JGL’s exceptional business performance in the previous year, and it is worth noting that the average salary of JGL employees in all countries where it operates is significantly higher than the general average salary in those countries.
The focus of environmental topics is placed on energy consumption and emissions of greenhouse gases, providing more information about the range of measures that JGL takes to reduce energy consumption. This includes the introduction of LED lighting, heat recuperation, roof replacement, and the installation of solar panels. All these activities speak to the company’s serious commitment to the management of energy consumption.
Responsible management is also evident in disclosures related to water and effluents. Although an increase in production and the opening of a new production site led to a slight increase in water consumption, clean water from facilities and rainwater are being recycled and used to water green areas.
With regard to information about waste, it would be interesting to learn which type of waste caused an increase in waste production, and the methods for disposal of the produced hazardous and non-hazardous waste.

63
The category of social topics included solely good news. Occupational health and safety, education and training systems have been established at a very high level. Additional causes for satisfaction include the salary ratio and other work conditions of women in relation to men, and women’s participation in the organisation’s governance.
Based on the information provided, the Commission believes the report has shown that this is an exceptional company with outstanding results and products that meet even the highest standards, as shown by the share of exports in company revenue. Being familiar with JGL’s reports over the past ten years and more, we have witnessed an extraordinary progress, and the above-mentioned elements of reporting on the management approach represent the very best in approaches to reporting, at least in Croatia. There is always room for improvement, and some of the elements for possible improvement have been touched upon in this opinion, but this is undoubtedly an exceptional report that includes information about the exceptional results of one of the leading companies in Croatia. Therefore, we would like to congratulate and thank JGL for the great effort invested in the processes shown in this report and in the development of the report itself.
Commission of the Management Board of BCSD Croatia

SUSTAINABLE DEVELOPMENT REPORT FOR 2018