sdg progress child and youth (4)
TRANSCRIPT

PROGRESS AGAINST SDGS FOR CHILD AND YOUTH WELL-BEING
Priority ratings Data sources
No data (SDG rating);
inconsistencies across sources Black font & SDG progress ratings UNICEF, 2018. Progress for Every Child in the SDGs Era Dashboard
Insufficient data trend (SDG rating) Italic font in black International Policy Centre for Inclusive Growth & UNICEF, 2019. Social Protection Inventory
Acceleration needed (SDG rating) Pink font in bold Cook Islands Family Health and Safety Study, 2014
On track (SDG rating) Black font in bold Pacific Data Hub
Target met (SDG rating) Green font in bold Global Student Health Survey (GSHS)
Worse than global average; issue of
concern Blue font in bold Cook Islands Ministry of Education Statistics Report 2018 - 2019
Every child survives
and thrives
Progress Every child learnsCompulsory for 5 - 16
years
Progress Every child is protected from violence
& exploitation
Progress Every child lives in a clean
and safe environment
Progress Every child has a fair
chance in life
Progress Adolescence and youth Progress
Prevalence of overweight
among schoolage children
(%) (13 - 15 yrs)
Obesity
63.7
35.5
Primary Net Enrolment Rate
(2019) (m/f)
100/100 Proportion of children aged 1 - 14 who have
experienced physical punishment and/or
psychological agression by caregivers in the past
month (%)
Schools wth basic handwashing
facilities (%)
100.00 Children living below the
national poverty line (%)
Adolescent fertility rate (women aged 15 -
19 years)
47.00
Prevalence of stunting among
children under 5 (%)
Secondary Net Enrolment
Rate (2019) (m/f)
72/76 Proportion of women aged 20 - 24 years who
were married before age 18 (%)
Proportion of the population
using basic sanitation services (%)
97.63 Children living in households
in extreme poverty (%)
Harmful use of alcohol, m/f aged 15+/18+
(litres of pure alcohol/capita)
% of students (13 - 15 yrs) who have
ever had a drink of alcohol before 14 yrs
10.6
18/4
61.6
Prevalence of wasting among
children under 5 (%)
Proportion children at the
lower end of secondary (Year
8) achieving at least a
minimum proficiency level in
mathematics (%)
40 (target 81) Proportion of women and girls aged 15 - 19
subjected to physical violence from non-
partners (%)
% of women aged 15 - 19 years reporting
injuries as a result of physcial or sexual partner
violence
34.9
50 (ever
injured)
Proportion of the population
using basic drinking water
services (%)
Schools with access to basic
drinking water (%)
99.88
100
Proportion of child
population covered by social
protection floors/systems (%)
Current tobacco smoking, adults aged 15+
(%) m/f
% of students (13 - 15 yrs) who currently
smoke cigarettes on 1+ days during the
past 30 days
26.6
30/21
18
Proportion of births attended
by skilled health personel (%)
Maternal Mortality ratio
100
0
Proportion children at the
lower end of secondary (Year
8) achieving at least a
minimum proficiency level in
Māori literacy (%) (m/f)
46/52 Students aged 13 - 15 years reporting bullying
(1+ times) or physical fights (1+) within the
previous 12 months (%)
31/31 Proportion of the population
practicing open defecation (%)
1.12 Obesity, adolescents aged 10 -19 (%) m/f 32/29
Neonatal mortality rate
(deaths per 1,000 live births)
IMR
4.1
6.7
Out-of-school rate for
children of primary school
age, both sexes (%)
0.80 Proportion and number of children aged 5 - 17
years engaged in child labour (%)
0.00 % of students who actually attempted
suicide 1 or more times during the past 12
months
13.00
Proportion of the population
covered by all vaccines
included in their national
programme - DPT3 (%)
99.00 Out-of-school rate for
adolescents and youth of
lower and upper secondary
school age, both sexes (%)
14.28 Proportion of ever-partnered women and girls
aged 15 - 19 years subjected to physical, sexual
or psychological violence by a currrent or
former intimate partner
6.00 Youth unemployment rate
Adult unemployment rate
NEET rate (15 - 24 year olds)
18.3 (15.6m,15.3f)
8.2
17.5
Proportion of the population
covered by all vaccines
included in their national
programme - MCV1 (%)
98.00 ECE NER (2019) (m/f) 88/81 Proportion of children under 5 years whose
births have been registered with a civil authority
(%)
100.00 GER data for tertiary education 59.70
Non-contributory programmes reaching at-risk
children and youth: 4/8
Caregiver allowance; Child benefit; Newborn
allowance; Destitute and infirm benefits (for
PWD)
Cook Islands
Population share
(0 - 17 years):
36% (2016)
Priority child and youth development issues:
High prevalence of overweight & obesity
among school age children
Data on child nutrition
Access to secondary education (school
drop-outs)
Quality of education
Student bullying
Violence against women and girls
Data collection for child protection
Acceleration needed on access to
basic sanitation services
Data on social protection for children
& youth
Teenage pregnancy (= global av.)
Harmful alcohol consumption
Tobacco smoking
Adolescent mental health/youth
suicide
Youth unemployment (NEET focus)
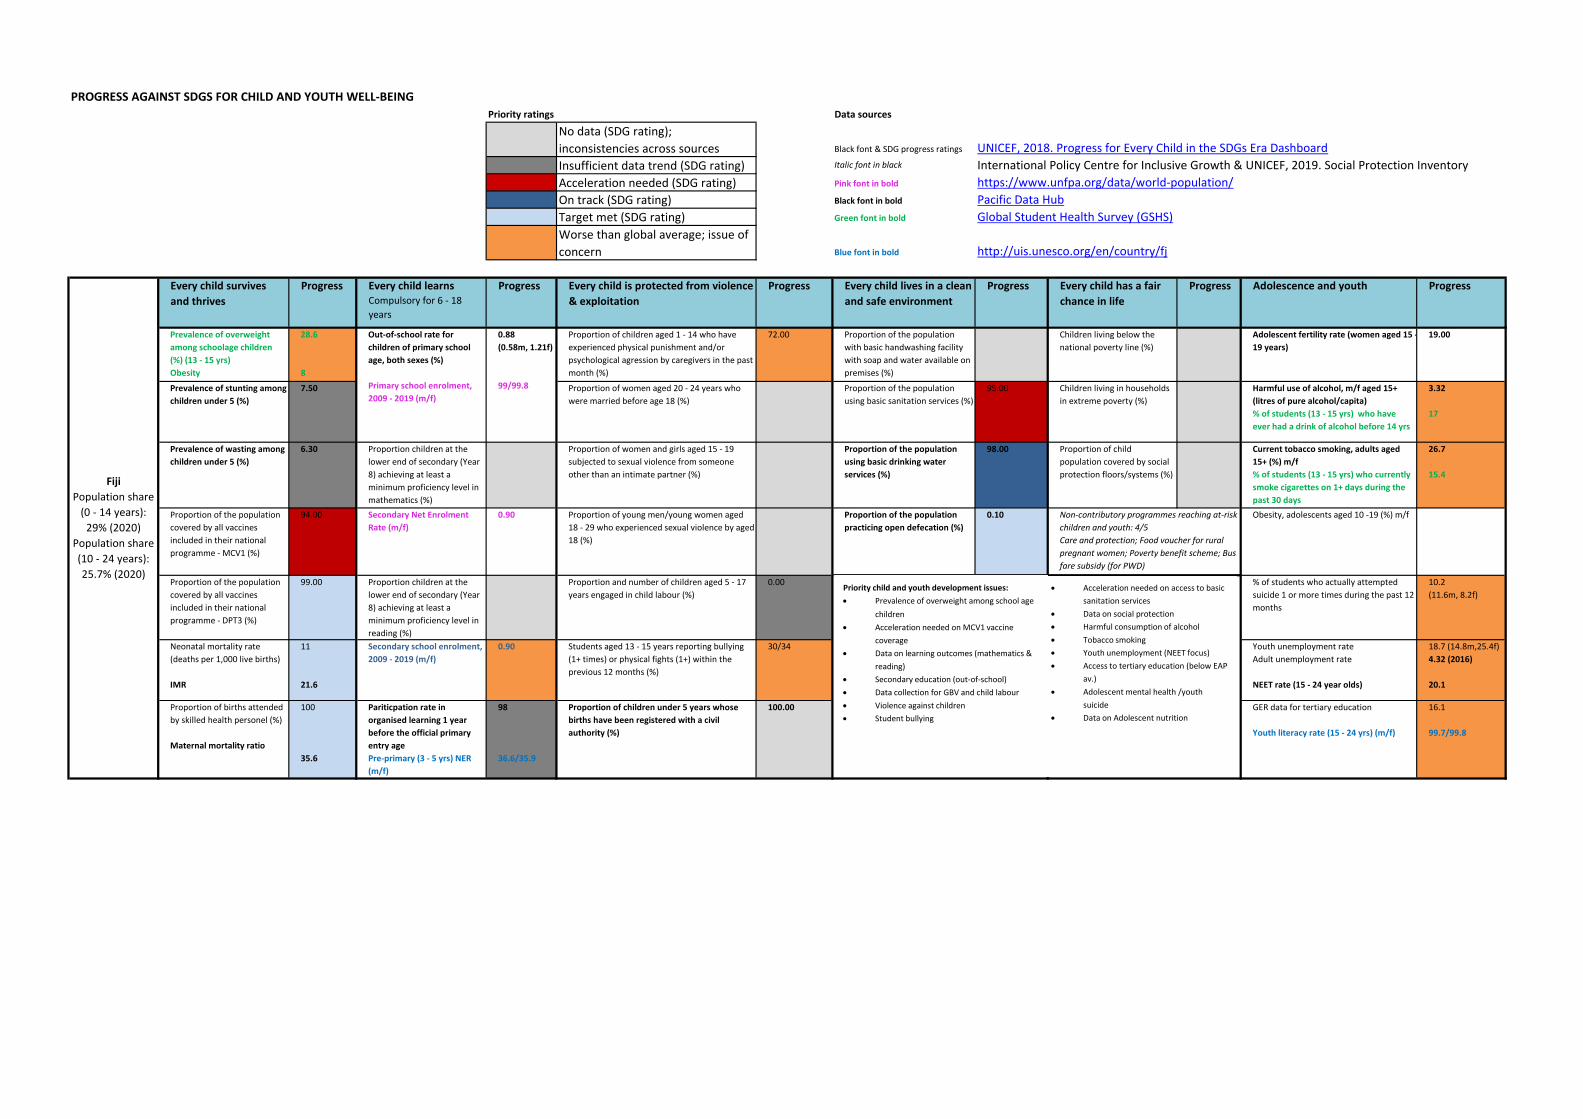
PROGRESS AGAINST SDGS FOR CHILD AND YOUTH WELL-BEING
Priority ratings Data sources
No data (SDG rating);
inconsistencies across sources Black font & SDG progress ratings UNICEF, 2018. Progress for Every Child in the SDGs Era Dashboard
Insufficient data trend (SDG rating) Italic font in black International Policy Centre for Inclusive Growth & UNICEF, 2019. Social Protection Inventory
Acceleration needed (SDG rating) Pink font in bold https://www.unfpa.org/data/world-population/
On track (SDG rating) Black font in bold Pacific Data Hub
Target met (SDG rating) Green font in bold Global Student Health Survey (GSHS)
Worse than global average; issue of
concern Blue font in bold http://uis.unesco.org/en/country/fj
Every child survives
and thrives
Progress Every child learnsCompulsory for 6 - 18
years
Progress Every child is protected from violence
& exploitation
Progress Every child lives in a clean
and safe environment
Progress Every child has a fair
chance in life
Progress Adolescence and youth Progress
Prevalence of overweight
among schoolage children
(%) (13 - 15 yrs)
Obesity
28.6
8
Proportion of children aged 1 - 14 who have
experienced physical punishment and/or
psychological agression by caregivers in the past
month (%)
72.00 Proportion of the population
with basic handwashing facility
with soap and water available on
premises (%)
Children living below the
national poverty line (%)
Adolescent fertility rate (women aged 15 -
19 years)
19.00
Prevalence of stunting among
children under 5 (%)
7.50 Proportion of women aged 20 - 24 years who
were married before age 18 (%)
Proportion of the population
using basic sanitation services (%)
95.00 Children living in households
in extreme poverty (%)
Harmful use of alcohol, m/f aged 15+
(litres of pure alcohol/capita)
% of students (13 - 15 yrs) who have
ever had a drink of alcohol before 14 yrs
3.32
17
Prevalence of wasting among
children under 5 (%)
6.30 Proportion children at the
lower end of secondary (Year
8) achieving at least a
minimum proficiency level in
mathematics (%)
Proportion of women and girls aged 15 - 19
subjected to sexual violence from someone
other than an intimate partner (%)
Proportion of the population
using basic drinking water
services (%)
98.00 Proportion of child
population covered by social
protection floors/systems (%)
Current tobacco smoking, adults aged
15+ (%) m/f
% of students (13 - 15 yrs) who currently
smoke cigarettes on 1+ days during the
past 30 days
26.7
15.4
Proportion of the population
covered by all vaccines
included in their national
programme - MCV1 (%)
94.00 Secondary Net Enrolment
Rate (m/f)
0.90 Proportion of young men/young women aged
18 - 29 who experienced sexual violence by aged
18 (%)
Proportion of the population
practicing open defecation (%)
0.10 Obesity, adolescents aged 10 -19 (%) m/f
Proportion of the population
covered by all vaccines
included in their national
programme - DPT3 (%)
99.00 Proportion children at the
lower end of secondary (Year
8) achieving at least a
minimum proficiency level in
reading (%)
Proportion and number of children aged 5 - 17
years engaged in child labour (%)
0.00 % of students who actually attempted
suicide 1 or more times during the past 12
months
10.2
(11.6m, 8.2f)
Neonatal mortality rate
(deaths per 1,000 live births)
IMR
11
21.6
Secondary school enrolment,
2009 - 2019 (m/f)
0.90 Students aged 13 - 15 years reporting bullying
(1+ times) or physical fights (1+) within the
previous 12 months (%)
30/34 Youth unemployment rate
Adult unemployment rate
NEET rate (15 - 24 year olds)
18.7 (14.8m,25.4f)
4.32 (2016)
20.1
Proportion of births attended
by skilled health personel (%)
Maternal mortality ratio
100
35.6
Pariticpation rate in
organised learning 1 year
before the official primary
entry age
Pre-primary (3 - 5 yrs) NER
(m/f)
98
36.6/35.9
Proportion of children under 5 years whose
births have been registered with a civil
authority (%)
100.00 GER data for tertiary education
Youth literacy rate (15 - 24 yrs) (m/f)
16.1
99.7/99.8
Out-of-school rate for
children of primary school
age, both sexes (%)
Primary school enrolment,
2009 - 2019 (m/f)
0.88
(0.58m, 1.21f)
99/99.8
Fiji
Population share
(0 - 14 years):
29% (2020)
Population share
(10 - 24 years):
25.7% (2020)
Non-contributory programmes reaching at-risk
children and youth: 4/5
Care and protection; Food voucher for rural
pregnant women; Poverty benefit scheme; Bus
fare subsidy (for PWD)
Priority child and youth development issues:
Prevalence of overweight among school age
children
Acceleration needed on MCV1 vaccine
coverage
Data on learning outcomes (mathematics &
reading)
Secondary education (out-of-school)
Data collection for GBV and child labour
Violence against children
Student bullying
Acceleration needed on access to basic
sanitation services
Data on social protection
Harmful consumption of alcohol
Tobacco smoking
Youth unemployment (NEET focus)
Access to tertiary education (below EAP
av.)
Adolescent mental health /youth
suicide
Data on Adolescent nutrition
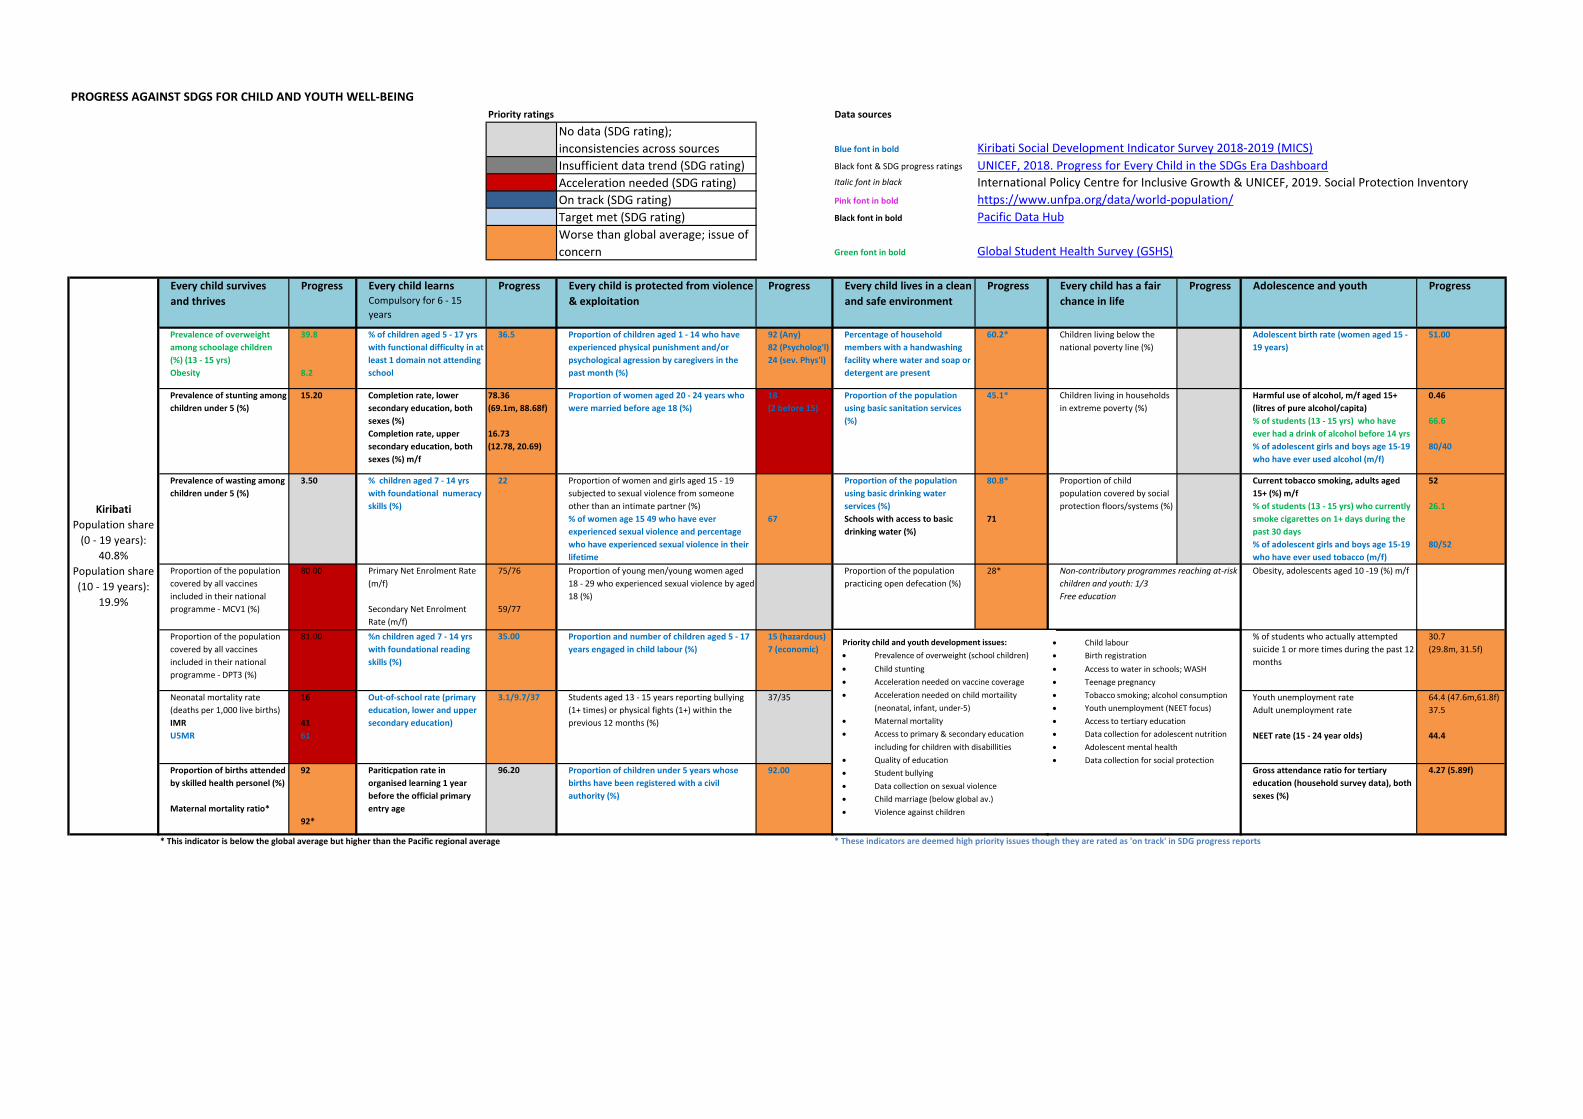
PROGRESS AGAINST SDGS FOR CHILD AND YOUTH WELL-BEING
Priority ratings Data sources
No data (SDG rating);
inconsistencies across sources Blue font in bold Kiribati Social Development Indicator Survey 2018-2019 (MICS)
Insufficient data trend (SDG rating) Black font & SDG progress ratings UNICEF, 2018. Progress for Every Child in the SDGs Era Dashboard
Acceleration needed (SDG rating) Italic font in black International Policy Centre for Inclusive Growth & UNICEF, 2019. Social Protection Inventory
On track (SDG rating) Pink font in bold https://www.unfpa.org/data/world-population/
Target met (SDG rating) Black font in bold Pacific Data Hub
Worse than global average; issue of
concern Green font in bold Global Student Health Survey (GSHS)
Every child survives
and thrives
Progress Every child learnsCompulsory for 6 - 15
years
Progress Every child is protected from violence
& exploitation
Progress Every child lives in a clean
and safe environment
Progress Every child has a fair
chance in life
Progress Adolescence and youth Progress
Prevalence of overweight
among schoolage children
(%) (13 - 15 yrs)
Obesity
39.8
8.2
% of children aged 5 - 17 yrs
with functional difficulty in at
least 1 domain not attending
school
36.5 Proportion of children aged 1 - 14 who have
experienced physical punishment and/or
psychological agression by caregivers in the
past month (%)
92 (Any)
82 (Psycholog'l)
24 (sev. Phys'l)
Percentage of household
members with a handwashing
facility where water and soap or
detergent are present
60.2* Children living below the
national poverty line (%)
Adolescent birth rate (women aged 15 -
19 years)
51.00
Prevalence of stunting among
children under 5 (%)
15.20 Completion rate, lower
secondary education, both
sexes (%)
Completion rate, upper
secondary education, both
sexes (%) m/f
78.36
(69.1m, 88.68f)
16.73
(12.78, 20.69)
Proportion of women aged 20 - 24 years who
were married before age 18 (%)
18
(2 before 15)
Proportion of the population
using basic sanitation services
(%)
45.1* Children living in households
in extreme poverty (%)
Harmful use of alcohol, m/f aged 15+
(litres of pure alcohol/capita)
% of students (13 - 15 yrs) who have
ever had a drink of alcohol before 14 yrs
% of adolescent girls and boys age 15-19
who have ever used alcohol (m/f)
0.46
66.6
80/40
Prevalence of wasting among
children under 5 (%)
3.50 % children aged 7 - 14 yrs
with foundational numeracy
skills (%)
22 Proportion of women and girls aged 15 - 19
subjected to sexual violence from someone
other than an intimate partner (%)
% of women age 15 49 who have ever
experienced sexual violence and percentage
who have experienced sexual violence in their
lifetime
67
Proportion of the population
using basic drinking water
services (%)
Schools with access to basic
drinking water (%)
80.8*
71
Proportion of child
population covered by social
protection floors/systems (%)
Current tobacco smoking, adults aged
15+ (%) m/f
% of students (13 - 15 yrs) who currently
smoke cigarettes on 1+ days during the
past 30 days
% of adolescent girls and boys age 15-19
who have ever used tobacco (m/f)
52
26.1
80/52
Proportion of the population
covered by all vaccines
included in their national
programme - MCV1 (%)
80.00 Primary Net Enrolment Rate
(m/f)
Secondary Net Enrolment
Rate (m/f)
75/76
59/77
Proportion of young men/young women aged
18 - 29 who experienced sexual violence by aged
18 (%)
Proportion of the population
practicing open defecation (%)
28* Obesity, adolescents aged 10 -19 (%) m/f
Proportion of the population
covered by all vaccines
included in their national
programme - DPT3 (%)
81.00 %n children aged 7 - 14 yrs
with foundational reading
skills (%)
35.00 Proportion and number of children aged 5 - 17
years engaged in child labour (%)
15 (hazardous)
7 (economic)
% of students who actually attempted
suicide 1 or more times during the past 12
months
30.7
(29.8m, 31.5f)
Neonatal mortality rate
(deaths per 1,000 live births)
IMR
U5MR
16
41
61
Out-of-school rate (primary
education, lower and upper
secondary education)
3.1/9.7/37 Students aged 13 - 15 years reporting bullying
(1+ times) or physical fights (1+) within the
previous 12 months (%)
37/35 Youth unemployment rate
Adult unemployment rate
NEET rate (15 - 24 year olds)
64.4 (47.6m,61.8f)
37.5
44.4
Proportion of births attended
by skilled health personel (%)
Maternal mortality ratio*
92
92*
Pariticpation rate in
organised learning 1 year
before the official primary
entry age
96.20 Proportion of children under 5 years whose
births have been registered with a civil
authority (%)
92.00 Gross attendance ratio for tertiary
education (household survey data), both
sexes (%)
4.27 (5.89f)
* These indicators are deemed high priority issues though they are rated as 'on track' in SDG progress reports
Kiribati
Population share
(0 - 19 years):
40.8%
Population share
(10 - 19 years):
19.9%
* This indicator is below the global average but higher than the Pacific regional average
Non-contributory programmes reaching at-risk
children and youth: 1/3
Free education
Priority child and youth development issues:
Prevalence of overweight (school children)
Child stunting
Acceleration needed on vaccine coverage
Acceleration needed on child mortaility
(neonatal, infant, under-5)
Maternal mortality
Access to primary & secondary education
including for children with disabillities
Quality of education
Student bullying
Data collection on sexual violence
Child marriage (below global av.)
Violence against children
Child labour
Birth registration
Access to water in schools; WASH
Teenage pregnancy
Tobacco smoking; alcohol consumption
Youth unemployment (NEET focus)
Access to tertiary education
Data collection for adolescent nutrition
Adolescent mental health
Data collection for social protection
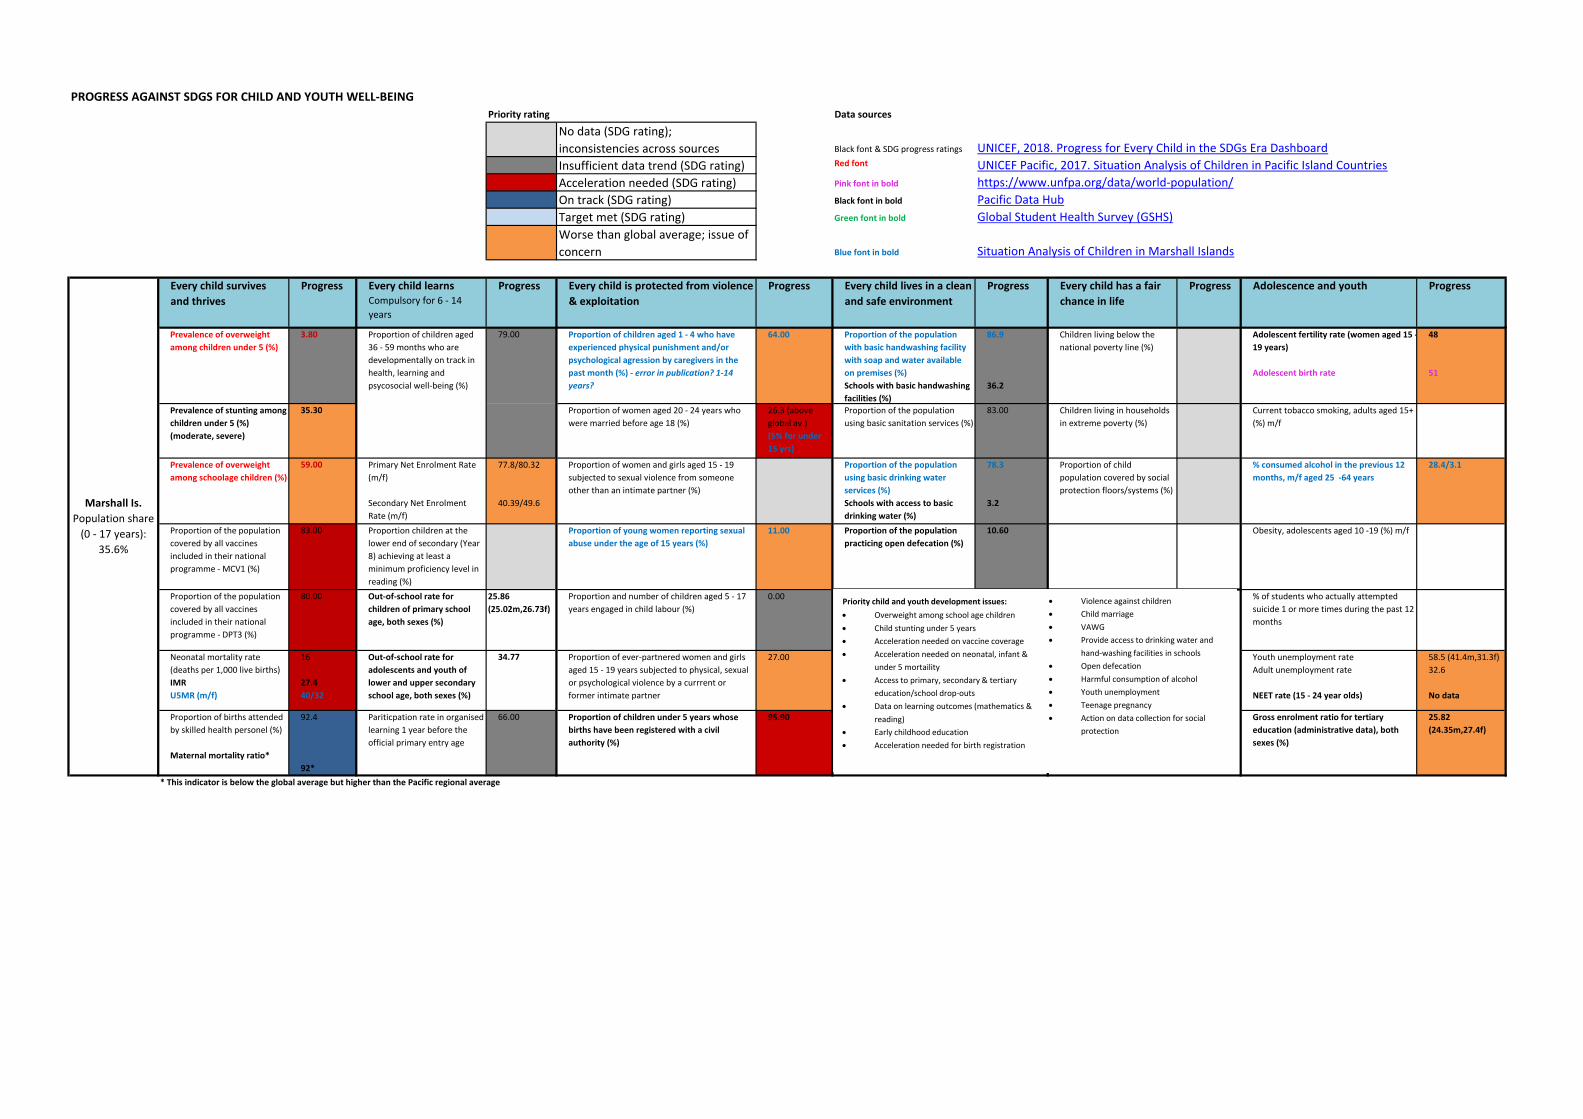
PROGRESS AGAINST SDGS FOR CHILD AND YOUTH WELL-BEING
Priority rating Data sources
No data (SDG rating);
inconsistencies across sources Black font & SDG progress ratings UNICEF, 2018. Progress for Every Child in the SDGs Era Dashboard
Insufficient data trend (SDG rating) Red font UNICEF Pacific, 2017. Situation Analysis of Children in Pacific Island Countries
Acceleration needed (SDG rating) Pink font in bold https://www.unfpa.org/data/world-population/
On track (SDG rating) Black font in bold Pacific Data Hub
Target met (SDG rating) Green font in bold Global Student Health Survey (GSHS)
Worse than global average; issue of
concern Blue font in bold Situation Analysis of Children in Marshall Islands
Every child survives
and thrives
Progress Every child learnsCompulsory for 6 - 14
years
Progress Every child is protected from violence
& exploitation
Progress Every child lives in a clean
and safe environment
Progress Every child has a fair
chance in life
Progress Adolescence and youth Progress
Prevalence of overweight
among children under 5 (%)
3.80 Proportion of children aged 1 - 4 who have
experienced physical punishment and/or
psychological agression by caregivers in the
past month (%) - error in publication? 1-14
years?
64.00 Proportion of the population
with basic handwashing facility
with soap and water available
on premises (%)
Schools with basic handwashing
facilities (%)
86.9
36.2
Children living below the
national poverty line (%)
Adolescent fertility rate (women aged 15 -
19 years)
Adolescent birth rate
48
51
Prevalence of stunting among
children under 5 (%)
(moderate, severe)
35.30 Proportion of women aged 20 - 24 years who
were married before age 18 (%)
26.3 (above
global av.)
(5% for under
15 yrs)
Proportion of the population
using basic sanitation services (%)
83.00 Children living in households
in extreme poverty (%)
Current tobacco smoking, adults aged 15+
(%) m/f
Prevalence of overweight
among schoolage children (%)
59.00 Primary Net Enrolment Rate
(m/f)
Secondary Net Enrolment
Rate (m/f)
77.8/80.32
40.39/49.6
Proportion of women and girls aged 15 - 19
subjected to sexual violence from someone
other than an intimate partner (%)
Proportion of the population
using basic drinking water
services (%)
Schools with access to basic
drinking water (%)
78.3
3.2
Proportion of child
population covered by social
protection floors/systems (%)
% consumed alcohol in the previous 12
months, m/f aged 25 -64 years
28.4/3.1
Proportion of the population
covered by all vaccines
included in their national
programme - MCV1 (%)
83.00 Proportion children at the
lower end of secondary (Year
8) achieving at least a
minimum proficiency level in
reading (%)
Proportion of young women reporting sexual
abuse under the age of 15 years (%)
11.00 Proportion of the population
practicing open defecation (%)
10.60 Obesity, adolescents aged 10 -19 (%) m/f
Proportion of the population
covered by all vaccines
included in their national
programme - DPT3 (%)
80.00 Out-of-school rate for
children of primary school
age, both sexes (%)
25.86
(25.02m,26.73f)
Proportion and number of children aged 5 - 17
years engaged in child labour (%)
0.00 % of students who actually attempted
suicide 1 or more times during the past 12
months
Neonatal mortality rate
(deaths per 1,000 live births)
IMR
U5MR (m/f)
16
27.4
40/32
Out-of-school rate for
adolescents and youth of
lower and upper secondary
school age, both sexes (%)
34.77 Proportion of ever-partnered women and girls
aged 15 - 19 years subjected to physical, sexual
or psychological violence by a currrent or
former intimate partner
27.00 Youth unemployment rate
Adult unemployment rate
NEET rate (15 - 24 year olds)
58.5 (41.4m,31.3f)
32.6
No data
Proportion of births attended
by skilled health personel (%)
Maternal mortality ratio*
92.4
92*
Pariticpation rate in organised
learning 1 year before the
official primary entry age
66.00 Proportion of children under 5 years whose
births have been registered with a civil
authority (%)
95.90 Gross enrolment ratio for tertiary
education (administrative data), both
sexes (%)
25.82
(24.35m,27.4f)
Proportion of children aged
36 - 59 months who are
developmentally on track in
health, learning and
psycosocial well-being (%)
79.00
Marshall Is.
Population share
(0 - 17 years):
35.6%
* This indicator is below the global average but higher than the Pacific regional average
Priority child and youth development issues:
Overweight among school age children
Child stunting under 5 years
Acceleration needed on vaccine coverage
Acceleration needed on neonatal, infant &
under 5 mortaility
Access to primary, secondary & tertiary
education/school drop-outs
Data on learning outcomes (mathematics &
reading)
Early childhood education
Acceleration needed for birth registration
Violence against children
Child marriage
VAWG
Provide access to drinking water and
hand-washing facilities in schools
Open defecation
Harmful consumption of alcohol
Youth unemployment
Teenage pregnancy
Action on data collection for social
protection

PROGRESS AGAINST SDGS FOR CHILD AND YOUTH WELL-BEING
Priority rating Data sources
No data (SDG rating);
inconsistencies across sources Black font & SDG progress ratings UNICEF, 2018. Progress for Every Child in the SDGs Era Dashboard
Insufficient data trend (SDG rating) Red font UNICEF Pacific, 2017. Situation Analysis of Children in Pacific Island Countries
Acceleration needed (SDG rating) Pink font in bold https://www.unfpa.org/data/world-population/
On track (SDG rating) Black font in bold Pacific Data Hub
Target met (SDG rating) Green font in bold Global Student Health Survey (GSHS)
Worse than global average; issue of
concern Blue font in bold FSM Department of Education: Education Indicators, August 2019
Every child survives
and thrives
Progress Every child learnsCompulsory for 6 - 14
years
Progress Every child is protected from violence
& exploitation
Progress Every child lives in a clean
and safe environment
Progress Every child has a fair
chance in life
Progress Adolescence and youth Progress
Prevalence of overweight
among schoolage children
(%)
51.00 Proportion of children aged 1 - 14 who have
experienced physical punishment and/or
psychological agression by caregivers in the
past month (%)
37.00 Proportion of the population
with basic handwashing facility
with soap and water available on
premises (%)
Children living below the
national poverty line (%)
Adolescent fertility rate (women aged 15 -
19 years)
41.00
Prevalence of stunting among
children under 5 (%)
Proportion of women aged 20 - 24 years who
were married before age 18 (%)
Proportion of the population
using basic sanitation services (%)
88.00 Children living in households
in extreme poverty (%)
Harmful use of alcohol, m/f aged 15+
(litres of pure alcohol/capita)
2.48
Prevalence of wasting among
children under 5 (%)
Proportion children at the
lower end of secondary (Year
8) achieving at least a
minimum proficiency level in
mathematics (%)
19 (target 30) Proportion of women and girls aged 15 - 19
subjected to sexual violence from someone
other than an intimate partner (%)
Proportion of the population
using basic drinking water
services (%)
85.70 Proportion of child
population covered by social
protection floors/systems (%)
Current tobacco smoking, adults aged 15+
(%) m/f
Proportion of the population
covered by all vaccines
included in their national
programme - MCV1 (%)
76.00 Proportion children at the
lower end of secondary (Year
8) achieving at least a
minimum proficiency level in
reading (%)
31 (target 43) Proportion of young men/young women aged
18 - 29 who experienced sexual violence by aged
18 (%)
Proportion of the population
practicing open defecation (%)
9.57 Obesity, adolescents aged 10 -19 (%) m/f
Proportion of the population
covered by all vaccines
included in their national
programme - DPT3 (%)
73.00 Out-of-school rate for
children of primary school
age, both sexes (%)
10.33
(9.38m,11.31f)
Proportion and number of children aged 5 - 17
years engaged in child labour (%)
0.00 % of students who actually attempted
suicide 1 or more times during the past 12
months
Neonatal mortality rate
(deaths per 1,000 live
births)**
IMR
17 (equal to
global av.)
25.6
Primary Net Enrolment Rate
(2019) (m/f)
82/83 Proportion of ever-partnered women and girls
aged 15 - 19 years subjected to physical, sexual
or psychological violence by a currrent or
former intimate partner
35.00 Youth unemployment rate
Adult unemployment rate
NEET rate (15 - 24 year olds)
25.3 (50m,50f)
10.6
32.2
Proportion of births attended
by skilled health personel (%)
Maternal mortality ratio*
100
88*
ECE NER (2019) (m/f) 65/59 Proportion of children under 5 years whose
births have been registered with a civil authority
(%)
GER data for tertiary education
* This indicator is below the global average but higher than the Pacific regional average
** The NMR indicator is deemed a high priority issue, being equal to the global average, though it is rated as 'on track' in SDG progress reports
Secondary Net Enrolment
Rate (2019) (m/f)
Federated States
of Micronesia
Population share
(0 - 19 years):
40.9%
Population share
(10 - 19 years):
23.8%
46/56
Priority child and youth development issues:
Overweight amongst schoolage children
Data collection on child nutrition
Neonatal mortality (equal to global av.)
Vaccine coverage - acceleration required
Maternal mortality
Early childhood education
Access to primary and secondary education
Quality of lower secondary education
(mathematics & reading)
Data collection on child protection
Acceleration needed on access to
basic sanitation services
Violence against women and girls
Open defecation
Data on social protection
Data on youth risk behaviour and
mental health
Youth unemployment (NEET focus)
Data on tertiary education enrolment
PROGRESS AGAINST SDGS FOR CHILD AND YOUTH WELL-BEING
Priority rating Data sources
No data (SDG rating);
inconsistencies across sources Black font & SDG progress ratings UNICEF, 2018. Progress for Every Child in the SDGs Era Dashboard
Insufficient data trend (SDG rating) Red font UNICEF Pacific, 2017. Situation Analysis of Children in Pacific Island Countries
Acceleration needed (SDG rating) Blue font in bold http://uis.unesco.org/en/country/nr
On track (SDG rating) Black font in bold Pacific Data Hub
Target met (SDG rating) Green font in bold Global Student Health Survey (GSHS)
Worse than global average; issue of
concern Italic font in black International Policy Centre for Inclusive Growth & UNICEF, 2019. Social Protection Inventory
Every child survives
and thrives
Progress Every child learnsCompulsory for 6 - 16
years
Progress Every child is protected from violence
& exploitation
Progress Every child lives in a clean
and safe environment
Progress Every child has a fair
chance in life
Progress Adolescence and youth Progress
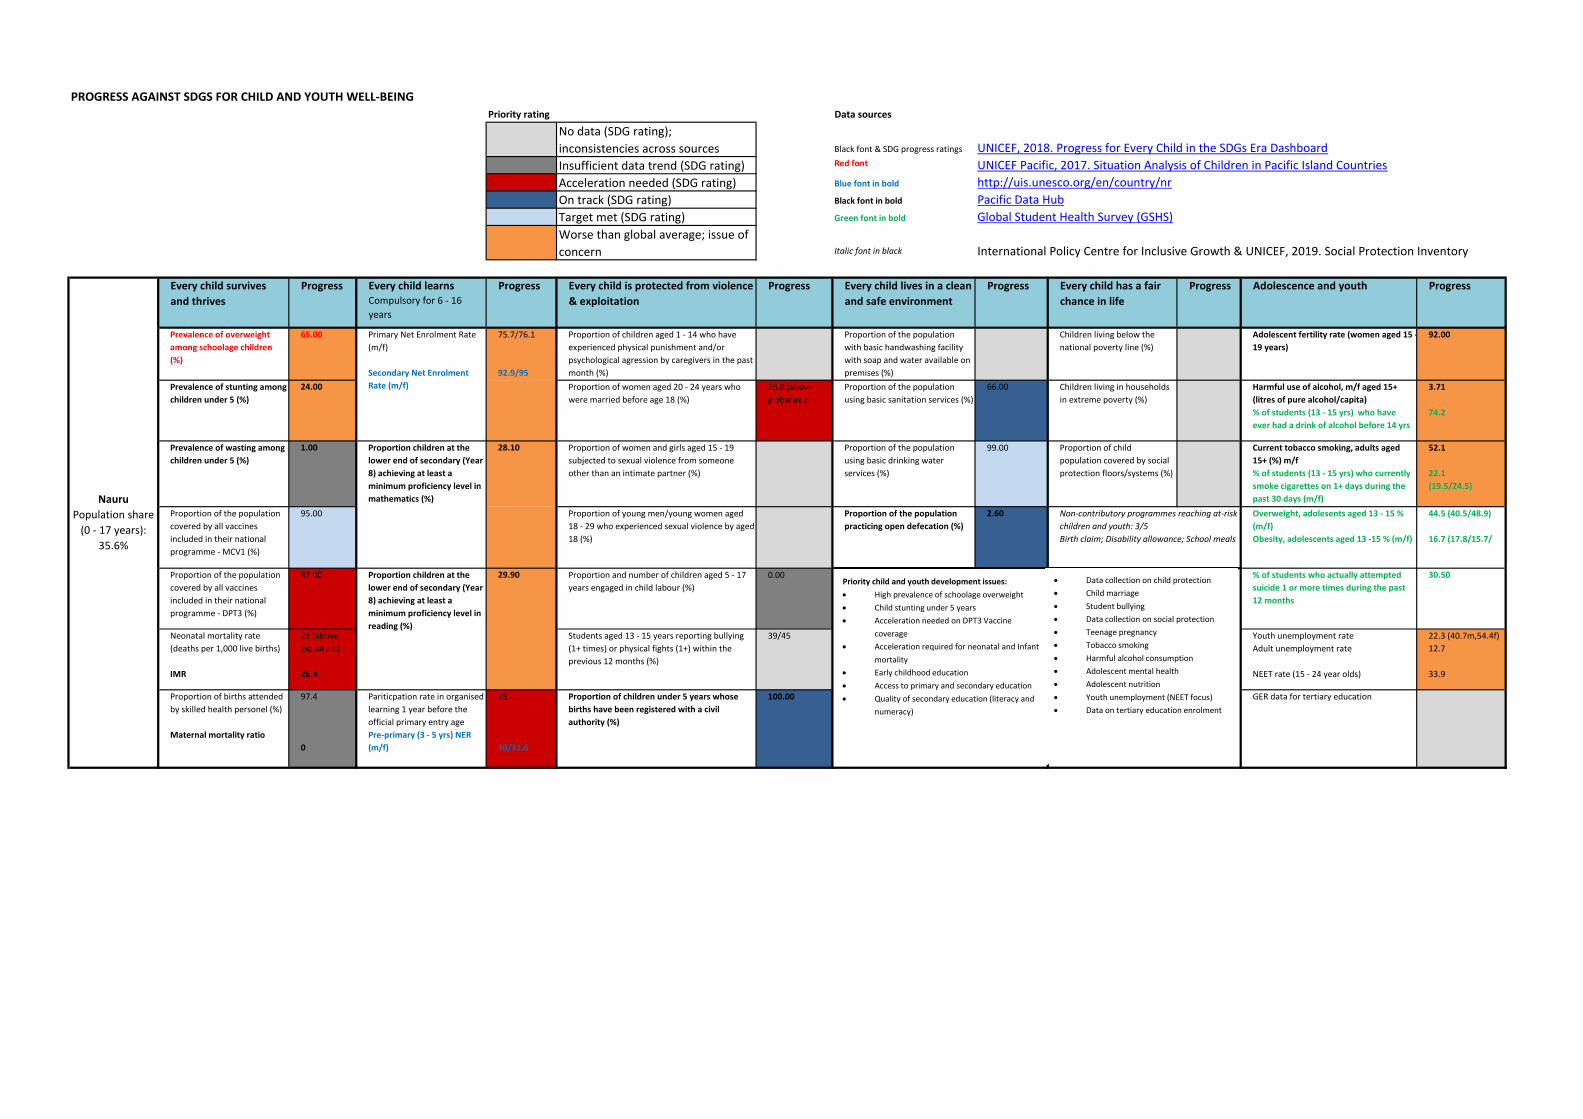
Prevalence of overweight
among schoolage children
(%)
65.00 Proportion of children aged 1 - 14 who have
experienced physical punishment and/or
psychological agression by caregivers in the past
month (%)
Proportion of the population
with basic handwashing facility
with soap and water available on
premises (%)
Children living below the
national poverty line (%)
Adolescent fertility rate (women aged 15 -
19 years)
92.00
Prevalence of stunting among
children under 5 (%)
24.00 Proportion of women aged 20 - 24 years who
were married before age 18 (%)
26.8 (above
global av.)
Proportion of the population
using basic sanitation services (%)
66.00 Children living in households
in extreme poverty (%)
Harmful use of alcohol, m/f aged 15+
(litres of pure alcohol/capita)
% of students (13 - 15 yrs) who have
ever had a drink of alcohol before 14 yrs
3.71
74.2
Prevalence of wasting among
children under 5 (%)
1.00 Proportion of women and girls aged 15 - 19
subjected to sexual violence from someone
other than an intimate partner (%)
Proportion of the population
using basic drinking water
services (%)
99.00 Proportion of child
population covered by social
protection floors/systems (%)
Current tobacco smoking, adults aged
15+ (%) m/f
% of students (13 - 15 yrs) who currently
smoke cigarettes on 1+ days during the
past 30 days (m/f)
52.1
22.1
(19.5/24.5)
Proportion of the population
covered by all vaccines
included in their national
programme - MCV1 (%)
95.00 Proportion of young men/young women aged
18 - 29 who experienced sexual violence by aged
18 (%)
Proportion of the population
practicing open defecation (%)
2.60 Overweight, adolesents aged 13 - 15 %
(m/f)
Obesity, adolescents aged 13 -15 % (m/f)
44.5 (40.5/48.9)
16.7 (17.8/15.7/
Proportion of the population
covered by all vaccines
included in their national
programme - DPT3 (%)
87.00 Proportion and number of children aged 5 - 17
years engaged in child labour (%)
0.00 % of students who actually attempted
suicide 1 or more times during the past
12 months
30.50
Neonatal mortality rate
(deaths per 1,000 live births)
IMR
21 (above
global av.)
26.4
Students aged 13 - 15 years reporting bullying
(1+ times) or physical fights (1+) within the
previous 12 months (%)
39/45 Youth unemployment rate
Adult unemployment rate
NEET rate (15 - 24 year olds)
22.3 (40.7m,54.4f)
12.7
33.9
Proportion of births attended
by skilled health personel (%)
Maternal mortality ratio
97.4
0
Pariticpation rate in organised
learning 1 year before the
official primary entry age
Pre-primary (3 - 5 yrs) NER
(m/f)
75
30/31.6
Proportion of children under 5 years whose
births have been registered with a civil
authority (%)
100.00 GER data for tertiary education
75.7/76.1
92.9/95
28.10
29.90
Primary Net Enrolment Rate
(m/f)
Secondary Net Enrolment
Rate (m/f)
Proportion children at the
lower end of secondary (Year
8) achieving at least a
minimum proficiency level in
mathematics (%)
Proportion children at the
lower end of secondary (Year
8) achieving at least a
minimum proficiency level in
reading (%)
Non-contributory programmes reaching at-risk
children and youth: 3/5
Birth claim; Disability allowance; School meals
Nauru
Population share
(0 - 17 years):
35.6%
Priority child and youth development issues:
High prevalence of schoolage overweight
Child stunting under 5 years
Acceleration needed on DPT3 Vaccine
coverage
Acceleration required for neonatal and Infant
mortality
Early childhood education
Access to primary and secondary education
Quality of secondary education (literacy and
numeracy)
Data collection on child protection
Child marriage
Student bullying
Data collection on social protection
Teenage pregnancy
Tobacco smoking
Harmful alcohol consumption
Adolescent mental health
Adolescent nutrition
Youth unemployment (NEET focus)
Data on tertiary education enrolment
PROGRESS AGAINST SDGS FOR CHILD AND YOUTH WELL-BEING
Priority rating Data sources
No data (SDG rating);
inconsistencies across sources Black font & SDG progress ratings UNICEF, 2018. Progress for Every Child in the SDGs Era Dashboard
Insufficient data trend (SDG rating) Red font UNICEF Pacific, 2017. Situation Analysis of Children in Pacific Island Countries
Acceleration needed (SDG rating) Blue font in bold https://www.unfpa.org/data/world-population/
On track (SDG rating) Black font in bold Pacific Data Hub
Target met (SDG rating) Green font in bold Global Student Health Survey (GSHS)
Worse than global average; issue of
concern Italic font in black International Policy Centre for Inclusive Growth & UNICEF, 2019. Social Protection Inventory
Every child survives
and thrives
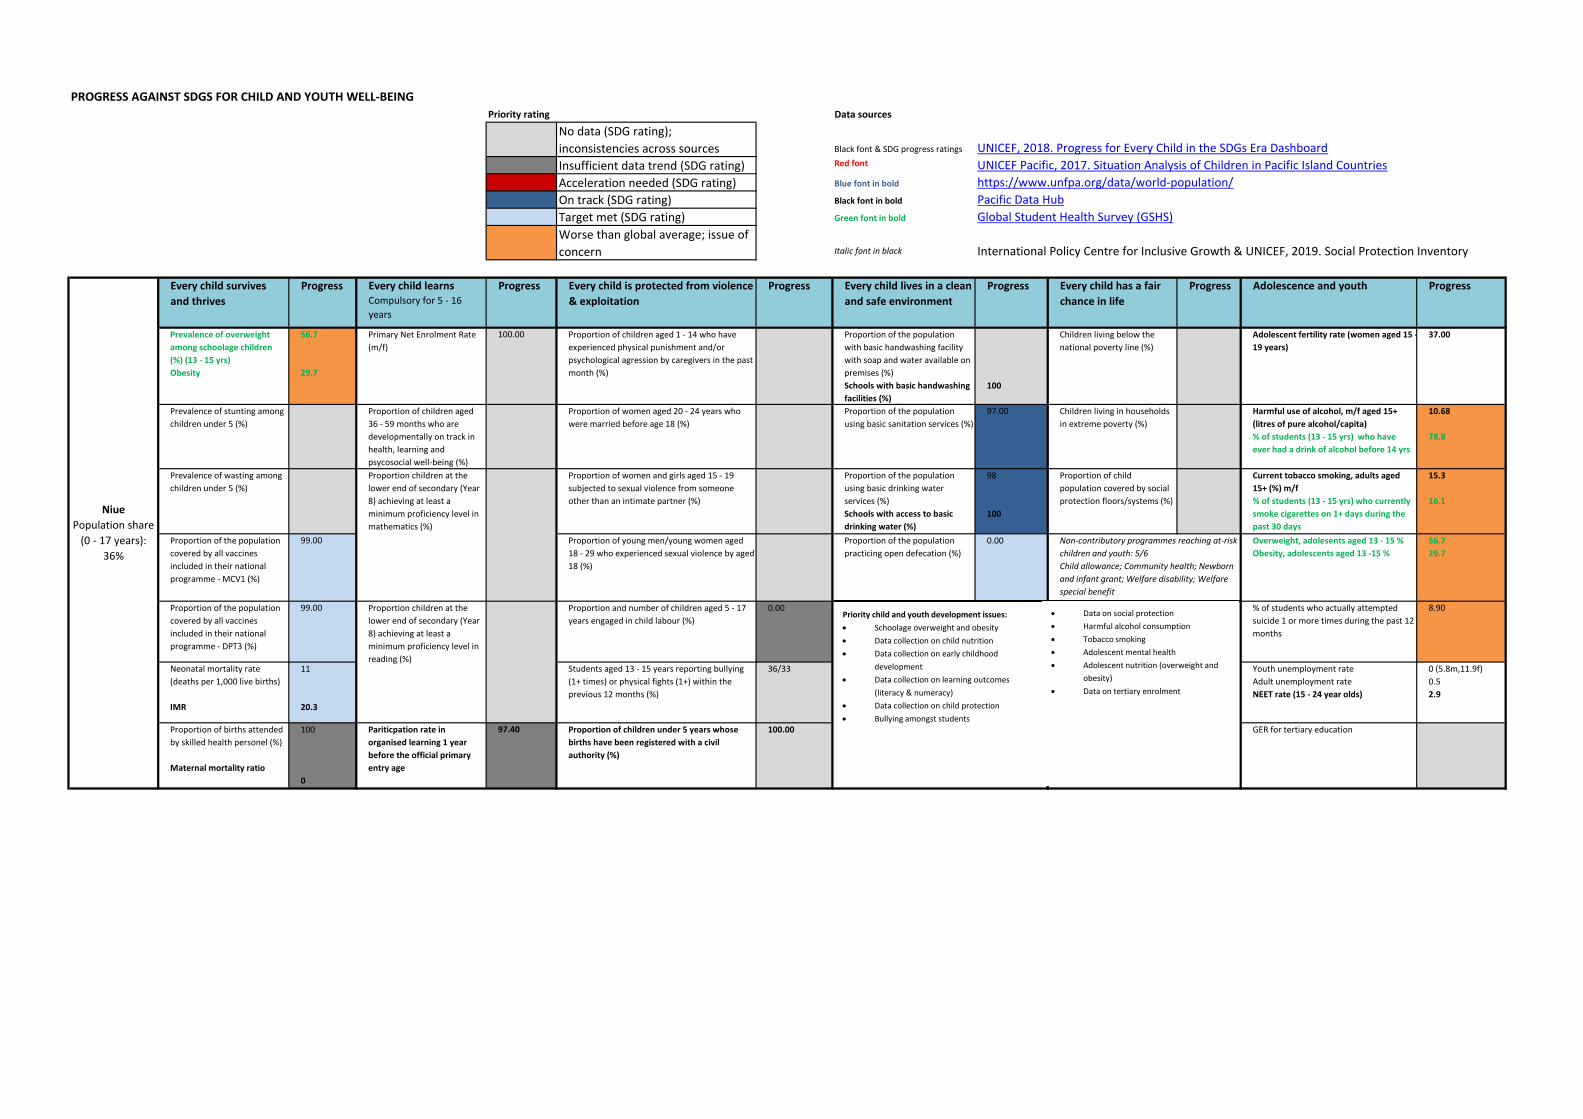
Progress Every child learnsCompulsory for 5 - 16
years
Progress Every child is protected from violence
& exploitation
Progress Every child lives in a clean
and safe environment
Progress Every child has a fair
chance in life
Progress Adolescence and youth Progress
Prevalence of overweight
among schoolage children
(%) (13 - 15 yrs)
Obesity
56.7
29.7
Primary Net Enrolment Rate
(m/f)
100.00 Proportion of children aged 1 - 14 who have
experienced physical punishment and/or
psychological agression by caregivers in the past
month (%)
Proportion of the population
with basic handwashing facility
with soap and water available on
premises (%)
Schools with basic handwashing
facilities (%)
100
Children living below the
national poverty line (%)
Adolescent fertility rate (women aged 15 -
19 years)
37.00
Prevalence of stunting among
children under 5 (%)
Proportion of children aged
36 - 59 months who are
developmentally on track in
health, learning and
psycosocial well-being (%)
Proportion of women aged 20 - 24 years who
were married before age 18 (%)
Proportion of the population
using basic sanitation services (%)
97.00 Children living in households
in extreme poverty (%)
Harmful use of alcohol, m/f aged 15+
(litres of pure alcohol/capita)
% of students (13 - 15 yrs) who have
ever had a drink of alcohol before 14 yrs
10.68
78.8
Prevalence of wasting among
children under 5 (%)
Proportion of women and girls aged 15 - 19
subjected to sexual violence from someone
other than an intimate partner (%)
Proportion of the population
using basic drinking water
services (%)
Schools with access to basic
drinking water (%)
98
100
Proportion of child
population covered by social
protection floors/systems (%)
Current tobacco smoking, adults aged
15+ (%) m/f
% of students (13 - 15 yrs) who currently
smoke cigarettes on 1+ days during the
past 30 days
15.3
16.1
Proportion of the population
covered by all vaccines
included in their national
programme - MCV1 (%)
99.00 Proportion of young men/young women aged
18 - 29 who experienced sexual violence by aged
18 (%)
Proportion of the population
practicing open defecation (%)
0.00 Overweight, adolesents aged 13 - 15 %
Obesity, adolescents aged 13 -15 %
56.7
29.7
Proportion of the population
covered by all vaccines
included in their national
programme - DPT3 (%)
99.00 Proportion and number of children aged 5 - 17
years engaged in child labour (%)
0.00 % of students who actually attempted
suicide 1 or more times during the past 12
months
8.90
Neonatal mortality rate
(deaths per 1,000 live births)
IMR
11
20.3
Students aged 13 - 15 years reporting bullying
(1+ times) or physical fights (1+) within the
previous 12 months (%)
36/33 Youth unemployment rate
Adult unemployment rate
NEET rate (15 - 24 year olds)
0 (5.8m,11.9f)
0.5
2.9
Proportion of births attended
by skilled health personel (%)
Maternal mortality ratio
100
0
Pariticpation rate in
organised learning 1 year
before the official primary
entry age
97.40 Proportion of children under 5 years whose
births have been registered with a civil
authority (%)
100.00 GER for tertiary education
Proportion children at the
lower end of secondary (Year
8) achieving at least a
minimum proficiency level in
mathematics (%)
Proportion children at the
lower end of secondary (Year
8) achieving at least a
minimum proficiency level in
reading (%)
Non-contributory programmes reaching at-risk
children and youth: 5/6
Child allowance; Community health; Newborn
and infant grant; Welfare disability; Welfare
special benefit
Niue
Population share
(0 - 17 years):
36%
Priority child and youth development issues:
Schoolage overweight and obesity
Data collection on child nutrition
Data collection on early childhood
development
Data collection on learning outcomes
(literacy & numeracy)
Data collection on child protection
Bullying amongst students
Data on social protection
Harmful alcohol consumption
Tobacco smoking
Adolescent mental health
Adolescent nutrition (overweight and
obesity)
Data on tertiary enrolment
PROGRESS AGAINST SDGS FOR CHILD AND YOUTH WELL-BEING
Priority rating Data sources
No data (SDG rating);
inconsistencies across sources Black font & SDG progress ratings
UNICEF, 2018. Progress for Every Child in the SDGs Era Dashboard
Insufficient data trend (SDG rating) Red font UNICEF Pacific, 2017. Situation Analysis of Children in Pacific Island Countries
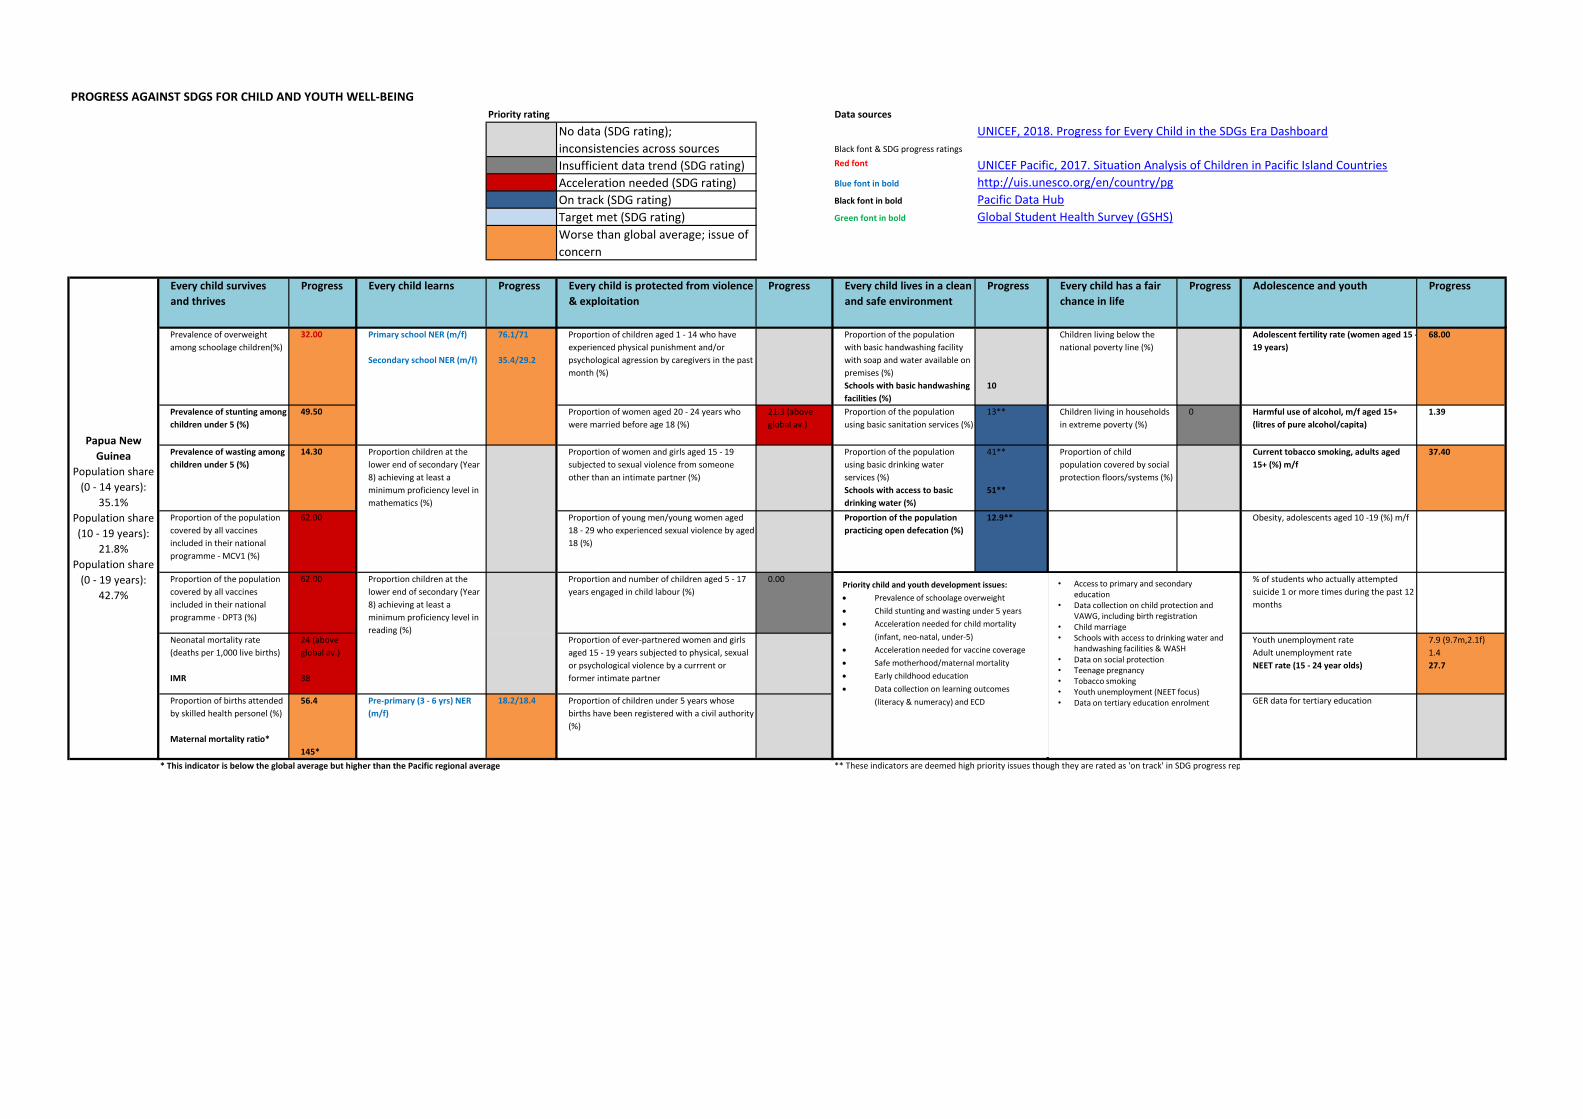
Acceleration needed (SDG rating) Blue font in bold http://uis.unesco.org/en/country/pg
On track (SDG rating) Black font in bold Pacific Data Hub
Target met (SDG rating) Green font in bold Global Student Health Survey (GSHS)
Worse than global average; issue of
concern
Every child survives
and thrives
Progress Every child learns Progress Every child is protected from violence
& exploitation
Progress Every child lives in a clean
and safe environment
Progress Every child has a fair
chance in life
Progress Adolescence and youth Progress
Prevalence of overweight
among schoolage children(%)
32.00 Proportion of children aged 1 - 14 who have
experienced physical punishment and/or
psychological agression by caregivers in the past
month (%)
Proportion of the population
with basic handwashing facility
with soap and water available on
premises (%)
Schools with basic handwashing
facilities (%)
10
Children living below the
national poverty line (%)
Adolescent fertility rate (women aged 15 -
19 years)
68.00
Prevalence of stunting among
children under 5 (%)
49.50 Proportion of women aged 20 - 24 years who
were married before age 18 (%)
21.3 (above
global av.)
Proportion of the population
using basic sanitation services (%)
13** Children living in households
in extreme poverty (%)
0 Harmful use of alcohol, m/f aged 15+
(litres of pure alcohol/capita)
1.39
Prevalence of wasting among
children under 5 (%)
14.30 Proportion of women and girls aged 15 - 19
subjected to sexual violence from someone
other than an intimate partner (%)
Proportion of the population
using basic drinking water
services (%)
Schools with access to basic
drinking water (%)
41**
51**
Proportion of child
population covered by social
protection floors/systems (%)
Current tobacco smoking, adults aged
15+ (%) m/f
37.40
Proportion of the population
covered by all vaccines
included in their national
programme - MCV1 (%)
62.00 Proportion of young men/young women aged
18 - 29 who experienced sexual violence by aged
18 (%)
Proportion of the population
practicing open defecation (%)
12.9** Obesity, adolescents aged 10 -19 (%) m/f
Proportion of the population
covered by all vaccines
included in their national
programme - DPT3 (%)
62.00 Proportion and number of children aged 5 - 17
years engaged in child labour (%)
0.00 % of students who actually attempted
suicide 1 or more times during the past 12
months
Neonatal mortality rate
(deaths per 1,000 live births)
IMR
24 (above
global av.)
38
Proportion of ever-partnered women and girls
aged 15 - 19 years subjected to physical, sexual
or psychological violence by a currrent or
former intimate partner
Youth unemployment rate
Adult unemployment rate
NEET rate (15 - 24 year olds)
7.9 (9.7m,2.1f)
1.4
27.7
Proportion of births attended
by skilled health personel (%)
Maternal mortality ratio*
56.4
145*
Pre-primary (3 - 6 yrs) NER
(m/f)
18.2/18.4 Proportion of children under 5 years whose
births have been registered with a civil authority
(%)
GER data for tertiary education
** These indicators are deemed high priority issues though they are rated as 'on track' in SDG progress reports
Primary school NER (m/f)
Secondary school NER (m/f)
76.1/71
35.4/29.2
* This indicator is below the global average but higher than the Pacific regional average
Proportion children at the
lower end of secondary (Year
8) achieving at least a
minimum proficiency level in
reading (%)
Proportion children at the
lower end of secondary (Year
8) achieving at least a
minimum proficiency level in
mathematics (%)
Papua New
Guinea
Population share
(0 - 14 years):
35.1%
Population share
(10 - 19 years):
21.8%
Population share
(0 - 19 years):
42.7%Priority child and youth development issues:
Prevalence of schoolage overweight
Child stunting and wasting under 5 years
Acceleration needed for child mortality
(infant, neo-natal, under-5)
Acceleration needed for vaccine coverage
Safe motherhood/maternal mortality
Early childhood education
Data collection on learning outcomes
(literacy & numeracy) and ECD
• Access to primary and secondary education
• Data collection on child protection and VAWG, including birth registration
• Child marriage• Schools with access to drinking water and
handwashing facilities & WASH• Data on social protection• Teenage pregnancy• Tobacco smoking• Youth unemployment (NEET focus)• Data on tertiary education enrolment

PROGRESS AGAINST SDGS FOR CHILD AND YOUTH WELL-BEING
Priority rating Data sources
No data (SDG rating);
inconsistencies across sources Black font & SDG progress ratings UNICEF, 2018. Progress for Every Child in the SDGs Era Dashboard
Insufficient data trend (SDG rating) Italic font in black International Policy Centre for Inclusive Growth & UNICEF, 2019. Social Protection Inventory
Acceleration needed (SDG rating) Pink font in bold https://www.unfpa.org/data/world-population/
On track (SDG rating) Black font in bold Pacific Data Hub
Target met (SDG rating) Green font in bold Global Student Health Survey (GSHS)
Worse than global average; issue of
concern Blue font in bold Factsheet Samoa DHS-MICS 2019 - 2020 (Preliminary results)
Every child survives
and thrives
Progress Every child learnsCompulsory for 5 - 14
years
Progress Every child is protected from violence
& exploitation
Progress Every child lives in a clean
and safe environment
Progress Every child has a fair
chance in life
Progress Adolescence and youth Progress
Prevalence of overweight
among schoolage children
(%) (13 - 15 yrs)
Obesity)
Prevalence of overweight
among children under 5 (%)
(mod; severe)
58.5
25.2
8.7
Primary Net Enrolment Rate
(m/f)
Out-of-school rate (primary)
" (lower secondary)
" (upper secondary)
100/100
6.9
5.1
19.7
Proportion of children aged 1 - 14 who have
experienced physical punishment and/or
psychological agression by caregivers in the
past month (%)
90.80 Percentage of household
members with a handwashing
facility where water and soap or
detergent are present
Schools with basic handwashing
facilities (%)
78.8
100
Children living below the
national poverty line (%)
Adolescent fertility rate (women aged 15 -
19 years)
Adolescent birth rate (women aged 15 -
19 years)
31
55
Prevalence of stunting among
children under 5 (%) (mod;
severe)
7.30 Secondary Net Enrolment
Rate (m/f)
75/84 Proportion of women aged 20 - 24 years who
were married before age 18 (%)
7.4
(0.9 before 15
yrs)
Proportion of the population
using basic sanitation services (%)
48.00 Children living in households
in extreme poverty (%)
Harmful use of alcohol, m/f aged 15+
(litres of pure alcohol/capita)
% of students (13 - 15 yrs) who have
ever had a drink of alcohol before 14 yrs
2.66
54
Prevalence of wasting among
children under 5 (%)
Prevalence of underweight
among children under 5
(mod;severe)
3.1
3.4
Proportion children at the
lower end of secondary (Year
8) achieving at least a
minimum proficiency level in
mathematics (%)
23.90 Percentage of women age 15-49 years who
have experienced any physical violence
(committed by a husband or anyone else) since
age 15 and in the past 12 months
a)ever in their lifetime
b)in the past 12 months
41.5
16.2
Proportion of the population
using basic drinking water
services (%)
97.30 Current tobacco smoking, adults aged 15-
49 years (%) (m/f)
% of students (13 - 15 yrs) who currently
smoke cigarettes on 1+ days during the
past 30 days
12.5/35.4
8.1
Proportion of the population
covered by all vaccines
included in their national
programme - MCV1 (%)
58.00 Proportion children at the
lower end of secondary (Year
8) achieving at least a
minimum proficiency level in
reading (%)
44.00 Proportion of women aged 15 - 49 who
experienced sexual violence by aged 18 (%)
3.2
(9.6 by 22 yrs)
Proportion of the population
practicing open defecation (%)
0.00 Percentage of children under
age 18 living in the
households that received any
type of social transfers in the
last 3 months
64.9 Overweight, adolesents aged 13 - 17 %
(m/f)
Obesity, adolescents aged 13 -17 % (m/f)
58.5 (52.4/63.9)
25.2 (24.6/25.8)
Proportion of the population
covered by all vaccines
included in their national
programme - DPT3 (%)
74
(39 in MICS)
Proportion and number of children aged 5 - 17
years engaged in child labour (%)
13.90 % of students (13 - 17) who actually
attempted suicide 1 or more times
during the past 12 months (%) m/f
21.7 (22.2/20.8)
Neonatal mortality rate
(deaths per 1,000 live births)
IMR
U5MR
5
15
20
Students aged 13 - 15 years reporting bullying
(1+ times) or physical fights (1+) within the
previous 12 months (%)
74/68 Youth unemployment rate
Adult unemployment rate
NEET rate (15 - 24 year olds)
0.3 (3.1m,20.2f)
0.3
37.9
Proportion of births attended
by skilled health personel (%)
Maternal mortality ratio
88.9 (above
global av)
43
% of children in relevant age
group (1 year before the
official primary school entry
age) who are attending an
ECE programme or primary
school
55.00 Proportion of children under 5 years whose
births have been registered with a civil
authority (%)
66.9* GER data for tertiary education
Proportion of children aged
36 - 59 months who are
developmentally on track in
health, learning and
psycosocial well-being (%)
* This indicator is rated 'on track' in SDG reports but is still deemed a priority issue
73.30
Samoa
Population share
(0 - 19 years):
43.4%
Population share
(10 - 19 years):
22.4%
% of children (2 -
17 years) with at
least functional
difficulty in at
least 1 domain:
19.4
Non-contributory programmes reaching at-risk
children and youth: 1/2
School fee grant scheme
Priority child and youth development issues:
Prevlance of under 5, schoolage and
adolescent overweight & obesity
Acceleration needed on vaccine coverage
Infant mortality (higher than global av.)
Safe motherhood/maternal mortality
Early childhood education & ECD
Access to secondary education
Quality of secondary education (literacy and
numeracy)
Birth registration
Child labour
Violence aganist children & VAWG
Child marriage (below global av.)
Student bullying
Acceleration needed for access to basic
drinking water
Data on social protection
Tobacco smoking
Harmful consumption of alcohol
Adolescent mental health
Adolescent nutrition
Youth unemployment (NEET focus)
Data on tertiary education

PROGRESS AGAINST SDGS FOR CHILD AND YOUTH WELL-BEING
Data sources Data sources
No data (SDG rating);
inconsistencies across sources Black font & SDG progress ratings UNICEF, 2018. Progress for Every Child in the SDGs Era Dashboard
Insufficient data trend (SDG rating) Red font UNICEF Pacific, 2017. Situation Analysis of Children in Pacific Island Countries
Acceleration needed (SDG rating) Italic font in black International Policy Centre for Inclusive Growth & UNICEF, 2019. Social Protection Inventory
On track (SDG rating) Black font in bold Pacific Data Hub
Target met (SDG rating) Green font in bold Global Student Health Survey (GSHS)
Worse than global average Blue font in bold Solomon Islands Education Statistics Digest (source SIEMIS)
Every child survives
and thrives
Progress Every child learns Progress Every child is protected from violence
& exploitation
Progress Every child lives in a clean
and safe environment
Progress Every child has a fair
chance in life
Progress Adolescence and youth Progress
Prevalence of overweight
among schoolage children (%)
23.00 Proportion of children aged 1 - 14 who have
experienced physical punishment and/or
psychological agression by caregivers in the past
month (%)
72.00 Proportion of the population
with basic handwashing facility
with soap and water available on
premises (%)
36.00 Children living below the
national poverty line (%)
Adolescent fertility rate (women aged 15 -
19 years)
77.00
Prevalence of stunting among
children under 5 (%)
33.30 Proportion of women aged 20 - 24 years who
were married before age 18 (%)
21.3 (above
global av.)
Proportion of the population
using basic sanitation services (%)
34.00 Children living in households
in extreme poverty (%)
Harmful use of alcohol, m/f aged 15+
(litres of pure alcohol/capita)
% of students (13 - 15 yrs) who have
ever had a drink of alcohol before 14 yrs
1.83
63.6
Prevalence of wasting among
children under 5 (%)
7.90 Proportion children at the
lower end of secondary (Year
8) achieving at least a
minimum proficiency level in
mathematics (%)
91.00 Proportion of women and girls aged 15 - 19
subjected to sexual violence from someone
other than an intimate partner (%)
Proportion of the population
using basic drinking water
services (%)
Schools with access to basic
drinking water (%)
82.5
47**
Proportion of child
population covered by social
protection floors/systems (%)
Current tobacco smoking, adults aged
15+ (%) m/f
% of students (13 - 15 yrs) who currently
smoke cigarettes on 1+ days during the
past 30 days (%) m/f
37.9
24 (28.3/18.4)
Proportion of the population
covered by all vaccines
included in their national
programme - MCV1 (%)
84.00 Proportion children at the
lower end of secondary (Year
8) achieving at least a
minimum proficiency level in
reading (%)
86.00 Proportion of young men/young women aged
18 - 29 who experienced sexual violence by aged
18 (%)
Proportion of the population
practicing open defecation (%)
41.1** Overweight, adolesents aged 13 - 15 (%)
m/f
Obesity, adolescents aged 13 -15 (%) m/f
20 (17.6/22.4)
2.2 (1.5/2.9)
Proportion of the population
covered by all vaccines
included in their national
programme - DPT3 (%)
94.00 Primary school NER (2019)
(m/f)
77.7/76.5 Proportion and number of children aged 5 - 17
years engaged in child labour (%)
18.00 % of students who actually attempted
suicide 1 or more times during the past 12
months
33.9
(30.8m, 35.9f)
Neonatal mortality rate
(deaths per 1,000 live births)
IMR
9
17.1
Junior Secondary school NER
(2019) (m/f)
Senior Secondary school NER
(2019) (m/f)
16.5/18.9
17.7/19.3
Students aged 13 - 15 years reporting bullying
(1+ times) or physical fights (1+) within the
previous 12 months (%)
67/53 Youth unemployment rate
Adult unemployment rate
NEET rate (15 - 24 year olds)
1.5 (45.8m,46.1f)
0.7
6.3***
Proportion of births attended
by skilled health personel (%)
Maternal mortality ratio*
86.5 (above
global av.)
104*
ECE NER (2019) (m/f) 30.4/32.0 Proportion of children under 5 years whose
births have been registered with a civil authority
(%)
88.00 GER data for tertiary education
** These indicators are deemed high priority issues though they are rated as 'on track' in SDG progress reports
*** The youth employment situation is deemed high, despite the low value of data available
* This indicator is below the global average but higher than the Pacific regional average
Overall literacy (Years 4 & 6)
% below average
Overall numeracy (Years 4 &
6) % below average
56
47
Solomon Islands
Population share
(0 - 14 years):
40% (2020)
Population share
(10 - 24 years):
30.5% (2020)
Population share
(0 - 19 years):
45.8%
Non-contributory programmes reaching at-risk
children and youth: 1/1
Free basic education
Priority child and youth development issues:
Prevalence of schoolage and adolescent
overweight
Child stunting and wasting under 5 years
Acceleration needed on maternal mortality
Data on early childhood development
Early childhood education
Quality of primary education
Access to primary and secondary education
Violence against children
Student bullying
Child marriage
Birth registration
Child labour
Access to water and sanitation in schools
Open defecation
Data on social protection & VAWG
Teenage pregnancy
Harmful alcohol consumption
Adolescent mental health
Tobacco smoking
Youth unemployment (NEET focus)
Data on access to tertiary education

PROGRESS AGAINST SDGS FOR CHILD AND YOUTH WELL-BEING
Priority rating Data sources
No data (SDG rating);
inconsistencies across sources Black font & SDG progress ratings
UNICEF, 2018. Progress for Every Child in the SDGs Era Dashboard
Insufficient data trend (SDG rating) Red font UNICEF Pacific, 2017. Situation Analysis of Children in Pacific Island Countries
Acceleration needed (SDG rating) Blue font in bold https://www.unfpa.org/data/world-population/
On track (SDG rating) Black font in bold Pacific Data Hub
Target met (SDG rating) Green font in bold Global Student Health Survey (GSHS)
Worse than global average; issue of
concern
Every child survives
and thrives
Progress Every child learnsCompulsory for 5 - 16
years
Progress Every child is protected from violence
& exploitation
Progress Every child lives in a clean
and safe environment
Progress Every child has a fair
chance in life
Progress Adolescence and youth Progress
Prevalence of overweight
among schoolage children (%)
Primary Net Enrolment Rate
(m/f)
103.3/88.1 Proportion of children aged 1 - 14 who have
experienced physical punishment and/or
psychological agression by caregivers in the past
month (%)
Proportion of the population
with basic handwashing facility
with soap and water available on
premises (%)
Children living below the
national poverty line (%)
Adolescent fertility rate (women aged 15 -
19 years)
% of students (13 - 15) who had ever had
sexual intercourse
22.9 (26.5/16.4)
Prevalence of stunting among
children under 5 (%)
Secondary Net Enrolment
Rate (m/f)
63.1/63.6 Proportion of women aged 20 - 24 years who
were married before age 18 (%)
Proportion of the population
using basic sanitation services (%)
96.66 Children living in households
in extreme poverty (%)
Harmful use of alcohol, m/f aged 15+
(litres of pure alcohol/capita)
% of students (13 - 17 yrs) who drank 1+
drinks of alcohol during past 30 days
59.9
51.4 (46.6/54.6)
Prevalence of wasting among
children under 5 (%)
Proportion of women and girls aged 15 - 19
subjected to sexual violence from someone
other than an intimate partner (%)
Proportion of the population
using basic drinking water
services (%)
99.62 Proportion of child
population covered by social
protection floors/systems (%)
Current tobacco smoking, adults aged
15+ (%) m/f
% of students (13 - 15 yrs) who currently
smoke cigarettes on 1+ days during the
past 30 days
55.3 (60.4/49.4)
Proportion of the population
covered by all vaccines
included in their national
programme - MCV1 (%)
Proportion of young men/young women aged
18 - 29 who experienced sexual violence by aged
18 (%)
Proportion of the population
practicing open defecation (%)
0.00 Overweight, adolesents aged 13 - 15 (%)
m/f
Obesity, adolescents aged 13 -15 (%) m/f
Proportion of the population
covered by all vaccines
included in their national
programme - DPT3 (%)
Proportion and number of children aged 5 - 17
years engaged in child labour (%)
0.00 % of students (13 - 17) who actually
attempted suicide 1 or more times
during the past 12 months (%) m/f
27.3 (27.5/23.9)
Neonatal mortality rate
(deaths per 1,000 live births)
Students aged 13 - 15 years reporting bullying
(1+ times) or physical fights (1+) within the
previous 12 months (%)
40.5 (38.6/38.9) Youth unemployment rate
Adult unemployment rate
NEET rate (15 - 24 year olds)
2.1 (14.9m,30.4f)
2.2
No data
Proportion of births attended
by skilled health personel (%)
Pariticpation rate in organised
learning 1 year before the
official primary entry age
88.44 Proportion of children under 5 years whose
births have been registered with a civil authority
(%)
GER data for tertiary education
Proportion children at the
lower end of secondary (Year
8) achieving at least a
minimum proficiency level in
mathematics (%)
Proportion children at the
lower end of secondary (Year
8) achieving at least a
minimum proficiency level in
reading (%)
Tokelau
Population share
(0 - 17 years):
36%
Priority child and youth development issues:
Data collection on child, student &
adolescent nutrition
Data on child health (neonatal, infant and
under 5 years, maternal mortality)
Data collection on learning outcomes
(literacy & numeracy)
Early childhood education
Student bullying
Data collection on child protection including
birth registration
Access to secondary education
Acceleration needed on access to basic
sanitation services
Data on social protection
Adolescent sexual/reproductive health
Adolescent and youth mental health
Student alcohol consumption
Tobacco smoking
Data on tertiary education enrolment

PROGRESS AGAINST SDGS FOR CHILD AND YOUTH WELL-BEING
Priority rating Data sources
No data (SDG rating);
inconsistencies across sources Blue font in bold Tonga 2019 MICS Survey Findings Report
Insufficient data trend (SDG rating) Black font & SDG progress ratings UNICEF, 2018. Progress for Every Child in the SDGs Era Dashboard
Acceleration needed (SDG rating) Red font UNICEF Pacific, 2017. Situation Analysis of Children in Pacific Island Countries
On track (SDG rating) Italic font in black International Policy Centre for Inclusive Growth & UNICEF, 2019. Social Protection Inventory
Target met (SDG rating) Black font in bold Pacific Data Hub
Worse than global average; issue of
concern Green font in bold Global Student Health Survey (GSHS)
Every child survives
and thrives
Progress Every child learnsCompulsory for 6 - 18
years
Progress Every child is protected from violence
& exploitation
Progress Every child lives in a clean
and safe environment
Progress Every child has a fair
chance in life
Progress Adolescence and youth Progress
Prevalence of overweight
among schoolage children
(%) (13 - 15 yrs)
Obesity)
Under 5 years
54.8
25
11.2
Primary Net Enrolment Rate
(m/f)
Secondary Net Enrolment
Rate (m/f)
95/97
74/79
Proportion of children aged 1 - 14 who have
experienced physical punishment and/or
psychological agression by caregivers in the
past month (%)
86.60 Proportion of the households
with basic handwashing facility
with soap and water available
on premises (%)
77.80 Children living below the
national poverty line (%)
0 Adolescent birth rate (women aged 15 -
19 years)
30.00
Prevalence of stunting among
children under 5 (%) -
moderate and severe
2.20 % of children aged 5 - 17 yrs
with functional difficulty in at
least 1 domain not attending
school
14.00 Proportion of women aged 20 - 24 years who
were married before age 18 (%)
10.10 Proportion of the population
using basic sanitation services (%)
93.45 Children living in households
in extreme poverty (%)
0 Harmful use of alcohol, m/f aged 15+
(litres of pure alcohol/capita)
% of students (13 - 17 yrs) who drank 1+
drinks of alcohol during past 30 days
0.8
14 (19.6/8.3)
Prevalence of wasting among
children under 5 (%) -
moderate and severe
1.10 Proportion children at the
lower end of secondary (Year
8) achieving at least a
minimum proficiency level in
mathematics (%)
83.00 Proportion of women and girls aged 15 - 19
subjected to sexual violence from someone
other than an intimate partner (%)
Proportion of the population
using basic drinking water
services (%)
99.91 Proportion of child
population covered by social
protection floors/systems (%)
Current tobacco smoking, adults aged
15+ (%) m/f
% of students (13 - 15 yrs) who currently
smoke cigarettes on 1+ days during the
past 30 days
52.9/16.1
14.6 (22.1/6.8)
Proportion of the population
covered by all vaccines
included in their national
programme - MCV1 (%)
85.00 Out-of-school rate
(primary/lower sec/upper
sec)
3.5/7.8/32.1 Students aged 13 - 15 years reporting bullying
(1+ times) or physical fights (1+) within the
previous 12 months (%)
38.1 (49.9/25.3) Proportion of the population
practicing open defecation (%)
0.00 Overweight, adolesents aged 13 - 15 (%)
m/f
Obesity, adolescents aged 13 -15 (%) m/f
54.8 (49.3/60.7)
25 (22.9/27.1)
Proportion of the population
covered by all vaccines
included in their national
programme - DPT3 (%)
93.50 Proportion and number of children aged 5 - 17
years engaged in child labour (%)
26.10 % of students (13 - 17) who actually
attempted suicide 1 or more times
during the past 12 months
15.1 (17.2/13)
Neonatal mortality rate
(deaths per 1,000 live births)
IMR
U5MR
5
10
11
Proportion of ever-partnered women and girls
aged 15 - 19 years subjected to physical, sexual
or psychological violence by a currrent or
former intimate partner
41.00 Youth unemployment rate
Adult unemployment rate
NEET rate (15 - 24 year olds)
2.8 (4.7m,2.7f)
1.0
33.6
Proportion of births attended
by skilled health personel (%)
Maternal mortality ratio**
98.3
52**
Particpation rate in organised
learning 1 year before the
official primary entry age
96.70 Proportion of children under 5 years whose
births have been registered with a civil
authority (%)
97.70 GER data for tertiary education 6.30
** This indicator is below the global average but higher than the Pacific regional average
Tonga
Population share
(0 - 14 years):
34.8% (2020)
Population share
(10 - 24 years):
31.4% (2020)
Population share
(0 - 19 years):
43% Proportion children at the
lower end of secondary (Year
8) achieving at least a
minimum proficiency level in
reading (%)
35.00
Non-contributory programmes reaching at-risk
children and youth: 2/4
Disability welfare scheme; Early intervention
services
Priority child and youth development issues:
High prevalence of child and schoolage
overweight & obesity
Acceleration needed for vaccine coverage
Maternal mortality
Access to secondary education
Children with disabilities out of school
Quality of secondary education (literacy and
numeracy)
Violence against children
Student bullying
Child marriage (below global av.)
Sexual violence/VAWG
Child labour
Access to basic handwashing facilities
Data on social protection
Tobacco smoking
Harmful alcohol consumption
Adolescent overweight (females)
Aolescent mental health and suicide
Youth unemployment (NEET focus)
Access to tertiary education

PROGRESS AGAINST SDGS FOR CHILD AND YOUTH WELL-BEING
Priority rating Data sources
No data (SDG rating);
inconsistencies across sources Black font & SDG progress ratings UNICEF, 2018. Progress for Every Child in the SDGs Era Dashboard
Insufficient data trend (SDG rating) Red font UNICEF Pacific, 2017. Situation Analysis of Children in Pacific Island Countries
Acceleration needed (SDG rating) Italic font in black International Policy Centre for Inclusive Growth & UNICEF, 2019. Social Protection Inventory
On track (SDG rating) Black font in bold Pacific Data Hub
Target met (SDG rating) Green font in bold Global Student Health Survey (GSHS)
Worse than global average; issue of
concern Bluefont in bold Tuvalu Education Department 2016 & 2017 Education Statistical Report
Every child survives
and thrives
Progress Every child learnsCompulsory for 6 - 15
years
Progress Every child is protected from violence
& exploitation
Progress Every child lives in a clean
and safe environment
Progress Every child has a fair
chance in life
Progress Adolescence and youth Progress
Prevalence of overweight
among schoolage children
(%) (13 - 15 yrs)
Obesity)
48.3
21.5
Primary Net Enrolment Rate
(2016) (m/f)
96.93/94.95 Proportion of children aged 1 - 14 who have
experienced physical punishment and/or
psychological agression by caregivers in the past
month (%)
Proportion of the population
with basic handwashing facility
with soap and water available on
premises (%)
Schools with basic handwashing
facilities (%)
78
Children living below the
national poverty line (%)
0 Adolescent fertility rate (women aged 15 -
19 years)
22.00
Prevalence of stunting among
children under 5 (%)
10.00 Secondary Net Enrolment
Rate (2016) (m/f)
52.23/68.79 Proportion of women aged 20 - 24 years who
were married before age 18 (%)
10.00 Proportion of the population
using basic sanitation services (%)
84.08 Children living in households
in extreme poverty (%)
Harmful use of alcohol, m/f aged 15+
(litres of pure alcohol/capita)
% of students (13 - 15 yrs) who drank
alcohol in the past 30 days
1.52
18 (21.2/13.4)
Prevalence of wasting among
children under 5 (%)
3.30 Proportion of women and girls aged 15 - 19
subjected to sexual violence from someone
other than an intimate partner (%)
Proportion of the population
using basic drinking water
services (%)
Schools with access to basic
drinking water (%)
99.27
63
Proportion of child
population covered by social
protection floors/systems (%)
Current tobacco smoking, adults aged
15+ (%) m/f
% of students (13 - 15 yrs) who currently
smoke cigarettes on 1+ days during the
past 30 days
48.7
15.9 (27.2/5.6)
Proportion of the population
covered by all vaccines
included in their national
programme - MCV1 (%)
95.00 Proportion of young men/young women aged
18 - 29 who experienced sexual violence by aged
18 (%)
Proportion of the population
practicing open defecation (%)
7.05 Overweight, adolesents aged 13 - 15 (%)
m/f
Obesity, adolescents aged 13 -15 (%) m/f
20 (17.6/22.4)
2.2 (1.5/2.9)
Proportion of the population
covered by all vaccines
included in their national
programme - DPT3 (%)
96.00 Proportion and number of children aged 5 - 17
years engaged in child labour (%)
0.00 % of students (13 - 15) who actually
attempted suicide 1 or more times
during the past 12 months
33.9 (30.8/35.9)
Neonatal mortality rate
(deaths per 1,000 live births)
IMR
16
20.6
Students aged 13 - 15 years reporting bullying
(1+ times) or physical fights (1+) within the
previous 12 months (%)
71.1 (76.5/65.8) Youth unemployment rate
Adult unemployment rate
NEET rate (15 - 24 year olds)
20.9
9.5
29.1
Proportion of births attended
by skilled health personel (%)
Maternal mortality ratio
100
0
ECE NER (2016) (m/f) 81.4/80.83 Proportion of children under 5 years whose
births have been registered with a civil
authority (%)
88.00 GER data for tertiary education
Tuvalu
Population share
(0 - 17 years):
36%
Proportion children at the
lower end of secondary (Year
8) achieving at least a
minimum proficiency level in
mathematics (%)
11.00
Proportion children at the
lower end of secondary (Year
8) achieving at least a
minimum proficiency level in
reading (%)
50.00
Non-contributory programmes reaching at-risk
children and youth: 2/2
Non-contributory health insurance;
Educational fee waiver
Priority child and youth development issues:
Prevalence of schoolage & adolescent
overweight & obesity
Early childhood education
Access to secondary education
Quality of secondary education (literacy and
numeracy)
Data on violence against children
Data on sexual violence and VAWG
Student bullying
Child marriage (below global av.)
Birth registration
Provide access to drinking water and
handwashing facilities in schools
Open defecation
Data on social protection
Harmful consumption of alcohol
Tobacco smoking
Adolescent mental health
Youth unemployment (NEET focus)
Data on tertiary education enrolment

PROGRESS AGAINST SDGS FOR CHILD AND YOUTH WELL-BEING
Priority rating Data sources
No data (SDG rating);
inconsistencies across sources Black font & SDG progress ratings UNICEF, 2018. Progress for Every Child in the SDGs Era Dashboard
Insufficient data trend (SDG rating) Red font UNICEF Pacific, 2017. Situation Analysis of Children in Pacific Island Countries
Acceleration needed (SDG rating) Italic font in black International Policy Centre for Inclusive Growth & UNICEF, 2019. Social Protection Inventory
On track (SDG rating) Black font in bold Pacific Data Hub
Target met (SDG rating) Green font in bold Global Student Health Survey (GSHS)
Worse than global average; issue of
concern Blue font in bold 2019 Ministry of Education &Training Education Statistics Report
Every child survives
and thrives
Progress Every child learns Progress Every child is protected from violence
& exploitation
Progress Every child lives in a clean
and safe environment
Progress Every child has a fair
chance in life
Progress Adolescence and youth Progress
Prevalence of overweight
among schoolage children (%)
31.00 Primary Net Enrolment Rate
(2019) (m/f)
96.5/95.7 Proportion of children aged 1 - 14 who have
experienced physical punishment and/or
psychological agression by caregivers in the past
month (%)
84.00 Proportion of the population
with basic handwashing facility
with soap and water available on
premises (%)
25.21 Children living below the
national poverty line (%)
0 Adolescent fertility rate (women aged 15 -
19 years)
51.20
Prevalence of stunting among
children under 5 (%)
28.50 Secondary Net Enrolment
(2019) Rate (m/f)
40.0/46.7 Proportion of women aged 20 - 24 years who
were married before age 18 (%)
21.4 (above
global av.)
Proportion of the population
using basic sanitation services (%)
34.07 Children living in households
in extreme poverty (%)
0 Harmful use of alcohol, m/f aged 15+
(litres of pure alcohol/capita)
% of students (13 - 15 yrs) who drank
alcohol in the past 30 days
2.25
12.4 (15.4/9.7)
Prevalence of wasting among
children under 5 (%)
4.40 Proportion of women and girls aged 15 - 19
subjected to sexual violence from someone
other than an intimate partner (%)
Proportion of the population
using basic drinking water
services (%)
91.26 Proportion of child
population covered by social
protection floors/systems (%)
Current tobacco smoking, adults aged
15+ (%)
% of students (13 - 15 yrs) who currently
smoke cigarettes on 1+ days during the
past 30 days
24.1
17 (21.2/13.3)
Proportion of the population
covered by all vaccines
included in their national
programme - MCV1 (%)
80.00 Proportion of young men/young women aged
18 - 29 who experienced sexual violence by aged
18 (%)
Proportion of the population
practicing open defecation (%)
0.55 Overweight, adolesents aged 13 - 15 (%)
m/f
Obesity, adolescents aged 13 -15 (%) m/f
14.9 (12.8/16.9)
3.0 (3.7/2.4)
Proportion of the population
covered by all vaccines
included in their national
programme - DPT3 (%)
85.00 Proportion and number of children aged 5 - 17
years engaged in child labour (%)
16.00 % of students (13 - 15 yrs) who actually
attempted suicide 1 or more times during
the past 12 months
24.3
(28.3m, 19.5f)
Neonatal mortality rate
(deaths per 1,000 live births)
IMR
11.39
22.3
Students aged 13 - 15 years reporting bullying
(1+ times) or physical fights (1+) within the
previous 12 months (%)
41.1 (54.4/28.1) Youth unemployment rate
Adult unemployment rate
NEET rate (15 - 24 year olds)
1.2 (2.2m,2.6f)
3.5
26.3
Proportion of births attended
by skilled health personel (%)
Maternal mortality ratio*
89.4
72*
ECE NER (2019) (m/f) 84.0/89.4 Proportion of children under 5 years whose
births have been registered with a civil
authority (%)
77.10 GER data for tertiary education 4.70
* This indicator is below the global average but higher than the Pacific regional average
Proportion children at the
lower end of secondary (Year
8) achieving at least a
minimum proficiency level in
reading (%)
30.40
Proportion children at the
lower end of secondary (Year
8) achieving at least a
minimum proficiency level in
mathematics (%)
43.30Vanuatu
Population share
(0 - 14 years):
38.4%
Population share
(0 - 19 years):
42.1%
Population share
(10 - 19 years):
20.5%
Non-contributory programmes reaching at-risk
children and youth: 1/1
Educational fee waiver
Priority child and youth development issues:
Prevalence of schoolage overweight
Child stunting under 5 years
Maternal mortality
Early childhood education
Quality of secondary education (literacy and
numeracy)
Access to secondary and tertiary education
Violence against children
Data on sexual violence and VAWG
Student bullying
Child marriage - acceleration needed
Child labour
Birth registration - acceleration needed
Access to WASH
Data on social protection
Tobacco smoking (below EAP av.)
Harmful alcohol consumption
Teenage pregnancy
Adolescent mental health
Youth unemployment (NEET focus)

PROGRESS AGAINST SDGS FOR CHILD AND YOUTH WELL-BEING
Priority rating Data sources
No data (SDG rating);
inconsistencies across sources Black font & SDG progress ratings UNICEF, 2018. Progress for Every Child in the SDGs Era Dashboard
Insufficient data trend (SDG rating) Italic font in black International Policy Centre for Inclusive Growth & UNICEF, 2019. Social Protection Inventory
Acceleration needed (SDG rating) Pink font in bold https://www.unfpa.org/data/world-population/
On track (SDG rating) Black font in bold Pacific Data Hub
Target met (SDG rating) Green font in bold Global Student Health Survey (GSHS)
Worse than global average Blue font in bold http://uis.unesco.org/en/country/pw
Every child survives
and thrives
Progress Every child learns Progress Every child is protected from violence
& exploitation
Progress Every child lives in a clean
and safe environment
Progress Every child has a fair
chance in life
Progress Adolescence and youth Progress
Prevalence of overweight
among schoolage children (%)
Prevalence of overweight
among children under 5 (%)
Proportion of children aged 1 - 14 who have
experienced physical punishment and/or
psychological agression by caregivers in the
past month (%)
8.00 Proportion of the population
with basic handwashing facility
with soap and water available on
premises (%)
Schools with basic handwashing
facilities (%)
Children living below the
national poverty line (%)
Adolescent fertility rate (women aged 15 -
19 years)
18
Prevalence of stunting among
children under 5 (%)
Proportion of women aged 20 - 24 years who
were married before age 18 (%)
Proportion of the population
using basic sanitation services (%)
100.00 Children living in households
in extreme poverty (%)
Harmful use of alcohol, m/f aged 15+
(litres of pure alcohol/capita)
7.90
Prevalence of wasting among
children under 5 (%)
Proportion of women and girls aged 15 - 19
subjected to sexual violence from someone
other than an intimate partner (%)
Proportion of the population
using basic drinking water
services (%)
100.00 Proportion of child
population covered by social
protection floors/systems (%)
Current tobacco smoking, adults aged
15+ (%) m/f
23.70
Proportion of the population
covered by all vaccines
included in their national
programme - MCV1 (%)
97.00 Proportion of ever-partnered women and girls
aged 15 - 19 years subjected to physical, sexual
or psychological violence by a currrent or
former intimate partner
8.00 Proportion of the population
practicing open defecation (%)
0.00 Obesity, adolescents aged 10 -19 (%) m/f
Proportion of the population
covered by all vaccines
included in their national
programme - DPT3 (%)
97.00 Proportion and number of children aged 5 - 17
years engaged in child labour (%)
% of students who actually attempted
suicide 1 or more times during the past 12
months
Neonatal mortality rate
(deaths per 1,000 live births)
IMR
9.36
16.6
Students aged 13 - 15 years reporting bullying
(1+ times) or physical fights (1+) within the
previous 12 months (%)
Youth unemployment rate
Adult unemployment rate
NEET rate (15 - 24 year olds)
4.2
4.2
Proportion of births attended
by skilled health personel (%)
Maternal mortality ratio
100
0
Pariticpation rate in
organised learning 1 year
before the official primary
entry age
Pre-primary (3 - 5 yrs) NER
(m/f)
90.4
66.2/77.5
Proportion of children under 5 years whose
births have been registered with a civil authority
(%)
GER for tertiary education (m/f)
Youth literacy rate (15 - 24 yrs) (m/f)
43.9/66.4
98.2/99.2
Palau
Population share
(0 - 17 years):
35.6%
Primary Net Enrolment Rate
Secondary Net Enrolment
Rate (m/f)
94.9
-
Proportion children at the
lower end of secondary (Year
8) achieving at least a
minimum proficiency level in
mathematics (%)
96.00
Proportion children at the
lower end of secondary (Year
8) achieving at least a
minimum proficiency level in
reading (%)
96.00
Non-contributory programmes reaching at-risk
children and youth: 1/1
Deverly disabled assistance fund
Priority child and youth development issues:
Data on child and adolescent nutrition
Early childhood education
Data on access to secondary education
Data on violence against women and girls
Data on child protection including birth
registration
Data on social protection
Harmful use of alcohol
Tobaco smoking
Data on adolescent mental health