sd health department - 2010 vital statistics report...
TRANSCRIPT

53
Mortality
Table 42
Resident Deaths, Crude Death Rates, and Age-Adjusted Death Rates,
South Dakota and United States, 2000-2010
United States South Dakota
Year
Number
Crude
Rate
Age-Adjusted
Rate Number
Crude
Rate
Age-Adjusted
Rate
2010 *2,465,932 *798.7 *746.2 7,087 870.4 713.4
2009 *2,437,163 *794.5 *749.6 6,913 851.1 688.6
2008 2,471,984 813.0 758.3 7,056 877.0 712.1
2007 2,423,712 803.6 760.2 6,800 853.2 695.1
2006 2,426,264 810.4 776.5 7,038 892.6 732.6
2005 2,448,017 825.9 798.8 7,074 906.8 758.0
2004 2,397,615 816.5 800.8 6,811 879.7 742.3
2003 2,448,288 841.9 832.7 7,109 926.9 787.1
2002 2,443,387 847.3 845.3 6,886 903.5 771.8
2001 2,416,425 848.5 854.5 6,915 911.1 786.2
2000 2,403,351 854.0 869.0 7,014 929.2 804.8
Beginning with the 2010 data, race is now
assigned based on standards set forth by the
National Center for Health Statistics and the US
Census Bureau in order for South Dakota’s race
data to be comparable to other areas. Race is no
longer allocated as it had been since the 2000
Census started allowing multiple races to be
reported. All race data in this section are now
categorized in the following manner:
Single-race White
Single-race American Indian
The remaining categories (Single-race Black,
Single-race Asian, Single-race Pacific Islander,
and Two or more races) are included in the
totals, but are not shown specifically in any
tables.
Table 42, below, displays the deaths, crude death
rates, and age-adjusted death rates for the United
States and South Dakota for the past 11 years.
An Overview: 2010
Total South Dakota Resident Deaths 7,087
Crude Death Rates per 100,000 Population
South Dakota 870.4
United States (Provisional) 798.7
Age-Adjusted Death Rates per 100,000
Population
South Dakota 713.4
United States (Provisional) 746.2
Age-Adjusted YPLL Before Age 75 per
100,000 Population
Whites 5,353
American Indians 18,296
Note: *U.S. 2009 and 2010 data are provisional Crude death rates are per 100,000 population.
Age-adjusted rates are computed with the 2000 standard.
Source: National Center of Health Statistics South Dakota Department of Health, Office of Health Statistics

54
Heart disease was the second leading
cause of death for the first time in 2010
and accounted for 22.7 percent of South
Dakota resident deaths, an 11.7 percent
decrease from 2009.
Chronic lower respiratory disease
accounted for 6.4 percent of 2010 South
Dakota resident deaths, an increase of 6.7
percent from 2009. Chronic lower
respiratory diseases include emphysema,
asthma, and bronchitis.
Cerebrovascular diseases accounted for
5.8 percent of 2010 South Dakota
resident deaths, a decrease of 9.4 percent
from 2009. Stroke, not specified as
hemorrhage or infarction, caused the
majority of the deaths for this type of
disease.
Alzheimer’s disease caused 5.7 percent
of all South Dakota resident deaths in
2010. Alzheimer’s was the fifth leading
cause of death in 2009.
Leading Causes of Death
The five leading causes of death in 2010
for South Dakota residents were cancer,
heart disease, chronic lower respiratory
diseases, cerebrovascular diseases, and
Alzheimer’s disease.
Cancer deaths replaced heart disease for
the first time as the leading cause of death
in South Dakota accounting for 23.3
percent of South Dakota’s 2010 resident
deaths. This is an increase of 6.9 percent
from 2009. Cancer was the leading cause
of death for all South Dakota residents
regardless of race. This was also true for
males; however females’ leading cause of
death in 2010 remained heart disease.
Trachea, bronchus, and lung cancer were
the leading cause of cancer deaths during
the year, accounting for 26.3 percent of
cancer deaths.
Figure 7, below, compares the crude
death rates of South Dakota resident heart
disease and cancer since 2000. Over the
past 11 years, the crude death rate for
heart disease has been decreasing while
the crude death rate for cancer has
remained fairly steady.
Note: The crude death rate is calculated using yearly U.S. Census Bureau population estimates for that year. Source: South Dakota Department of Health, Office of Health Statistics
278.9261.4
253.6253.2
229.2 226.1221.0
203.6 208.4218.9
197.9
212.5 210.5204.8
214.5201.3 206.4 198.0 201.5
194.0 185.4
202.8
0.0
50.0
100.0
150.0
200.0
250.0
300.0
2000 2001 2002 2003 2004 2005 2006 2007 2008 2009 2010
C
r
u
d
e
D
e
a
t
h
R
a
t
e
Year of Death
Figure 7
South Dakota Resident Crude Death Rate Due to Malignant Neoplasms and Heart
Disease by Year of Death, 2000-2010
Heart Disease
Malignant Neoplasms
55
Source: South Dakota Department of Health, Office of Health Statistics
Total
Year of Death
2006 2007 2008 2009 2010
Total Deaths 1,911 443 357 372 348 391
Motor Vehicle Accidents 730 186 145 125 133 141
Car Occupant..………………………….…..................….(V40-V49) 388 99 68 66 84 71
Occupant of Pick-Up Truck or Van………….........…..….(V50-V59) 121 39 26 16 16 24
Pedestrian……………………………………...……...…..(V01-V09) 64 12 17 15 6 14
Motorcycle Rider…...………………………..…..……......(V20-V29) 62 12 16 9 12 13
Occupant of Special All-Terrain Vehicle……….........…….…..(V86) 28 4 7 6 4 7
Occupant of Heavy Transport Vehicle…..…………….….(V60-V69) 13 6 2 1 1 3
All Other Motor Vehicle Accidents 54 14 9 12 10 9
Other Causes of Accidental Death 1,181 257 212 247 215 250
Falls…………………………………………………..….(W00-W19) 627 141 130 124 102 130
Accidental Poisoning ………………………………..…...(X40-X49) 155 29 20 41 34 31
Accidental Threats to Breathing (excl. drowning)............(W75-W84) 69 19 9 11 16 14
Exposure to Smoke, Fire, and Flames………..........…….( X00-X09) 56 12 8 16 11 9
Accidental Drowning and Submersion…...….(W65-W74, V90, V92) 46 12 7 8 8 11
Exposure to Excessive Natural Cold…….……………...….......(X31) 42 6 6 9 8 13
Accidental Discharge of Firearms……….…….…….......(W32-W34) 15 2 2 3 4 4
Air Transport Accidents…(V95.0-V95.3, V95.8-V95.9, & V96-V97) 11 1 3 1 3 3
Contact with Agricultural Machinery….....….….………....…..(W30) 7 3 1 1 0 2
Exposure to Excessive Natural Heat…………………………. (X30) 6 1 4 0 0 1
All Other Causes of Accidents 147 31 22 33 29 32
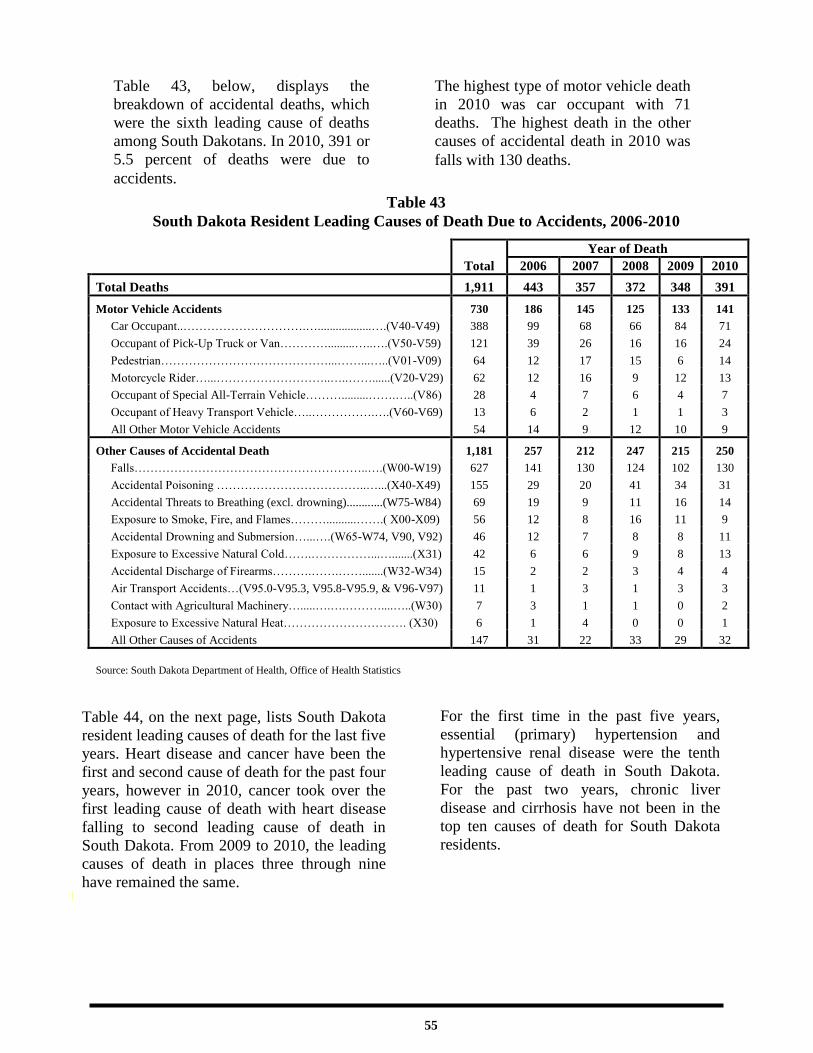
Table 44, on the next page, lists South Dakota
resident leading causes of death for the last five
years. Heart disease and cancer have been the
first and second cause of death for the past four
years, however in 2010, cancer took over the
first leading cause of death with heart disease
falling to second leading cause of death in
South Dakota. From 2009 to 2010, the leading
causes of death in places three through nine
have remained the same. ecords
Table 43, below, displays the
breakdown of accidental deaths, which
were the sixth leading cause of deaths
among South Dakotans. In 2010, 391 or
5.5 percent of deaths were due to
accidents.
The highest type of motor vehicle death
in 2010 was car occupant with 71
deaths. The highest death in the other
causes of accidental death in 2010 was
falls with 130 deaths.
Table 43
South Dakota Resident Leading Causes of Death Due to Accidents, 2006-2010
For the first time in the past five years,
essential (primary) hypertension and
hypertensive renal disease were the tenth
leading cause of death in South Dakota.
For the past two years, chronic liver
disease and cirrhosis have not been in the
top ten causes of death for South Dakota
residents.

Cause of Death
Total 2006 2007 2008 2009 2010
Rank Deaths Percent Rank Deaths Percent Rank Deaths Percent Rank Deaths Percent Rank Deaths Percent Rank Deaths Percent
South Dakota (All Deaths) 34,894 100.0 7,038 100.0 6,800 100.0 7,056 100.0 6,913 100.0 7,087 100.0
Heart Disease
………...(I00-I09, I11, I13, I20-I51) 1 8,432 24.2 1 1,743 24.8 1 1,623 23.9 1 1,677 23.8 1 1,778 25.7 2 1,611 22.7
Malignant Neoplasms (Cancer)………………...(C00-C97)
2 7,885 22.6 2 1,561 22.2 2 1,606 23.6 2 1,561 22.1 2 1,506 21.8 1 1,651 23.3
Chronic Lower Respiratory
Diseases………………...(J40-J47) 3 2,210 6.3 5 375 5.3 3 458 6.7 3 486 6.9 3 440 6.0 3 451 6.4
Cerebrovascular Diseases
...........................................(I60-I69) 4 2,064 5.9 4 437 6.2 4 408 6.0 5 391 5.5 4 417 6.4 4 411 5.8
Accidents
……………...(V01-X59, Y85-Y86) 5 1,911 5.5 3 443 6.3 5 357 5.3 6 372 5.3 6 348 5.0 6 391 5.5
Alzheimer’s Disease
...………...…………………..(G30) 6 1,879 5.4 6 330 4.7 6 345 5.1 4 401 5.7 5 402 5.8 5 401 5.7
Diabetes Mellitus
…………..…………….(E10-E14) 7 1,164 3.3 7 261 3.7 7 246 3.6 7 216 3.1 7 200 2.9 7 241 3.4
Influenza and Pneumonia
………………………….(J09-J18) 8 849 2.4 8 173 2.5 8 189 2.8 8 186 2.6 8 135 2.0 8 166 2.3
Intentional Self-Harm (Suicide)
………….(*U03, X60-X84, Y87.0) 9 616 1.8 9 125 1.8 9 101 1.5 9 123 1.7 9 128 1.9 9 139 2.0
Chronic Liver Disease and
Cirrhosis……….(K70 & K73-K74) 10 439 1.3 10 83 1.2 10 94 1.4 10 100 1.4 * * * * * *
Essential (Primary) Hypertension
and Hypertensive Renal Disease
………………………...(I10 & I12)
* * * * * * * * * * * * * * * 10 93 1.3
Nephritis, Nephrotic Syndrome, and
Nephrosis…………………………
…(N00-N07, N17-N19, N25-N27) * * * * * * * * * * * * 10 99 1.4 * * *
All Other Causes 1,507 21.4 1,373 20.2 1,543 21.9 1,460 21.1 1,532 21.6
Table 44
South Dakota Resident Leading Causes of Death, 2006-2010
56
Note: Letter/number combinations following cause of death are ICD-10 codes.
Due to rounding disease-specific percentages may not sum to 100.
*This cause was not one of the ten leading causes of death for that year. The asterisks (*) preceding the cause-of-death codes indicate that they are not part of the International Classification of Diseases, Tenth Revision.
Source: South Dakota Department of Health, Office of Health Statistics

57
Table 45
South Dakota Resident Leading Causes of Death by Race, 2010
All Races White American Indian Cause of Death Rank Deaths Percent Rank Deaths Percent Rank Deaths Percent
South Dakota (All Deaths) 7,087 100.0 6,471 100.0 534 100.0
Malignant Neoplasms (Cancer)….(C00-C97)
1 1,651 23.3 1 1,553 24.0 1 84 15.7
Heart Disease…..(I00-I09, I11, I13, I20-I51)
2 1,611 22.7 2 1,525 23.6 2 76 14.2
Chronic Lower Respiratory Diseases
…………………………………….(J40-J47) 3 451 6.4 3 427 6.6 7 16 3.0
Cerebrovascular Diseases…………(I60-I69)
4 411 5.8 5 394 6.1 9 13 2.4
Alzheimer’s Disease………………….(G30) 5 401 5.7 4 396 6.1 * * *
Accidents…………… (V01-X59, Y85-Y86) 6 391 5.5 6 308 4.8 3 73 13.7
Diabetes Mellitus……………...…(E10-E14) 7 241 3.4 7 188 2.9 4 51 9.6
Influenza and Pneumonia………....(J09-J18) 8 166 2.3 8 154 2.4 * * *
Intentional Self-Harm (Suicide)
……………………(*U03, X60-X84, Y87.0) 9 139 2.0 9 110 1.7 6 23 4.3
Essential (Primary) Hypertension and
Hypertensive Renal Disease………(I10, I12) 10 93 1.3 10 87 1.3 * * *
Chronic Liver Disease and Cirrhosis
………………………..…(K70 & K73-K74) * * * * * 5 30 5.6
Septicemia….……......................( A40-A41) * * * * * 8 14 2.6
Nephritis, Nephrotic Syndrome, and
Nephrosis…(N00-N07, N17-N19, N25-N27) * * * * * 10 12 2.2
All Other Causes - 1,532 21.6 - 1,329 20.5 - 142 26.6
Race
Table 45, below, presents South Dakota
resident leading causes of death by race.
In 2010, patterns for the 10 leading
causes of death varied by race. Seven of
the 10 leading causes were the same for
whites and American Indians, but they
differed by rank. For example, accidents
were the sixth leading cause of death at
4.8 percent for the white population, but
the third leading cause of death for the
American Indian population at 13.7
percent. Alzheimer’s disease was in the
Alzheimer’s disease was in the 10 leading
causes of death for the white population,
but not the American Indian population.
Among the 10 leading causes of death for
the American Indian population, but not for
the white population were chronic liver
disease and cirrhosis, nephritis, nephrotic
syndrome and nephrosis, and septicemia.
Intentional self-harm (suicide) went from
being ranked as a fourth leading cause of
death in 2009 down to the sixth leading
cause of death in 2010 for American
Indians.
Note: Letter / number combinations following cause of death are ICD-10 codes. Due to rounding, disease-specific percentages may not sum to 100.
* This cause was not one of the ten leading causes of death for this race group.
The asterisks (*) preceding the cause-of-death codes indicate that they are not part of the International Classification of Diseases, Tenth Revision. Source: South Dakota Department of Health, Office of Health Statistics
Gender
In 2010, patterns for the 10 leading
causes of death also varied by gender in
South Dakota (Table 46, on the next
page). Eight of the 10 leading causes
were the same for South Dakota’s men
and women, but they differed in rank.
Intentional self-harm (suicide) and
chronic liver disease and cirrhosis were
among the 10 leading causes of death for
South Dakota’s men, but not for women.

58
Likewise, unspecified dementia, and
essential (primary) hypertension and
hypertensive renal disease were among
the 10 leading causes of death for South
Dakota’s women, but not for South
Dakota’s men. Men were also more
likely to die in accidents than women
were, while women were more likely to
Table 46
South Dakota Resident Leading Causes of Death by Gender, 2010
Total Male Female Cause of Death Rank Deaths Percent Rank Deaths Percent Rank Deaths Percent
South Dakota (All Deaths) 7,087 100.0 3,552 100.0 3,535 100.0
Malignant Neoplasms (Cancer)….(C00-C97) 1 1,651 23.3 1 886 24.9 2 765 21.6
Heart Disease…..(I00-I09, I11, I13, I20-I51) 2 1,611 22.7 2 817 23.0 1 794 22.5
Chronic Lower Respiratory Diseases
…………………………………….(J40-J47) 3 451 6.4 4 255 7.2 5 196 5.5
Cerebrovascular Diseases…………(I60-I69) 4 411 5.8 5 154 4.3 4 257 7.3
Alzheimer’s Disease………………….(G30) 5 401 5.7 6 117 3.3 3 284 8.0
Accidents…………… (V01-X59, Y85-Y86) 6 391 5.5 3 257 7.2 6 134 3.8
Diabetes Mellitus……………...…(E10-E14) 7 241 3.4 7 117 3.3 7 124 3.5
Influenza and Pneumonia………....(J09-J18) 8 166 2.3 9 73 2.1 8 93 2.6
Intentional Self-Harm (Suicide)
……………………(*U03, X60-X84, Y87.0) 9 139 2.0 8 101 2.8 * * *
Essential (Primary) Hypertension and
Hypertensive Renal Disease……...I10, I12) 10 93 1.3 * * * 9 59 1.7
Chronic Liver Disease and Cirrhosis
………………………..…(K70 & K73-K74) * * * 10 51 1.4 * * *
Unspecified Dementia…………...……(F03) * * * * * * 10 56 1.6
All Other Causes - 1,532 21.6 - 724 20.4 - 773 21.9
Note: Letter / number combinations following cause of death are ICD-10 codes.
Due to rounding, disease-specific percentages may not sum to 100.
* This cause was not one of the ten leading causes of death for this gender. The asterisks (*) preceding the cause-of-death codes indicate that they are not part of the International Classification of Diseases,
Tenth Revision.
Source: South Dakota Department of Health, Office of Health Statistics
die from Alzheimer’s disease than men.
Overall, cancer moved to the leading
cause of death for South Dakota residents
in 2010, however, heart disease remained
the primary cause of death among
women.
Age
Table 47, on the next page, lists the five
leading causes of death by age group.
Excluding infants, accidents were the
leading cause of death for South Dakotans
through age 44. The leadingthe cause of
The leading cause of death for persons
45-84 was cancer. Heart disease was the
leading cause of death for persons aged
85 and older.

59
Table 47
South Dakota Resident Five Leading Causes of Death by Age Group, 2010
Rank All Ages 1-24 25-34 35-44 45-54 55-64 65-74 75-84 85-94 95 & Over
1 Malignant
Neoplasms
(Cancer)
1,651
Accidents
48
Accidents
45
Accidents
36
Malignant
Neoplasms
(Cancer)
117
Malignant
Neoplasms
(Cancer)
276
Malignant
Neoplasms
(Cancer)
383
Malignant
Neoplasms
(Cancer)
493
Heart
Disease
582
Heart
Disease
181
2 Heart Disease
1,611
Intentional
Self-Harm
(Suicide)
35
Intentional
Self-Harm
(Suicide)
22
Intentional
Self-Harm
(Suicide)
22
Heart
Disease
53
Heart
Disease
170
Heart
Disease
185
Heart
Disease
409
Malignant
Neoplasms
(Cancer)
315
Alzheimer’s
Disease
77
3 Chronic
Lower
Respiratory
Diseases
451
Heart
Disease
6
** # Accidents
48
Accidents
38
Chronic
Lower
Respiratory
Diseases
103
Chronic
Lower
Respiratory
Diseases
160
Alzheimer’s
Disease
205
Malignant
Neoplasms
(Cancer)
40
4 Cerebro-
vascular
Diseases
411
* ** # Intentional
Self-Harm
(Suicide)
28
Diabetes
Mellitus
33
Diabetes
Mellitus
50
Cerebro-
vascular
Diseases
123
Cerebro-
vascular
Diseases
171
Cerebro-
vascular
Diseases
39
5 Alzheimer’s
Disease
401
* *** Chronic
Liver
Disease and
Cirrhosis
12
Chronic
Liver
Disease and
Cirrhosis
27
^ Cerebro-
vascular
Diseases
36
Alzheimer’s
Disease
95
Chronic
Lower
Respiratory
Diseases
125
Influenza and
Pneumonia
30
* Note: The following causes tied for fourth place with 5 deaths: Congenital Malformations, Deformations, and Chromosomal Abnormalities and
Malignant Neoplasms (Cancer)
**The following causes tied for third place with 7 deaths: Assault (Homicide) and Heart Disease *** The following causes tied for fifth place with 5 deaths: Ill-defined and Unknown Causes of Mortality and Diabetes Mellitus
# The following causes tied for third place with 18 deaths: Heart Disease and Malignant Neoplasms (Cancer)
^ The following causes tied for fifth place with 29 deaths: Chronic Lower Respiratory Diseases and Cerebrovascular Diseases Source: South Dakota Department of Health, Office of Health Statistics
Median Age
Figure 8, below, presents data on the
median age at death for the 10 leading
causes of death for South Dakota
residents in 2010. The median age for
residents 111
accidents went from 50 in 2009 to 57 in
2010. Intentional self-harm (suicide)
went from 34 in 2009 to 42 in 2010.
Source: South Dakota Department of Health, Office of Health Statistics
75
8479
8590
57
78
88
42
86
0
20
40
60
80
100
C ancer C hronic Lowe r Re spi ratory Dise ase s Alz he ime r's Dise ase Dia be te s Mel li tus Intentiona l Se lf-Harm (suic ide)
Figure 8
Median Age at Death for South Dakota Residents for the Leading Causes of Death, 2010
Alzheimer ’s
Disease
Influenza &
Pneumonia
Cerebro-
vascular
Disease
Heart
Disease
Chronic
Lower
Respiratory
Diseases
Diabetes
Mellitus
Essential (Primary)
Hypertension and
Hypertensive Renal
Disease
Accidents Malignant
Neoplasms
(Cancer)
Intentional
Self-Harm
(Suicide)

60
Table 48
Median Age at Death for South Dakota Residents for the Leading Causes of Death
by Race and Gender, 2010
Median Age at Death in Years
All Race Gender
Cause of Death Total
Deaths
White
American
Indian
Male
Female
South Dakota (All Deaths) 80 81 58 77 84
Malignant Neoplasms (Cancer) (C00-C97) 75 75 68 74 76
Heart Disease (I00-I09, I11, I13, I20-I51) 84 84 64 80 88
Chronic Lower Respiratory Diseases (J40-J47) 79 80 75 80 79
Cerebrovascular Diseases (I60-I69) 85 85 81 83 87
Alzheimer’s Disease (G30) 90 90 * 87 90
Accidents (V01-X59, Y85-Y86) 57 68 37 53 71
Diabetes Mellitus (E10-E14) 78 80 66 74 80
Influenza and Pneumonia (J09-J18) 88 88 * 87 88
Intentional Self-Harm (Suicide) (*U03, X60-X84, Y87.0) 42 46 20 42 *
Essential (Primary) Hypertension and Hypertensive
Renal Disease (I10, I12) 86 87 * * 89
Nephritis, Nephrotic Syndrome, and Nephrosis (N00-
N07, N17-N19, N25-N27) * * 64 * *
Chronic Liver Disease and Cirrhosis (K70 & K73-K74) * * 48 55 *
Unspecified Dementia (F03) * * * * 89
Septicemia (A40-A41) * * 59 * *
Note: Letter / number combinations following cause of death are ICD-10 codes.
*This cause was not one of the ten leading causes of death for this race or gender. The asterisks (*) preceding the cause-of-death codes indicate that they are not part of the International Classification of Diseases,
Tenth Revision.
Source: South Dakota Department of Health, Office of Health Statistics
Table 48, below, shows the median age at
death for South Dakota residents from the
leading causes of death by race and
gender. In 2010, the median age at death
was 80 for all South Dakotans; for white
residents the median age was 81,
compared to 58 for American Indians.
The overall median age at death stayed
the same for whites and decreased by one
for American Indians when compared to
their overall median age at death in 2009.
The median age at death in 2010 for
South Dakota resident males and females
was 77 and 84, respectively. For both
males and females, the median age at
death increased by one year from 2009 to
2010.
Years of Potential Life Lost
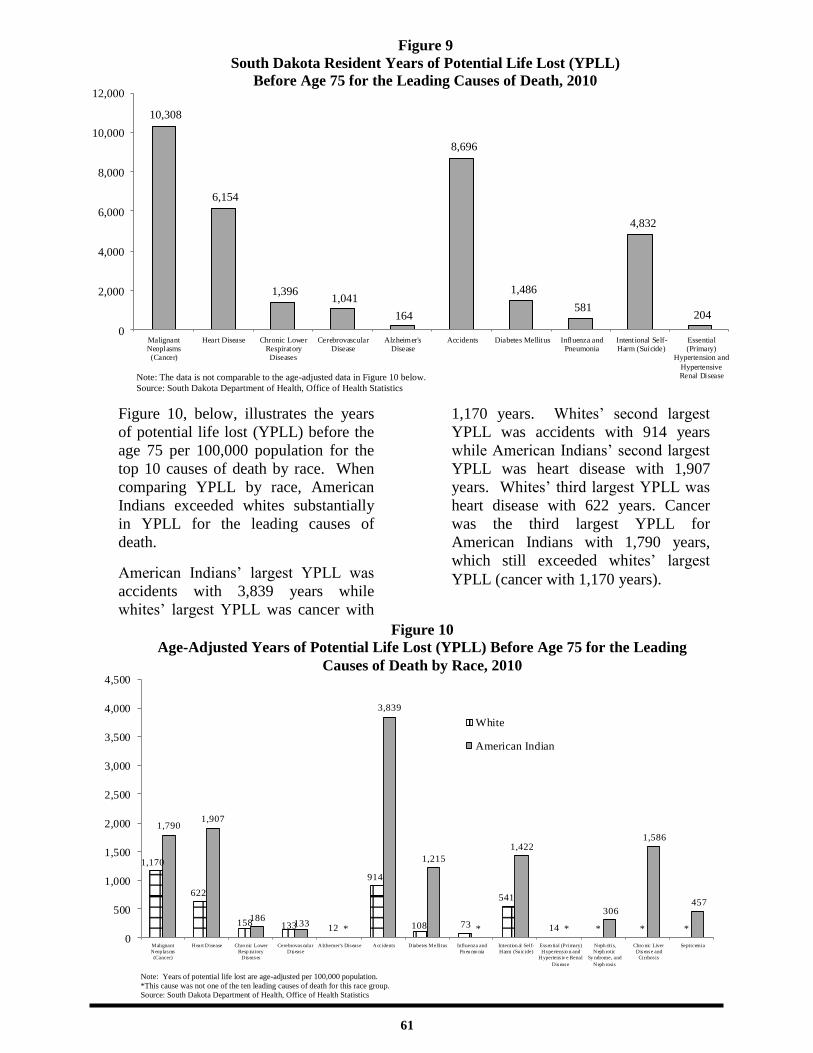
Figure 9, on the next page, depicts the
years of potential life lost (YPLL)
before age 75 for each of these causes.
Cancer led in YPLL (10,308 years)
because many of the decedents were at
a relatively young age at the time of
death.
61
Figure 10, below, illustrates the years
of potential life lost (YPLL) before the
age 75 per 100,000 population for the
top 10 causes of death by race. When
comparing YPLL by race, American
Indians exceeded whites substantially
in YPLL for the leading causes of
death.
American Indians’ largest YPLL was
accidents with 3,839 years while
whites’ largest YPLL was cancer with
YPLL
1,170 years. Whites’ second largest
YPLL was accidents with 914 years
while American Indians’ second largest
YPLL was heart disease with 1,907
years. Whites’ third largest YPLL was
heart disease with 622 years. Cancer
was the third largest YPLL for
American Indians with 1,790 years,
which still exceeded whites’ largest
YPLL (cancer with 1,170 years).
1,170
622
158 133 12
914
108 73
541
14 * * *
1,7901,907
186133
*
3,839
1,215
*
1,422
*
306
1,586
457
0
500
1,000
1,500
2,000
2,500
3,000
3,500
4,000
4,500
Malignant
Neop lasms
(Cancer)
Heart Disease Chro nic Lower
Resp iratory
Diseases
Cerebrovascular
Disease
Alzhemer's Disease Accidents Diabetes Mellitus Influenza and
Pn eu mo nia
Intention al Self-
Harm (Su icide)
Essen tial (Primary)
Hypertens io n and
Hypertens iv e Renal
Disease
Neph ritis,
Neph rotic
Sy ndrome, and
Neph rosis
Chro nic Liver
Disease and
Cirrhos is
Septicemia
White
American Indian
Figure 10
Age-Adjusted Years of Potential Life Lost (YPLL) Before Age 75 for the Leading
Causes of Death by Race, 2010
Note: Years of potential life lost are age-adjusted per 100,000 population.
*This cause was not one of the ten leading causes of death for this race group.
Source: South Dakota Department of Health, Office of Health Statistics
10,308
6,154
1,396 1,041
164
8,696
1,486
581
4,832
204
0
2,000
4,000
6,000
8,000
10,000
12,000
MalignantNeoplasms(Cancer)
Heart Disease Chronic LowerRespiratoryDiseases
CerebrovascularDisease
Alzheimer'sDisease
Accidents Diabetes Mellitus Influenza andPneumonia
Intentional Self-Harm (Suicide)
Essential(Primary)
Hypertension and
HypertensiveRenal DiseaseNote: The data is not comparable to the age-adjusted data in Figure 10 below.
Source: South Dakota Department of Health, Office of Health Statistics
Figure 9
South Dakota Resident Years of Potential Life Lost (YPLL)
Before Age 75 for the Leading Causes of Death, 2010

62
On the death certificate, the certifier
was instructed to check “yes” or
“probably” if in their opinion, the use
of tobacco contributed to death or
check “no” if in their clinical
judgment tobacco use did not
contribute to the death. There was
also the option of “unknown” if the
certifier was unsure if tobacco use
contributed to death. On 1,205
Note: The asterisks (*) preceding the cause of death codes indicate they are not part of the International Classification of Diseases, Tenth Revision.
The place of death data may not add to the total due to unknown places not being specified, but being included in the total. Source: South Dakota Department of Health, Office of Health Statistics
Tobacco Use
Total Hospital
Nursing
Home/Long
Term
Care/Hospice
Facility Residence
All Other
Reported
Entries
Cause of Death Num % Num % Num % Num % Num %
South Dakota (All Deaths) 7,087 100.0 2,564 36.2 2,898 40.9 1,329 18.8 291 4.1
Malignant Neoplasms (Cancer)…..…..(C00-C97) 1,651 100.0 535 32.4 651 39.4 434 26.3 30 1.8
Heart Disease……….(I00-I09, I11, I13, I20-I51) 1,611 100.0 565 35.1 612 38.0 395 24.5 36 2.2
Chronic Lower Resiratory Diseases..….(J40-J47) 451 100.0 176 39.0 194 43.0 74 16.4 7 1.6
Cerebrovascular Diseases………..….…(I60-I69) 411 100.0 170 41.4 213 51.8 26 6.3 2 0.5
Alzheimer’s Disease………………………(G30) 401 100.0 33 8.2 346 86.3 19 4.7 3 0.7
Accidents…………...…….(V01-X59, Y85-Y86) 391 100.0 162 41.4 47 12.0 45 11.5 137 35.0
Diabetes Mellitus……………………..(E10-E14) 241 100.0 76 31.5 112 46.5 49 20.3 4 1.7
Influenza and Pneumonia ……........…..(J09-J18) 166 100.0 82 49.4 73 44.0 11 6.6 0 0.0
Intentional Self-Harm (Suicide)
…………………...……(*U03, X60-X84, Y87.0) 139 100.0 21 15.1 0 0.0 85 61.2 33 23.7
Essential (primary) Hypertension and Hypertensive
Renal Disease……………………….. (I10 & I12) 93 100.0 24 25.8 51 54.8 17 18.3 1 1.1
All Other Causes 1,532 100.0 720 47.0 599 39.1 174 11.4 38 2.5
deaths, or 17.0 percent, the certifier
indicated “yes” or “probably” that
tobacco use contributed to the death.
Conversely, on 3,976 deaths, or 56.1
percent, the certifier indicated that
tobacco use did not contribute to the
death.
In the remaining 1,906 deaths, or 26.9
percent, the certifier was unsure if
tobacco use contributed to the death.
Place of Death
Table 49, below, displays the 10
leading causes of death by place
where death occurred in 2010.
Overall, nursing home, long term
cares c re
care, and hospice facility had the
highest occurrence of deaths with 40.9
percent. Hospital followed closely with
36.2 percent.
Table 49
South Dakota Resident Deaths by Cause of Death and Place of Death, 2010

63
Table 50
South Dakota Resident Leading Causes of Death as They Relate to Tobacco Use, 2010
(Did Tobacco Use Contribute to Death)
Cause of Death
Yes/Probably Total Deaths
Number Percent Number Percent
Total 1,205 17.0 7,087 100.0
Malignant Neoplasms (cancer)………………….(C00-C97) 441 26.7 1,651 100.0
Trachea, Bronchus, and Lung…………....(C33-C34) 317 73.0 434 100.0
Colon, Rectum, Anus.................................(C18-C21) 12 7.1 168 100.0
Lip, Oral Cavity, and Pharynx…………...(C00-C14) 12 57.1 21 100.0
Bladder………………………………………...(C67) 11 29.7 37 100.0
Esophagus……………………………….…….(C15) 10 22.2 45 100.0
Chronic Lower Respiratory Diseases…………...(J40-J47) 294 65.2 451 100.0
Emphysema…………………………………....(J43) 22 68.8 32 100.0
Heart Disease…………………..(I00-I09, I11, I13, I20-I51) 223 13.8 1,611 100.0
Atherosclerotic Heart Disease…………….....(I25.1) 94 17.3 544 100.0
Acute Myocardial Infarction………………(I21-I22) 70 13.1 534 100.0
Atherosclerotic Cardiovascular Disease……..(I25.0) 13 28.3 46 100.0
Cerebrovascular Diseases.......................................(I60-I69) 35 8.5 411 100.0
Diabetes Mellitus...................................................(E10-E14) 32 13.3 241 100.0
Influenza and Pneumonia......................................(J09-J18) 17 10.2 166 100.0
Pneumonia...................................................(J12-J18) 16 9.8 164 100.0
Chronic Liver Disease and Cirrhosis….(K70 & K73-K74) 17 20.5 83 100.0
Alcoholic Liver Disease……………………....(K70) 15 27.3 55 100.0
Accidents...............................................(V01-X59, Y85-Y86) 13 3.3 391 100.0
Alzheimer’s Disease…………………………………...(G30) 10 2.5 401 100.0
Other Interstitial Pulmonary Diseases with
Fibrosis.........................................................................(J84.1) 9 21.4 42 100.0
Source: South Dakota Department of Health, Office of Health Statistics
Method of Disposition
Table 51, on the next page, displays
the different methods of disposition
for the last 10 years. The top
disposition in 2010 was burial with
4,548 deaths. The second highest
method of disposition in 2010 was
cremation with 2,044 deaths.
Table 50, below, displays the 10
leading causes of death where the
certifier said “yes” or “probably” that
tobacco use contributed to the death.
Tobacco use contributed to death in
73.0 percent, or 317 out of the 434
trachea, bronchus, and lung deaths in
trachea, bronchus, and lung cancer
deaths in 2010. In 65.2 percent, or 294
chronic lower respiratory disease deaths
the certifier said “yes” or “probably”
that tobacco use contributed to the
death.
method of disposition in 2010 was
cremation with 2,044 deaths. Since
2001, cremation has increased from
15.9 percent of all dispositions to
28.8 percent in 2010.

64
Table 52a
South Dakota Resident Deaths for 15 Leading Causes and Selected Components, 2000-2010
Leading Causes and Selected Components
Tables 52a-52c, on pages 64 through 67,
display South Dakota resident deaths, the
crude death rate, and the age-adjusted death
rate for 15 leading causes and selected
components from 2000 to 2010.
The crude and age-adjusted rates for all
causes in 2010 were 870.4 and 713.4
respectively, which are up from the crude
and age-adjusted rates in 2009 of 851.0 and
688.6, respectively.
Cause of Death
Number of Deaths
2000 2001 2002 2003 2004 2005 2006 2007 2008 2009 2010
All Causes 7,014 6,915 6,886 7,109 6,811 7,074 7,038 6,800 7,056 6,913 7,087
Malignant Neoplasms (Cancer) 1,604 1,598 1,561 1,645 1,559 1,610 1,561 1,606 1,561 1,506 1,651
Trachea, Bronchus, and Lung 396 414 403 406 423 467 435 425 445 387 434
Colon, Rectum, and Anus 207 179 168 176 151 176 150 165 152 157 168
Female Breast 129 88 109 120 105 117 95 113 118 95 103
Pancreas 82 99 85 95 102 90 89 93 87 110 98
Prostate 101 115 109 106 102 94 103 94 78 84 96
Leukemia 66 72 67 80 71 63 66 76 60 57 82
Heart Disease 2,105 1,984 1,933 1,942 1,775 1,764 1,743 1,623 1,677 1,778 1,611
Chronic Lower Respiratory Diseases 387 360 382 379 393 440 375 458 486 440 451
Type of Disposition
Year Total
Deaths Burial Cremation
Removal
from State Donation Entombment Other
2010 7,087 4,548 2,044 433 47 10 0
2009 6,913 4,545 1,855 464 34 8 0
2008 7,056 4,857 1,662 485 35 9 0
2007 6,800 4,775 1,474 481 46 18 0
2006 7,038 5,127 1,440 431 30 6 0
2005 7,074 5,373 1,515 151 27 7 0
2004 6,811 5,305 1,348 120 22 12 0
2003 7,109 5,675 1,321 76 26 ** 8
2002 6,886 5,627 1,148 72 24 ** 11
2001 6,915 5,700 1,102 79 20 ** 10
Table 51
South Dakota Resident Deaths by Disposition, 2001-2010
Note: Failure of deaths to add to total is due to the disposition not stated. ** Prior to 2004 entombment was included in the other category.
Sharp increase in removal from state from 2005 to 2006 due to clarification of reporting process.
Source: South Dakota Department of Health, Office of Health Statistics

65
Cause of Death
Number of Deaths
2000 2001 2002 2003 2004 2005 2006 2007 2008 2009 2010
Cerebrovascular Diseases 561 491 518 475 463 511 437 408 391 417 411
Alzheimer’s Disease 180 159 169 175 255 289 330 345 401 402 401
Accidents 318 382 344 390 407 396 443 357 372 348 391
Motor Vehicle Accidents 177 187 185 215 185 181 186 145 125 133 141
Diabetes Mellitus 179 210 193 201 227 239 261 246 216 200 241
Influenza and Pneumonia 208 186 239 223 180 242 173 189 186 135 166
Intentional Self-Harm (Suicide) 95 108 94 103 114 123 125 101 123 128 139
Essential (Primary) Hypertension
and Hypertensive Renal Disease 34 39 27 39 55 83 79 70 65 52 93
Unspecified Dementia 108 113 131 152 85 30 74 70 80 90 91
Parkinson’s Disease 56 55 60 56 65 60 75 62 69 65 85
Chronic Liver Disease and Cirrhosis 82 81 77 81 97 83 83 94 100 79 83
Nephritis, Nephrotic Syndrome, and
Nephrosis 130 102 128 131 93 54 60 74 90 99 72
Septicemia 50 69 68 69 42 52 65 64 54 63 66
Cause of Death
Crude Death Rates
2000 2001 2002 2003 2004 2005 2006 2007 2008 2009 2010
All Causes 929.2 911.1 903.5 926.9 879.7 906.8 892.6 853.2 877.0 851.1 870.4
Malignant Neoplasms (Cancer) 212.5 210.5 204.8 214.5 201.3 206.4 198.0 201.5 194.0 185.4 202.8
Trachea, Bronchus, and Lung 52.5 54.5 52.9 52.9 54.6 59.9 55.2 53.3 55.3 47.6 53.3
Colon, Rectum, and Anus 27.4 23.6 22.0 22.9 19.5 22.6 19.0 20.7 18.9 19.3 20.6
Female Breast 33.9 23.0 28.4 31.2 27.0 29.9 24.0 28.3 29.3 23.4 25.3
Pancreas 10.9 13.0 11.2 12.4 13.2 11.5 11.3 11.7 10.8 13.5 12.0
Prostate 27.0 30.5 28.8 27.8 26.4 24.2 26.2 23.7 19.4 20.7 23.6
Leukemia 8.7 9.5 8.8 10.4 9.2 8.1 8.4 9.5 7.5 7.0 10.1
Heart Disease 278.9 261.4 253.6 253.2 229.2 226.1 221.0 203.6 208.4 218.9 197.9
Chronic Lower Respiratory Diseases 51.3 47.4 50.1 49.4 50.8 56.4 47.6 57.5 60.4 54.2 55.4
Table 52b
South Dakota Resident Crude Death Rates for 15 Leading Causes and Selected
Components, 2000-2010
Table 52a (continued)
South Dakota Resident Deaths for 15 Leading Causes and Selected Components, 2000-2010
Source: South Dakota Department of Health, Office of Health Statistics

66
Cause of Death
Age-Adjusted Death Rates
2000 2001 2002 2003 2004 2005 2006 2007 2008 2009 2010
All Causes 804.8 786.2 771.8 787.1 742.3 758.0 732.6 695.1 712.1 688.6 713.4
Malignant Neoplasms (Cancer) 191.4 188.9 182.3 190.0 176.6 180.3 169.6 170.9 164.8 156.5 170.6
Trachea, Bronchus, and Lung 48.0 50.1 48.1 47.6 49.2 52.8 48.0 46.3 47.3 40.7 45.4
Colon, Rectum, and Anus 24.3 20.6 19.0 19.9 16.4 19.4 15.9 17.2 15.9 15.8 17.0
Female Breast 28.1 19.2 24.0 25.9 22.0 23.8 19.2 20.9 23.3 17.6 19.7
Pancreas 9.8 12.0 10.0 10.8 11.6 10.1 9.5 9.8 8.9 11.3 10.2
Prostate 29.3 33.0 31.0 29.6 27.5 24.6 26.7 23.7 19.2 20.3 23.7
Leukemia 7.7 8.4 7.9 9.3 7.8 7.0 7.0 8.1 6.1 6.0 8.6
Heart Disease 234.6 218.9 209.9 207.8 185.8 181.8 175.0 159.5 162.2 168.3 154.9
Chronic Lower Respiratory Diseases 44.1 41.3 42.9 42.5 42.6 47.4 39.3 47.1 49.0 43.9 46.0
Cause of Death
Crude Death Rates
2000 2001 2002 2003 2004 2005 2006 2007 2008 2009 2010
Cerebrovascular Diseases 74.3 64.7 68.0 61.9 59.8 65.5 55.4 51.2 48.6 51.3 50.5
Alzheimer’s Disease 23.8 20.9 22.2 22.8 32.9 37.0 41.9 43.3 49.8 49.5 49.3
Accidents 42.1 50.3 45.1 50.8 52.6 50.8 56.2 44.8 46.2 42.8 48.0
Motor Vehicle Accidents 23.4 24.6 24.3 28.0 23.9 23.2 23.6 18.2 15.5 16.4 17.3
Diabetes Mellitus 23.7 27.7 25.3 26.2 29.3 30.6 33.1 30.9 26.8 24.6 29.6
Influenza and Pneumonia 27.6 24.5 31.4 29.1 23.2 31.0 21.9 23.7 23.1 16.6 20.4
Intentional Self-Harm (Suicide) 12.6 14.2 12.3 13.4 14.7 15.8 15.9 12.7 15.3 15.8 17.1
Essential (Primary) Hypertension
and Hypertensive Renal Disease 4.5 5.1 3.5 5.1 7.1 10.6 10.0 8.8 8.1 6.4 11.4
Unspecified Dementia 14.3 14.9 17.2 19.8 11.0 3.8 9.4 8.8 9.9 11.1 11.2
Parkinson’s Disease 7.4 7.2 7.9 7.3 8.4 7.7 9.5 7.8 8.6 8.0 10.4
Chronic Liver Disease and Cirrhosis 10.9 10.7 10.1 10.6 12.5 10.6 10.5 11.8 12.4 9.7 10.2
Nephritis, Nephrotic Syndrome, and
Nephrosis 17.2 13.4 16.8 17.1 12.0 6.9 7.6 9.3 11.2 12.2 8.8
Septicemia 6.6 9.1 8.9 9.0 5.4 6.7 8.2 8.0 6.7 7.8 8.1
Table 52c
South Dakota Resident Age-Adjusted Death Rates for 15 Leading Causes and Selected
Components, 2000-2010
Note: The crude death rate is calculated using yearly U.S. Census Bureau population estimates for that year.
Source: South Dakota Department of Health, Office of Health Statistics
Table 52b (continued)
South Dakota Resident Crude Death Rates for 15 Leading Causes and Selected
Components, 2000-2010

67
Note: The age-adjusted death rate is calculated using yearly U.S. Census Bureau population estimates for that year. Source: South Dakota Department of Health, Office of Health Statistics
Cause of Death
Age-Adjusted Death Rates
2000 2001 2002 2003 2004 2005 2006 2007 2008 2009 2010
Cerebrovascular Diseases 61.7 52.8 54.4 49.7 47.3 51.6 42.3 38.9 37.6 38.8 39.2
Alzheimer’s Disease 18.7 16.2 16.9 17.3 24.5 27.5 30.0 30.7 35.9 35.2 36.2
Accidents 40.8 47.0 42.8 48.4 49.4 47.2 51.5 40.9 41.8 40.0 44.3
Motor Vehicle Accidents 23.2 24.4 23.8 27.8 23.7 23.0 23.2 17.9 15.1 16.6 17.0
Diabetes Mellitus 20.5 24.0 22.4 22.7 24.8 25.6 26.8 25.5 21.8 20.4 24.6
Influenza and Pneumonia 22.3 19.5 25.1 22.5 18.1 23.7 16.5 18.1 17.3 12.6 15.5
Intentional Self-Harm (Suicide) 12.6 14.4 12.2 13.6 15.0 15.5 15.9 12.3 15.4 16.0 17.3
Essential (Primary) Hypertension
and Hypertensive Renal Disease 3.5 4.1 2.7 3.8 5.6 7.9 7.3 6.6 6.2 4.8 8.8
Unspecified Dementia 11.1 11.3 12.9 14.6 8.0 2.7 6.5 6.2 6.9 7.9 8.3
Parkinson’s Disease 6.2 5.8 6.4 6.0 6.6 6.1 7.5 6.1 6.7 6.2 8.2
Chronic Liver Disease and Cirrhosis 10.9 10.7 10.0 10.2 12.0 10.3 10.2 11.2 11.6 8.7 9.7
Nephritis, Nephrotic Syndrome, and
Nephrosis 14.7 11.0 13.7 13.7 9.9 5.5 6.0 7.2 8.9 9.4 7.1
Septicemia 5.9 7.7 7.6 7.6 4.7 5.6 6.8 6.5 5.5 6.4 6.7
Figure 11, below, displays the crude death
rate for cancer from 2000 through 2010. On
pages 16 through 17, figures 5a through 5f
display the crude death rates for the six
primary types of cancer deaths to South
Dakota residents.
Table 52c (continued)
South Dakota Resident Age-Adjusted Death Rates for 15 Leading Causes and Selected
Components, 2000-2010
212.5 210.5
204.8
214.5
201.3
206.4
198.0
201.5
194.0185.4
202.8
0.0
50.0
100.0
150.0
200.0
250.0
2000 2001 2002 2003 2004 2005 2006 2007 2008 2009 2010
C
r
u
d
e
D
e
a
t
h
R
a
t
e
Year of Death
Figure 11
South Dakota Resident Crude Death Rate Due to Malignant Neoplasms by
Year of Death, 2000-2010
Note: The crude death rate is calculated using yearly U.S. Census Bureau population estimates for that year.
Source: South Dakota Department of Health, Office of Health Statistics

68
52.5
54.5
52.9 52.9
54.659.9
55.2
53.3
55.3
47.6
53.3
0.0
10.0
20.0
30.0
40.0
50.0
60.0
70.0
2000 2001 2002 2003 2004 2005 2006 2007 2008 2009 2010
C
r
u
d
e
D
e
a
t
h
R
a
t
e
Year of Death
Figure 11a
South Dakota Resident Crude Death Rate Due to Trachea, Bronchus,
and Lung Cancer by Year of Death, 2000-2010
Note: The crude death rate is calculated using yearly U.S. Census Bureau population estimates for that year. Source: South Dakota Department of Health, Office of Health Statistics
27.4
23.6
22.0
22.9
19.5
22.6
19.0
20.7
18.9
19.320.6
0.0
5.0
10.0
15.0
20.0
25.0
30.0
2000 2001 2002 2003 2004 2005 2006 2007 2008 2009 2010
C
r
u
d
e
D
e
a
t
h
R
a
t
e Year of Death
Figure 11b
South Dakota Resident Crude Death Rate Due to Colon, Rectum, and Anus
Cancer by Year of Death, 2000-2010
Note: The crude death rate is calculated using yearly U.S. Census Bureau population estimates for that year.
Source: South Dakota Department of Health, Office of Health Statistics
33.9
23.0
28.4
31.2
27.0
29.9
24.0
28.3 29.3
23.4
25.3
0.0
5.0
10.0
15.0
20.0
25.0
30.0
35.0
40.0
2000 2001 2002 2003 2004 2005 2006 2007 2008 2009 2010
C
r
u
d
e
D
e
a
t
h
R
a
t
e
Year of Death
Figure 11c
South Dakota Resident Crude Death Rate Due to Female Breast Cancer
by Year of Death, 2000-2010
Note: The crude death rate is calculated using yearly U.S. Census Bureau population estimates for that year. Source: South Dakota Department of Health, Office of Health Statistics
69
8.7
9.5
8.8
10.4
9.2
8.1 8.4
9.5
7.57.0
10.1
0.0
2.0
4.0
6.0
8.0
10.0
12.0
2000 2001 2002 2003 2004 2005 2006 2007 2008 2009 2010
C
r
u
d
e
D
e
a
t
h
R
a
t
eYear of Death
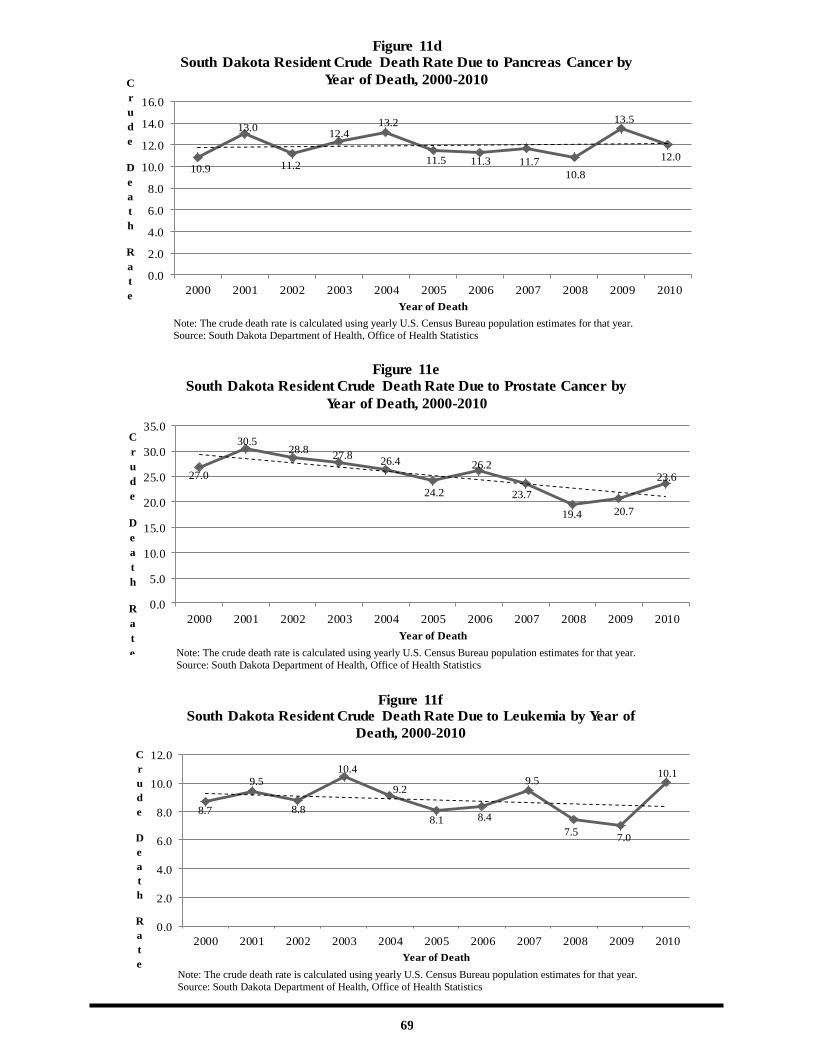
Figure 11f
South Dakota Resident Crude Death Rate Due to Leukemia by Year of
Death, 2000-2010
Note: The crude death rate is calculated using yearly U.S. Census Bureau population estimates for that year.
Source: South Dakota Department of Health, Office of Health Statistics
27.0
30.528.8
27.826.4
24.2
26.2
23.7
19.4 20.7
23.6
0.0
5.0
10.0
15.0
20.0
25.0
30.0
35.0
2000 2001 2002 2003 2004 2005 2006 2007 2008 2009 2010
C
r
u
d
e
D
e
a
t
h
R
a
t
e
Year of Death
Figure 11e
South Dakota Resident Crude Death Rate Due to Prostate Cancer by
Year of Death, 2000-2010
Note: The crude death rate is calculated using yearly U.S. Census Bureau population estimates for that year.
Source: South Dakota Department of Health, Office of Health Statistics
10.9
13.0
11.2
12.413.2
11.5 11.3 11.7
10.8
13.5
12.0
0.0
2.0
4.0
6.0
8.0
10.0
12.0
14.0
16.0
2000 2001 2002 2003 2004 2005 2006 2007 2008 2009 2010
C
r
u
d
e
D
e
a
t
h
R
a
t
eYear of Death
Figure 11d
South Dakota Resident Crude Death Rate Due to Pancreas Cancer by
Year of Death, 2000-2010
Note: The crude death rate is calculated using yearly U.S. Census Bureau population estimates for that year. Source: South Dakota Department of Health, Office of Health Statistics

70
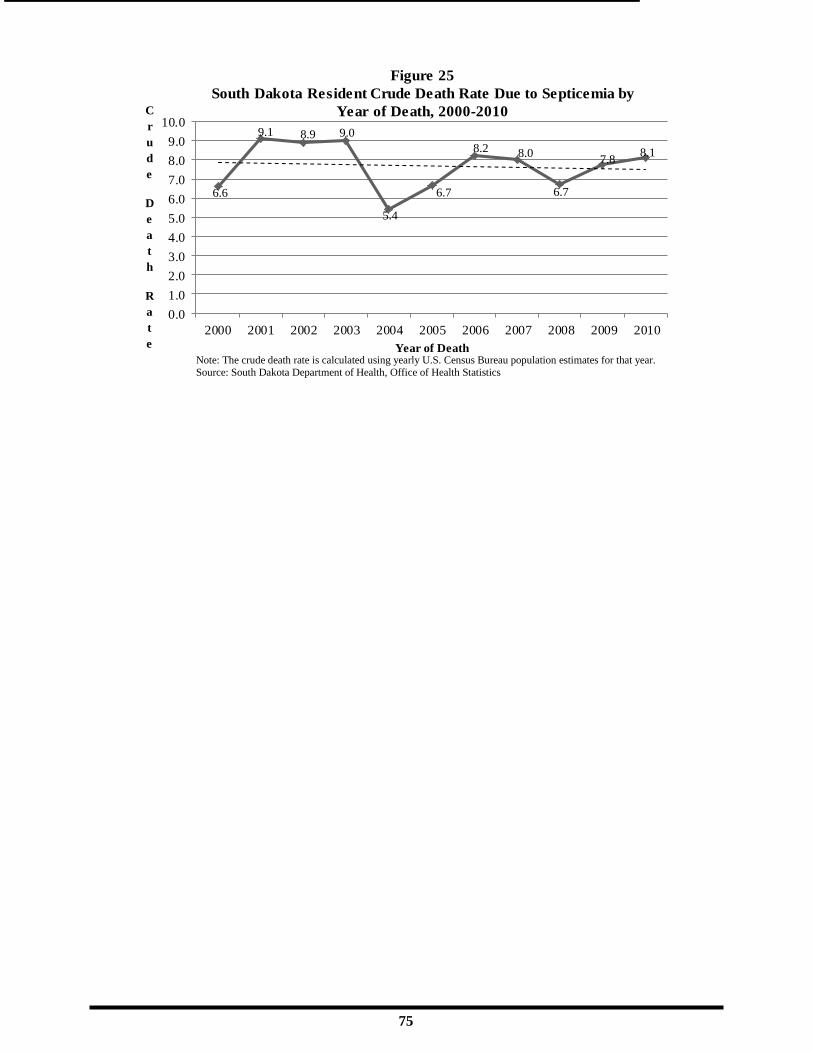
Figures 12 through 25, on the following
pages, display the crude death rates for the
primary leading causes of death to South
Dakota residents from 2000 to 2010.
51.3
47.450.1 49.4 50.8
56.4
47.6
57.560.4
54.2 55.4
0.0
10.0
20.0
30.0
40.0
50.0
60.0
70.0
2000 2001 2002 2003 2004 2005 2006 2007 2008 2009 2010
C
r
u
d
e
D
e
a
t
h
R
a
t
e Year of Death
Figure 13
South Dakota Resident Crude Death Rate Due to Chronic Lower
Respiratory Disease by Year of Death, 2000-2010
Note: The crude death rate is calculated using yearly U.S. Census Bureau population estimates for that year.
Source: South Dakota Department of Health, Office of Health Statistics
278.9261.4
253.6
253.2
229.2
226.1
221.0203.6
208.4218.9
197.9
0.0
50.0
100.0
150.0
200.0
250.0
300.0
2000 2001 2002 2003 2004 2005 2006 2007 2008 2009 2010
C
r
u
d
e
D
e
a
t
h
R
a
t
e Year of Death
Figure 12
South Dakota Resident Crude Death Rate Due to Heart Disease by
Year of Death, 2000-2010
Note: The crude death rate is calculated using yearly U.S. Census Bureau population estimates for that year. Source: South Dakota Department of Health, Office of Health Statistics

71
23.8
20.9
22.222.8
32.937.0
41.943.3
49.8 49.5
49.3
0.0
10.0
20.0
30.0
40.0
50.0
60.0
2000 2001 2002 2003 2004 2005 2006 2007 2008 2009 2010
C
r
u
d
e
D
e
a
t
h
R
a
t
e Year of Death
Figure 15
South Dakota Resident Crude Death Rate Due to Alzheimer's
Disease by Year of Death, 2000-2010
Note: The crude death rate is calculated using yearly U.S. Census Bureau population estimates for that year. Source: South Dakota Department of Health, Office of Health Statistics
74.3
64.7
68.0
61.9 59.8
65.5
55.451.2 48.6
51.3 50.5
0.0
10.0
20.0
30.0
40.0
50.0
60.0
70.0
80.0
2000 2001 2002 2003 2004 2005 2006 2007 2008 2009 2010
C
r
u
d
e
D
e
a
t
h
R
a
t
e Year of Death
Figure 14
South Dakota Resident Crude Death Rate Due to Cerebrovascular
Disease by Year of Death, 2000-2010
Note: The crude death rate is calculated using yearly U.S. Census Bureau population estimates for that year.
Source: South Dakota Department of Health, Office of Health Statistics
42.1
50.3
45.1
50.852.6
50.8
56.2
44.8 46.242.8
48.0
0.0
10.0
20.0
30.0
40.0
50.0
60.0
2000 2001 2002 2003 2004 2005 2006 2007 2008 2009 2010
C
r
u
d
e
D
e
a
t
h
R
a
t
e Year of Death
Figure 16
South Dakota Resident Crude Death Rate Due to Accidents by Year
of Death, 2000-2010
Note: The crude death rate is calculated using yearly U.S. Census Bureau population estimates for that year.
Source: South Dakota Department of Health, Office of Health Statistics

72
23.7
27.7
25.3
26.2
29.330.6
33.130.9
26.824.6
29.6
0.0
5.0
10.0
15.0
20.0
25.0
30.0
35.0
2000 2001 2002 2003 2004 2005 2006 2007 2008 2009 2010
C
r
u
d
e
D
e
a
t
h
R
a
t
eYear of Death
Figure 17
South Dakota Resident Crude Death Rate Due to Diabetes Mellitus
by Year of Death, 2000-2010
27.6
24.5
31.4
29.1
23.2
31.0
21.9
23.7 23.1
16.6
20.4
0.0
5.0
10.0
15.0
20.0
25.0
30.0
35.0
2000 2001 2002 2003 2004 2005 2006 2007 2008 2009 2010
C
r
u
d
e
D
e
a
t
h
R
a
t
eYear of Death
Figure 18
South Dakota Resident Crude Death Rate Due to Influenza and
Pneumonia by Year of Death, 2000-2010
Note: The crude death rate is calculated using yearly U.S. Census Bureau population estimates for that year.
Source: South Dakota Department of Health, Office of Health Statistics
23.4
24.6 24.3
28.0
23.923.2
23.6
18.2 15.5
16.4
17.3
0.0
5.0
10.0
15.0
20.0
25.0
30.0
2000 2001 2002 2003 2004 2005 2006 2007 2008 2009 2010
C
r
u
d
e
D
e
a
t
h
R
a
t
eYear of Death
Figure 16a
South Dakota Resident Crude Death Rate Due to Motor Vehicle Accidents
by Year of Death, 2000-2010
Note: The crude death rate is calculated using yearly U.S. Census Bureau population estimates for that year.
Source: South Dakota Department of Health, Office of Health Statistics
Note: The crude death rate is calculated using yearly U.S. Census Bureau population estimates for that year. Source: South Dakota Department of Health, Office of Health Statistics

73
12.6
14.2
12.3
13.4
14.715.8 15.9
12.7
15.3 15.8
17.1
0.0
2.0
4.0
6.0
8.0
10.0
12.0
14.0
16.0
18.0
2000 2001 2002 2003 2004 2005 2006 2007 2008 2009 2010
C
r
u
d
e
D
e
a
t
h
R
a
t
eYear of Death
Figure 19
South Dakota Resident Crude Death Rate Due to Intentional
Self-Harm (Suicide) by Year of Death, 2000-2010
Note: The crude death rate is calculated using yearly U.S. Census Bureau population estimates for that year.
Source: South Dakota Department of Health, Office of Health Statistics
4.55.1
3.5
5.1
7.1
10.6
10.0 8.8
8.1
6.4
11.4
0.0
2.0
4.0
6.0
8.0
10.0
12.0
2000 2001 2002 2003 2004 2005 2006 2007 2008 2009 2010
C
r
u
d
e
D
e
a
t
h
R
a
t
e
Year of Death
Figure 20
South Dakota Resident Crude Death Rate Due to Essential
(Primary) Hypertension and Hypertensive Renal Disease by Year
of Death, 2000-2010
Note: The crude death rate is calculated using yearly U.S. Census Bureau population estimates for that year. Source: South Dakota Department of Health, Office of Health Statistics
14.3
14.9 17.2
19.8
11.0
3.8
9.4 8.89.9
11.1
11.2
0.0
5.0
10.0
15.0
20.0
25.0
2000 2001 2002 2003 2004 2005 2006 2007 2008 2009 2010
C
r
u
d
e
D
e
a
t
h
R
a
t
e Year of Death
Figure 21
South Dakota Resident Crude Death Rate Due to Unspecified
Dementia by Year of Death, 2000-2010
Note: The crude death rate is calculated using yearly U.S. Census Bureau population estimates for that year.
Source: South Dakota Department of Health, Office of Health Statistics
74
17.2
13.4
16.8 17.1
12.0
6.97.6
9.3
11.212.2
8.8
0.0
2.0
4.0
6.0
8.0
10.0
12.0
14.0
16.0
18.0
20.0
2000 2001 2002 2003 2004 2005 2006 2007 2008 2009 2010
C
r
u
d
e
D
e
a
t
h
R
a
t
eYear of Death
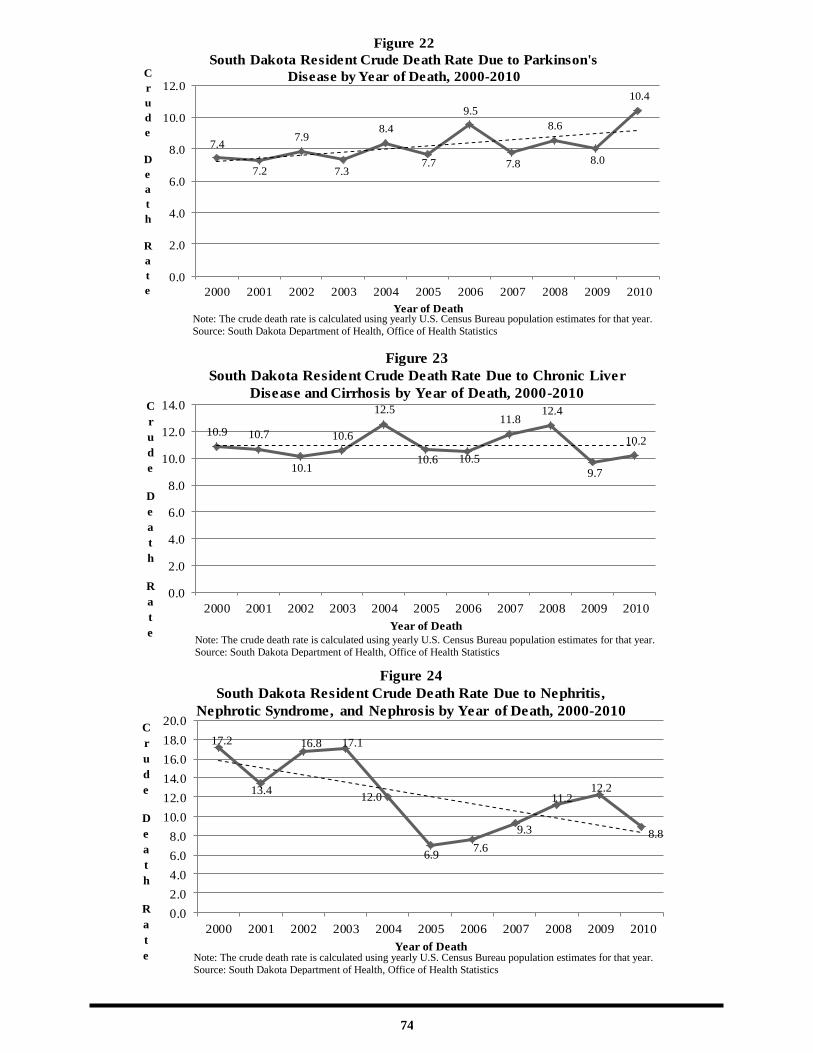
Figure 24
South Dakota Resident Crude Death Rate Due to Nephritis,
Nephrotic Syndrome, and Nephrosis by Year of Death, 2000-2010
Note: The crude death rate is calculated using yearly U.S. Census Bureau population estimates for that year.
Source: South Dakota Department of Health, Office of Health Statistics
7.4
7.2
7.9
7.3
8.4
7.7
9.5
7.8
8.6
8.0
10.4
0.0
2.0
4.0
6.0
8.0
10.0
12.0
2000 2001 2002 2003 2004 2005 2006 2007 2008 2009 2010
C
r
u
d
e
D
e
a
t
h
R
a
t
e
Year of Death
Figure 22
South Dakota Resident Crude Death Rate Due to Parkinson's
Disease by Year of Death, 2000-2010
Note: The crude death rate is calculated using yearly U.S. Census Bureau population estimates for that year.
Source: South Dakota Department of Health, Office of Health Statistics
10.9 10.7
10.1
10.6
12.5
10.6 10.5
11.812.4
9.7
10.2
0.0
2.0
4.0
6.0
8.0
10.0
12.0
14.0
2000 2001 2002 2003 2004 2005 2006 2007 2008 2009 2010
C
r
u
d
e
D
e
a
t
h
R
a
t
eYear of Death
Figure 23
South Dakota Resident Crude Death Rate Due to Chronic Liver
Disease and Cirrhosis by Year of Death, 2000-2010
Note: The crude death rate is calculated using yearly U.S. Census Bureau population estimates for that year.
Source: South Dakota Department of Health, Office of Health Statistics
75
6.6
9.1 8.9 9.0
5.4
6.7
8.2 8.0
6.7
7.88.1
0.0
1.0
2.0
3.0
4.0
5.0
6.0
7.0
8.0
9.0
10.0
2000 2001 2002 2003 2004 2005 2006 2007 2008 2009 2010
C
r
u
d
e
D
e
a
t
h
R
a
t
e Year of Death
Figure 25
South Dakota Resident Crude Death Rate Due to Septicemia by
Year of Death, 2000-2010
Note: The crude death rate is calculated using yearly U.S. Census Bureau population estimates for that year.
Source: South Dakota Department of Health, Office of Health Statistics

76