screening methods for metal-containing nanoparticles in water
TRANSCRIPT

Screening Methods for Metal-Containing
Nanoparticles in Water
APM 32
R E S E A R C H A N D D E V E L O P M E N T
EPA600R-11096 September 2011
wwwepagov
Screening Methods for Metal-Containing
Nanoparticles in Water
APM 32
Prepared by
Edward M Heithmar US Environmental Protection Agency
National Exposure Research Laboratory Environmental Sciences Division Environmental Chemistry Branch
Las Vegas NV 89119
Although this work was reviewed by EPA and approved for publication it may not necessarily reflect official Agency policy Mention of trade names and commercial products does not constitute endorsement or recommendation for use
US Environmental Protection Agency Office of Research and Development
Washington DC 20460
Abstract
Screening-level analysis of water for metal-containing nanoparticles is achieved with single particle-inductively coupled plasma mass spectrometry (SP-ICPMS) This method measures both the concentration of nanoparticles containing an analyte metal and the mass of the metal in each particle SP-ICPMS is capable of sample throughputs of over twenty samples per hour In this report the screening capability of SP-ICPMS is demonstrated in a study of transformations of silver nanoparticles in surface water Test water samples were collected from two fresh water sites and two estuary sites The effects of salinity particle concentration particle size and particle surface chemistry on relative rates of transformations were studied At high silver particle concentration (25x107 mL-1) shifts in the particle silver mass distribution measured by SP-ICPMS indicated increased aggregation rate at high salinity as reported by others However at low silver particle concentration (25x105 mL-1) which is closer to expected environmental concentrations aggregation was minimal even in highly saline estuary water At the low concentration a much more pronounced increase in either dissolved silver or silver-containing nanoparticles too small to be distinguished from dissolved silver was observed These data were operationally defined in this report as ldquodissolvedrdquo silver Comparison of transformations of 50-nm and 100-nm silver indicated that rates of both aggregation and apparent dissolution are higher for the smaller particles at the same particle concentration Transformations for citrate-capped and polyvinylpyrrolodone-capped silver nanoparticles were similar
ii
Notice
The United States Environmental Protection Agencyrsquos Office of Research andDevelopment partially performed and funded the research described here Mention of tradenames or commercial products does not constitute endorsement or recommendation for use
iii
Contents
Abstract iiNotice iiiList of Figures v
List of Tables viAbbreviations and symbols viiAcknowlegements viiiBackground 1
Rationale for research on metrology methods for metal-containing ENMs 2
Current methods for detecting quantifying and characterizing ENMs 4
Single particle - inductively coupled plasma mass spectrometry 6
Theory and Calibration Principles of SP-ICPMS 7
SP-ICPMS as a screening method for metal-containing nanoparticles in water 9
Experimental 10
Standards and reagents 10
Water sampling sites 10
Water sampling sample handling and storage 12
Transformation study procedures 13
SP-ICPMS analysis 13
Calculations 13
Results and Discussion 15
Sample water chemistry 15
Transformation of 50-nm citrate-capped silver ENM at high particle concentration 16
Comparison of transformations of 50-nm and 100-nm citrate-capped silver ENM 19
Comparison of transformations of PVP-capped and citrate-capped 50-nm silver ENM 21
Transformation of 50-nm citrate-capped silver ENM at low particle concentration 22
Conclusions and Future Work 25
References 26
iv
List of Figures
Figure 1 Fresh water sampling site locations with latitude and longitude 11Figure 2 Water samples as received from the sampling sites before filtration 11Figure 3 Estuary water sampling site locations with latitude and longitude 12Figure 4 Mass-based mean particle mass of citrate-capped 50-nm Ag over time in deionized
water and low- and high-salinity estuary waters (25x107 mL-1) 16Figure 5 Polydispersity index of citrate-capped 50-nm Ag over time in deionized water and low-
and high-salinity estuary waters (25x107 mL-1) 17Figure 6 Change in measured ldquodissolvedrdquo silver over time in suspensions of citrate-capped 50-
nm Ag in deionized water and low- and high-salinity estuary waters (25x107 mL-1) 18Figure 7 Change in total measured silver over time in suspensions of citrate-capped 50-nm Ag
in deionized water and low- and high-salinity estuary waters (25x107 mL-1) 18Figure 8 Increase in PDI over time for suspensions of 50-nm and 100-nm citrate-capped Ag in
high-salinity estuary water (25x107 mL-1) 20Figure 9 Increase in ldquodissolvedrdquo silver over time for suspensions of 50-nm and 100-nm citrate-
capped Ag in high-salinity estuary water (25x107 mL-1) 20Figure 10 Increase in PDI over time for suspensions of PVP-capped and citrate-capped 50-nm
Ag in high-salinity estuary water (25x107 mL-1) 21Figure 11 Increase in ldquodissolvedrdquo silver over time for suspensions of PVP-capped and citrate-
capped 50-nm Ag in high-salinity estuary water (25x107 mL-1) 22Figure 12 Changes in suspension metrics of 50-nm citrate-capped silver after 1400 minutes
(25x105 mL-1) 23Figure 13 Effect of concentration on changes in suspension metrics of 50-nm citrate-capped
silver after 1400 minutes (25x105 mL-1) 24
v
List of Tables
Table 1 Ranking (in descending order) of 14 key research priorities for eco-responsible ENM design 2
Table 2 Quantification and characterization metrics produced by SP-ICPMS and by hyphenatedanalytical methods 7
Table 3 Size mass and particle-concentration metrics for silver nanosphere standards 10Table 4 Measured water chemistry parameters for water samples used in transformation studies
15
vi
Abbreviations and symbols
AFM Atomic force microscopy APHA American Public Health Association ca Analyte concentration in aqueous sample (gmL) cp Particle concentration in aqueous sample (mL-1) DI Deionized DLS Dynamic light scattering EDS Energy-dispersive X-ray spectrometry εn Nebulization transport efficiency (dimensionless) ENM Engineered nanomaterials EPA Environmental Protection Agency FFF Field flow fractionation Flow-FFF Flow field flow fractionation HDC Hydrodynamic chromatography ICON International Council on Nanotechnology ICPMS Inductively coupled plasma mass spectrometry IRZ Initial radiation zone LDPE Low-density polyethylene map Analyte element mass in the particle (g)
Number of analyte ions detected (demensionless) nip NOM Natural organic matter NTA Nanoparticle tracking analysis PDI Polydispersity index (dimensionless) PSU Practical salinity units (dimensionless) PVP Polyvinylpyrrolodone qia Ionized analyte flux (s-1) qp Particle flux (s-1) qs Sample uptake rate (mL s-1) rg Radius of gyration rh Hydrodynamic radius RSD Relative standard deviation Sed-FFF Sedimentation field flow fractionation SEM Scanning electron microscopy SLS Static light scattering SP-ICPMS Single particle - inductively coupled plasma mass spectrometry TEM Transmission electron microscopy WDS Wavelength-dispersive X-ray spectrometry ζ Zeta (potential usually mv)
vii
Acknowlegements
I thank Tara Schraga of the US Geological Survey and David Carpenter of the Southwest Florida Water Management District for collecting the water samples and Jay Kuhn of Analytical Resources Inc for access to the PerkinElmer NexION ICPMS Chady Stephan of PerkinElmer conducted some of the experiments with me and participated in valuable discussions regarding the data Emily Siska a student contractor for the Environmental Protection Agency provided much needed laboratory support
viii
Background
Engineered nanomaterials (ENMs) are increasingly being incorporated in industrial consumer medical and agricultural products This is because ENMs exhibit unique optical electrical and chemical properties that can impart beneficial characteristics to the product into which they are incorporated However these unique properties also affect the environmental behavior of ENMs Their transport fate exposure potential and effects are not predicted by those of either the corresponding bulk materials or dissolved chemicals
Most ENMs currently in production can be categorized as either metal-containing ENMs (ie metals metal oxides or semiconducting quantum dots) or carbon-based (ie fullerenes and their derivatives and carbon nanotubes) ENMs containing metals have a greater potential to enter the environment than carbon-based ENMs This is a result of the fact that the major uses of metal-containing ENMs are in dispersive applications while carbon-based ENMs are generally incorporated into solid composites This increased exposure potential for metal-containing ENMs has motivated intense research into their environmental processes such as transformation transport and fate exposure pathways and potential adverse effects on humans and sensitive organisms
Detection quantification and characterization of ENMs including measurement of nanoparticle concentration and characterization of particle size distribution are critical to all aspects of this exposure research Nanoparticle concentration and size distribution largely control how they behave in the environment Highly selective detection quantification and characterization methods are important for many types of nanomaterials environmental research less selective methods that can rapidly screen samples for metal-containing nanoparticles are also needed
This report focuses on the application of a new method single-particle-inductively coupled plasma mass spectrometry (SP-ICPMS) for rapid screening-level measurement of nanoparticle dispersions The method is being developed at the Environmental Sciences Division of EPArsquos National Exposure Research Laboratory SP-ICPMS has demonstrated promise as a practical analytical method for characterization of metal-containing ENMs in environmental waters This report will (1) briefly review of the role of characterization of metal-containing ENMs in the exposure research of these novel materials (2) discuss methods currently available for the measurement of various ENM exposure metrics and (3) describe the limitations of existing methods for studying ENMs in real environmental systems A brief review of the theory of SP-ICPMS will also be provided A study that applies SP-ICPMS in a stand-alone screening-level mode will be described in detail Specifically SP-ICPMS will be used to study transformations of silver nanoparticles in surface water
1
Rationale for research on metrology methods for metal-containing ENMs
A workshop on the eco-responsible design and development of ENMs was conducted by the International Council on Nanotechnology (ICON) in 2009 (Alvarez Colvin et al 2009) Fourteen key research priorities that would inform designing using and disposing of ENMs to enhance responsible development of these materials were identified by the approximately 50 researchers invited to the workshop The fourteen priorities were then ranked against two criteria First the relative importance of the research in understanding how to design and develop ENMs in an eco-responsible manner was assessed Second the current gap in the state-of-knowledge for each research priority was ranked The workshop also assessed the amount of effort required to sufficiently satisfy the science gap posed by each research priority The results of these three assessments are summarized here (Table 1)
Table 1 Ranking (in descending order) of 14 key research priorities for eco-
responsible ENM design (adapted from Alvarez Colvin et al 2009)
Importance for eco-responsible design Gap in state-of-knowledge Effort needed Metrology analytical methods Metrology analytical methods High Predictive models of release Structure-activity relations High Structure-activity relations Boavailability and bioaccumulation Medium-high Dose-response (sub-lethal) Sourcesenvironmental fluxes Medium Boavailability and bioaccumulation Trophic transfer Medium Identify relevant sentinel organisms Uptake mechanisms Low Trophic transfer Intra-organism distribution Low Industrial ecologygreen chemistry Industrial ecologygreen chemistry Medium Sourcesenvironmental fluxes Impact on environmental infrastructure Medium Impact on environmental infrastructure Predictive models of release High Uptake mechanisms Assessing regulatory framework Medium Assessing regulatory framework Dose-response (sub-lethal) Medium-high Intra-organism distribution Waste minimizationrecycling Medium Waste minimizationrecycling Identify relevant sentinel organisms Low
Metrology to detect quantify and characterize ENMs ranked highest in importance for enabling eco-responsible design of ENMs This area also ranked as least developed in terms of state-of-knowledge Consequently the workshop recommended a great deal of effort be applied in metrology to detect quantify and characterize ENMs
The workshoprsquos emphasis on the need for research on detection quantification and characterization of ENMs stems from a number of factors First these metrology tools are vital for the success of virtually every area of research on the environmental behavior exposure potential and possible adverse effects of ENMs Monitoring environmental occurrence and distribution of ENMs as well as determining temporal trends in these data requires metrology methods Process research into ENM transformation transport and fate requires methods to measure and characterize ENMs in each compartment of a laboratory system Toxicity research requires quantifying and characterizing the ENMs in the original dosing material and possible changes in concentration and size distribution induced by the test system must also be measured
2
Often toxicity testing requires measuring internal ENM dose in the test organisms Finally emerging exposure models for ENMs (Mueller and Nowack 2008) require quantification of ENM releases and ENM measurements in the environment for model validation
The low level of the state-of knowledge for detection quantification and characterization of ENMs is based in part on the complex set of metrics that need to be measured Compound concentration is often the only relevant metric for conventional pollutants in evaluating exposure potential because these are released and transported in dissolved form Conversely for ENMs in addition to mass concentration measurement of particle concentration and particle size distribution is usually required because the environmental stability and mobility of ENMs are influenced by their particle size There are also several ways of measuring particle size that may be important depending on the application including particle mass volume and hydrodynamic diameter [the theoretical diameter of an equivalent spherical particle and its electric double layer (Hasselloumlv Readman et al 2008) In addition to mass concentration particle concentration and size distribution other metrics sometimes affect environmental behavior of ENMs Surface area affects reaction rates of ENMs therefore their catalytic activity and surface area can also mediate ENM toxicity (Schulte Geraci et al 2008) Surface charge or zeta potential (ζ) affects the inter-particle repulsive forces of ENM suspensions which influences their tendency to aggregate (Kim Lee et al 2008) ENM aspect ratio the ratio of the longest to the shortest dimension of the nanoparticles sometimes influences toxicity of long and narrow ENMs such as carbon nanotubes (Takagi Hirose et al 2008) Therefore in nearly all research efforts related to the environmental behavior exposure potential and possible adverse effects of ENMs methods are required for quantifying mass and particle concentration and at least one metric related to size distribution Other metrics such as surface area surface charge and particle shape may also be required depending on the environmental behavior or effect being studied
There is a paucity of practical methods for detecting quantifying and characterizing nanomaterials in complex media For ENMs in pure suspensions there are several methods available to quantify mass and particle concentrations as well as characterize size distributions For example characterizing ENM starting materials used in laboratory studies is often relatively straightforward However the test systems in which the starting materials are studied often alter these metrics and there are few methods for measuring them in these more complex systems (Alvarez Colvin et al 2009) Natural environmental samples are usually even more analytically challenging than laboratory test systems and no practical methods have yet been published for detecting quantifying and characterizing ENMs in environmental media (Handy von der Kammer et al 2008) Several common properties of natural environmental media contribute to the dearth of applicable ENM metrology tools for these sample types Natural systems generally have very low concentrations of ENM particles (Kiser Westerhoff et al 2009) so the sensitivity of many analytical techniques is insufficient In addition natural colloids containing the analyte element used to detect the ENM are often present (Klaine Alvarez et al 2008) In the case of metal-containing ENMs most analytical techniques measure total element concentration and many natural colloids include minerals that contain a wide range of metals so background interference is an issue Finally particle size determination can be confounded by dissolved metals adsorbed to relatively large natural organic matter (NOM) particles
3
Methods for a wide range of characterization metrics might be developed for simple systems such as laboratory media however it is unlikely that methods for many ENM characteristics such as surface charge and aspect ratio can be developed for natural systems However methods must be developed that can at least selectively detect and quantify ENM particle concentration as well as characterize the size distributions of metal-containing ENMs in natural environmental media In addition screening-level methods must be developed that will allow rapid analysis of samples for potential ENM content These screening techniques will be required because selective techniques will likely involve time-consuming separations and therefore will not be applicable to large numbers of samples In addition rapid screening-level techniques could be used to study environmental processes such as aggregation and dissolution that occur on time scales too rapid for separation-based techniques
Current methods for detecting quantifying and characterizing ENMs
Imaging techniques are currently the most common methods for characterizing the size and shape of ENMs (Lin and Yang 2005 Pyrz and Buttrey 2008) Either scanning electron microscopy (SEM) or transmission electron microscopy (TEM) can be employed In some studies atomic force microscopy (AFM) can also be used (Ebenstein Nahum et al 2002) In some cases AFM can provide additional information such as adsorption forces SEM or TEM coupled with X-ray spectrometry in either the energy-dispersive (EDS) or wavelength-dispersive (WDS) modes can definitively identify metal-containing nanoparticles However particle concentrations must be high (generally gt109 mL-1) to reliably find nanoparticles using any of the imaging methods Also the lack of representative sampling techniques for imaging methods precludes quantification of particle concentration Current sampling methods can also produce changes in the size distribution of the ENM (Tang Wu et al 2009) Finally imaging techniques are generally not practical for environmental characterization in natural media because of background colloids In environmental media metal-containing ENMs cannot be distinguished from colloid particles containing the same metal (Tiede Hasselloumlv et al 2009)
Representative nanoparticle size distributions can be obtained by a variety of light scattering methods because they rely on measuring a signal that is produced by the collection of all ENM particles in a large volume of sample in contrast to the minute volume sampled by the imaging methods ENM size distribution by light scattering methods is also possible at lower concentrations (ca 106-107 mL-1) than allowed by imaging techniques Dynamic light scattering (DLS) is the most prevalent light scattering characterization tool It uses the autocorrelation function of scattered laser light to calculate the hydrodynamic radius (rh) distribution (Filella Zhang et al 1997) DLS can also measure ζ potential when performed on a sample in an oscillating electric field A second light scattering method static light scattering (SLS) also known as multi-angle light scattering measures the radius of gyration (rg) (Kammer Baborowski et al 2005) It has been demonstrated that the ratio rgrh can provide information on ENM aspect ratio (Schurtenberger Newmen et al 1993) DLS and SLS are most applicable for ENM suspensions with narrow size distributions Light scattering intensity is related to particle diameter in a non-linear fashion and in more polydisperse samples scattering by large particles distorts the calculation of the size distribution In contrast to DLS and SLS nanoparticle
4
tracking analysis (NTA) measures the scatter from individual particles Therefore NTA can accurately determine size distributions in polydisperse suspensions None of the light scattering techniques are element selective They measure the size distribution of all nanoparticles regardless of composition Therefore light scattering methods are not applicable in complex natural media
To detect quantify and characterize metal-containing ENMs in natural media an element-selective detection method is required to reduce interference from background natural colloids Inductively coupled plasma mass spectrometry (ICPMS) is by far the most common such detection approach because of its high sensitivity However most element-selective detection techniques including ICPMS cannot characterize particle size distribution This has led to the increasing use of hyphenated analytical methods where a size separation usually by some form of chromatography is coupled on-line to ICPMS Recently the most common size separation technique has been a form of field flow fractionation (FFF) FFF comprises several variants In each a laminar flow of an eluent (usually an aqueous surfactant solution) carries a plug of sample down a narrow channel A force field is applied orthogonal to the laminar flow forcing nanoparticles toward the channel wall Size separation is effected by the balance between this force and the different diffusivities determined by particle sizes Smaller particles diffuse higher into a faster portion of the laminar-flow profile Therefore smaller particles elute before larger particles The intensity vs retention time profile produced by FFF is called a fractogram A number of force fields can be used The FFF technique most commonly used for size separation of ENMs is flow-FFF (Lesher Ranville et al 2009) where the orthogonal force is produced by a flow through a channel wall that is porous to eluent but not to nanoparticles A gravity field has been used less often in a technique known as sedimentation-FFF (or sed-FFF) The two forms of FFF are complementary in that separations are produced by different particle properties ndash rh in flow-FFF and buoyant mass in sed-FFF While sed-FFF affords higher size resolution flow-FFF is easier to implement and is applicable to a wider range of ENM particle sizes hence the greater popularity of flow-FFF Flow-FFF-ICPMS does have an experimental complication in that nanoparticle interactions with the porous membrane wall can lead to peak tailing and even irreversible adsorption
Another hyphenated analytical approach for ENM size characterization uses a separation technique known as hydrodynamic chromatography (HDC) (Tiede Boxall et al 2010) In HDC-ICPMS the ENM particles pass through a column packed with a material such as silica in a eluent under laminar-flow conditions Small nanoparticles can approach the particle surfaces closer than large particles therefore experiencing a lower average flow velocity The fractogram of HDC-ICPMS is inverted compared to that of FFF-ICPMS small particles elute after larger particles in HDC-ICPMS FFF-ICPMS offers higher resolution while HDC-ICPMS often effects a more rapid separation
Both flow-FFF-ICPMS and HDC-ICPMS provide elemental information in addition to size distribution Either can be applied to moderately complex systems like laboratory test media However the application of either for natural environmental media is limited Fractograms measure the total analyte metal concentration flowing to the ICPMS Therefore neither FFF-ICPMS nor HDC-ICPMS can determine the chemical state of the metal For example a 10 ngmL concentration of silver detected at a retention time related to a given rh
5
could be produced by 10 ngmL silver ENM but it could also result from approximately 130 ngmL of AgCl nanoparticles having the same rh Furthermore a high concentration of NOM with the same rh could adsorb dissolved silver and produce a similar signal at the same retention time Therefore these hyphenated methods provide an upper-limit for the potential concentration of ENMs in natural media but not a definitive determination of ENMs
Single particle - inductively coupled plasma mass spectrometry
The limitations of hyphenated approaches to metal-containing ENM size characterization when applied to natural media have encouraged development of single particle - inductively coupled plasma (SP-ICPMS) This technique was introduced by Degueldrersquos group to characterize various colloids (Degueldre and Favarger 2004 Degueldre Favarger et al 2004) and later gold nanoparticles (Degueldre Favarger et al 2006) Recently Ranvillersquos group described a preliminary application of SP-ICPMS to characterize silver nanoparticles in municipal waste water (Monserud Lesher et al 2009) and Hasselloumlv coupled SP-ICPMS with flow-FFF (Hasselloumlv 2009)
The principle underlying SP-ICPMS is simple Metal-containing nanoparticles entering an ICPMS plasma produce discrete ion plumes of the analyte metal isotopes over short time periods (eg lt 1 ms) If the ICPMS signal is monitored with high temporal resolution (eg le10 ms per data point) background in each data point from dissolved analyte metal or plasma matrix ions (Lam and Horlick 1990) diminishes to a very low average ion count per data point The ion plume pulses from the nanoparticles produce several ions in a single data point making them easily distinguishable The metal-containing nanoparticle concentration in the sample is obtained by measuring the frequency of the ion plume pulses The analyte metal mass contained in each individual nanoparticle is independently calculated by the ion intensity of its corresponding ion plume
The quantification metrics produced by SP-ICPMS are complementary to those produced by hyphenated analytical methods like FFF-ICPMS and HDC-ICPMS (Table 2) Either SP-ICPMS or a hyphenated method used as stand-alone techniques can only be a screening technique giving an upper bound for the concentration of metal-containing ENMs Although SP-ICPMS measures the metal of interest in each particle it provides no direct measurement of the particle diameter Using the example of silver ENM again detection of SP-ICPMS pulses of a given intensity could be caused by silver ENM nanoparticles of a certain diameter or they could be produced by larger nanoparticles of insoluble silver salts such as AgCl or AgS Because of the complementary nature of the metrics produced by SP-ICPMS and hyphenated analytical methods FFF-SP-ICPMS or HDC-SP-ICPMS could provide very selective detection quantification and size characterization in natural environmental media
6
Table 2 Quantification and characterization metrics produced by SP-ICPMS and by
hyphenated analytical methods
SP-ICPMS Hyphenated Analytical Methods Measures the particle concentration of metal- Measures total metal concentration as a based nanoparticles as well as the mass of function of nanoparticle size fraction metal in each particle
Does not provide direct information on particle Does not provide information on number or diameters characteristics of metal-based particles
Theory and Calibration Principles of SP-ICPMS
A complete understanding of the theory of SP-ICPMS requires consideration of some general processes that affect signal in all forms of ICPMS including conventional ICPMS of analyte in solution The processes are the same in conventional and single particle implementations of ICPMS Partly because of these common processes dissolved analyte measurements can be used in the calibration of particle element mass metric determined by SP-ICPMS
In conventional ICPMS of an aqueous sample an aerosol of droplets is produced by some form of nebulizer (Taylor 2001) Large aerosol droplets (gt 5-10 microm in diameter) do not contribute to analyte signal and cause noise in the plasma therefore a spray chamber is usually employed to remove these large droplets by collisions with the chamber walls This results in a fine aerosol entering the plasma the droplet flux of which is typically greater than 106 s-1 At ngmL analyte concentrations each droplet contains less than a few thousand analyte atoms The efficiency of the total sampling process that results in analyte-containing aerosol in the plasma is termed the nebulization transport efficiency εn This quantity is usually between 2 and 30 depending on specific sample introduction system and operating conditions Aerosol is evaporated in the region within the ICP load coil known as the preheating zone of the plasma The salts containing the analyte element vaporize in this region Atomization occurs in the region from zero to several millimeters downstream from the load coil This region is the initial radiation zone (IRZ) (Koirtyohann Jones et al 1980) Downstream from the IRZ is the normal analytical zone ionization occurs in this region (Thomas 2004) In a typical ICP vaporization atomization and ionization processes once aerosol is in the plasma are usually gt80 efficient for most elements (OConnor and Evans 1999) This is true for both conventional ICPMS and SP-ICPMS
ICPMS of nanoparticles differs from conventional ICPMS of dissolved analyte because of the way analyte is distributed within the aerosol In conventional ICPMS a each droplet contains a small number of analyte atoms The large number of droplets results in a relatively
7
constant flux of ionized analyte therefore a fairly constant signal is produced Typically the sampling time per data point (called the dwell time) is set at ge100 ms to minimize signal variation due to counting statistics or noise in the sampling process In the case of ICPMS of nanoparticles the great majority of aerosol droplets contain no nanoparticles If there is any dissolved analyte in the sample it is distributed as in conventional ICPMS and it contributes to a fairly constant background Only a small fraction of droplets contain a nanoparticle at low ENM concentration and generally only one nanoparticle is contained in a droplet However each nanoparticle can produce a plume of millions of ions that enter the mass spectrometer interface over a period of about 500 micros (Gray Olesik et al 2009 Heithmar 2009) The resulting signal is composed of the low constant background with periodic pulses of large numbers of analyte ions detected In contrast to conventional ICPMS SP-ICPMS is implemented with very short dwell times to improve the contrast between signal produced by dissolved analyte and the large fast pulses from analyte in nanoparticles For example if the dwell time is set at 1 ms a 1 pgmL dissolved silver background would typically result in an average background signal of 01-05 ions in a single dwell period By contrast a 50 nm silver nanoparticle containing about 62x10-16
g silver (34x106 atoms) would typically produce a signal of 20-50 ions in the same 1 ms dwell period (transmission efficiencies of quadropole mass filters are typically ca 10-5)
This theory of SP-ICPMS results in an easily calibrated signal if two assumptions are met First every nanoparticle that reaches the plasma must be detected as an ion plume This requires a sufficiently long residence time so the ion plume expands enough to substantially fill the cross section of the central channel of the plasma If so equation 1 is valid
(1) qp cp = qs εn
where qp = flux of particles detected in plasma (s-1) cp = concentration of nanoparticles containing the detected metal in the sample (mL-1) qs = sample uptake rate (mL s-1) and εn = nebulization efficiency (dimensionless) Note that qs and εn are properties of the ICPMS instrument conditions and independent of the element Therefore equation 1 can be used to calculate their product using any type of nanoparticle suspension of known cp
The second assumption of quantitative SP-ICPMS calibration theory is that ICPMS sensitivity is constant for an analyte irrespective of whether it is dissolved or contained in nanoparticles Again this requires that the residence time in the plasma to be sufficiently long If so equation 2 is valid
(2) map = [qs εn ca qia] nip = k nip
where map = mass of analyte element in a single nanoparticle (g) nip = number of ions of analyte element detected in the corresponding plume (number of ions detected in a single SP-ICPMS pulse) ca = the analyte concentration in a dissolved standard of the analyte (g mL-1) qia = ion flux measured for the dissolved standard (s-1) For each analyte element calibration of the element mass in individual particles (calculation of the response factor k) requires only the qs εn product from Equation 1 and analysis of a known concentration of dissolved analyte element using a conventional ICPMS standard)
8
Equation 2 provides calibration of nanoparticle element mass The calibration of nanoparticle concentration is provided by rearrangement of equation 1 for any unknown nanoparticle suspension once qs εn has been determined
(3) cp = qp qs εn
SP-ICPMS as a screening method for metal-containing nanoparticles in water
As a screening tool for metal-containing nanoparticles in natural media stand-alone SP-ICPMS is potentially more useful than hyphenated methods of analysis Analysis by SP-ICPMS can be applied to large numbers of samples because it can achieve throughputs of over twenty samples per hour By comparison typical hyphenated analyses can take 20-40 minutes each Also SP-ICPMS has less potential for artifacts due to ENM adsorption Finally detection limits of ENMs by SP-ICPMS are potentially much lower than those that have been obtained by flow-FFF-ICPMS
In addition to the ability to analyze large sample sets the speed of screening-level SP-ICPMS also allows rapid transformations of metal-containing ENMs to be studied The particle size distribution must not change significantly during the time required for size distribution analysis which limits the hyphenated sizing methods to relatively slow transformations In contrast batch analysis by SP-ICPMS can be easily applied to studying size-distribution transformation processes with characteristic times of 2-3 minutes and flow-injection experiments can be designed to study even faster processes
This report will describe the application of SP-ICPMS as a stand-alone screening method to study time-resolved size-distribution transformations of silver ENM suspensions in natural surface waters Size distribution is a critical parameter in predicting the mobility of nanoparticles because larger particles fall out of the water column more quickly than small particles The size distributions of ENMs are known to be affected by water chemistry particularly by ionic strength (as determined in most surface waters by salinity) and NOM (French et al 2009 Liu et al 2010) In the study described in this report the effects of water chemistry (particularly salinity) nanoparticle concentration nanoparticle size and nanoparticle surface chemistry on the size-distribution will be measured as a function of exposure time Four surface waters of divergent water chemistry will be studied Size distributions at exposure times of two to 3000 minutes will be measured Transformation processes will be studied at both a high particle concentration typical of previously published studies (25x107 mL-1) and a more environmentally relevant 25x105 mL-1 Transformations of silver nanoparticle suspensions with mean diameters of 50 nm and 100 nm will be investigated Finally transformation of citrate and polyvinylpyrrolodone (PVP) capped silver nanoparticles will be compared
9
Experimental
Standards and reagents
The purchased silver nanosphere standard suspensions were NanoXactTM
(Nanocomposix San Diego CA) The suspensions were quite monodisperse (RSD 8-10) and the total silver concentration of each was 20 mgL The mean silver nanoparticle mass in femtograms and the suspension particle concentration were calculated from the mean nanoparticle diameter determined by the manufacturer by TEM (Table 3) Dilutions were made with laboratory deionized water
Table 3 Size mass and particle-concentration metrics for silver nanosphere
standards
Nanoparticle (capping agent)
Mean Diameter (nm)
Diameter RSD ()
Ag nanoparticle mass (fg)
Particle concentration (mL-1)
50 nm (citrate) 491 91 065 31x1010
50 nm PVP 534 94 084 23x1010
100 nm (citrate) 991 83 530 37x109
Water sampling sites
Sites for the silver transformation studies were selected with the intention of getting a range of salinities and NOM One lake one river and two estuary sites were selected as water sources for the transformation study The lake site was at Lake Hancock and the river site was on the Alafia River both in west-central Florida (Figure 1) Lake Hancock is heavily impacted by agricultural runoff and its unfiltered sample was highly colored with algae The Alafia River is typical of central Florida rivers having high tannin content and a brown unfiltered sample color (Fgure 2)
The two estuary sampling sites were both located on the San Francisco Bay and are regular sampling locations (Stations 7 and 31) of the fresh water sampling site locations with latitude and longitudeof the US Geological Survey (USGS 2011) Station 7 is isolated from the mouth of the Bay by narrow straights while Station 31 is in the wide lower arm of the Bay with direct access to the mouth of the Bay (Figure 3) Therefore salinity at Station 7 is generally lower than at Station 31
10
Figure 1 Fresh water sampling site locations with latitude and longitude
Figure 2 Water samples as received from the sampling sites before filtration From left to right San Francisco Bay Station 7 San Francisco Bay Station 31 Lake Hancock and Alafia River Note the color of the freshwater sites caused by algae (Lake Hancock) or tannin (Alafia River)
11
Figure 3 Estuary water sampling site locations with latitude and longitude
Water sampling sample handling and storage The fresh water samples were collected on April 10 2010 They were collected as a
single grab sample by opening an empty 1-L low-density polyethylene (LDPE) bottle approximately 03 m below the surface of the water and capping the completely filled bottle before bringing it to the surface The estuary samples were collected at a depth of 1 m via the sampling pump on the USGS research ship and collected in 1-L LDPE bottles Salinities were measured on-board with a salinity meter in practical salinity units (PSU)
Water samples were maintained at ca 4 degC until analysis Samples were filtered through a 20 microm polypropylene membrane (Polycap 36 HD Whatman Inc Florham Park NJ) immediately upon arrival at the laboratory Aliquots of the filtered samples samples were analyzed for water chemistry parameters at TestAmerica Phoenix AZ The water chemistry tests were run within two weeks of the transformation studies Total organic carbon was determined by Method SM5310 B [Standard Methods For The Examination of Water and Wastewater American Public Health Association (APHA)] metals were determined by Method
12
6010 [US Environmental Protection Agency (EPA)] anions were determined by EPA Method 3000 suspended solids were determined by APHA Method SM2540 D
Transformation study procedures Water samples were allowed to reach room temperature (23-25 degC) 20 mL of each
sample was transferred to a 50-mL polypropylene centrifuge tube An appropriate volume of silver nanosphere suspension was pipetted into the sample to achieve a final particle concentration of either 25x107 mL-1 or 25x105 mL-1 Each spiked sample was inverted several times and an appropriate volume was immediately taken and spiked into reagent water to a final concentration of 25x104 mL-1 for analysis by SP-ICPMS (ie the 1 minute sample point) Identical volumes of each spiked sample (ie to achieve a 25x104 mL-1 analysis concentration) were taken at 125 25 50 1400 and for some samples 2900 minutes diluted to 25x104 mL-1 and analyzed by SP-ICPMS Initial test sample preparations were staggered so all water samples at a given testing condition (nanomaterials and concentration) were analyzed together Because the primary focus of the studies was to examine transformations at the more environmentally relevant low particle concentration and transformations at high particle concentration were expected to be predominantly ionic strength related freshwater samples were not studied at high particle concentration
SP-ICPMS analysis SP-ICPMS analyses were performed on a NexION 300Q (PerkinElmer Waltham MA)
The ICPMS was tuned with multi-element tuning solution for maximum overall sensitivity and oxide and doubly charged levels conforming to manufacturerrsquos specifications The dwell time for all SP-ICPMS analyses was 1 ms Each analysis consisted of a time-resolved analysis of 25000 dwell periods the maximum allowed by the instrument The settling time between dwell periods was changed in the instrument registry from 100 micros to 50 micros Shorter settling times improve the accuracy of particle element mass distributions by minimizing the loss of part of some ion plumes during the settling time (Heithmar 2009)
Calculations The particle element mass distribution was characterized by the number-based mean
particle element mass (equation 1) the mass-based mean particle element mass (equation 2) and the polydispersity index (PDI) of particle element mass (equation 3)
Mmeann = Σ Mi n (equation 1)
13
M 2meanm = Σ Mi Σ Mi (equation 2)
PDIm = Mmeanm Mmeann (equation 3)
Here Mi is the mass of the ith particle and the summations are over all n particles detected
The polydispersity index is a measure of the width of the particle element mass distribution PDIm = 1 for a perfectly monodisperse dispersion with respect to particle element mass The polydispersity increases as the width of the particle element mass distribution broadens
In addition to the determination of nanoparticle silver mass an operational definition of ldquodissolvedrdquo silver was applied to the sum of the ion counts in dwell periods containing four or fewer ions and the total silver mass in the sample was determined from the sum of the ion counts in all dwell periods of the analysis The ldquodissolvedrdquo silver value was interpreted as the silver mass consistent with free silver ion It should be noted that ldquodissolvedrdquo silver is an operational definition It can be produced by free ionic silver However silver-containing particles that generate only a few ions and therefore cannot be distinguished from the dissolved background are also included in the ldquodissolvedrdquo silver mass
14
Results and Discussion
Sample water chemistry The salinity value of the open-bay Station 31 was much higher than that of the isolated
bay-arm Station 7 as expected (Table 4) Also consistent with significant sea-water content the major anion and cation concentrations in Station 31 water were much higher than any of the other three water samples Total organic carbon and suspended solids were comparable for the two estuary samples and much lower for the fresh water samples Most of the organic material that colored the fresh water samples was apparently particulate matter that was retained by the 20-microm filter In fact there was little color in any of the four filtered samples
Table 4 Measured water chemistry parameters for water samples used in
transformation studies
Chemistry parameter SF Bay Station 7 SF Bay Station 31 Lake Hancock Alafia River
Salinity (PSU) 007 158 NA NA
Total Organic Carbon (mgL) 26 24 26 24
Calcium (mgL) 11 190 17 14
Magnesium (mgL) 60 490 45 82
Chloride (mgL) 86 9100 27 14
Sulfate (mgL) 95 1200 68 67
Suspended Solids (mgL) 64 48 Not detected Not detected
15
Transformation of 50-nm citrate-capped silver ENM at high particle concentration
Citrate-capped 50-nm silver ENM suspensions were spiked in the two estuary waters and deionized water at a particle concentration of 25x107 mL-1 Transformations were monitored by SP-ICPMS up to 2900 minutes exposure The mass-based mean particle Ag mass did not change over that time for either deionized water or the low salinity Station 7 water (Figure 4) In the high salinity Station 31 water the mean particle Ag mass increased by more than four-fold compared with the other waters after 2900 minutes of exposure This is consistent with both theory and previous laboratory studies in saline water Both simple Derjaguin Landau Verwey and Overbeek (DLVO) theory and the more detailed Sogami-ISe theory predict that increased ionic strength will increase nanoparticle aggregation by shrinking the electrical double layer therefore decreasing interparticle repulsion (Saleh Kim et al 2008 French Jacobson et al 2009) Initially average particle Ag mass increases very rapidly in the high-salinity water (ie gt15-fold increase in less than one minute)
Figure 4 Mass-based mean particle mass of citrate-capped 50-nm Ag over time in deionized water and low- and high-salinity estuary waters (25x107 mL-1)
4
35
3
25
2 DI water
Station 7 15
Station 31 1
05
0
ma
ss-a
ve
rag
e m
ass
(fg
)
1 10 100 1000 10000
time (minutes)
The PDI of the 50-nm Ag particle Ag mass is not affected by either Station 7 or deionized water (Figure 5) Again there is substantial increase in the PDI of the particle Ag mass in the high salinity Station 31 water compared with the other waters much of this increase occurring in less than 1 minute This indicates that in addition to shifting to higher average particle Ag mass the particle Ag-mass distribution is broadened in Station 31 water
16
Figure 5 Polydispersity index of citrate-capped 50-nm Ag over time in deionized water and low- and high-salinity estuary waters (25x107 mL-1)
Po
lyd
isp
ers
ity
In
de
x
25
2
05
1
15
DI water
Station 7
Station 31
0
1 10
time (minutes)
100 1000 10000
There is significant increase over time in the measured ldquodissolvedrdquo Ag in all three waters (Figure 6) This relative increase is 24 for deionized water 45 for Station 7 water and 60 for Station 31 water As discussed previously SP-ICPMS cannot distinguish between dissolved silver and very small silver particles Partial dissolution of silver nanoparticles might be explained by the dilution of the excess capping agent when the standards are spiked into water
The total mass of silver measured decreased over time for all three waters (Figure 7) The reason for this loss of silver is not fully explained at present Some loss in total silver could be expected for the Station 31 water from precipitation of larger aggregates but there was no observable aggregation in the other waters One possible cause is a slow precipitation or adsorption on the container walls of primary particles
17
Figure 6 Change in measured ldquodissolvedrdquo silver over time in suspensions of citrate-capped 50-nm Ag in deionized water and low- and high-salinity estuary waters (25x107 mL-1)
120shy
100shy
Dis
solv
ed
A
g (
fg) 80shy
60shy
40shy
20shy
0shy
time (minutes)
1 10 100 1000 10000shy
DI watershy
Station 7shy
Station 31shy
Figure 7 Change in total measured silver over time in suspensions of citrate-capped 50-nm Ag in deionized water and low- and high-salinity estuary waters (25x107 mL-1)
0
100
200
300
400
500
600
700
800
900
To
tal
ma
ss A
g i
n S
usp
en
sio
n (
fg)
DI water
Station 7
Station 31
1 10 100 1000 10000shy
time (minutes)
18
Comparison of transformations of 50-nm and 100-nm citrate-capped silver ENM
The transformation rates of 50-nm and 100-nm citrate-capped silver ENM were compared at particle concentrations of 25x107 mL-1 over 1400 minutes Because transformation rates for 50-nm silver were fastest in the high-salinity Station 31 water that sample was used for the comparison The PDI of the particle Ag mass was used as a measure of particle aggregation The PDI of the 50-nm silver suspension increased 16 over 1400 minutes (Figure 8) The PDI of the 100-nm suspension increased by 36 over the same time This supports a conclusion that the rate of aggregation of silver nanoparticles increases with particle size He et al studied the effect of particle size on hematite nanoparticle aggregation and concluded that ldquoat the same ionic strength aggregation rates are higher for smaller particles (He Wan et al 2008) However that study was done at constant hematite mass concentration so it is not necessarily contradictory to the conclusion of this study The silver mass concentration was 8 times higher in the 100-nm silver suspension than in the 50-nm suspension at the same 25x107 mL-1 particle concentration
The increase in the ldquodissolvedrdquo silver concentration in the 100-nm silver suspension was 34 times the increase in the 50-nm suspension (Figure 9) Because the dissolution rate should be proportional to surface area this is in fair agreement with the 4-fold greater surface total silver area in the former suspension
19
Figure 8 Increase in PDI over time for suspensions of 50-nm and 100-nm citrate-capped Ag in high-salinity estuary water (25x107 mL-1)
3shy
25
Po
lyd
isp
ers
ity
In
de
x
2shy
15shy
1shy
05
0
time (minutes)
1 10 100 1000 10000shy
50 nm Ag
100 nm Ag
Figure 9 Increase in ldquodissolvedrdquo silver over time for suspensions of 50-nm and 100-nm citrate-capped Ag in high-salinity estuary water (25x107 mL-1)
0
20
40
60
80
100
120
140
160
180
Dis
solv
ed
A
g (
fg)
50 nm Ag
100 nm Ag
1 10 100 1000 10000shy
time (minutes)
20
Comparison of transformations of PVP-capped and citrate-capped 50shynm silver ENM
The transformation rates of PVP-capped and citrate-capped 50-nm silver ENM were compared at particle concentrations of 25x107 mL-1 over 1400 minutes As with the previous comparison of different size particles the high-salinity Station 31 water was used for the comparison and the PDI of the particle Ag mass was used as a measure of particle aggregation The PDI increase over 1400 minutes was 45 for the PVP-capped silver compared with 16 for the citrate capped silver (Figure 10)
Figure 10 Increase in PDI over time for suspensions of PVP-capped and citrate-capped 50-nm Ag in high-salinity estuary water (25x107 mL-1)
25
2
15
Citrate 1shy
PVPshy
05
0
time (seconds)
Po
lyd
isp
ers
ity
In
de
x
1 10 100 1000 10000
The increase in the ldquodissolvedrdquo silver concentration in the PVP-capped suspension over 1400 minutes is 225 times greater than that in the citrate-capped suspension (Figure 11) although the PVP surface area is only 18 larger
21
Figure 11 Increase in ldquodissolvedrdquo silver over time for suspensions of PVP-capped and citrate-capped 50-nm Ag in high-salinity estuary water (25x107 mL-1)
140
120
100
80
60 Citrate
PVP 40
20
0
time( minutes)
Dis
solv
ed
A
g (
fg)
1 10 100 1000 10000
Transformation of 50-nm citrate-capped silver ENM at low particle concentration
The transformations of 50-nm citrate capped silver ENM suspensions in all four surface waters were monitored over 1400 minutes this time at a concentration of 25x105 mL-1 100-fold more dilute than the previous experiments The percent changes in mass-based mean particle Ag mass PDI of the particle Ag measured ldquodissolvedrdquo Ag mass and measured total Ag mass were calculated for 1400 minutes exposure (Figure 12) At this concentration there is very little evidence of aggregation in terms of either average particle Ag mass or PDI of the particle Ag mass The single exception is a moderate increase in average particle Ag mass in the Alafia River water These results are consistent with aggregation following pseudo second-order kinetics There is evidence of some total silver mass loss By far the most dominant process at this low concentration is an increase in ldquodissolvedrdquo silver
22
F
Figure 12 Changes in suspension metrics of 50-nm citrate-capped silver after 1400 minutes (25x105 mL-1)
-50
0
50
100
150
200
c
ha
ng
e
Station 31
Station 7
Lake Hancock
Alafia River
mass-average polydispersity dissolved Ag total mass Ag
particle mass index
The overall changes over 1400 minutes for 25x105 mL-1 (Figure 13 ndash blue bars) and 25x107 mL-1 (Figure 13 ndash red bars) were compared Not only was apparent dissolution the dominant process at the lower concentration the degree of apparent dissolution was more than 5-fold greater over 1400 minutes than at high concentration as a percentage of the original value The silver mass concentration of the suspension at a particle concentration of 25x105 mL-1 was 016 microgL (as calculated from 20 mgL concentration of the purchased standard) This concentration is much more realistic than the 16 microgL concentration at a particle concentration of 25x107 mL-1 with respect to the concentrations of engineered nanoparticles likely to be currently encountered in the environment
23
-100
-50
0
50
100
150
200
c
ha
ng
e 25x107 mL-1
25x105 mL-1
mass-average polydispersity dissolved Ag total mass Ag
mass index
24
Conclusions and Future Work The study reported here demonstrates the effectiveness of SP-ICPMS for rapidly
screening surface water for metal-containing nanoparticles This capability would allow large numbers of water samples to be screened The samples showing possible presence of target nanoparticles could then be analyzed by more selective techniques that are much more time-consuming and costly The study reported here shows another advantage of the rapid screening capability of SP-ICPMS Rates of transformations such as aggregation and dissolution can be studied with high temporal resolution In this case the data related to aggregation is reliable even in complex water matrices Dissolution information is screening-level because SP-ICPMS cannot differentiate dissolved metal from very small nanoparticles The sensitivity of current ICPMS instruments precludes SP-ICPMS from distinguishing particles smaller than about 15-20 nm from dissolved silver This would prohibit its use in studying primary particles of consumer products containing small nanoparticles On the other hand SP-ICPMS could also be used to study disaggregation if the primary particles are larger than this lower limit
This study confirms the results of other studies of aggregation of nanoparticles at high ionic strength and high (gt107 mL-1) nanoparticle concentrations in both synthetic laboratory media (Saleh Kim et al 2008 French Jacobson et al 2009 Trinh Kjoslashniksen et al 2009) and natural water (Chinnapongse MacCuspie et al 2011) Those studies all found that aggregation of a variety of nanoparticles increased with increasing ionic strength However this study also shows that at low silver nanoparticle concentration (25x105 mL-1) aggregation is minimal over 24 hours even in highly saline estuary water Instead the dominant process is one that is consistent with either dissolution of the nanoparticles or formation of smaller nanoparticles that cannot be experimentally distinguished from dissolved This has not been observed in previous studies because the sensitivity of the analytical techniques used could not study transformation at low nanoparticle concentration Studies in this concentration regime are critical because it is the range of expected environmental concentrations of engineered nanoparticles (Kiser Westerhoff et al 2009)
These transformation study results are preliminary and more detailed research is planned These additional studies will investigate the role of natural organic matter on transformations at low nanoparticle concentration to compare with previous studies at high concentration that found suppression of aggregation by NOM (Liu Wazne et al 2010 Thio Zhou et al 2011) The effects of pH temperature and oxygen saturation should also be investigated Finally ultrafiltration and other approaches will be explored to elucidate the nature of the ldquodissolvedrdquo silver Finally hyphenated methods will be developed
25
References
Alvarez P J J V Colvin et al (2009) Research Priorities to Advance Eco-Responsible Nanotechnology ACS Nano 3(7) 1616-1619
Chinnapongse S L R I MacCuspie et al (2011) Persistence of singly dispersed silver nanoparticles in natural freshwaters synthetic seawater and simulated estuarine waters Science of The Total Environment 409(12) 2443-2450
Degueldre C and P Y Favarger (2004) Thorium colloid analysis by single particle inductively coupled plasma-mass spectrometry Talanta 62(5) 1051-1054
Degueldre C P Y Favarger et al (2004) Zirconia colloid analysis by single particle inductively coupled plasma-mass spectrometry Analytica Chimica Acta 518(1-2) 137-142
Degueldre C P Y Favarger et al (2006) Gold colloid analysis by inductively coupled plasma-mass spectrometry in a single particle mode Analytica Chimica Acta 555(2) 263-268
Ebenstein Y E Nahum et al (2002) Tapping Mode Atomic Force Microscopy for Nanoparticle Sizing TipacircˆrsquoSample Interaction Effects Nano Letters 2(9) 945-950
Filella M J Zhang et al (1997) Analytical applications of photon correlation spectroscopy for size distribution measurements of natural colloidal suspensions capabilities and limitations Colloids and Surfaces A Physicochemical and Engineering Aspects 120(1-3) 27-46
French R A A R Jacobson et al (2009) Influence of Ionic Strength pH and Cation Valence on Aggregation Kinetics of Titanium Dioxide Nanoparticles Environmental Science amp Technology 43(5) 1354-1359
Gray P J J W Olesik et al (2009) Particle Size Effects on Vaporization in Laser Ablation Inductively Coupled Plasma Mass Spectrometry Pittsburgh Conference on Analytical Chemistry and Applied Spectroscopy Chicago IL
Handy R F von der Kammer et al (2008) The ecotoxicology and chemistry of manufactured nanoparticles Ecotoxicology 17(4) 287-314
Hasselloumlv M (2009) Detection and Characterization of engineered nanoparticle in the enviroment using Field-Flow Fractionation coupled to ICP-MS in single nanoparticle detection mode Goteborg Setac Europe
Hasselloumlv M J Readman et al (2008) Nanoparticle analysis and characterization methodologies in environmental risk assessment of engineered nanoparticles Ecotoxicology 17(5) 344-361
He Y J Wan et al (2008) Kinetic stability of hematite nanoparticles the effect of particle sizes Journal of Nanoparticle Research 10(2) 321-332
Heithmar E (2009) Characterizing Metal-based Nanoparticles in Surface Water by Single-Particle ICPMS 237th ACS National Meeting Salt Lake City Utah
Kammer F v d M Baborowski et al (2005) Field-flow fractionation coupled to multi-angle laser light scattering detectors Applicability and analytical benefits for the analysis of environmental colloids Analytica Chimica Acta 552(1-2) 166-174
Kim T C-H Lee et al (2008) Kinetics of gold nanoparticle aggregation Experiments and modeling Journal of Colloid and Interface Science 318(2) 238-243
26
Kiser M A P Westerhoff et al (2009) Titanium Nanomaterial Removal and Release from Wastewater Treatment Plants Environmental Science amp Technology 43(17) 6757-6763
Klaine S J P J J Alvarez et al (2008) NANOMATERIALS IN THE ENVIRONMENT BEHAVIOR FATE BIOAVAILABILITY AND EFFECTS Environmental Toxicology amp Chemistry 27 1825-1851
Koirtyohann S R J S Jones et al (1980) Nomenclature system for the low-power argon inductively coupled plasma Analytical Chemistry 52(12) 1965-1966
Lam J W H and G Horlick (1990) A Comparison of Argon and Mixed Gas Plasmas for Inductively Coupled Plasma-mass Spectrometry Spectrochimica Acta Part B Atomic Spectroscopy 45
Lesher E K J F Ranville et al (2009) Analysis of pH Dependent Uranium(VI) Sorption to Nanoparticulate Hematite by Flow Field-Flow Fractionation - Inductively Coupled Plasma Mass Spectrometry Environmental Science amp Technology 43(14) 5403-5409
Lin W-C and M-C Yang (2005) Novel SilverPoly(vinyl alcohol) Nanocomposites for Surface-Enhanced Raman Scattering-Active Substrates Macromolecular Rapid Communications 26(24) 1942-1947
Liu X M Wazne et al (2010) Effects of natural organic matter on aggregation kinetics of boron nanoparticles in monovalent and divalent electrolytes Journal of Colloid and Interface Science 348(1) 101-107
Monserud J H E K Lesher et al (2009) Real Time Single Particle-inductively Coupled Plamsa-mass Spectrometry for Detection and Characterization of Nanoparticles 237th ACS National Meeting Salt Lake City Utah
Mueller N C and B Nowack (2008) Exposure Modeling of Engineered Nanoparticles in the Environment Environmental Science amp Technology 42 4447-4453
OConnor G and E H Evans (1999) Fundamental aspects of ICP-MS Inductively Coupled Plasma Spectrometry and its Applications S J Hill Sheffield Sheffield Academic Press 119-144
Pyrz W D and D J Buttrey (2008) Particle Size Determination Using TEM A Discussion of Image Acquisition and Analysis for the Novice Microscopist Langmuir 24(20) 11350-11360
Saleh N H-J Kim et al (2008) Ionic Strength and Composition Affect the Mobility of Surface-Modified Fe0 Nanoparticles in Water-Saturated Sand Columns Environmental Science amp Technology 42(9) 3349-3355
Schulte P C Geraci et al (2008) Occupational Risk Management of Engineered Nanoparticles Journal of Occupational amp Environmental Hygiene 5 239-249
Schurtenberger P M E Newmen et al (1993) Environmental Particles J Buffle HP van Leeuwen (Eds) 2 37
Takagi A A Hirose et al (2008) Induction of mesathelioma in p53+- mouse by intraperitioneal application of multi-wall carbon nanotube Journal of Toxicol Science 33 105-116
Tang Z L Wu et al (2009) Size fractionation and characterization of nanocolloidal particles in soils Environmental Geochemistry and Health 31(1) 1-10
Taylor H E (2001) Inductively Coupled Plasma-Mass Spectrometry Practices and Techniques San Diego Academic Press
27
Thio B J R D Zhou et al (2011) Influence of natural organic matter on the aggregation and deposition of titanium dioxide nanoparticles Journal of Hazardous Materials 189(1-2) 556-563
Thomas R (2004) Practical Guide to ICP-MS New York Marcel Dekker Inc Tiede K A B A Boxall et al (2010) Application of hydrodynamic chromatography-ICP-
MS to investigate the fate of silver nanoparticles in activated sludge Journal of Analytical Atomic Spectrometry 25(7) 1149-1154
Tiede K M Hasselloumlv et al (2009) Considerations for environmental fate and ecotoxicity testing to support environmental risk assessments for engineered nanoparticles Journal of Chromatography A 1216(3) 503-509
Trinh L A-L Kjoslashniksen et al (2009) Slow salt-induced aggregation of citrate-covered silver particles in aqueous solutions of cellulose derivatives Colloid amp Polymer Science 287(12) 1391-1404
28
Please make all necessary changes on the below label detach or copy and return to the address in the upper left hand corner
If you do not wish to receive these reports CHECK HERE detach or copy this cover and return to the address in the upper left hand corner
Office of Research and Development (8101R) Washington DC 20460
Official Business Penalty for Private Use $300 EPA600R-11096September 2011 wwwepagov
RecycledRecyclable
Printed with vegetable-based ink on v paper that contains a minimum of 50 post-consumer fiber content processed chlorine free
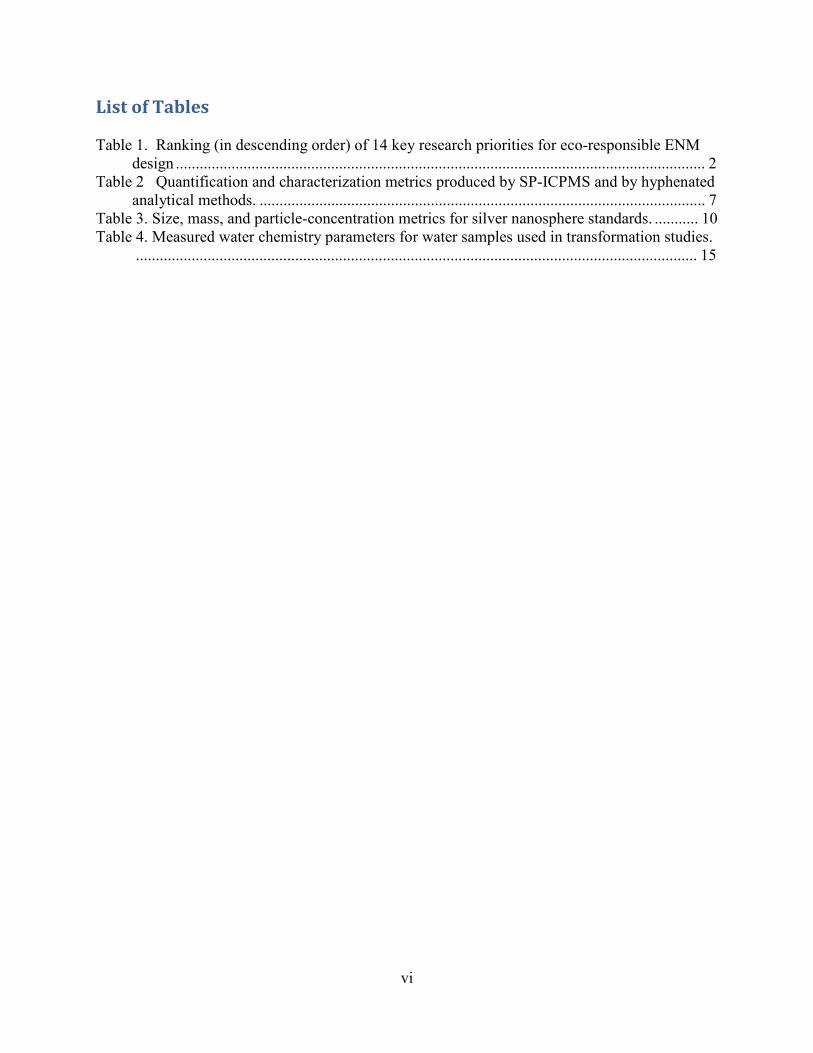
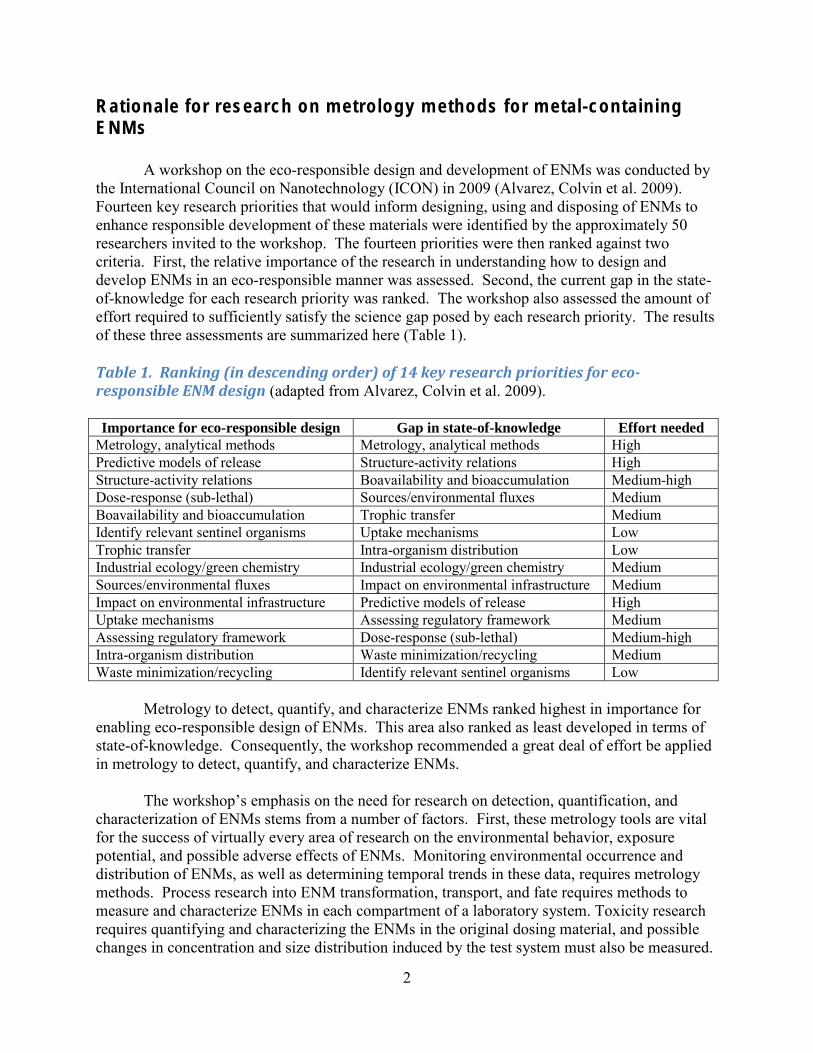
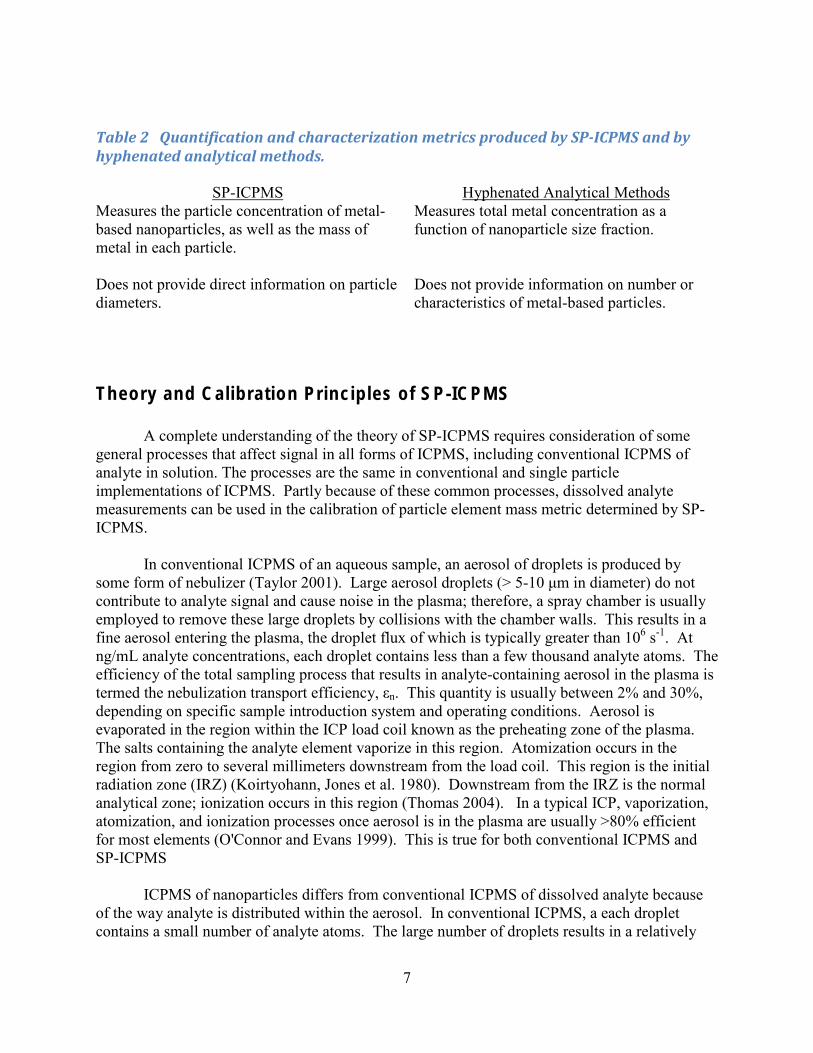
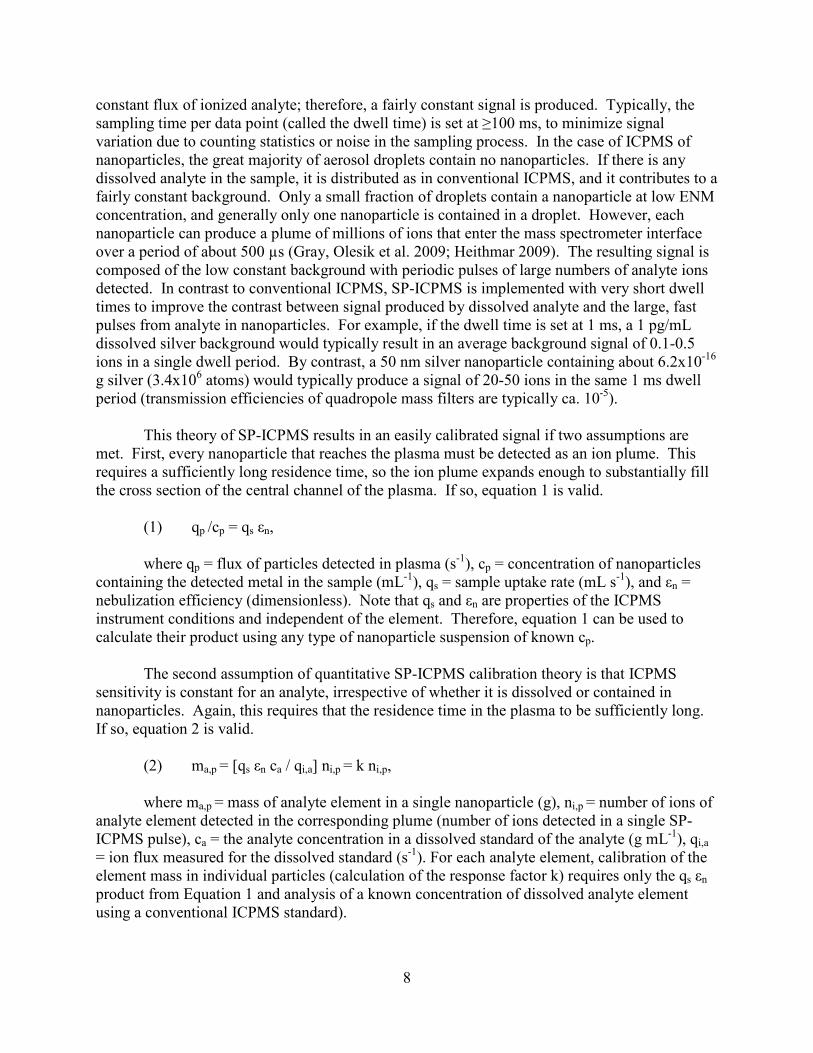
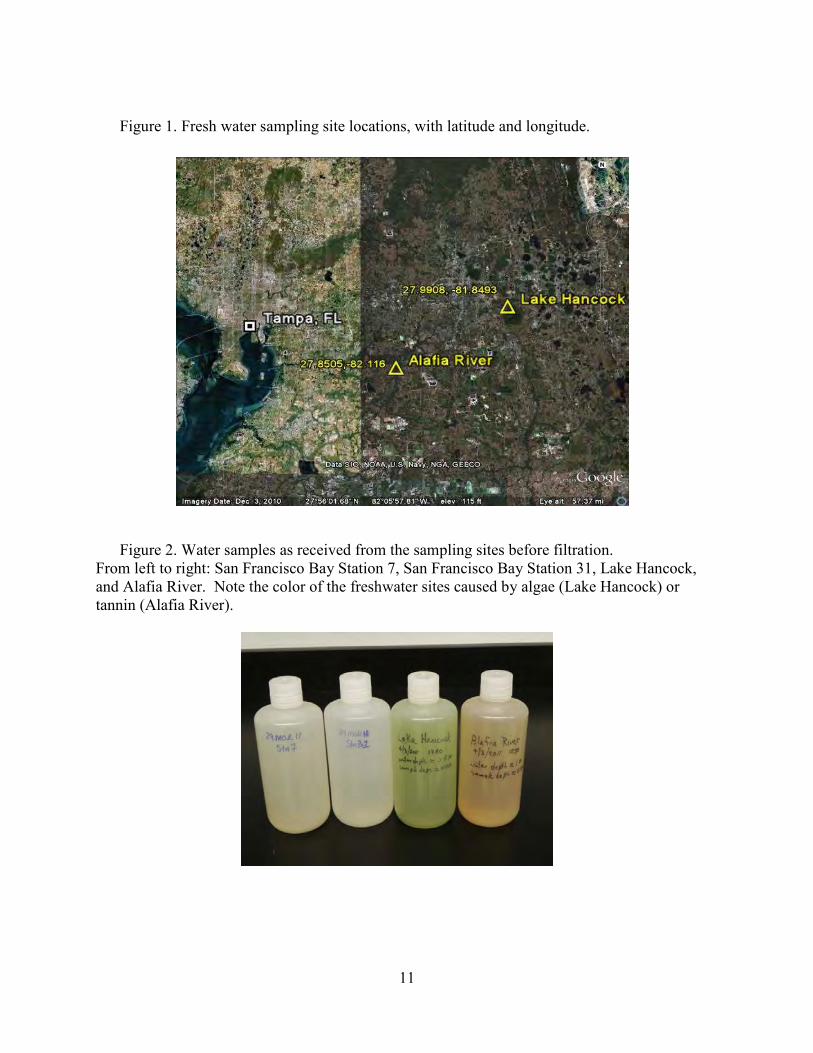
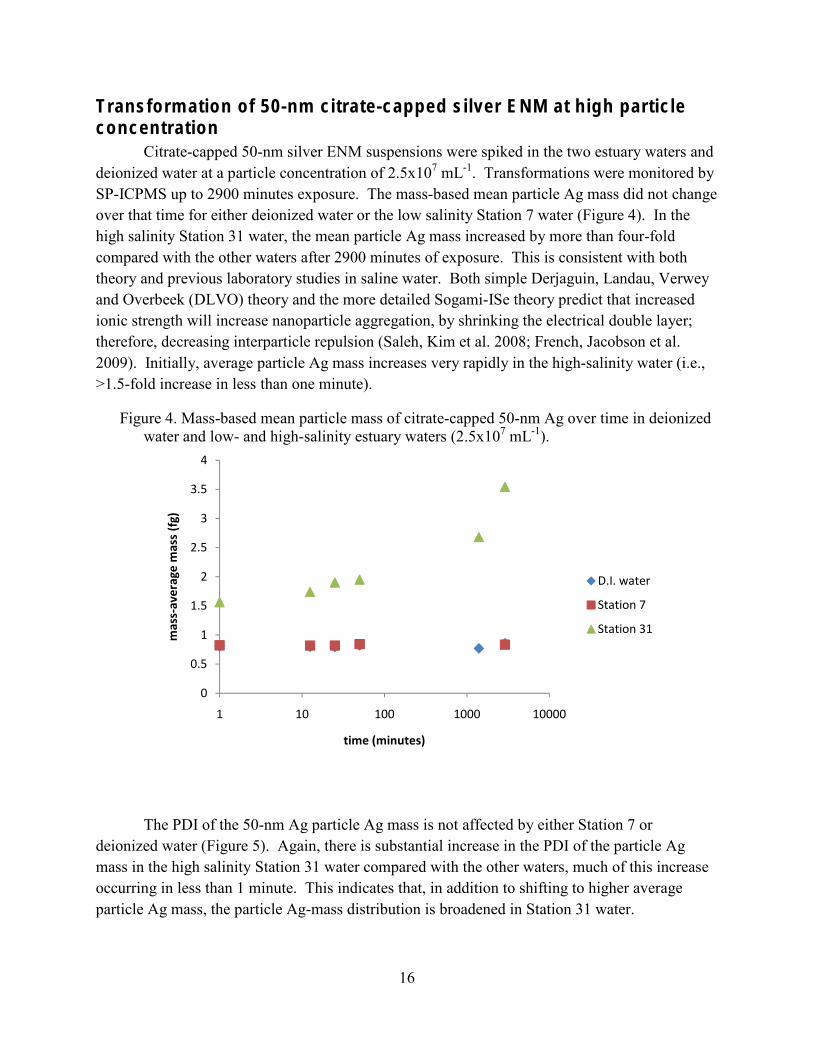
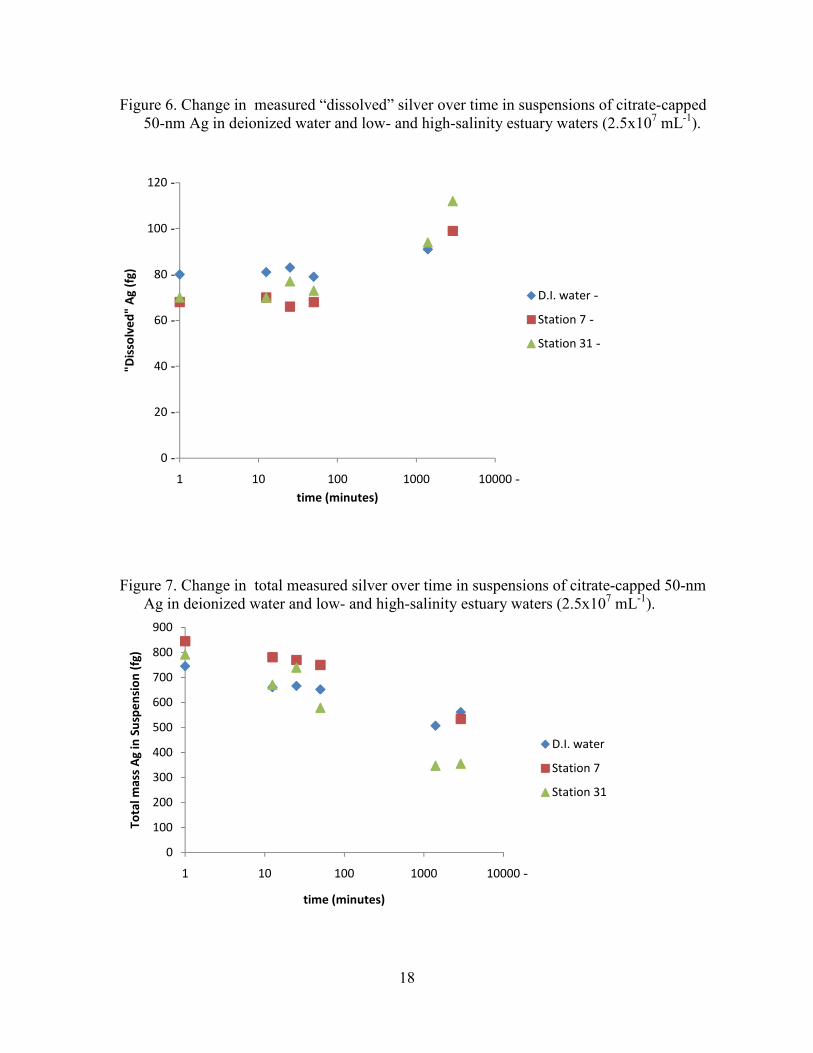
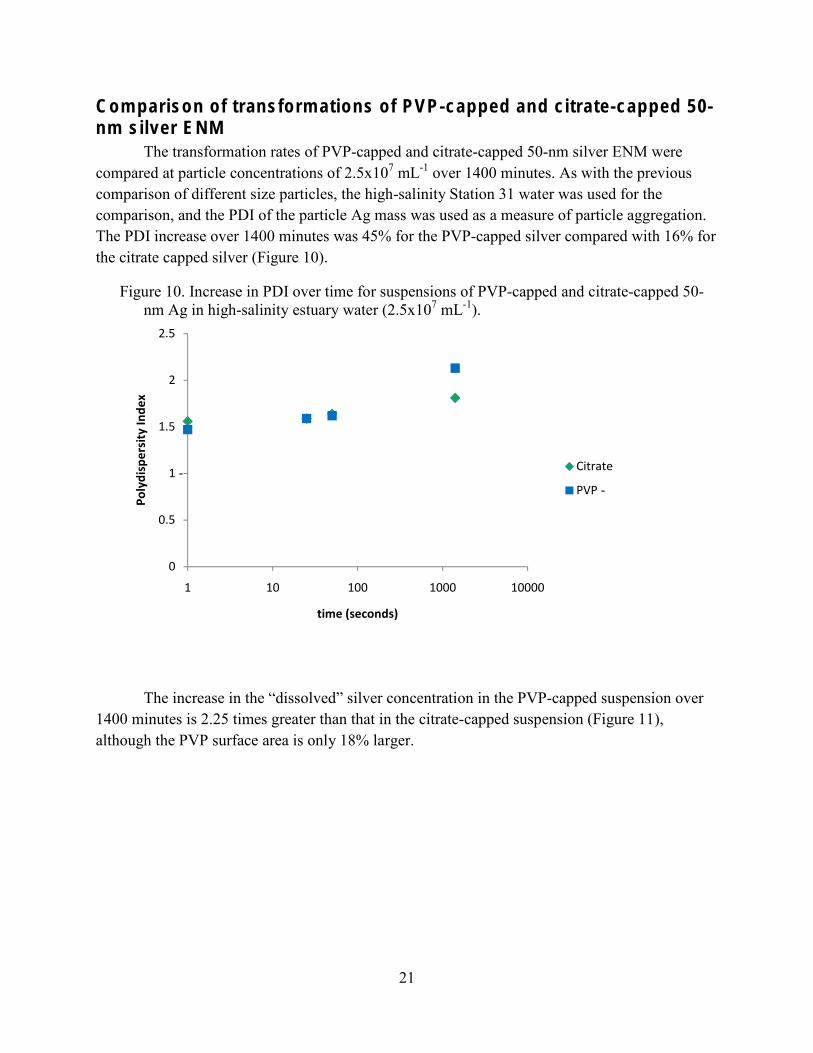
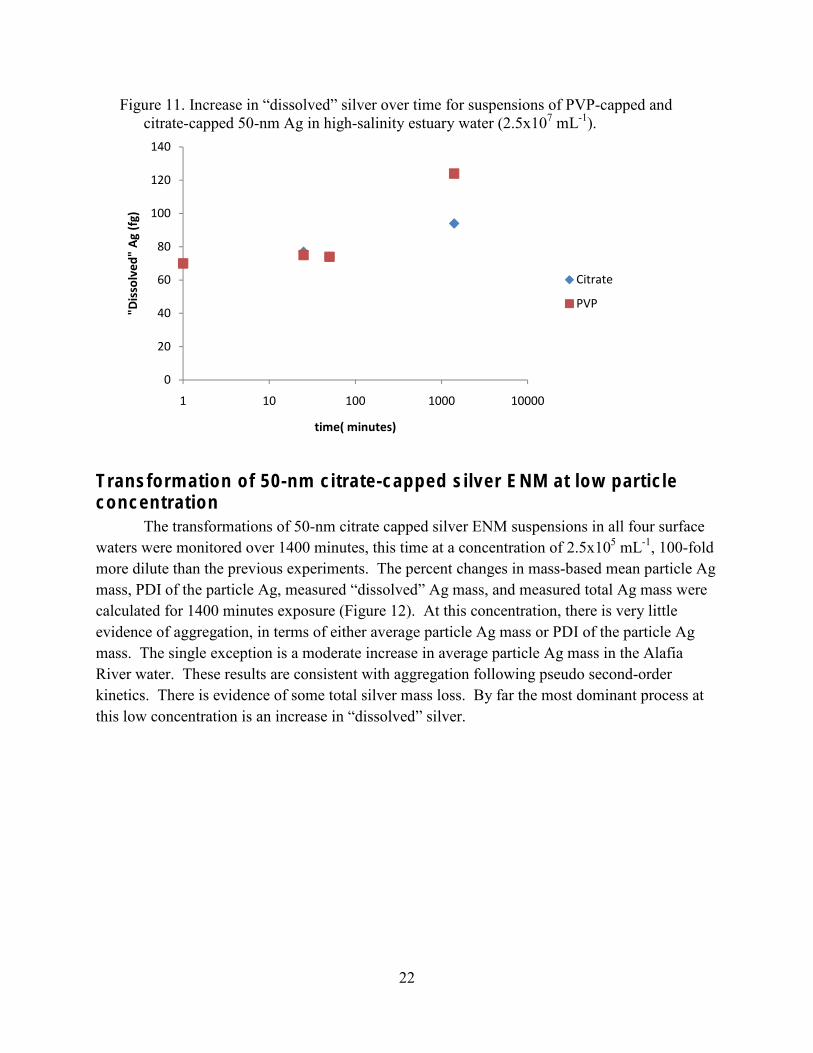
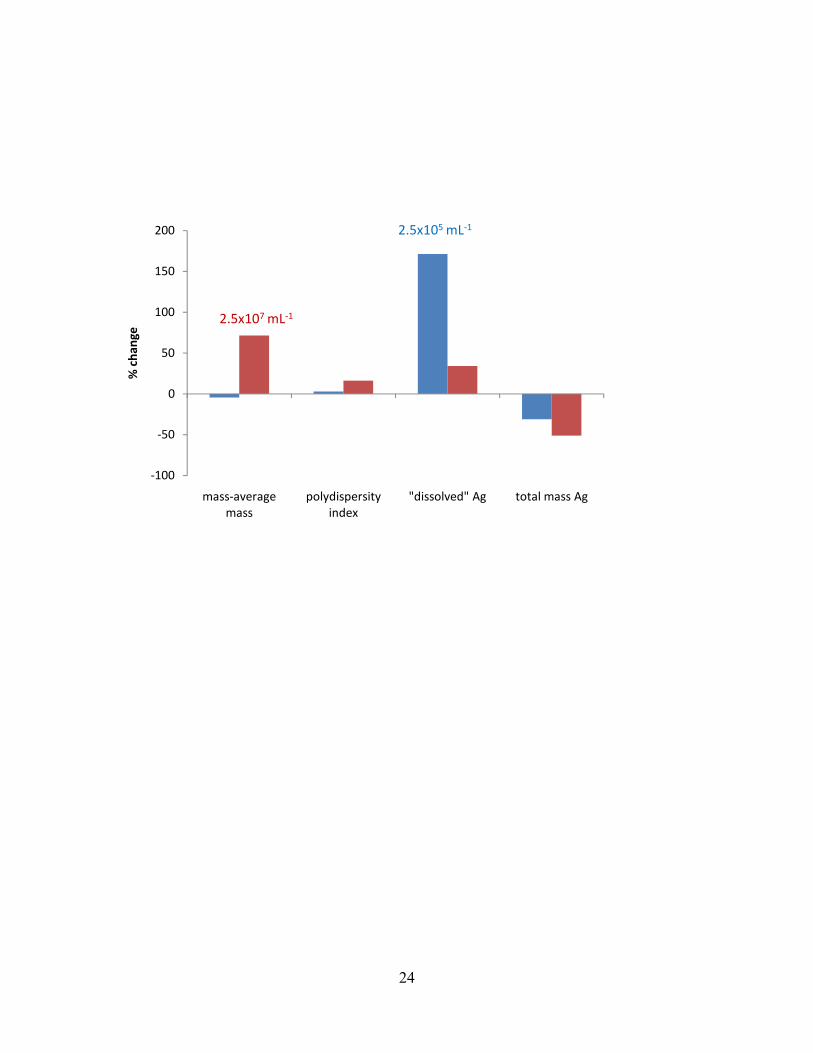