screening assessment quinoline - · pdf fileunder the canadian environmental protection act,...
TRANSCRIPT

Screening Assessment
Quinoline
Chemical Abstracts Service Registry Number 91-22-5
Environment Canada Health Canada
November 2011
Screening Assessment CAS RN 91-22-5
Synopsis Under the Canadian Environmental Protection Act, 1999 (CEPA 1999), the Ministers of the Environment and of Health have conducted a screening assessment of quinoline, Chemical Abstracts Service Registry Number 91-22-5*, which was a substance on the Domestic Substances List (DSL) selected for a pilot project for screening assessments. Quinoline is naturally associated with coal and coal-derived compounds and may be formed as a trace pollutant during incomplete combustion of nitrogen-containing substances. Potential sources of quinoline release to water include discharges of creosote, coal tar and associated contaminated groundwater from contaminated sites at former coal gasification plants (or gasworks) and former and existing steel plants equipped with coke ovens, coal tar distillation facilities, wood impregnation plants and aluminum smelters. Much of the quinoline monitoring information is related to past industrial activities. It should be noted that environmental protection measures have been implemented in Canada, in particular for steel plants equipped with coke ovens and for wood preservation facilities. In the case of abandoned gasworks, many sites have been the object of restoration plans due to provincial and federal legislation. Although these initiatives have targeted pollutants such as polycyclic aromatic hydrocarbons (PAHs), benzene, toluene, ethylbenzene and xylenes, they should also be effective in addressing quinoline contamination. In addition, creosote-impregnated waste materials from creosote-contaminated sites, PAHs and benzene have been placed on Schedule 1 of CEPA 1999. Quinoline has been measured in the atmosphere of urban areas. Due to known releases of PAHs, air emissions of quinoline are also likely associated with steel plants equipped with coke ovens and aluminum smelters. Atmospheric releases reported to the National Pollutant Release Inventory (NPRI) in 2009 totalled 390 kg, and 82 tonnes were transferred off-site as waste for incineration. No release to water was reported. Releases were reported to the NPRI by chemical manufacturers, chemical product manufacturers, and an iron foundry. Based on a survey conducted under section 71 of CEPA 1999, one or more companies in Canada reported manufacture or import of quinoline in excess of 20 000 kg during the calendar year 2000, in the form of mixtures which contained quinoline at a composition of less than 1%. Quinoline has been detected in coal tar–based products, such as sealcoats used on parking lots and driveways and creosote used in the past as a preservative in the lumber and wood industries. Presently there is one commercial brush-on product containing creosote registered for remedial treatment of cuttings for installing the railway ties, and piers and 2 commercial products for use only within wood treatment facilities. Quinoline is not a registered active ingredient or formulant in pesticides in Canada.
* The Chemical Abstracts Service Registry Number (CAS RN) is the property of the American Chemical Society and any use or redistribution, except as required in supporting regulatory requirements and/or for reports to the government when the information and the reports are required by law or administrative policy, is not permitted without the prior, written permission of the American Chemical Society.
ii

Screening Assessment CAS RN 91-22-5
Environment Quinoline is not persistent in surface waters. This substance has been shown to be biodegradable in soil under conditions favouring the growth of microorganisms. However, field evidence suggests that quinoline is difficult to degrade by microorganisms living in deep soil and groundwater. In general, these media offer poor conditions for biodegradation, such as low oxygen levels, low temperatures and few carbon sources. An absence of significant degradation of quinoline associated with the occurrence of coal tar in soils has been frequently observed. Quinoline is expected to persist in air in wintertime with an atmospheric half-life exceeding 99 hours. Based on Level III fugacity modelling of the substance’s fate in the environment, if released to surface water, quinoline will remain for the most part in that compartment. Similarly, if released to soil, the molecule will remain mainly in soil. If released to the atmosphere, because of its relatively low volatility, 82% of quinoline will partition to soil and surface water, and the remainder will stay in air. According to a model (TaPL3) assessing the long-range transport potential of substances, quinoline is predicted to be transported for long distances (e.g., >1500 km) in water, but not in the atmosphere. Quinoline has a low potential to bioaccumulate. It has been shown that biotransformation of quinoline in bacteria, fish and laboratory mammals leads to the formation of an active epoxide intermediate. Some epoxide forms can bind to proteins and nucleic acids and potentially lead to genotoxicity. Consistent with this metabolic activation, quinoline has been shown to be genotoxic in both in vivo and in vitro assays. Quinoline is not routinely measured in any environmental medium in Canada, and few sampling data were available for this assessment. However, quinoline is a constituent of coal tar and creosote, and any current or past industrial activity that has released coal tar or creosote into the environment has included the release of quinoline. Most often, releases are to the subsurface as a result of leaking storage tanks, and pools of pure coal tar have been discovered at many abandoned gasworks sites, many of which reaching nearby watercourses. For the ecological portion of this screening assessment, an exposure scenario was designed whereby a contaminated groundwater plume containing quinoline develops from a pure coal tar pool in the soil and eventually comes into contact with surface waters. It was based on field observations of coal tar plumes made at abandoned gasworks sites and coke oven sites in Canada. This exposure scenario would be relevant to current industrial applications producing or handling coal tar or creosote on-site, including coal tar distillation plants, creosoting plants and roofing felt and tarred paper manufacturing facilities, as well as abandoned gasworks and coke ovens, where storage and disposal of coal tar and creosote have led to a release of these chemical mixtures to the subsurface. Estimated dissolved quinoline concentrations were many times above the predicted no-effect concentration of 3.4 µg/L calculated for fish. Based on the risk quotients calculated in this assessment, quinoline has the potential to cause harmful
iii

Screening Assessment CAS RN 91-22-5
iv
effects to groundwater microorganisms, organisms living at the sediment–water interface, and early life stages of fish found on spawning grounds. On the basis of ecological hazard and reported releases of quinoline, it is concluded that this substance is entering the environment in a quantity or concentration or under conditions that have or may have an immediate or long-term harmful effect on the environment or its biological diversity. Human Health On the basis of the empirical evidence that increased incidences of unusual tumors were observed in multiple strains of rats and mice exposed to quinoline orally, the critical effect for the characterization of risk of quinoline to human health is considered to be carcinogenicity. The US Environmental Protection Agency (EPA) had previously drawn the same conclusion. In addition, in experimental studies, quinoline also exhibited effects causing damage to DNA and altering cell reproduction and regeneration. Therefore, although the mode of induction of tumours of quinoline has not been fully elucidated, it cannot be precluded that the tumours observed in experimental animals resulted from direct interaction of quinoline or its metabolites with genetic materials, for which there may be a probability of harm at any level of exposure. General population exposure to quinoline is expected mainly through inhalation. Comparison of the critical effect level for non-cancer effects with the upper-bounding estimate of exposure results in a margin of exposure of approximately five orders of magnitude. This margin of exposure for non-cancer effects are considered adequate. On the basis of the carcinogenicity of quinoline, together with potential for general population exposure, it is concluded that quinoline is a substance that may be entering the environment in a quantity or concentration or under conditions that constitute or may constitute a danger in Canada to human life or health. Conclusion Based on available information for environmental and human health considerations, it is concluded that quinoline meets one or more of the criteria set out in section 64 of CEPA 1999. Additionally, it is concluded that quinoline meets the criteria for persistence but not for bioaccumulation potential as set out in the Persistence and Bioaccumulation Regulations. Where relevant, research and monitoring will support verification of assumptions used during the screening assessment and, where appropriate, the performance of potential control measures identified during the risk management phase.

Screening Assessment CAS RN 91-22-5
Introduction
This screening assessment was conducted pursuant to section 74 of the Canadian Environmental Protection Act, 1999 (CEPA 1999). This section of the Act requires that the Ministers of the Environment and of Health conduct screening assessments of substances that satisfy the categorization criteria set out in section 73 of the Act in order to determine whether they meet or may meet the criteria set out in section 64 of the Act. Screening assessments focus on information critical to determining whether a substance meets the criteria as set out in section 64 of CEPA 1999. Screening assessments examine scientific information and develop conclusions by incorporating a weight of evidence approach and precaution†. A screening assessment was undertaken for quinoline (Chemical Abstracts Service Registry Number 91-22-5) on the basis that this compound was included in the Domestic Substances List (DSL) pilot project for screening assessments because it met the criteria for persistence and inherent toxicity to non-human organisms and as a substance likely to be prioritized on the basis of greatest potential for human exposure. The 2005 version of the State of the Science Report for a screening health assessment of quinoline has been posted on the Health Canada website since January 30, 2006 (Health Canada 2005). The State of the Science Report for a screening health assessment was externally reviewed by staff of Toxicology Advice & Consulting Limited, the Lifeline Group (Mr. Paul Price), and Toxicology Excellence in Risk Assessment, and by Dr. Vic Armstrong, Consultant, for adequacy of data coverage and defensibility of the conclusions. The external comments were taken into consideration in finalizing the State of the Science Report. The health screening assessment included here is an update of the State of the Science Report; since limited new information was available, the update has not been peer reviewed. This screening assessment includes consideration of information on chemical properties, hazards, uses and exposure. Data relevant to the screening assessment of this substance were identified in original literature, review and assessment documents, and stakeholder research reports and from recent literature searches, up to November 2010 for ecological sections of the document and March 2009 for human health sections of the document. In addition, an industry survey was conducted in 2000 through a Canada Gazette Notice issued under the authority of section 71 of CEPA 1999 (Canada 2001). This survey collected data on the Canadian manufacture and import of the DSL pilot project
† A determination of whether one or more of the criteria of section 64 are met is based upon an assessment of potential risks to the environment and/or to human health associated with exposures in the general environment. For humans, this includes, but is not limited to, exposures from ambient and indoor air, drinking water, foodstuffs, and the use of consumer products. A conclusion under CEPA 1999 on the substances in the Chemicals Management Plan (CMP) Challenge Batches 1-12 is not relevant to, nor does it preclude, an assessment against the hazard criteria specified in the Controlled Products Regulations, which is part of regulatory framework for the Workplace Hazardous Materials Information System [WHMIS] for products intended for workplace use. Similarily, a conclusion based on the criteria contained in section 64 of CEPA 1999 does not preclude actions being taken under other sections of CEPA or other Acts. .
1

Screening Assessment CAS RN 91-22-5
substances (Environment Canada 2001a). Key studies were critically evaluated; modelling results may have been used to reach conclusions. The approach taken in the screening assessment is to examine various supporting information and develop conclusions based on a weight of evidence approach as required under section 76.1 of CEPA 1999. The screening assessment does not present an exhaustive review of all available data. Instead, it presents the critical studies and lines of evidence upon which the conclusion is based. Evaluation of risk to human health involves consideration of data relevant to estimation of exposure (non-occupational) of the general population, as well as information on health hazards. Decisions for human health are based on the nature of the critical effect and/or margins between conservative effect levels and estimates of exposure, taking into account confidence in the completeness of the identified databases on both exposure and effects, within a screening context. This final screening assessment was prepared by staff in the Existing Substances programs at Health Canada and Environment Canada. The ecological assessment has undergone external written peer review/consultation. As mentioned above, the State of the Science Report for a screening health assessment was previously externally reviewed. Additionally, the draft of this screening assessment was subject to a 60-day public comment period. Although external comments were taken into consideration, the final content and outcome of the screening assessment remain the responsibility of Health Canada and Environment Canada. The critical information and considerations upon which the final assessment is based are summarized below.
2

Screening Assessment CAS RN 91-22-5
Substance Identity Information on the identity of quinoline is presented in Table 1. Table 1. Substance identity
CAS RN 91-22-5 DSL name Quinoline
NCI names Benzo[b]pyridine (ECL) Quinoline (AICS, ASIA-PAC, EINECS, ENCS, NZIoC, PICCS, SWISS, TSCA)
Other names 1-Azanaphthalene, 1-Benzazine, 1-Benzine, Benzopyridine, 2,3-Benzopyridine, Chinoleine, Chinolin, Chinoline, Leucol, Leucoline, Leukol, Quinolin
Chemical group (DSL stream) Discrete organics
Major chemical class or use N-Heterocycles (aza-arenes)
Major chemical subclass Quinolines
Chemical formula C9H7N
Chemical structure
N
quinoline (base)
N
quinolinium ion(conjugated acid)
1
2
3
45
6
7
8 H+
SMILES C12C(CCCC1)NCCC2 Molecular mass 129.16 g/mol
Abbreviations: AICS, Australian Inventory of Chemical Substances; ASIA-PAC, Asia-Pacific Substances Lists; CAS RN, Chemical Abstracts Service Registry Number; DSL, Domestic Substances List; ECL, Korean Existing Chemicals List; EINECS, European Inventory of Existing Commercial Chemical Substances; ENCS, Japanese Existing and New Chemical Substances; NCI, National Chemical Inventories; NZIoC, New Zealand Inventory of Chemicals; PICCS, Philippine Inventory of Chemicals and Chemical Substances; SMILES, simplified molecular input line entry specification; SWISS, Swiss Giftliste 1 and Inventory of Notified New Substances; TSCA, Toxic Substances Control Act Chemical Substance Inventory. Source: NCI 2006
3

Screening Assessment CAS RN 91-22-5
Physical and Chemical Properties Quinoline is an organic base that belongs to the group of nitrogen heterocycles or aza-arenes. It is a hygroscopic liquid with a penetrating odour (Finley 1996). Table 2 presents selected physical and chemical properties identified for quinoline. Its boiling point, melting point and vapour pressure suggest that quinoline will be semivolatile under atmospheric conditions (2004 e-mail from Air Quality Research Branch, Environment Canada, to Ecological Assessment Division; unreferenced). The pKa value of 4.9 indicates that at ambient pH values (6–9 for most surface waters), nearly all quinoline will be present in the un-ionized form. Table 2. Physical and chemical properties of quinoline
Property Type Value Temperature Reference Melting point (°C) Experimental −15.0 – Mackay et al. 1999 Boiling point (°C)
Experimental
237.7
–
Mackay et al. 1999
Density (g/cm3)
Experimental 1.1 20°C Mackay et al. 1999
Experimental 8 25°C Mackay et al. 1999 Vapour pressure (Pa) Modelled 0.65 0°C MPBPWIN 2000
Henry’s law constant (Pa·m3/mol)
Estimated (VP/sol)1 0.169 25°C Mackay et al. 1999
log Kow (dimensionless) Experimental 2.10 Mackay et al. 1999
Log Koc (dimensionless) – 3.26 – Fowler et al. 1994
Water solubility (mg/L) Experimental 6110 25°C Mackay et al. 1999
pKa (dimensionless) Experimental 4.9 20°C Mackay et al. 1999 kOH (cm3/molecule per second) Estimated 1.16 × 10⁻¹¹ 24°C Mackay et al. 1999
Abbreviations: Koc, organic carbon–water partition coefficient; kOH, rate constant for gas-phase reaction with hydroxyl radical; Kow, octanol–water partition coefficient; pKa, acid dissociation constant. 1 Vapour pressure/water solubility.
Sources As a nitrogen-substituted PAH, quinoline can be present to various extent in many PAH mixtures (Environment Canada 1999; McNeil 1981). Quinoline has been detected as a component of the essential oil (0.2%) of Hibiscus syriacus (Hanny et al. 1973), a component of the spearmint oil (0.09 ppm) of Mentha gentilis f. cardiaca, a component of the peppermint oil (0.06 ppm) of Mentha piperita (Ishihara et al. 1992), a volatile constituent of carambola fruit extract (0.5% of the gas-liquid chromatography area) (Wilson et al. 1985) and a composition of the sclerotial exudate (0.33 ± 0.12 %) of the fungal plant pathogen Rhizoctonia solani ( Aliferis and Jabaji 2010). Quinoline is naturally present in coal (Clemo 1973). Coal tar is produced from coal as a by-product of
4

Screening Assessment CAS RN 91-22-5
metallurgical coke production in Canada and is recovered and refined as an intermediate for industrial use and as an ingredient in several commercial/consumer products (2010 e-mail from Mining and Processing Division, Environment Canada, to Ecological Assessment Division, Environment Canada; unreferenced). Quinoline remains present in industrially produced coal tar and its distillation products—coal tar oils and coal tar pitch. Coal tar oils are refined to produce creosote in Canada. Use of creosote as a wood preservative in Canada is well documented (2010 e-mail from Chemicals Management Division, Environment Canada, to Ecological Assessment Division, Environment Canada; unreferenced). Coal tar pitch is used in several industrial sectors, including aluminum smelting, and in manufacturing of graphite electrodes, specialty carbon products and asphalt pavement sealers. Aluminum smelters are important consumers of coal tar pitch (McNeil 1981; Sutton 2008). Pure quinoline is produced commercially from coal tar distillates (HSDB 2003). It can be extracted from bone oil (EOHS 1983), and it can be produced by the Skraup synthesis, in which aniline is heated with glycerol and nitrobenzene in the presence of sulfuric acid (Finley 1996). Based on a survey conducted under section 71 of CEPA 1999, one or more companies in Canada reported manufacture or import of quinoline in excess of 20 000 kg during the calendar year 2000 as part of mixtures of which quinoline is less than 1% of the composition (Environment Canada 2001a), however more recent data is not available.
Uses Quinoline has been detected in coal tar–based products, such as sealcoats used on parking lots and driveways and creosote used in the past as a preservative in the lumber and wood industries for uses that are no longer permitted. Presently there is one commercial brush-on product containing creosote registered for remedial treatment of cuttings for installing the railway ties, and piers and two commercial products for use only within wood treatment facilities. Quinoline is not a registered active ingredient or formulant in pesticides in Canada (Zhu 2007; EHS 2010; HSDB 2003; 2011 e-mail from Pest Management Regulatory Agency, Health Canada, unreferenced). Quinoline was also identified as being used as a component in fragrance mixtures (RIFM 2003). It is described in public literature that quinoline has been used as a solvent, chemical intermediate and corrosion inhibitor and in the manufacture of dyes and pharmaceuticals, although there is no evidence of these uses in Canada (Finley 1996; HSDB 2003). The primary use of quinoline is as a precursor in the production of 8-quinolinol, a chelation agent used to complex pharmaceuticals and veterinary drugs and added to anti-dandruff shampoo (HSDB 2003). Quinoline is also a precursor in the production of copper-8-hydroxyquinolate (HSDB 2003). Industrial applications of quinoline include the manufacture of methine dyes and terpene production; quinoline is also used as a decarboxylation reagent, as a solvent of PAHs in paint production, and as a chemical intermediate and anti-foaming agent in petrochemical manufacturing (Scorecard 2005;
5

Screening Assessment CAS RN 91-22-5
HSDB 2003). It acts as a corrosion inhibitor when included in ethylene glycol–type antifreeze or in cement casings for steel reinforcing wires and rods and is used in extraction and separation and as an additive in plating baths (Finley 1996).
Releases to the Environment Quinoline is naturally associated with coal and coal-derived compounds and may be formed as a trace pollutant during incomplete combustion of nitrogen-containing substances (HSDB 2003). Natural background levels in Canada are not known; however, measurements of trace quantities of quinoline in pre-industrial sediments suggest low-level natural sources of this substance. Furlong and Carpenter (1982) measured concentrations of quinoline ranging between 120 and 770 ng/g organic carbon in sediments from pre-1870 in Puget Sound, Washington. Release of quinoline in Canada in 2009 was reported to the National Pollutant Release Inventory by five facilities: a petroleum refiner, a producer of roof coatings and associated chemicals, a coal tar pitch producer, a manufacturer of fabricated metal products, and a manufacturer of chemical products. On-site releases to air totalled 390 kg, and 82 tonnes were incinerated off-site. Off-site landfill disposal totalled 578 kg. No release to water was reported (NPRI 2009). Reported sources of quinoline releases to the environment include coal tar distillate (creosote) facilities and wood impregnation plants, creosote-impregnated wood used in harbour docks, creosote-impregnated railroad frames used in support walls along lake shorelines (Canada 1993), steel plants equipped with coke ovens (Onuska and Terry 1989; Kauss and Hamdy 1991), aluminum smelters (2009 e-mail from Division Mines et traitement – Québec, Environnement Canada, to Ecological Assessment Division, Environment Canada; unreferenced) and abandoned coal gasification plants (gasworks) (Johansen et al. 1997a). A national inventory performed in 1987 recorded over 150 coal gasification sites across the country. These sites were located in all provinces, with the exception of Prince Edward Island, with greatest site densities found in Montreal, Toronto and Vancouver (RDRC 1987). It should be noted that environmental protection measures have been implemented in Canada, in particular for steel plants equipped with coke ovens (SLV 1996; EMA 1997, 2000; Environment Canada 2001b) and for wood preservation facilities (Environment Canada 1999). Significant releases of quinoline to the environment have been reduced through actions implemented in the 1990s to reduce releases of creosote (containing quinoline) and PAHs (associated with quinoline) from these sources (2010 e-mail from Chemicals Management Division, Environment Canada, to Ecological Assessment Division, Environment Canada; unreferenced). In the case of abandoned gasworks, the majority of the sites in Quebec, Ontario and British Columbia have been the object of some form of attention, in the form of assessment, remediation or risk management activities (MENVIQ 1988; 2005 e-mail
6

Screening Assessment CAS RN 91-22-5
from Environmental Assessment and Waste Prevention, Environment Canada, to Existing Substances Branch, Environment Canada; unreferenced; 2005 e-mail from Contaminated Sites Remediation, Environment Canada, to Existing Substances Branch, Environment Canada; unreferenced). Remediation activities have been on-going at two former gaswork sites owned by the federal government; at the first site (British-Columbia), work started in 2005-06 is on-going (2010 e-mail from Environmental Evaluation and Mitigation, Environmental Programs, Transport Canada, to Contaminated Sites Division, Environment Canada; unreferenced); at the second site (Ontario), remediation work started in 1996 and it is expected to be completed in 2010-11 (2010 e-mail from Office of Environmental Coordination, Fisheries and Oceans Canada, to Contaminated Sites Division, Environment Canada; unreferenced). In the Atlantic provinces, there are no indications that any assessment, remediation or risk management activities have taken place for 12 abandoned gasworks (RDRC 1987; 2005 e-mail from Waste Management and Remediation Section, Environment Canada, to Existing Substances Branch, Environment Canada; unreferenced). Although the above initiatives have targeted pollutants such as PAHs, benzene, toluene, ethylbenzene and xylenes, they should also be effective in addressing quinoline contamination (e.g., 2004 e-mail from Purifics ES Inc. to Existing Substances Branch, Environment Canada; unreferenced). As quinoline may be formed during the incomplete combustion of nitrogen-containing substances (e.g., petroleum, coal), it may be emitted to the environment from sources such as automobile exhaust (Dong et al. 1977). Rogge et al. (1993) collected aerosol samples (<2 µm) from the exhausts of gasoline- and diesel-powered vehicles built between the mid-1960s and the late 1980s. The vehicle fleet tested consisted of automobiles without catalytic converters (N = 5), automobiles with catalytic converters (N = 7) and diesel trucks (N = 2). Emission rates of quinoline, in micrograms per kilometre travelled, were as follows: non-catalyst auto, 5.3; catalyst auto, 0.57; and diesel truck, 0.46. More recent investigations have not measured quinoline in automobile, small engine or diesel exhausts. Similarly, it is not known with certainty if quinoline is present in current emissions from coal-fired power plants (Mortazavi 1996; Cianciarelli and Mortazavi 1998; US EPA 2000; SENES Consultants Limited 2002a, b). Quinoline may also be present in gases emitted from domestic and public waste incinerators (Benestad et al. 1987; Minomo et al. 2009). Quinoline may be found in coal tar–based products such as sealcoats used on parking lots and driveways (EHS 2010). Leaching tests performed on these materials pointed to the potential for runoff of quinoline through rainfall (Zhu 2007). This result is consistent with the findings of others (Mahler et al. 2005, Watts et al. 2010) showing that parking lot sealcoats can be a source of PAH releases to the environment. Total nationwide atmospheric emissions of quinoline in the United States for the period 1990–1993 were estimated at 23.6 tonnes per year, with key contributions from chemical and allied product manufacturing (11.3 tonnes), metals processing (8.2 tonnes), petroleum refineries and related industries (4.0 tonnes) and wood, pulp and paper, and publishing products (0.08 tonne) (US EPA 2000).
7

Screening Assessment CAS RN 91-22-5
Environmental Fate Environmental fate analysis integrates information on the chemical behaviour of a substance with the properties of the receiving environment. The objective of fate analysis is to determine the multimedia distribution of the substance after its release into the environment. This includes consideration of the persistence and bioaccumulation potential of the substance in the environment. Table 3. Results of Level III fugacity modelling for quinoline (EQC 2003)1
Fraction of substance partitioning into each medium (%) Substance released to: Air Water Soil Sediment Air (100%) 18 10 72 0.0 Water (100%) 0.0 99 0.13 0.22 Soil (100%) 0.06 6.7 93 0.015
1 Modelling performed for the non-ionized form at a temperature of 25ºC. Input parameters: molecular mass, 129.16; aqueous solubility, 6110 mg/L; vapour pressure, 8 Pa; log Kow, 2.10; melting point, −15ºC. Details on selected half-lives (water, 552 h; sediments, 552 h; air, 16 h; soil, 4368 h) are given in the section on Persistence and Bioaccumulation Potential.
Simulations for environmental partitioning were performed using Level III (steady-state, non-equilibrium) of the Equilibrium Criterion (EQC) model for Type 1 chemicals (Mackay et al. 1996; EQC 2003). Input parameters for running this model and the results are presented in Table 3. If quinoline is released to the atmosphere, its moderate volatility will cause some quinoline to leave the air to partition into soil and surface water; a mass amount of about 18% will stay in the air. If it is released to surface water, the model predicts that quinoline will remain for the most part in that compartment. Similarly, if it is released to soil, the model predicts that quinoline will remain mainly in this medium. The TaPL3 model was used to assess the long-range transport potential of quinoline when it is released into air or water. The model calculates the distance— the characteristic travel distance (CTD)—that a substance will travel in a mobile medium until the concentration decreases to 37% (1/e) of its initial value as a consequence of inter-media partitioning and degradation reactions. Advective losses are not included (Beyer et al. 2000; TaPL3 2003). With a modelled CTD of 332 km, quinoline is not subject to atmospheric transport to remote regions, such as the Arctic. The TaPL3 model may underestimate the partitioning of quinoline between the gas phase and atmospheric particles by neglecting to take into account the formation of secondary organic aerosols from the photooxidation of quinoline. However, a sensitivity analysis indicates that ignoring the secondary organic aerosols formed by photooxidation has probably only a slight effect on the distribution of quinoline at steady state in this evaluative environment. No benchmarks have been proposed by Beyer et al. (2000) for interpreting the CTDs of chemicals in water. The CTD for quinoline in water is well over 1500 km and this may reflect the assumed slow degradation half-life in this medium.
8

Screening Assessment CAS RN 91-22-5
Persistence and Bioaccumulation Potential
The information below was considered in evaluating whether quinoline meets the criteria for persistence and bioaccumulation potential as defined under the Persistence and Bioaccumulation Regulations of CEPA 1999 (Canada 2000). Persistence criteria are half-lives of ≥2 days in air, ≥182 days in water, ≥365 days in sediment or ≥182 days in soil, or evidence of long-range transport to remote areas. Bioaccumulation criteria are a bioaccumulation factor (BAF) or bioconcentration factor (BCF) of ≥5000 or a log Kow of ≥5.0. In summer, quinoline is not expected to persist in air or surface water, based on the removal processes of degradation by hydroxyl radicals in air and photooxidation in water; modelled half-lives are 16 hours for air and 14–23 days for surface water (Smith et al. 1978; Kochany and Maguire 1994; Mackay et al. 1999). In winter, the atmospheric half-life is estimated to be as high as 99 hours (Mackay et al. 1999). Conversely, quinoline vapour pressure is expected to decrease in winter but to remain moderate, as shown by a modelled vapour pressure of 0.65 Pa at 0ºC (MPBPWIN 2000). These results are deemed sufficient to conclude that quinoline is persistent in air during winter months. Quinoline has been shown to be biodegradable in soil under conditions favouring the growth of microorganisms (mineralized in 7–10 days; Thomsen et al. 1999). However, in a laboratory test with less favourable conditions, only 0.2% of quinoline was degraded after a 2-week exposure to microorganisms (MITI 1992). Its elevated water solubility, coupled with a moderate affinity for particulate organic carbon (log Koc of 3.26), supports the moderate to high mobility in soil attributed to the chemical by Fowler et al. (1994); therefore, although quinoline is easily degraded in aerobic soil, it can move easily into deeper, anaerobic regions, where it may persist for long periods. Indeed, these anaerobic media offer poor conditions for biodegradation, such as low oxygen levels, low temperatures and few carbon sources. Some studies examining the potential for anaerobic biodegradation of quinoline in contaminated aquifers indicate that some primary biodegradation may occur (Fischer et al. 2010), and some sources also suggest that the resultant hydroxylated quinoline degradation products may reach concentrations which are higher than the parent compound (Reineke et al. 2007, de Voogt and Laane 2009, Neuwoehner et al. 2009). However, the overall persistence and toxicity of these quinoline metabolites is uncertain (Reineke et al 2007, de Voogt and Laane 2009, Neuwoehner et al. 2009). Nevertheless, the absence of significant degradation of quinoline associated with the occurrence of coal tar in soils has been frequently observed (e.g., Lesage and Jackson 1992; Johansen et al. 1997a). The presence of quinoline in sediments dating back a century is evidence of the persistence of the substance in this compartment (Furlong and Carpenter 1982). Quinoline has a low potential to bioaccumulate; two BCF values have been determined for fish on a wet weight basis. The BCF of 8 obtained by Bean et al. (1985) was calculated for quinoline and its metabolites (the BCF for the non-metabolized quinoline
9

Screening Assessment CAS RN 91-22-5
molecule is therefore lower than 8); de Voogt et al. (1991) calculated a BCF value of 158 for fish. Based on the criteria in the Persistence and Bioaccumulation Regulations (Canada 2000), it is concluded that quinoline meets the persistence criteria for air and soil but does not meet the criteria for bioaccumulation potential.
Potential to Cause Ecological Harm Ecological Exposure Assessment Only limited data regarding levels of quinoline in the Canadian environment were identified. Some of the available concentrations are at least 15 years old and may not reflect current exposure conditions. No data have been found on levels of quinoline in natural, non-agricultural soils. Table 4 presents environmental concentrations of quinoline in Canada as well as outside Canada. Table 4. Environmental concentrations of quinoline in outdoor air, surface water, groundwater, sediments and soils
Medium/location Sampling period and LOD Concentration Reference
Air (ng/m3) Flue gases from domestic waste incinerator in Norway (N = 9)
April 23–24, 1985 LOD NS
ng/m3 at 10% O2 Mean: 10 000
Benestad et al. 1987
Residential area, Columbus, Ohio
March 1987 LOD NS Mean: 33001 Chuang et al.
1991 Urban and rural areas, Colorado
November 1982 LOD NS ND Hawthorne and
Sievers 1984 Urban and rural areas, New York state Modelled data Mean urban: 2 × 10⁻³
Mean rural: 1.3 × 10⁻⁴ US EPA 1996
Urban areas, Michigan Modelled data Mean: 0.77 US EPA 1996 Residential area, Ottawa, Ontario
Winter 2002 and 2003 Estimated LOD 50 ND Zhu et al. 2005
Flue gases from public waste incinerators in Japan
(ng/m3 N)2
Municipal solid waste (N = 7) Mean: 74
Sewage sludge (N = 3) Mean: 550 Waste wood (N = 10) Mean: 93 000 Hospital waste (N = 3) Mean: 34 000 Waste oil (N = 1)
2004–2006 LOD NS
99
Minomo et al. 2009
Aerosols (ng/m3) New York City, New York
Winter 1975 LOD NS
Sample 1: 2.2 × 10⁻² Sample 2: 6.9 × 10⁻²
Dong et al. 1977
10

Screening Assessment CAS RN 91-22-5
Medium/location Sampling period and LOD Concentration Reference
Street sediments (µg/g) Twelve cities in the Canadian Great Lakes basin (Ontario)
1979–1983 LOD 0.05 Mean: 0.53 Marsalek and
Schroeter 1988
Rainwater (µg/L)
Los Angeles, California Winter 1982 LOD NS 1–4 Kawamura and
Kaplan 1983 Surface water (µg/L) Rainy River, Ontario (border of Minnesota)
August 21–25, 1986 LOD 0.001 ND Merriman 1988
Effluents from pulp and paper mills, Rainy River, Ontario–Minnesota
November 1982 LOD 0.001 ND Merriman 1988
Surface water affected by contaminated groundwater
ChemSim modelling 10.3–51.73 2.11–10.64 This report
Groundwater (µg/L) Near an abandoned wood treatment facility, Pensacola, Florida
1983 LOD NS ND–288.0 Pereira et al.
1987
6.1 m deep wells near an abandoned wood treatment facility, Pensacola, Florida
1983 LOD 100 ND–11 200 Godsy et al.
1992
Near an abandoned wood-preserving plant, Pensacola, Florida
March 1985 LOD NS ND–10 500 Lesage and
Jackson 1992
Near an asphalt factory, Ringe, Denmark
Sampling: NS LOD 0.05 ND–0.07 Johansen et al.
1997a Near a coal gasification plant, Holte, Denmark
Sampling: NS LOD 0.05 ND Johansen et al.
1997a Near a coal gasification plant, Frederica, Denmark
Sampling: NS LOD 0.05 0.12–45 Johansen et al.
1997a
Østre Gasworks, Denmark
Sampling: NS LOD NS Maximum: 64 000 Johansen et al.
1997a Landfill leachates from 10 landfill sites, Japan
1995 LOD NS ND–0.046 Yasuhara et al.
1999 Near a coal tar pool in soil Modelled data 6900–34 500 This report
Sediment–water interface affected by contaminated groundwater discharge
Modelled data 690–3450 This report
11

Screening Assessment CAS RN 91-22-5
Medium/location Sampling period and LOD Concentration Reference
Sediments (µg/kg dry weight) Hamilton Harbour, Ontario (industrial sites)
Sampling: NS LOD 1–10 8–63 Onuska and
Terry 1989
St. Marys River, Ontario (industrial sites)
September 24–October 4, 1985 LOD 20
ND–460 Kauss and Hamdy 1991
Sydney Harbour, Nova Scotia
October 16–19, 1986 LOD 50–200 ND Environment
Canada 1988 St. Croix River estuary and Passamaquoddy Bay, New Brunswick
Sampling: NS LOD NS
ND
Loring et al. 1998
Dutch coastal zone of North Sea
September 2000– January 2001 LOD 4 (41/44 samples >LOD)
0.97–66.4 De Voogt and Laane 2009
Soils (µg/kg dry weight) Eight agricultural fields, southern Ontario
1992 LOD NS ND–60 Webber 1994
Two sites, Ontario Sampling: NS LOD 20–100 ND
Golder Associates Ltd. 1987
Abbreviations: LOD, limit of detection; ND, not detected; NS, not specified. 1 The units given in the Chuang et al. (1991) study are inconsistent and possibly erroneous, as values were
reported in both µg/m3 and ng/m3. As a worst-case scenario, the units µg/m3 were used for the ecological exposure assessment.
2 In the unit ng/m3 N, N means at normal conditions, i.e., 0°C and atmospheric pressure of 101.3 kPa. 3 ChemSim simulation considering 10th-percentile flow estimate (low flow) at 1000 m from the source (Appendix 1). 4 ChemSim simulation considering 50th-percentile flow estimate at 1000 m from the source (Appendix 1) Quinoline is a known constituent of coal tar and creosote (McNeil 1981). Contamination of groundwater and soils by these chemical mixtures has been documented at abandoned coal gasification plants, steel plants equipped with coke ovens and wood treatment plants. The presence of coal tar was documented in soil, groundwater and nearby surface water (Rideau River) in the vicinity of a former gas factory in Ottawa, Ontario. A pure coal tar sample obtained from the bottom of the river in 1986 contained quinoline at a concentration of 0.51 mg/g tar (INTERA 1987b; reported detection limit 0.5 µg/g tar). There is a distinct possibility that quinoline has been leached out from this sample, however. This site has since been remediated (2004 communication between Ontario Ministry of Environment and Existing Substances Branch, Environment Canada; unreferenced). Such an example of contamination by non-aqueous-phase liquids (e.g., coal tar) forms the basis of the exposure scenario presented in the ecological risk characterization below (INTERA 1987a, b; Lesage and Jackson 1992; Raven and Beck 1992; Furimsky 2002). Concentrations of quinoline in groundwater and surface water impacted by coal tar plumes were modelled because of the lack of measured
12

Screening Assessment CAS RN 91-22-5
concentrations in Canada. The model estimates quinoline concentrations in a groundwater plume that develops in connection with a pure coal tar pool in soil and is discharged to surface water within 10 m of the pool. It is based on field observations of coal tar plumes made at abandoned gasworks sites and coke oven sites in Canada This exposure scenario would be relevant to current industrial applications producing tar wastes on-site, including coal tar distillation plants, creosoting plants and roofing felt and tarred paper manufacturing facilities, as well as abandoned gasworks and coke ovens. A simple numerical approach reported in the peer-reviewed literature, Raoult’s law, was used to derive a maximum aqueous concentration of quinoline in contact with a pure coal tar phase (King and Barker 1999). Two quinoline concentrations, 6.9 and 34.5 mg/L, associated with the lower and upper limits for the quinoline content of coal tar (McNeil 1981), represent the range of quinoline concentrations in groundwater in contact with pure coal tar. These two values, divided by 10 to account for dilution, represent the range of quinoline concentrations at sediment–water interfaces affected by groundwater discharge points contaminated by quinoline: 0.69 and 3.45 mg/L. Simulations using the ChemSim model (ChemSim 2003) were used to derive dissolved quinoline concentrations in surface water, assuming a groundwater flow rate of 3 cm/day and an instantaneous dilution. Derivation of the parameters, discussion of simplifying assumptions underlying the present exposure scenario and a brief description of the ChemSim model are provided in Appendix 1. The modelled concentrations in groundwater and surface water are presented in Table 4 and have been selected as the predicted environmental concentrations (PECs) to be used for the risk quotient calculations for water. Quinoline was not detected in a residential area in Ottawa, Ontario, based on an air quality survey conducted in the winter of 2002 and 2003 (the estimated detection limit was 0.05 µg/m3) (Zhu et al. 2005). Chuang et al. (1991) obtained statistically significant correlations between quinoline and phenanthrene concentrations in the ambient air of Columbus, Ohio. It has been proposed (2004 e-mail from Air Quality Research Branch, Environment Canada, to Existing Substances Branch, Environment Canada; unreferenced) that the quinoline to phenanthrene ratio calculated by Chuang et al. (1991), an average of 0.106 in outdoor air, and ambient measurements of phenanthrene in air in Canada be used to infer ambient levels of quinoline in air in Canada. As part of the weight of evidence approach, high-quality data sets in the Canadian assessment report on PAHs were used to obtain concentrations of phenanthrene measured in the mid-1980s and early 1990s in ambient air from diverse locations in Canada (Canada 1994). Concentrations of quinoline, derived from phenanthrene levels and expressed in nanograms per cubic metre, are as follows: • near aluminum plants: Kitimat (BC), 6.15; Jonquière (QC), 39.5; Shawinigan (QC),
41.5; • areas affected by wood heating: Whitehorse (YT), 28.9; Sept-Iles (QC), 5.36; • rural areas Walpole Island (ON), 0.44; and • urban areas Winnipeg (MB), 0.56; Windsor (ON), 3.70; Toronto (ON), 1.66;
Montreal (QC), 2.09; Sydney (NS), 0.23.
13

Screening Assessment CAS RN 91-22-5
Since the ratio of quinoline to phenanthrene was obtained from the urban area of Columbus, Ohio, it will probably be more representative of urban sources. Ecological Effects Assessment Twenty-seven studies relating to the acute and chronic toxicity of quinoline to fish, aquatic invertebrates, soil invertebrates, microalgae and microorganisms provided 96 different toxicity values. Four key studies of toxicity to organisms in different environmental media were selected and are discussed below. These present the most sensitive reliable results selected for each medium and exposure route available. They have been critically reviewed and determined to have a satisfactory degree of reliability for the present risk assessment (Appendix 2). Toxicity studies for soil organisms are not covered because an exposure scenario could not be developed for them due to the limited information available. Johansen et al. (1997b) used a toxicity test named MINNTOX to examine the inhibition of ammonia oxidation by the bacterial group Nitrosomonas spp. in the presence of quinoline. An inoculum was taken from an activated sludge obtained from a wastewater treatment plant. The experimental treatment consisted of mixing 3 mL of toxicant solution with 3 mL of active nitrifying sludge. Six test concentrations covered the range 0–200 mg/L, and three replicates were run per concentration. The test lasted 2 hours, which corresponds to a chronic exposure for Nitrosomonas spp. The median effective concentration, or EC50 (i.e., the concentration that inhibited nitrification by 50%), of quinoline was determined to be 54 mg/L. Bleeker et al. (1998) conducted 96-hour aquatic toxicity tests for quinoline using the first instar larvae of the midge Chironomus riparius and obtained a 96-hour median lethal concentration (LC50) of 4.90 mg/L. Other studies with benthic invertebrates, aquatic invertebrates and microalgae reported in the scientific literature have found acute LC50s in the 5–191 mg/L range for quinoline. The fish toxicity study of Black et al. (1983) was used to derive the Canadian Water Quality Guideline for quinoline for the protection of aquatic life (CCME 1999). Black et al. (1983) studied the survival of embryo–larval stages of the rainbow trout (Oncorhynchus mykiss) exposed to quinoline in water. A continuous-flow system was used in which exposure was initiated at egg fertilization and maintained through 4 days post-hatching (27 days in total). The pH was maintained between 7.4 and 8.1, temperature varied between 13.3°C and 14.2°C and dissolved oxygen ranged between 8.6 and 10.2 mg/L. Five test concentrations were established, using two replicates per test and 100–150 eggs per exposure chamber. Quinoline levels were measured daily. Survival of trout larvae exposed to quinoline was 95% at 13 µg/L, 89% at 90 µg/L and 82% at 370 µg/L. Milleman et al. (1984) exposed juvenile fathead minnows (Pimephales promelas) to dissolved quinoline in water for 96 hours under static conditions. The pH was maintained at 7.8, the temperature was 20 ± 0.5°C and dissolved oxygen ranged between 8.6 and 4.3
14

Screening Assessment CAS RN 91-22-5
mg/L. An experimental treatment consisted of five specimens placed in a 7.6 L aquarium covered with aluminum foil. Four test concentrations were established, using two replicates per test. Quinoline concentrations were measured at 0, 24, 48, 72 and 96 hours in each test. The acute 96-hour LC50 was 0.44 mg/L (0.12–1.32 mg/L; 95% fiducial limits). Considering all available studies, acute LC50s for freshwater fish ranged from 0.44 to 78 mg/L. The low bioaccumulative potential of quinoline does not entirely reflect quinoline’s hazard, because the mode of action of the molecule is not based on narcosis. Evidence indicates that quinoline toxicity may be associated with its conversion in organisms, through metabolic activation, to a mutagenic molecule (e.g., Talcott et al. 1976; Eisentraeger et al. 2008; Neuwoehner et al. 2009). Laboratory studies attribute a (low to medium) mutagenic potency to quinoline with regards to bacteria (Talcott et al. 1976). The proposed mode of action is the binding of a metabolic intermediate epoxide to nucleic acids, producing a deoxyribonucleic acid (DNA) adduct. This epoxide metabolite is possibly produced as well during the biotransformation of quinoline by rainbow trout (Bean et al. 1985). Characterization of Ecological Risk The approach taken in this ecological screening assessment is to examine various supporting information and develop conclusions based on a weight of evidence approach as required under section 76.1 of CEPA 1999. Particular consideration has been given to risk quotient analyses, persistence, inherent toxicity, environmental realism of the exposure scenario used to derive PECs and widespread occurrence in the environment. Endpoint organisms have been selected based on analysis of exposure pathways. For each endpoint organism, a conservative (reasonable worst-case) PEC and a predicted no-effect concentration (PNEC) are determined. The PNEC is arrived at by selecting the lowest critical toxicity value (CTV) for the organism of interest and dividing it by an application factor appropriate for the data point. A risk quotient (PEC/PNEC) is calculated for each of the endpoint organisms in order to contribute to the characterization of ecological risk in Canada. Selected PECs for this assessment, modelled on the basis of a coal tar pool in soil contaminating groundwater, have been previously discussed and are presented in Table 5. For the worst-case scenario involving groundwater microorganisms, the PNEC is 5400 µg/L, calculated by dividing the CTV, an EC50 value of 54 mg/L (obtained for inhibition of nitrification by Nitrosomonas spp. in the presence of quinoline), by an application factor of 10. For the second scenario, exposure of benthic organisms to contaminated water at areas of groundwater discharge, the CTV is 4.90 mg/L, based on a 96-hour acute exposure of Chironomus riparius larvae to quinoline in water. An application factor of 100 was used to extrapolate from acute exposure to chronic exposure and from laboratory species to
15
Screening Assessment CAS RN 91-22-5
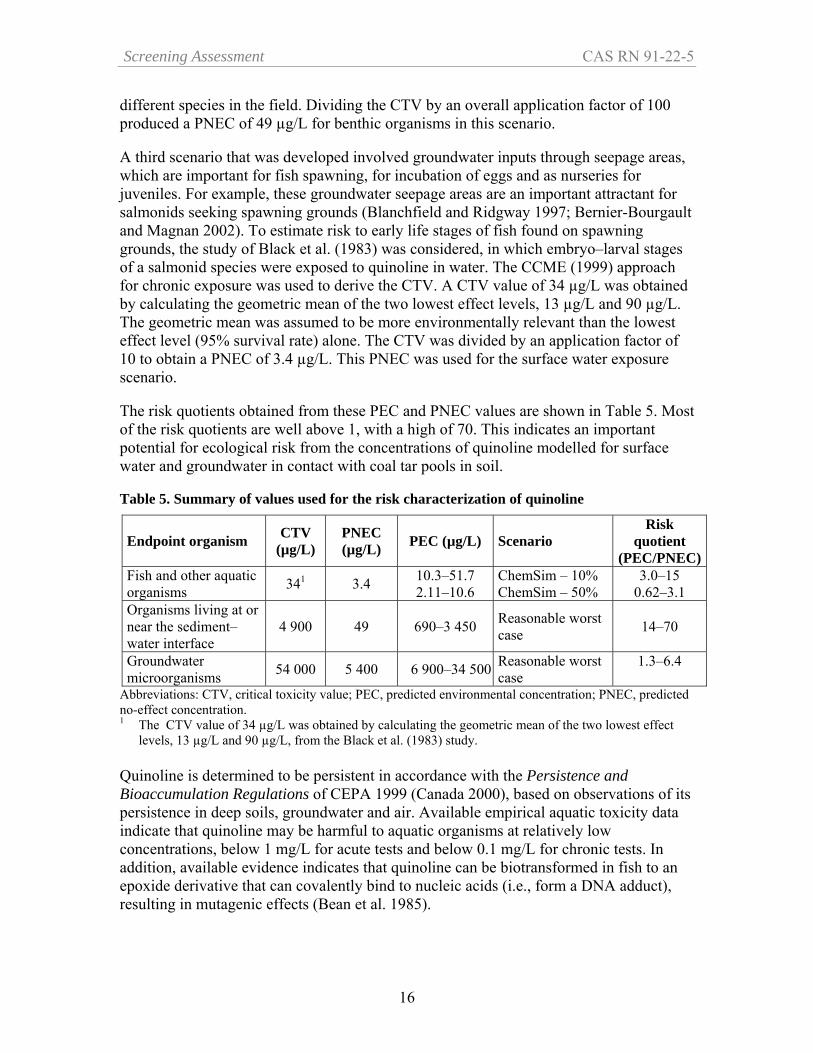
different species in the field. Dividing the CTV by an overall application factor of 100 produced a PNEC of 49 µg/L for benthic organisms in this scenario. A third scenario that was developed involved groundwater inputs through seepage areas, which are important for fish spawning, for incubation of eggs and as nurseries for juveniles. For example, these groundwater seepage areas are an important attractant for salmonids seeking spawning grounds (Blanchfield and Ridgway 1997; Bernier-Bourgault and Magnan 2002). To estimate risk to early life stages of fish found on spawning grounds, the study of Black et al. (1983) was considered, in which embryo–larval stages of a salmonid species were exposed to quinoline in water. The CCME (1999) approach for chronic exposure was used to derive the CTV. A CTV value of 34 µg/L was obtained by calculating the geometric mean of the two lowest effect levels, 13 µg/L and 90 µg/L. The geometric mean was assumed to be more environmentally relevant than the lowest effect level (95% survival rate) alone. The CTV was divided by an application factor of 10 to obtain a PNEC of 3.4 µg/L. This PNEC was used for the surface water exposure scenario.
The risk quotients obtained from these PEC and PNEC values are shown in Table 5. Most of the risk quotients are well above 1, with a high of 70. This indicates an important potential for ecological risk from the concentrations of quinoline modelled for surface water and groundwater in contact with coal tar pools in soil. Table 5. Summary of values used for the risk characterization of quinoline
Endpoint organism CTV (µg/L)
PNEC (µg/L) PEC (µg/L) Scenario
Risk quotient
(PEC/PNEC)Fish and other aquatic organisms 341 3.4 10.3–51.7
2.11–10.6 ChemSim – 10% ChemSim – 50%
3.0–15 0.62–3.1
Organisms living at or near the sediment–water interface
4 900 49 690–3 450 Reasonable worst case 14–70
Groundwater microorganisms 54 000 5 400 6 900–34 500 Reasonable worst
case 1.3–6.4
Abbreviations: CTV, critical toxicity value; PEC, predicted environmental concentration; PNEC, predicted no-effect concentration. 1 The CTV value of 34 µg/L was obtained by calculating the geometric mean of the two lowest effect
levels, 13 µg/L and 90 µg/L, from the Black et al. (1983) study. Quinoline is determined to be persistent in accordance with the Persistence and Bioaccumulation Regulations of CEPA 1999 (Canada 2000), based on observations of its persistence in deep soils, groundwater and air. Available empirical aquatic toxicity data indicate that quinoline may be harmful to aquatic organisms at relatively low concentrations, below 1 mg/L for acute tests and below 0.1 mg/L for chronic tests. In addition, available evidence indicates that quinoline can be biotransformed in fish to an epoxide derivative that can covalently bind to nucleic acids (i.e., form a DNA adduct), resulting in mutagenic effects (Bean et al. 1985).
16

Screening Assessment CAS RN 91-22-5
Quinoline has been detected in a variety of media in Canada. For example, it has been detected in agricultural soils and street sediments in Ontario and in bottom sediments of rivers near industrial areas, although not in concentrations exceeding the calculated PNECs. The receiving environment of the modelled exposure scenario is representative of a high proportion of aquatic systems next to sites impacted by coal tar and creosote in Canada. This observation is supported by information contained in inventories of former coal gasification sites and industrial sites where coal tar was stored and handled which are available for Quebec, Ontario and other provinces (RDRC 1987; MENVIQ 1988; OMEE 1997). Uncertainties in Evaluation of Ecological Risk The quantitative exposure estimate was based on modelling predictions. The generic exposure scenario from which the risk quotients are derived is fairly realistic (not overly conservative). Dissolved quinoline concentrations modelled in groundwater are similar to levels of quinoline measured in groundwater elsewhere in the world (Table 4), indicating that they are likely realistic estimates. In addition, the modelled river is not exceptionally small (GRI 1990; OMEE 1997), the groundwater velocity selected is not very large (Freeze and Cherry 1979) and the distance from the tar pool to the river is not exceptionally short (GRI 1990). It is also noted that the number of contaminated sites in Canada that are targeted by this exposure scenario and remain unmanaged is not known with certainty at this time. Because of paucity of information, potential releases of quinoline from existing steel plants equipped with coke ovens, aluminum smelters, industrial facilities currently handling coal tar or creosote, and use of coal tar based asphalt sealants and roofing materials could not be developed. However, the information available from past industrial activities provides weight of evidence indication of concern related to current activities. As quinoline is a naturally occurring substance, in principle, its background concentration could be considered in the risk characterization. However, no information was found regarding biogeochemical background concentrations of quinoline in groundwater, surface water and subsoil environments. It is expected that natural concentrations of quinoline contribute negligibly to PECs of surface waters, given that quinoline levels in pre-industrial sediments appear to be less than 1 µg/kg (Furlong and Carpenter 1982)
Potential to Cause Harm to Human Health Exposure Assessment Available data on the concentrations of quinoline in ambient air, surface water, groundwater, soil and sediment are summarized in Table 4. Limited data on the indoor air concentrations of quinoline in Canada or in other countries were identified.
17

Screening Assessment CAS RN 91-22-5
In a Canadian indoor air survey conducted in 1991, indoor air samples were collected in 757 randomly selected residences. Quinoline was detected in the pooled indoor air samples at a concentration of 22 µg/m3 (Otson et al. 1992 1994). More recently, in an air quality survey conducted during the winter of 2002 and 2003 in 75 randomly selected residences in Ottawa, Ontario, quinoline was not detected in the indoor (living room or family room) or outdoor (driveway) air samples (the estimated detection limit was 0.05 µg/m3). Ten percent of the air samples were collected from homes with smokers (Zhu et al. 2005). Although the recent information on concentrations of quinoline in Canadian air is limited due to the lack of measurement of a concurrent quinoline standard sample (Zhu et al. 2005), the estimated limit of detection for quinoline in this study (i.e., 0.05 µg/m3) is comparable with the indoor air concentration of quinoline measured from the homes with non-smokers (i.e., 0.04 µg/m3) in a California survey (Air Resources Board 1993), which was conducted in 280 houses selected from Placerville and Roseville in the winter of 1992. The results of the California survey suggested that tobacco smoking is a major source of quinoline in indoor air; maximum quinoline concentrations of 0.22 and 0.16 µg/m3 were detected in houses with smokers and in houses with smokers and fireplace use, respectively, compared with the maximum of 0.04 µg/m3 detected in houses with fireplace use and no smokers (Air Resources Board 1993). In addition, in a study conducted during the winter heating season of 1987, indoor and outdoor air samples were collected from eight homes in Columbus, Ohio. At each home, indoor air samples were taken in the kitchen and living room over two consecutive 8-hour periods, and a single 16-hour air sample was collected outdoors. The average concentrations of quinoline in the kitchen, living room and outdoors were 140, 240 and 3.3 µg/m3, respectively. The samples were further categorized by the heating and cooking systems used in the house and by the residents’ lifestyles (i.e., with or without tobacco smoking). The highest average concentration of quinoline was 26 µg/m3 in the indoor air of homes with non-smokers and 560 µg/m3 in the indoor air of homes with smokers (Chuang et al. 1991). However, the units given in this study are inconsistently reported in the tables (as µg/m3)
and in the text (as ng/m3) and therefore they were possibly erroneous. No data on the concentrations of quinoline in drinking water were available. In the only available study concerning quinoline concentrations in Canadian surface water, quinoline was not detected in the surface water sampled from Rainy River, Ontario, in 1986, at three water quality monitoring stations and from the final effluents of two bleached kraft pulp and paper mills discharging into the river (the detection limit was 0.001 µg/L) (Merriman 1988). Quinoline was detected in 3 samples, at a maximum concentration of 60 µg/kg dry weight, among 24 soil samples collected in 1992 from eight agricultural fields in southern Ontario that had received single or multiple sludge applications (Webber 1994). Additionally, quinoline was not detected in soil at two locations in Ontario (the detection limit was 0.02–0.1 mg/kg) (Golder Associates Ltd. 1987). Fenaroli's Handbook of Flavor Ingredients indicates that quinoline may be used as a flavour (Oser and Ford 1975, in Burdock 2010). In Canada, food flavours are not regulated as food additives and are not required under the Food and Drug Regulations to
18

Screening Assessment CAS RN 91-22-5
undergo pre-market review. Flavouring ingredients can be added to any food that does not have a standard of identity and composition in the Food and Drug Regulations and to those foods that have a standard of identity and composition that allows for the addition of flavours to the food (2011 e-mail from Food Directorate, Health Products and Food Branch, Health Canada, unreferenced). Quinoline has been detected as a minor constituent of whisky fusel oils (Nishimura and Masuda 1971). The Dictionary of Natural Products (version 19.2, Taylor & Francis Group 2011) indicates that quinoline or quinoline like compounds also occur in black tea and cocoa, however, no further information has been identified regarding the levels in these products. Based on the limited available information on the concentrations of quinoline in ambient air and indoor air (Zhu et al. 2005), surface water (as a surrogate for data on drinking water concentrations) (Merriman 1988) and soil (Webber 1994) in the Canadian environment, the upper-bounding estimate of intake for the general Canadian population ranges from 0.01 µg/kg body weight (kg-bw) per day (for those 60+ years of age) to 0.03 µg/kg-bw per day (for those 6 months to 4 years of age), with indoor air potentially representing the most important source of exposure (see Appendix 3). Consumer products represent a potential source of exposure. Based on confidential information provided through the survey conducted under section 71 of CEPA 1999 (Environment Canada 2001a), the daily intake of quinoline from consumer products was estimated to be 1.7 × 10⁻³ µg/kg-bw per day for adults (20–59 years of age), which is lower than the estimate of daily intake from environmental media. In addition, coal tar–based driveway sealants, in which quinoline exists as an endogenous component of coal tar pitch (Zhu 2007; EHS 2010), may be a source of consumer exposure. Coal tar–based pavement sealants are mainly applied outdoors by consumers using rollers; taking into account the physical and chemical properties of quinoline, it is not likely that use of coal tar–based pavement sealants would significantly elevate the quinoline concentration in outdoor air. Accordingly, quinoline was not detected in outdoor (driveway) air samples in Ottawa, Ontario (Zhu et al. 2005). In a laboratory experiment, coal tar–based pavement sealant products were enclosed in vials for 48 hours; quinoline was detected in the headspace air of the vials, with a maximum average concentration of 9 µg/m3 (Zhu 2007). This air concentration of quinoline would be much higher than the actual acute exposure level during use of coal tar–based pavement sealants, as the experimental design (Zhu 2007) does not include dispersion into the outdoor atmosphere. Confidence in the exposure database is considered to be moderate. Data were available on levels of quinoline in the environmental media that are most relevant to general population exposure (i.e., water and indoor/ambient air). Although insufficient quantitative data on quinoline levels in food or for water were available, these are not expected to be significant sources of exposure, as quinoline is unlikely to bioaccumulate due to a low octanol–water partition coefficient, as discussed in the Persistence and Bioaccumulation Potential section. Health Effects Assessment
19

Screening Assessment CAS RN 91-22-5
Appendix 4 summarizes the available health effects information for quinoline. The US Environmental Protection Agency (US EPA) has published an assessment of quinoline (US EPA 2001). In the studies reviewed in the US EPA (2001) assessment, there were increased incidences of an unusual tumour (i.e., hemangioendotheliomas) in multiple strains of rats and mice exposed orally, hepatic tumours (i.e., adenomas and hepatomas) in mice following single intraperitoneal injections at an early age and skin tumours in mice exposed dermally in an initiation–promotion study. Many of these studies are dated and are limited by the use of only one sex of animals, small dose groups, short durations of exposure and, in some cases, a lack of statistical analyses. The critical study, which was originally selected by the US EPA (2001), for which the exposure–response relationship was best characterized, was a bioassay by Hirao et al. (1976), in which increased incidences of hepatocellular carcinomas and hemangioendotheliomas and/or hemangiosarcomas were observed in the livers of male rats exposed to concentrations of 0%, 0.05%, 0.10% or 0.25% quinoline in the diet (equivalent to 0, 25, 50 and 125 mg/kg-bw per day, respectively) for up to 40 weeks. Increased incidence of hemangioendotheliomas was also constantly observed in other dietary studies in rats and mice (Shinohara et al. 1977; Hasegawa et al., 1989; Futakuchi et al. 1996), but not in hamsters or guinea pigs (Shinohara et al. 1977). Although there is a lack of consistency or clear dose-response of increased incidence of hepatocellular tumour in rats, significantly increased incidence of hepatocellular tumour was observed in male mice, but not in female mice, following single intraperitoneal injection of 1.75 µmol quinoline (La Voie et al. 1987; 1988; Weyand et al. 1993). Based on a relatively extensive in vivo and in vitro genotoxicity database, quinoline is considered to be genotoxic (US EPA 2001). Recent data on the clastogenicity of quinoline further support this conclusion (Suzuki et al. 2005, 2009; Suzuki et al. 2007). Non-neoplastic effects, including increased absolute and relative liver weights, fatty changes, bile duct proliferation and oval cell infiltration of the liver, were also observed at all doses (i.e., ≥25 mg/kg-bw per day, the lowest-observed-effect level [LOEL]) in the study by Hirao et al. (1976). Similar non-neoplastic effects on the liver have been observed in other limited investigations of shorter duration or by less relevant routes of exposure in rats, mice, guinea pigs and hamsters. The US EPA (2001) noted that the observed non-neoplastic hepatic changes, body weight loss and early mortalities were considered by the authors of these studies (and by the US EPA in a previous assessment) to be related to the hepatocarcinogenicity of quinoline. The US EPA further indicated that while the relationship of some non-neoplastic effects (e.g., body and liver weight changes, oval cell infiltration, proliferation of bile ducts, and fatty degeneration of parenchymal cells) to tumour formation was not as clear, it is likely that these effects were at least confounded by tumour formation in the liver and were not reported in a manner that would allow a meaningful quantitative characterization of the dose–response relationship. On the basis of sufficient evidence of carcinogenicity in experimental animals and supporting evidence of genotoxicity, the US EPA (2001) concluded that quinoline is “likely to be carcinogenic in humans.” Recent data do not materially impact upon the selection of the critical study or the conclusions reached by the US EPA (2001).
20

Screening Assessment CAS RN 91-22-5
Confidence in the health effects database for quinoline is considered to be moderate. Although there is an extensive database of genotoxicity assays, the available carcinogenicity studies are somewhat limited and dated. Characterization of Risk to Human Health On the basis of the empirical evidence that increased incidences of unusual tumors were observed in multiple strains of rats and mice exposed to quinoline orally, the critical effect for the characterization of risk of quinoline to human health is considered to be carcinogenicity. The US Environmental Protection Agency (EPA) had previously drawn the same conclusion. In addition, in experimental studies, quinoline also exhibited effects causing damage to DNA and altering cell reproduction and regeneration. Therefore, although the mode of induction of tumours of quinoline has not been fully elucidated, it cannot be precluded that the tumours observed in experimental animals resulted from direct interaction of quinoline or its metabolites with genetic materials, for which there may be a probability of harm at any level of exposure. Exposure of the general population to quinoline is expected to be mainly from air. Comparison of the critical effect level for non-cancer effects (i.e., 25 mg/kg-bw per day) with the upper-bounding estimate of exposure (i.e., 0.03 µg/kg-bw per day) results in a margin of exposure of approximately 5 orders of magnitude (approximately 800 000). If exposure to quinoline through use of consumer products is considered, the margin of exposure would remain in the same range of magnitude. These margins of exposure for non-cancer effects are considered adequate. On the basis of the carcinogenicity of quinoline, together with potential for general population exposure, it is concluded that quinoline is a substance that may be entering the environment in a quantity or concentration or under conditions that constitute or may constitute a danger in Canada to human life or health. Uncertainties in Evaluation of Risk to Human Health There is uncertainty in the total daily intake estimates for the general population in Canada owing to the paucity of measured quinoline concentrations in the Canadian environment. Only two Canadian semiquantitative indoor and outdoor air surveys were identified, and no Canadian data on quinoline concentrations in drinking water or food are available, although food is not expected to be a significant source of intake. In addition, the general population may be exposed to quinoline from tobacco smoking and incomplete combustion, which could increase the level of exposure. In light of the low concentrations of quinoline in the consumer products in the Canadian marketplace and the use pattern of coal tar–based pavement sealants, in which quinoline exists as a natural component, general population exposure to quinoline through the use of consumer products is expected to be low. Although the collective evidence indicates that this substance can directly interact with genetic materials, there is uncertainty regarding the mode of action of quinoline-induced
21

Screening Assessment CAS RN 91-22-5
tumorigenesis. Available data are insufficient to assess the intraspecies and interspecies variations in sensitivity and carcinogenicity. In addition, toxicological information dataset is incomplete as inhalation study data are not available. As well, there is uncertainty regarding the potential reproductive toxicity of quinoline, as relevant data were not identified.
Conclusion
Based on the information presented in this screening assessment, it is concluded that quinoline is entering or may be entering the environment in a quantity or concentration or under conditions that have or may have an immediate or long-term harmful effect on the environment or its biological diversity. Additionally quinoline meets the criteria for persistence but not for bioaccumulation potential as set out in the Persistence and Bioaccumulation Regulations (Canada 2000). On the basis of the carcinogenicity of quinoline, for which there may be a probability of harm at any level of exposure, it is concluded that quinoline may be entering the environment in a quantity or concentration or under conditions that constitute or may constitute a danger in Canada to human life or health. It is therefore concluded that quinoline meets one or more criteria under section 64 of CEPA 1999. Where relevant, research and monitoring will support verification of assumptions used during the screening assessment and, where appropriate, the performance of potential control measures identified during the risk management phase.
22

Screening Assessment CAS RN 91-22-5
References Air Resources Board. 1993. Indoor concentrations of polycyclic aromatic hydrocarbons in California residences. Final report. Sacramento (CA): California Environmental Protection Agency, Air Resources Board. Report No.: RTI321U-5038/010-3F. Arvin E, Dyreborg S, Menck C, Olsen J. 1994. A mini-nitrification test for toxicity screening, Minntox. Wat. Res. 28(9): 2029-2031. Asakura S, Sawad S, Sugihara T, Daimon H, Sagami F. 1997. Quinoline-induced chromosome aberrations and sister chromatid exchanges in rat liver. Environ Mol Mutagen 30: 459–467. [cited in US EPA 2001]. Ashby J, Mohammed R, Lefevre PA, Bandara L. 1989. Quinoline: unscheduled DNA synthesis and mitogenesis data from the rat liver in vivo. Environ Mol Mutagen 14: 221–228. [cited in US EPA 2001]. Bean RM, Dauble DD, Thomas BL, Hanf RW Jr, Chess EK. 1985. Uptake and biotransformation of quinoline by rainbow trout. Aquat Toxicol 7: 221–239. Benestad C, Jebens A, Tveten G. 1987. Emission of organic micropollutants from waste incineration. Chemosphere 16(4): 813–820. Bernier-Bourgault I, Magnan P. 2002. Factors affecting redd site selection, hatching, and emergence of brook charr, Salvelinus fontinalis, in an artificially enhanced site. Environ Biol Fishes 64: 333–341. Beyer A, Mackay D, Matthies M, Wania R, Webster E. 2000. Assessing long-range transport potential of persistent organic pollutants. Environ Sci Technol 34: 699–703. Birge WJ, Black JA, Hudson JE, Bruser DM. 1979. Embryo-larval toxicity tests with organic compounds. In: Marking LL, Kimerle RA. (eds.). Aquatic Toxicology, STP 667. Philadelphia (PA): American Society for Testing and Materials. Pp. 131-147. Black JA, Birge WJ, Westerman AG, Francis PC. 1983. Comparative aquatic toxicology of aromatic hydrocarbons. Fundam Appl Toxicol 3: 353–358. Blanchfield PJ, Ridgway MS. 1997. Reproductive timing and use of redd sites by lake-spawning brook trout (Salvelinus fontinalis). Can J Fish Aquat Sci 54: 747–756. Bleeker EAJ, van der Geest HG, Kraak MHS, de Voogt P, Admiraal W. 1998. Comparative ecotoxicity of NPAHs to larvae of the midge Chironomus riparius. Aquat Toxicol 41: 51–62. Booth R, Castagnoli N, Rollem H. 1989. Intracerebral microdialysis neurotoxicity studies of quinoline and isoquinoline derivatives related to MPTP/MPP+. Neurosci Lett 100: 306–312. [cited in US EPA 2001]. Burdock GA. 2010. Fenaroli's Handbook of Flavour Ingredients, 6th Ed. CRC Press, New York (NY), p. 1788-1789. Canada. 1993. Creosote-impregnated waste materials [Internet]. Ottawa (ON): Environment Canada; Health Canada. (Priority substances list assessment report). Available from: http://www.hc-sc.gc.ca/ewh-semt/alt_formats/hecs-sesc/pdf/pubs/contaminants/psl1-lsp1/creosote/creosote_e.pdf Canada. 1994. Polycyclic aromatic hydrocarbons [Internet]. Ottawa (ON): Environment Canada; Health Canada. (Priority substances list assessment report). Available from: http://www.hc-sc.gc.ca/ewh-semt/alt_formats/hecs-sesc/pdf/pubs/contaminants/psl1-lsp1/hydrocarb_aromat_polycycl/hydrocarbons-hydrocarbures-eng.pdf Canada. 2000. Canadian Environmental Protection Act, 1999: Persistence and Bioaccumulation Regulations, P.C. 2000-348, 23 March 2000, SOR/2000-107. Available from: http://www.gazette.gc.ca/archives/p2/2000/2000-03-29/pdf/g2-13407.pdf Canada, Dept. of the Environment. 2001. Canadian Environmental Protection Act, 1999: Notice with respect to certain substances on the Domestic Substances List (DSL). Canada Gazette, Part I, vol. 135, no. 46, p. 4194–4210. Available from: http://www.gazette.gc.ca/archives/p1/2001/2001-11-17/pdf/g1-13546.pdf
23

Screening Assessment CAS RN 91-22-5
[CCME] Canadian Council of Ministers of the Environment. 1999. Polycyclic aromatic hydrocarbons (PAHs). In: Canadian environmental quality guidelines. Winnipeg (MB): Canadian Council of Ministers of the Environment. [CCRIS] Chemical Carcinogenesis Research Information System. 1999. Quinoline. CCRIS Record Number 547. Last update: 01/05/99. Database searched on March 11, 2002. Http://toxnet.nlm.nih.gov/cgi-bin/sis/search. [ChemSim] Chemical release and dispersion analysis application. 2003. Ottawa (ON): National Research Council of Canada, Canadian Hydraulics Centre. Chuang JC, Mack GA, Kuhlman MR, Wilson NK. 1991. Polycyclic aromatic hydrocarbons and their derivatives in indoor and outdoor air in an eight-home study. Atmos Environ 25B(3): 369–380. Cianciarelli D, Mortazavi R. 1998. Characterization of polycyclic aromatic hydrocarbons and volatile organic compounds from the Sheerness power generating station. Ottawa (ON): Environment Canada, Environmental Technology Centre. 15 p. + annexes. Report No.: ERMD 98-4. Clemo GR. 1973. Some aromatic basic constituents in coal soot. Tetrahedron 29: 3987-3990. Debnath AK, Lopez de Compadre RL, Hansch C. 1992. Mutagenicity of quinolines in Salmonella typhimurium TA100. A QSAR study based on hydrophobicity and molecular orbital determinants. Mutat Res 280: 55–65. [cited in US EPA 2001]. de Voogt P, van Hattum B, Leonards P, Kramer JC, Govers H. 1991. Bioconcentration of polycyclic hydrocarbons in the guppy (Poecilia reticulata). Aquat Toxicol 20: 169–194. de Vooght P, Laane RWPM. 2009, Assessment of azaarenes and azaarones (oxidized azaarene derivatives) in the Dutch coastal zone of the North Sea. Chemosphere 76: 1067–1074. Dong MW, Locke DC, Hoffmann D. 1977. Characterization of aza-arenes in basic organic portion of suspended particulate matter. Environ Sci Technol 11: 612–618. [EHS] Environmental Health Strategies Inc 2010. Final report on technical and economic study of VOC emissions from coal tar–based pavement sealants. Unpublished report prepared for Environmental Canada by Environmental Health Strategies Inc., Toronto, Ontario. [Available upon request]. Eisentraeger A, Brinkmann C, Hollert H, Sagner A, Tiehm A, Neuwoehner J. 2008. Heterocyclic compounds: toxic effects using algae, daphnids, and the Salmonella/microsome test taking methodical quantitative aspects into account. Environ Toxicol Chem 27(7): 1590–1596. [EMA] Environmental Management Agreement. 1997. Environmental management agreement among Dofasco Inc.; Her Majesty the Queen in Right of Canada as represented by the Minister of the Environment; and the Ministry of Environment, Province of Ontario. 14 pp. Available from: http://www2.ec.gc.ca/epe-epa/default.asp?lang=En&n=04C2055C-1 [EMA] Environmental Management Agreement. 2000. Environmental management agreement between Algoma Steel Inc. and Her Majesty the Queen in Right of Canada, as represented by the Minister of the Environment, and Her Majesty the Queen in Right of Ontario, as represented by the Minister of the Environment. Available from: http://www2.ec.gc.ca/epe-epa/default.asp?lang=En&n=F2E8DE70-1 Environment Canada. 1988. Coal tar waste sites. Toronto (ON): Ontario Ministry of Environment, Waste Management Branch. Environment Canada. 1999. Strategic options for the management of CEPA-toxic substances from the wood preservation sector. Vol. I. Final report from the Issue Table, National Office of Pollution Prevention, Environment Canada. 78 pp. Environment Canada. 2001a. Data collected under the Canadian Environmental Protection Act, 1999, Section 71: Notice with respect to certain substances on the Domestic Substances List. Data prepared by: Environment Canada, Existing Substances Program.
24

Screening Assessment CAS RN 91-22-5
Environment Canada. 2001b. Environmental code of practice for integrated steel mills—CEPA 1999 code of practice. 1st ed. Ottawa (ON): Environment Canada, Environmental Protection Service, Minerals and Metals Division. Report No.: EPS 1/MM/7. Available from: http://www.ec.gc.ca/nopp/docs/cp/1mm7/en/1mm7e.pdf [EOHS] Encyclopedia of Occupational Health and Safety. 1983. Vols. I & II. Geneva (CH): International Labour Office. p. 1812. Epler JL, Winton W, Ho T, Larimer FW, Rao TK, Hardigree AA. 1977. Comparative mutagenesis of quinolines. Mutat Res 39: 285–296. [EQC] Equilibrium Criterion Model. 2003. Version 2.02. Peterborough (ON): Trent University, Canadian Centre for Environmental Modelling and Chemistry. Available from: http://www.trentu.ca/academic/aminss/envmodel/models/EQC2.html Fischer A, Weber S, Reineke A-K, Hollender J, Richnow H-H. 2010. Carbon and hydrogen isotope fractionation during anaerobic quinoline degradation. Chemosphere 81: 400–407. Finley KT. 1996. Quinolines and isoquinolines. In: Kroschwitz JI, Howe-Grand M, editors. Kirk-Othmer encyclopedia of chemical toxicology. 2nd ed. Vol. 20. New York (NY): John Wiley and Sons. p. 768–799. Fowler MG, Brooks PW, Northcott M, King MWG, Barker JF, Snowdon LR. 1994. Preliminary results from a field experiment investigating the fate of some creosote components in a natural aquifer. Org Geochem 22: 641–649. Freeze RA, Cherry JA. 1979. Groundwater. Englewood Cliffs (NJ): Prentice-Hall. 604 p. Furimsky E. 2002. Sydney tar ponds: some problems in quantifying toxic waste. Environ Manage 30: 872–879. Furlong ET, Carpenter R. 1982. Azaarenes in Puget Sound sediments. Geochim Cosmochim Acta 46: 1385–1396. Futakuchi M, Hasegawa R, Yamamoto A, Cui L, Ogiso T, Ito N, Shirai T. 1996. Low susceptibility of the spontaneously hypertensive rat (SHR) to quinoline-induction of hepatic hemangioendothelial sarcomas. Cancer Lett 104: 37–41. Godsy EM, Goerlitz DF, Grbić-Galić D. 1992. Methanogenic biodegradation of creosote contaminants in natural and simulated ground-water ecosystems. Ground Water 30(2): 232–242. Golder Associates Ltd. 1987. Testing of specific organic compounds in soils in background urban areas: Port Credit and Oakville/Burlington, Ontario. working paper to Shell Canada Ltd. and Texaco Canada Ltd. Report No.: 861-1516/871-1123. [GRI] Gas Research Institute. 1990. Alternatives and costs for the restoration of manufactured gas plant sites. Chicago (IL): Gas Research Institute. Report No.: GRI 90/0098. Hakura A, Shimada H, Nakajima M, Sui H, Kitamoto S, Suzuki S, Satoh T. 2005. Salmonella/human S9 mutagenicity test: a collaborative study with 58 compounds. Mutagenesis 20(3): 217–228. Hamoud MA, Ong T, Petersen M, Nath J. 1989. Effects of quinoline and 8-hydroxyquinoline on mouse bone marrow erythrocytes as measured by the micronucleus assay. Teratogen Carcinogen Mutagen 9: 111–118. [cited in US EPA 2001]. Hanny BW., Thompson AC., Gueldner RC., Hedin PA. 1973. An investigation of the essential oil of Hibiscus syriacus L. J Agric Food Chem 21: 1001-1004. Harkins SM, Truesdale RS, Hill R, Hoffman P, Winters S. 1988. US production of manufactured gases: assessment of past disposal practices. Cincinnati (OH): US Environmental Protection Agency. 388 p. Report No.: EPA/600/2-88/012. Hasegawa R, Furukawa F, Toyoda K, Sato H, Imaida K, Takahashi M. 1989. Sequential analysis of quinoline-induced hepatic hemangioendothelioma development in rats. Carcinogenesis 10: 711–716. [cited in US EPA 2001]. Hawthorne SB, Sievers RE. 1984. Emission of organic pollutants from shale oil wastewaters. Environ Sci Technol 18(6): 483–490.
25
Screening Assessment CAS RN 91-22-5
Health Canada. 1998. Exposure factors for assessing total daily intake of priority substances by the general population of Canada. Unpublished report. Ottawa (ON): Health Canada, Environmental Health Directorate. Health Canada. 2005. State of the science report for quinoline. Available at: http://www.hc-sc.gc.ca/ewh-semt/pubs/contaminants/quinoline-quinoleine/index-eng.php Hirao K, Shinohara Y, Tsuda H, Fukushima S, Takahashi M, Ito N. 1976. Carcinogenic activity of quinoline on rat liver. Cancer Res 36: 329–335. [HSDB] Hazardous Substances Data Bank [database on the Internet]. 1983– . Quinoline. Bethesda (MD): National Library of Medicine (US). [revised 2003 Feb 14; cited 2009 Sep]. Available from: http://toxnet.nlm.nih.gov/cgi-bin/sis/htmlgen?HSDB [INTERA] INTERA Technologies Ltd. 1987a. Lees Avenue hydrogeologic study, final report. Vol. I. Prepared for the Ontario Ministry of Environment. 98 p. Report No.: H87-003. [INTERA] INTERA Technologies Ltd. 1987b. Lees Avenue hydrogeologic study, final report. Vol. II. Prepared for the Ontario Ministry of Environment. Report No.: H87-003 (appendices and plates). Ishihara M., Tsuneya T., Shiga M., Kawashima S., Yamagishi K., Yoshida F., Sato H., Uneyama K. 1992. New pyridine derivatives and basic components in spearmint oil (Mentha gentilis f. cardiaca) and peppermint oil (Mentha piperita). J Agric Food Chem 40: 1647-1655. [JETOC] Japan Chemical Industry Ecology-Toxicology & Information Center. 1996. Mutagenicity test data of existing chemical substances based on the toxicity investigation of the industrial safety and health law. Compiled under the supervision of Chemical Substances Investigation Division, Ministry of Labour, Japan. Tokyo (JP): JETOC. [cited in CCRIS 1999]. Johansen SS, Hansen AB, Mosbaek, H, Arvin E. 1997a. Identification of heteroaromatic and other organic compounds in ground water at creosote-contaminated sites in Denmark. Ground Water Monit Res 17(2): 106–115. Johansen SS, Arvin E, Mosbaek H, Hansen AB. 1997b. Degradation pathway of quinolines in a biofilm system under denitrifying conditions. Environ Toxicol Chem 16: 1821–1828. Kauss PB, Hamdy YS. 1991. Polycyclic aromatic hydrocarbons in surficial sediments and caged mussels of the St. Marys River, 1985. Hydrobiologia 219: 37–62. Kawamura K, Kaplan IR. 1983. Organic compounds in the rainwater of Los Angeles. Environ Sci Technol 17: 497–501. King MWG, Barker JF. 1999. Migration and natural fate of a coal tar creosote plume. 1. Overview and plume development. J Contam Hydrol 39: 249–279. Kochany J, Maguire RJ. 1994. Photodegradation of quinoline in water. Chemosphere 28: 1097–1110. LaVoie EJ, Shigematsu A, Adams EA, Rigotty J, Hoffman D. 1984. Tumor-initiating activity of quinoline and methylated quinolines on the skin of SENCAR mice. Cancer Lett 22(3): 269–273. [cited in US EPA 2001]. LaVoie EJ, Shigematsu A, Rivenson A. 1987. The carcinogenicity of quinoline and benzoquinolines in newborn CD-1 mice. Jpn J Cancer Res 78: 139–143. [cited in US EPA 2001]. LaVoie EJ, Dolan S, Little P, Wang CX, Sugie S, Rivenson A. 1988. Carcinogenicity of quinoline, 4- and 8-methylquinoline and benzoquinolines in newborn mice and rats. Food Chem Toxicol 26(7): 625–629. LaVoie EJ, Defauw J, Fealy M, Way B, McQueen CA. 1991. Genotoxicity of fluoroquinolines and methylquinolines. Carcinogenesis 12: 217–220. Lefevre P, Ashby J. 1992. Mitogenic activity of quinoline to the rat, mouse, and guinea pig liver: empirical correlations with hepatic carcinogenicity. Environ Mol Mutagen 20: 39–43. Lesage S, Jackson RE. 1992. Groundwater contamination and analysis at hazardous waste sites. New York (NY): Marcel Dekker. p. 337–355.
26

Screening Assessment CAS RN 91-22-5
Loring DH, Milligan TG, Willis DE, Saunders KS. 1998. Metallic and organic contaminants in sediments of the St. Croix estuary and Passamaquoddy Bay. Can Tech Rep Fish Aquat Sci 2245: 1–44. Mackay D, Di Guardo A, Paterson S, Cowan CE. 1996. Evaluating the environmental fate of a variety of types of chemicals using the EQC model. Environ Toxicol Chem 15: 1627–1637. Mackay D, Shiu W-Y, Ma K-C. 1999. Physical-chemical properties and environmental fate handbook [book with CD-ROM]. Chapman & Hall/CRCnetBase. Mahler BJ, Van Metre PC, Bashara TJ, Wilson JR, Johns DA. 2005. Parking lot sealcoat: an unrecognized source of urban polycyclic aromatic hydrocarbons. Environ Sci Technol 39: 5560–5566. Marhold J. 1986. Prehled prumysolove toxikologie: organicke latky. Vol. 2. Prague (CS): Avicenum. p. 848. Marsalek J, Schroeter H. 1988. Annual loadings of toxic contaminants in urban runoff from the Canadian Great Lakes basin. Water Pollut Res J Can 23(3): 360–378. Mattson VR, Arthur JW, Walbridge CT. 1976. Acute toxicity of selected organic compounds to fathead minnows. United States Environmental Protection Agency, EPA-600/9-78-018. Washington, DC. McNeil D. 1981. High-temperature coal tar. In: Elliott MA, editor. Chemistry of coal utilization. 2nd suppl. vol. New York (NY): John Wiley and Sons. p. 1003–1083. [MENVIQ] Ministère de l’Environnement du Québec. 1988. Les cokeries au Québec, rapport d’étape juin 1988. Québec (QC): Ministère de l’Environnement du Québec, Direction des Substances dangereuses. 26 p. + annex. Merriman JC. 1988. Distribution of organic contaminants in water and suspended solids of the Rainy River (Canada, USA). Water Pollut Res J Can 23(4): 590–601. Milleman RE, Birge WJ, Black JA, Cushman RM, Daniels KL, Franco PJ, Giddings JM, McCarthy JF, Stewart AJ. 1984. Comparative acute toxicity to aquatic organisms of components of coal-derived synthetic fuels. Trans Am Fish Soc 113: 74–85. Minomo K, Ohtsuka N, Nojiri K, Kurata Y, Karaushi M, Isobe Y. 2009. Characteristics of azaarenes and dioxins in gases emitted from waste incinerators. J Mater Cycles Waste Manage 11: 73–80. [MITI] Ministry of International Trade & Industry (JP), Basic Industries Bureau, Chemical Products Safety Division. 1992. Biodegradation and bioaccumulation data of existing chemicals based on the CSCL Japan. Tokyo (JP): Japan Chemical Industry Ecology-Toxicology & Information Center. Mortazavi R. 1996. Characterization of semi-volatile organic compounds (SVOCs) and volatile organic compounds (VOCs) from the Point Aconi coal-fired power plant. Ottawa (ON): Environment Canada, Environmental Technology Centre. Report No.: PMD/96-7. 21 p. + annexes. [MPBPWIN] Melting Point Boiling Point Program for Microsoft Windows [Estimation Model]. 2000. Version 1.43. Washington (DC): US Environmental Protection Agency, Office of Pollution Prevention and Toxics; Syracuse (NY): Syracuse Research Corporation. Available from: http://www.epa.gov/oppt/exposure/pubs/episuite.htm Nagao M, Yahagi T, Seino Y, Sugimura T, Ito N. 1977. Mutagenicities of quinoline and its derivatives. Mutat Res 42: 335–342. [NCI] National Chemical Inventories [database on a CD-ROM]. 2006. Columbus (OH): American Chemical Society. Available from: http://www.cas.org/products/cd/nci/index.html Neuwoehner J, Reineke A-K, Hollender J, Eisentraeger A. 2009. Ecotoxicity of quinoline and hydroxylated derivatives and their occurrence in groundwater of a tar-contaminated field site. Ecotoxicol Environ Saf 72: 819–827. [NHW] Dept. of National Health and Welfare (CA). 1990. Present patterns and trends in infant feeding in Canada. Ottawa (ON): Department of National Health and Welfare. NHW Cat. No. H39-199/1990E. [cited in Health Canada 1998].
27

Screening Assessment CAS RN 91-22-5
Nishimura K., Masuda M. 1971. Minor constituents of whisky fusel oils. J Food Science 36: 819-822. [NPRI] National Pollutant Release Inventory [database on the Internet]. 2009. Gatineau (QC): Environment Canada. [cited 2009 Aug]. Available from: http://www.ec.gc.ca/inrp-npri/ [OMEE] Ontario Ministry of Environment and Energy. 1997. Coal tar site investigation 1986–1995. Toronto (ON): Ontario Ministry of Environment and Energy. Report No.: PIBS 3482E. 18 p. + annex. Onuska FI, Terry KA. 1989. Identification and quantitative analysis of nitrogen-containing polycyclic aromatic hydrocarbons in sediments. J High Resol Chromatogr 12: 362–367. Oser, BL, Ford, RA. 1975. Recent progress in the consideration of flavoring ingredients under the Food Additives Amendment. 9 GRAS Substances. Food Technology 29: 70-72. Otson R, Fellin P, Whitmore R. 1992. A national pilot study on occurrence of airborne VOCs in residences—design and progress. In: Proceedings of the 1992 EPA/Air and Waste Management Association International Symposium on Measurement of Toxic and Related Air Pollutants. Pittsburgh (PA): Air and Waste Management Association. Report No.: VIP-25. p. 176–181. [cited in Otson et al. 1994]. Otson R, Fellin P, Tran Q. 1994. VOCs in representative Canadian residences. Atmos Environ 28(22): 3563–3569. Pereira WE, Rostad CE, Updegraff DM, Bennett JL. 1987. Fate and movement of azaarenes and their anaerobic biotransformation products in an aquifer contaminated by wood-treatment chemicals. Environ Toxicol Chem 6: 163–176. Raven KG, Beck P. 1992. Coal tar and creosote contamination in Ontario. In: Weyer KU, editor. Proceedings of the International Conference on Subsurface Contamination by Immiscible Fluids (Calgary, Canada, April 18–20, 1990). Rotterdam (NL): A.A. Balkema. p. 401–410. Reineke A-K, Goen T, Preiss A, and Hollender J. 2007. Quinoline and Derivatives at a Tar Oil Contaminated Site: Hydroxylated Products as Indicator for Natural Attenuation?. Environ Sci Technol 44: 5314–5322. [RDRC] Resources Development Research Centre. 1987. National overview of abandoned coal gasification works in Canada. Prepared for the Conservation and Protection Service, Environment Canada, by the Resources Development Research Centre, Carleton University, Ottawa, Ontario. 41 p. Contract Report No.: KE145-6-0728. [RIFM] Research Institute for Fragrance Materials, Inc. 2003. Quinoline. In: Monographs with cross reference list [CD ROM]. Hackensack (NJ): Research Institute for Fragrance Materials, Inc. Rogge WF, Hildemann LM, Mazurek MA, Cass GR, Simoneit BRT. 1993. Sources of fine organic aerosol. 2. Noncatalyst and catalyst-equipped automobiles and heavy-duty diesel trucks. Environ Sci Technol 27: 636–651. Saeki K, Kadoi M, Kawazoe Y, Futakuchi M, Tiwawech D, Shirai T. 1997. Modification of the carcinogenic potency of quinoline, a hepatocarcinogen, by fluorine atom substitution: evaluation of carcinogenicity by a medium-term assay. Biol Pharm Bull 20: 40–43. Scorecard [database on the Internet]. 2005. Chemical profile for quinoline (CAS No. 91-22-5). [cited 2009 Mar 17]. Available from: http://www.scorecard.org/chemical-profiles/ SENES Consultants Limited. 2002a. Emissions of air toxics from on-highway sources in Canada—Estimated impacts of various vehicle and fuel control strategies. Prepared for the Pollution Data Branch, Environment Canada. 29 p. SENES Consultants Limited. 2002b. Literature review: toxic emissions from off-road engines. Prepared for Off-Road Regulations, Transportation Systems Branch, Environment Canada. Shinohara Y, Ogiso T, Hananouchi M, Nakanishi K, Yoshimura T, Ito N. 1977. Effect of various factors on the induction of liver tumors in animals by quinoline. Gann 68: 785–796. Sideropoulos AS, Specht SM. 1984. Evaluation of microbial testing methods for the mutagenicity of quinoline and its derivatives. Curr Microbiol 11: 59–66.
28

Screening Assessment CAS RN 91-22-5
[SLV] St. Lawrence Vision 2000. 1996. QIT-Fer et Titane inc. Ottawa (ON): Ministry of Supply and Services Canada. 4 p. Fact Sheet No. 28. Available from: http://slv2000.qc.ca/bibliotheque/centre_docum/protection/028_f.pdf Smith JH, Mabey WR, Bohonos N, Holt BR, Lee SS, Chou T-W, Bomberger DC, Mill T. 1978. Environmental pathways of selected chemicals in freshwater systems. Part II: Laboratory studies. Athens (GA): US Environmental Protection Agency, Office of Research and Development, Environmental Research Laboratory. 432 p. Report No.: EPA-600/7-78-074. Smyth HF, Carpenter CP, Weil CS. 1951. Range-finding toxicity data: List IV. AMA Arch Ind Hyg Occup Med 4: 119–122. Sutton M. 2008. Coal tar pitch markets in Europe & North America. Oral presentation made at the 12th Annual Met Coke World Summit, Chicago, Illinois, October 22–24, 2008. Available at: http://accci.org/documents/Coal_Tar_Pitch_Markets_Presentation_001.ppt Suzuki H, Ikeda N, Kobayashi K, Terashima Y, Shimada Y, Suzuki T, Hagiwara T, Hatakeyama S, Nagaoka K, Yoshida J, Saito Y, Tanaka J, Hayashi M. 2005. Evaluation of liver and peripheral blood micronucleus assays with 9 chemicals using young rats. Mutat Res 583: 133–145. Suzuki H, Takasawa H, Kobayashi K, Terashima Y, Shimada Y, Ogawa I, Tanaka J, Imamura T, Miyazaki A, Hayashi M. 2009. Evaluation of a liver micronucleus assay with 12 chemicals using young rats (II): a study by the Collaborative Study Group for the Micronucleus Test/Japanese Environmental Mutagen Society–Mammalian Mutagenicity Study Group. Mutagenesis 24(1): 9–16. Suzuki T, Miyata Y, Saeki K, Kawazoe Y, Hayashi M, Sofuni T. 1998. In vivo mutagenesis by the hepatocarcinogen quinoline in the lacZ transgenic mouse: evidence for its in vivo genotoxicity. Mutat Res 412: 161–166. [cited in US EPA 2001]. Suzuki T, Takeshita K, Saeki K, Kadoi M, Hayashi M, Sofuni T. 2007. Clastogenicity of quinoline and monofluorinated quinolines in Chinese hamster lung cells. J Health Sci 53(3): 325–328. Tada M, Takahashi K, Kawazoe Y, Ito N. 1980. Binding of quinoline to nucleic acid in a subcellular microsomal system. Chem-Biol Interact 29: 257–266. Takahashi A, Ono H. 1993. Mutagenicity assessment in 44 epoxy resin hardeners in Salmonella typhimurium tester strains. Chem Exp 8: 785–788. Talcott R, Hollstein M, Wei E. 1976. Mutagenicity of 8-hydroxyquinoline and related compounds in the Salmonella typhimurium bioassay. Biochem Pharmacol 25: 1323–1328. [TaPL3] Long Range Transport and Persistence Level III model [Internet]. 2003. Version 3.00. Peterborough (ON): Trent University, Canadian Centre for Environmental Modelling and Chemistry. Available from: http://www.trentu.ca/academic/aminss/envmodel/models/TaPL3.html The Dictionary of Natural Products. 2011. version 19.2, Taylor & Francis Group. Entry name: quinoline. Available from: http://dnp.chemnetbase.com/dictionary-search.do?method=view&id=841897&si= [restricted access] Thomsen AB, Henriksen K, Gron C, Moldrup P. 1999. Sorption, transport and degradation of quinoline in unsaturated soil. Environ Sci Technol 33: 2891–2898. [US EPA] US Environmental Protection Agency. 1985. Health and environmental effects profile for quinoline. Washington (DC): US Environmental Protection Agency, Environmental Criteria and Assessment Office. Report No.: NTIS/PB88-183124. [US EPA] US Environmental Protection Agency. 1996. 1996 national-scale air toxics assessment. Washington (DC): US Environmental Protection Agency, Technology Transfer Network. Available from: http://www.epa.gov/ttn/atw/nata [US EPA] US Environmental Protection Agency. 2000. Hazardous air pollutants. In: National air pollutant emission trends: 1900–1998. Washington (DC): US Environmental Protection Agency, Technology Transfer Network. 51 p. Report No.: EPA 454/R-00-002.
29
Screening Assessment CAS RN 91-22-5
30
[US EPA] US Environmental Protection Agency. 2001. Toxicological review of quinoline (CAS No. 91-22-5) in support of summary information on the Integrated Risk Information System (IRIS). [cited 2002 Mar 11]. Washington (DC): US Environmental Protection Agency. Report No.: EPA/635/R-01/005. Available from: http://www.epa.gov/iris/toxreviews/1004-tr.pdf Warren LA, Tessier A, Hare L. 1998. Modelling cadmium accumulation by benthic invertebrates in situ: the relative contributions of sediment and overlying water reservoirs to organism cadmium concentrations. Limnol. Oceanogr. 43(7): 1442-1454. Watts AW, Ballestero TP, Roseen RM, and Houle JP. 2010. Polycyclic aromatic hydrocarbons in stormwater runoff from sealcoated pavements. Environ Sci Technol 44: 8849–8854. Webber MD. 1994. Industrial organic compounds in selected Canadian municipal sludges and agricultural soils. Final report for Land Resource Division, Centre for Land and Biological Resources Research, Agriculture and Agri-Food Canada. Burlington (ON): Environment Canada, Wastewater Technology Centre. 100 p. Weyand EH, Defauw J, McQueen CA, Meschter CL, Meegalla SK, LaVoie EJ. 1993. Bioassay of quinoline, 5-fluoroquinoline, carbazole, 9-methylcarbazole and 9-ethylcarbazole in newborn mice. Food Chem Toxicol 31: 707–715. Willems MI, Dubois G, Boyd DR, Davies RJH, Hamilton L, McCullough JJ, van Bladeren PJ. 1992. Comparison of the mutagenicity of quinoline and all monohydroxyquinolines with a series of arene oxide, trans-dihydrodiol, diol epoxide, N-oxide and arene hydrate derivatives of quinoline in the Ames/Salmonella microsome test. Mutat Res 278: 227–236. Wilson CW. III., Shaw PE., Knight RJ. Jr., Nagy S., Klim M. 1985. Volatile constituents of Carambola (Averrhoa carambola L.). J Agric Food Chem 33: 199-201. Yasuhara A, Shiraishi H, Nishikawa M, Yamamoto T, Nakasugi O, Okumura T, Kenmotsu K, Fukui H, Nagase M, Kawagoshi Y. 1999. Organic compounds in leachates from hazardous waste disposal sites. Waste Manage Res 17(3): 186–197. Zhu J. 2007. Presence of quinoline, biphenyl and other chemicals in driveway sealers and potential migration of these chemicals to indoor environments. Health Canada Internal Report. Air Contaminants Lab, Exposure and Biomonitoring Division, Health Canada. [Available upon request]. Zhu J, Yang X, Newhook R, Marro L. 2005. Overview of retro-analyses of selected chemicals in thermal desorption samples from Ottawa air study. Health Canada Internal Report. Air Contaminants Lab, Exposure and Biomonitoring Division, Health Canada. [Available upon request].

Appendix 1: Detailed description of the exposure scenario for release of quinoline in water
(A)
(B)
Aqueous plume
Figure A1.1. Generic abandoned gasworks site. (A) “Aerial” view showing the extent of coal tar contamination. (B) Geological cross-section showing the zone of contact of the aqueous plume with the river bottom. (C) Scenario used to define the spatial pattern of contamination in the river. A mixing box is used to model the contamination of river water by quinoline following initial contact with contaminated groundwater. Panels (A) and (B) are adapted from a case study in Ontario reported by Raven and Beck (1992); a review of information from over 100 abandoned sites in the United States has also been used to define the generic site (GRI 1990). About their case study, Raven and Beck (1992) wrote that “because the zone of non-aqueous phase contamination extends to the river, discharges of PAH (this includes azaarenes)…contaminated groundwater to the river will occur at this site for several decades.” Panel (C) is not to scale.
Mixing box
133 m
← River flow
Modelling of quinoline concentrations downstream of the box with ChemSim
Riverbank
(C)
7 m
Riverbank

Screening Assessment CAS RN 91-22-5
ChemSim Simulations
Substance Evaluated Substance: Quinoline CAS RN: 91-22-5 Effluent release type: Plume of groundwater containing quinoline entering a river from bottom sediments Release quantities: 0.1243, 0.1952, 0.6259 and 0.9777 kg of quinoline per day (depending on quinoline content of coal tar considered; see details below) No effect threshold: 3.4 µg/L Model River Raven and Beck (1992) did not provide any characteristics of the affected stream in their case study. However, in their generic abandoned gasworks site, GRI (1990) defined a river of a width of 11 m adjacent to the generic site. Kettle Creek, in southern Ontario, was a specific example of a river of similar size having been contaminated by manufactured gas operations (OMEE 1997).
River River category – mean flow
HYDAT station Latitude/ longitude
Data collection period
Locality
Kettle Creek Small 02CG002 42.77°N (latitude) 81.21°W (longitude) 1980–2000 St. Thomas (ON)
Channel geometry and hydraulic parameters at this station are as follows: channel width: 14.3 m; mean flow depth: 0.29 m; mean flow velocity: 0.30 m/s. Loadings Releases of quinoline to the model river are based on a case study in Ontario in which a large area of non-aqueous-phase pool of coal tar extended towards a river next to a gasworks site (Raven and Beck 1992). The parameters that follow were used to derive quinoline loadings: • Migration velocity of the aqueous phase: 0.03 m/day • Soil porosity: 33% (value suggested by GRI 1990) • Area of non-aqueous-phase contamination on the river bottom:
- 50th-percentile river flow: 133 m × 7.17 m = 953.6 m2 - 10th-percentile river flow: 133 m × 4.59 m = 610.5 m2 - The area was adjusted to half of the river width observed for a given river flow.
• Density of coal tar: 1.2 kg/L (Harkins et al. 1988) • Density of quinoline: 1.1 g/cm3 at 20°C (Mackay et al. 1999) • Fraction of quinoline in coal tar (w/w): 0.0011 and 0.005 65. These values bracket
lower and higher limits for quinoline content of coal tar (McNeil 1981).
32

Screening Assessment CAS RN 91-22-5
The exposure scenario considered the formation of a contaminated groundwater plume containing quinoline in contact with a pure coal tar phase in the soil (Figure A1.1 above). Raven and Beck (1992) qualified this situation as chronic; consequently, we assumed that steady state was reached with all sorption sites fully saturated with respect to quinoline. The following equations were used: 1) Dissolution of quinoline in groundwater according to Raoult’s Law: Max Ci = xi ×
Cswi, where xi = weight fraction of the component in the tar, 0.0011 and 0.005 65
above, and Cswi = solubility of the component in water. Ci is expressed as g/m3.
2) Contaminant transfer at the source, i.e., in contact with the coal tar plume: F = qCi,
where q = vn; v is groundwater velocity, 0.09 m/day, and n is soil porosity. The equation has been obtained from King and Barker (1999). F is expressed in units of g/m2 per day.
3) Contaminant transfer at the sediment–water interface: the equation in 2), F = qCi, was
used. The average distance from the coal tar plume to the sediment–water interface was 12 m. Therefore, lateral dispersion was assumed to be negligible. Aerobic biodegradation was assumed to affect 25 m on each side of the 183 m wide plume; as a result, the width of the non-aqueous plume was reduced to 133 m. The centre of the plume was assumed to be under anaerobic conditions not conducive to biodegradation, as suggested by the field experiment of Fowler et al. (1994) with coal tar creosote.
4) A “mixing box” was superimposed on the contaminated groundwater plume on the
river bottom. The volume of the box was the area, adjusted for the river flow above, multiplied by a water column height of 0.05 m. This approach took into account 1) the requirement that the plume be modelled like a diffuser-type source rather than like an end-of-pipe release by ChemSim, 2) the fact that following diffusion through the sediment–water interface, quinoline would remain near the river bottom because its density is higher than that of water, and 3) the fact that an uncontaminated volume of water would see its quinoline content increasing steadily while passing over the contaminated river bottom. The mixing box was divided in subvolumes of 1 m × 1 m × 0.05 m in order to derive a cumulative mass of quinoline at the end of the box (i.e., entry value for ChemSim in a diffuser-type pattern) and an average concentration of quinoline for the entire box. The ChemSim model calculated the concentration of quinoline assuming instantaneous dilution, which is a less conservative scenario than the one based on the formation of a plume developing from the diffuser-type source. Aerobic biodegradation was accounted for in these simulations. Four estimates of daily input of quinoline into the mixing box (kg/day) were calculated:
50% flow 10% flow x1 = 0.0011 0.1952 0.1243 x2 = 0.005 65 0.9777 0.6259
33

Screening Assessment CAS RN 91-22-5
Output Summary Table A1.1. Summary of the ChemSim output data
10th-percentile flow 50th-percentile flow Model river: Kettle Creek, St. Thomas (ON) x1 = 0.0011 x2 = 0.005 65 x1 = 0.0011 x2 = 0.005 65 Stream flow (m3/s) 0.14 0.14 1.07 1.07 Quinoline input into mixing zone (kg/day) 0.1243 0.6259 0.1952 0.9777
Dissolved quinoline concentration in surface water in the mixing zone, assuming instantaneous dilution (µg/L)
10.3 51.7 2.11 10.6
ChemSim Description ChemSim is a geographic information system–based aquatic exposure estimation model designed to estimate the dispersion and transport of substances released to watercourses. ChemSim combines estimated release quantities with information regarding the receiving watercourses to estimate aquatic exposure values. The estimated exposure values are characterized in the following three ways: 1) Concentrations of substances within the mixing zone (i.e., plume) can be predicted. 2) Percentage of the river width affected by the plume can be estimated. 3) Area of the watercourse with concentrations greater than a specified threshold can be
estimated. ChemSim was developed by the Canadian Hydraulics Centre of the National Research Council Canada and Environment Canada’s National Water Research Institute.
34

Screening Assessment CAS RN 91-22-5
Appendix 2: Robust study summaries ROBUST STUDY SUMMARY – Aquatic Inherent Toxicity
Item Yes No Reference: Black et al. (1983) Test substance: CAS # and name (specify, but do not assess this item): Quinoline CAS No. 91-22-5 *Chemical composition of the substance (including purity, by-products) X Is the chemical purity acceptable? NA Persistence/stability of test substance in aquatic solution X Method Reference: Birge et al. (1979) X *OECD, EU, national, or other standard method? American Society for Testing and Materials
X
Justification of the method/protocol if not a standard method was used: NA *GLP (Good Laboratory Practice) NA since study performed prior to 1990 Test organisms (specify common and Latin names): Rainbow trout (Oncorhynchus mykiss) Latin or both Latin and common names reported? X Was the test organism relevant to the Canadian environment? X Life cycle age / stage of test organism: Embryo-larval stage X Sex: NA Length and weight of test organisms: NA Number of test organisms per replicate: 100–150 eggs per exposure chamber X Food type / feeding periods (acclimation/during test): NA Test design / conditions Test type – acute or chronic (specify, but do not assess this item): Chronic Experiment type (laboratory or field) specified? Lab X System type (static, semi-static, flow-through)? Continuous flow-through X Negative or positive controls (specify)? Negative X Number of replicates (including controls) and concentrations: Duplicate + 5 treatments
X
Exposure pathways (food, water, both): Water X Exposure duration: 21 days X *Measured concentrations reported? (spectrophotometry) X If not, is the chemical volatile or not stable in water? NA Were concentrations measured periodically, if it was long-term (chronic) experiment?
X
Were the exposure media conditions relevant to the particular chemical (i.e. pH, DOC/TOC, water hardness, and temperature for the metal toxicity) reported?
X
Was pH within 5.5–8 range? (do not assess this item) X Was temperature within 5–27°C range? (do not assess this item) X Were pH, temperature, and other parameters typical for the test organism? X Photoperiod and light intensity X Stock and test solution preparation X Were solubilizer/emulsifier used, if the chemical was unstable or poorly soluble? NA
If yes, were concentrations of solubilizer/emulsifier reported? NA
35

Screening Assessment CAS RN 91-22-5
Item Yes No AND, if yes, was toxicity of solubilizer/emulsifier reported? NA Biological monitoring intervals X Statistical methods used X Results Toxicity values (LC50, EC50, or IC50 - specify, do not assess this item): % hatchability, % survival hatching, % survival 4 days post-hatching Was the endpoint directly caused by the chemical’s toxicity (i.e., not by untypical test conditions, organisms’ health, etc.)?
X
Other endpoints reported - BCF/BAF, LOEC/NOEC (specify, do not assess this item): LC50 (post-hatching) *Was toxicity value below the chemical’s water solubility? X Other adverse effects (carcinogenicity, mutagenicity, etc. Do not assess this item) X Score: major items - …3/4; overall score: 21/24 = 87.5% EC Reliability code: 1 Reliability category (high, satisfactory, low): High Comments: Study used to derive the Interim Canadian Water Quality Guideline of quinoline (3.4 µg/L)
ROBUST STUDY SUMMARY – Aquatic Inherent Toxicity
Item Yes No Reference: Bleeker et al. (1998) Test Substance: CAS # and name (specify, but do not assess this item): Quinoline CAS No. 91-22-5 *Chemical composition of the substance ( including purity, by-products) X Is the chemical purity acceptable? X Persistence/stability of test substance in aquatic solution X Method References X *OECD, EU, national, or other standard method? X Justification of the method/protocol if not a standard method was used X *GLP (Good Laboratory Practice): Study published in 1998 X Test organisms (specify common and Latin names): Midge Chironomus riparius Latin or both Latin and common names reported? X Was the test organism relevant to the Canadian environment? X Life cycle age / stage of test organism: Newly hatched first instar larva X Sex: NA Length and weight of test organisms: NA Number of test organisms per replicate: 50 X Food type / feeding periods (acclimation/during test): grounded Trouvit and Tetraphyl
X
Test design / conditions Test type – acute or chronic (specify, but do not assess this item): Acute Experiment type (laboratory or field) specified? Lab X System type (static, semi-static, flow-through)? Static X Negative or positive controls (specify)? Negative X Number of replicates (including controls) and concentrations: 2 and 5 concentrations X Exposure pathways (food, water, both): Both X
36

Screening Assessment CAS RN 91-22-5
Item Yes No Exposure duration: 96 h X *Measured concentrations reported? X If not, is the chemical volatile or not stable in water? NA Were concentrations measured periodically, if it was long-term (chronic) experiment?
Were the exposure media conditions relevant to the particular chemical (i.e. pH, DOC/TOC, water hardness, and temperature for the metal toxicity) reported?
Was pH within 5.5–8 range? (do not assess this item): Not specified Was temperature within 5–27°C range? (do not assess this item) X Were pH, temperature, and other parameters typical for the test organism? Photoperiod and light intensity X Stock and test solution preparation X Were solubilizer/emulsifier used, if the chemical was unstable or poorly soluble? NA
If yes, were concentrations of solubilizer/emulsifier reported? AND, if yes, was toxicity of solubilizer/emulsifier reported? Biological monitoring intervals X Statistical methods used X Results Toxicity values (LC50, EC50, or IC50 - specify, do not assess this item): 96 h LC50 Was the endpoint directly caused by the chemical’s toxicity (i.e., not by untypical test conditions, organisms’ health, etc.)? Apparently, no sediment was added even if the organisms live in close contact with the sediment. The authors judged acceptable that survival in the controls always exceeded 80%. Chironomus larvae obtain an important part of their contaminant burden from the overlying water column (e.g., Warren et al. 1998)
X
Other endpoints reported - BCF/BAF, LOEC/NOEC (specify, do not assess this item): Growth *Was toxicity value below the chemical’s water solubility? X Other adverse effects (carcinogenicity, mutagenicity, etc. Do not assess this item) Score: major items - 3/5; overall score: 20/25 = 80% EC Reliability code: 1 to 2 Reliability category (high, satisfactory, low): Satisfactory to high confidence Comments:
ROBUST STUDY SUMMARY – Aquatic Inherent Toxicity
Item Yes No Reference: Johansen et al. (1997b) Test Substance: CAS # and name (specify, but do not assess this item): Quinoline CAS No. 91-22-5 *Chemical composition of the substance ( including purity, by-products) … somewhat … could be more detailed
½
Is the chemical purity acceptable? 98% X Persistence/stability of test substance in aquatic solution X Method Reference: Arvin et al. (1994) X *OECD, EU, national, or other standard method? X Justification of the method/protocol if not a standard method was used: Not in this paper, but in Arvin et al. (1994), MINNTOX is a method for screening, as other
½
37

Screening Assessment CAS RN 91-22-5
Item Yes No existing methods are not suitable for that purpose (i.e., demanding experimental protocol) *GLP (Good Laboratory Practice) X Test organisms (specify common and Latin names) Latin or both Latin and common names reported? Nitrifying bacteria probably; authors reported that “The microorganisms used as inoculum originated from activated sludge obtained at a wastewater treatment plant”
X
Was the test organism relevant to the Canadian environment? I assume X Life cycle age / stage of test organism: “an active nitrifying sludge from a waste water treatment plant”
X
Sex: NA Length and weight of test organisms: NA Number of test organisms per replicate X Food type / feeding periods (acclimation/during test): NA Test design / conditions Test type – acute or chronic (specify, but do not assess this item): Chronic Experiment type (laboratory or field) specified? Lab X System type (static, semi-static, flow-through)? Static X Negative or positive controls (specify)? Positive (allylthiourea) X Number of replicates (including controls) and concentrations: 3 replicates/6 concentrations
X
Exposure pathways (food, water, both): NA Exposure duration: 2 h X *Measured concentrations reported? X If not, is the chemical volatile or not stable in water? NA Were concentrations measured periodically, if it was long-term (chronic) experiment? NA
Were the exposure media conditions relevant to the particular chemical (i.e. pH, DOC/TOC, water hardness, and temperature for the metal toxicity) reported?
X
Was pH within 5.5–8 range? (do not assess this item) Was temperature within 5–27°C range? (do not assess this item) X Were pH, temperature, and other parameters typical for the test organism? ?? Photoperiod and light intensity: NA Stock and test solution preparation X Were solubilizer/emulsifier used, if the chemical was unstable or poorly soluble? NA
If yes, were concentrations of solubilizer/emulsifier reported? NA AND, if yes, was toxicity of solubilizer/emulsifier reported? NA Biological monitoring intervals X Statistical methods used X Results Toxicity values (LC50, EC50, or IC50 - specify, do not assess this item): EC50 / concentration that inhibited nitrification by 50% Was the endpoint directly caused by the chemical’s toxicity (i.e., not by untypical test conditions, organisms’ health, etc.)?
X
Other endpoints reported - BCF/BAF, LOEC/NOEC (specify, do not assess this item): Degradation pathways of quinoline
38

Screening Assessment CAS RN 91-22-5
Item Yes No *Was toxicity value below the chemical’s water solubility? X Other adverse effects (carcinogenicity, mutagenicity, etc. Do not assess this item) Score: major items -2.5/5 overall score: 16/23= 70% EC Reliability code: 2 to 3 Reliability category (high, satisfactory, low): Low to satisfactory Comments:
ROBUST STUDY SUMMARY – Aquatic Inherent Toxicity
Item Yes No Reference: Milleman et al. (1984) Test Substance: CAS # and name (specify, but do not assess this item): Quinoline CAS No.: 91-22-5 *Chemical composition of the substance ( including purity, by-products) X Is the chemical purity acceptable? NA Persistence/stability of test substance in aquatic solution X Method Reference: Mattson et al. 1976 X *OECD, EU, national, or other standard method? US EPA X Justification of the method/protocol if not a standard method was used NA *GLP (Good Laboratory Practice) NA since study performed prior to 1990 Test organisms (specify common and Latin names): Fathead minnow Pimephales promelas (+ algae, snails, cladocerans, amphipods, midges, largemouth bass and rainbow trout) Latin or both Latin and common names reported? X Was the test organism relevant to the Canadian environment? X Life cycle age / stage of test organism: 1–2 months old X Sex X Length and weight of test organisms: 0.27 g and 28 mm total length X Number of test organisms per replicate: 5 fish X Food type / feeding periods (acclimation/during test): 48 h acclimation / fish not fed in test
X
Test design / conditions Test type – acute or chronic (specify, but do not assess this item): Acute 96 h test Experiment type (laboratory or field) specified? Laboratory X System type (static, semi-static, flow-through)? Static X Negative or positive controls (specify)? Negative controls X Number of replicates (including controls) and concentrations: 2 replicates/3–4 test concentrations
X
Exposure pathways (food, water, both): Water only X Exposure duration: 96 h X *Measured concentrations reported? Measured by UV absorbance; LC50s reported X If not, is the chemical volatile or not stable in water? NA Were concentration measured periodically, if it was long-term (chronic) experiment? X Were the exposure media conditions relevant to the particular chemical (i.e. pH, DOC/TOC, water hardness, and temperature for the metal toxicity) reported?
X
Was pH within 5.5–8 range? (do not assess this item) X Was temperature within 5–27°C range? (do not assess this item) X
39

Screening Assessment CAS RN 91-22-5
Item Yes No Were pH, temperature, and other parameters typical for the test organism? For the minnow test, dissolved oxygen levels changed markedly from 8.5 ppm at t = 0 to 4.3 ppm 48 h later, when test fish had already been affected by the chemicals.
X (½)
Photoperiod and light intensity X Stock and test solution preparation X Were solubilizer/emulsifier used, if the chemical was unstable or poorly soluble? X If yes, were concentrations of solubilizer/emulsifier reported? NA AND, if yes, was toxicity of solubilizer/emulsifier reported? NA Biological monitoring intervals: 0, 2, 16, 24, 48, 72, 96 h X Statistical methods used X Results Toxicity values (LC50, EC50, or IC50 - specify, do not assess this item): LC50 Was the endpoint directly caused by the chemical’s toxicity (i.e., not by untypical test conditions, organisms’ health, etc.)? Yes; low DO – Fatheads are recognized as very tolerant of muddy water, with low oxygen levels. They are very hardy. It can be concluded that mortality of test fish in presence of quinoline was directly caused by quinoline’s toxicity and not by changes in DO in course of exposure.
X
Other endpoints reported - BCF/BAF, LOEC/NOEC (specify, do not assess this item): No *Was toxicity value below the chemical’s water solubility? X Other adverse effects (carcinogenicity, mutagenicity, etc. Do not assess this item) X Score: major items - 3/4; overall score: 23.5/28 = 84% EC Reliability code: 1 Reliability category (high, satisfactory, low): High Comments:
ROBUST STUDY SUMMARY - Persistence
Item Yes No
Reference: MITI (1992) Test Substance: CAS # and name (do not assess this item): 91-22-5 (Quinoline) Substance purity reported? (Y/N and specify) X Method References (Y/N) X OECD, EU, national, or other standard method? (Y/N) X If not a standard method, justification of the method/protocol provided? (Y/N) Not applicable
Test design / conditions Study type (e.g., hydrolysis, biodegradation, etc. – specify, but do not assess): Biodegradation Conditions type (aerobic or anaerobic - specify, but do not assess): Test medium (air, water, soil, or sediment - specify, but do not assess): Information on stability of the substance in the media of concern available? (do not assess this item): Yes Information on controls (Y/N and specify, positive or negative): Both X Number of replicates (Y/N and specify) X Temperature (Y/N and specify): 25±1°C X Test duration (Y/N and specify): 14 or 28 days X Analytical method / technique used (Y/N) X For photodegradation only
40

Screening Assessment CAS RN 91-22-5
Item Yes No
Reactants of gas-phase reactions (specify, but do not assess this item) Light source (Y/N and specify) Light spectrum and/or relative intensity based on sunlight intensity (Y/N) For hydrolysis only Measured concentrations reported? (Y/N) pH values reported? (Y/N and specify) For biodegradation only Ready or inherent biodegradation? (specify, but do not assess this item): Ready Substance concentration (Y/N): 100 mg/L X Inoculum source (Y/N): Sludge X Inoculum concentration or number of microorganisms (Y/N) Sludge: 30 mg/L X Results Endpoints / values / units (do not assess this item): 0.2% by BOD Information on breakdown products available? (do not assess this item) Overall score: 73% EC Reliability code: 2 Reliability category (high, satisfactory, low): Satisfactory
Abbreviations: OECD: Organization of Economic Cooperation and Development; EU: European Union; NA: both not available and not applicable; CAS: Chemical Abstract Service; DOC: Dissolved Organic Carbon; TOC: Total Organic Carbon; LC50: Lethal concentration for 50% of the test organisms; EC50: Effect concentration for 50% of the test organisms; IC50: Inhibitory concentration for 50% of the test organisms; BCF: Bioconcentration Factor; BAF: Bioaccumulation Factor; LOEC: Lowest Observed Effect Concentration; NOEC: No Observed Effect Concentration; US EPA: United States Environmental Protection Agency; UV: Ultra violet; Ppm: parts per million; BOD: Biological Oxygen Demand
41

Screening Assessment CAS RN 91-22-5
Appendix 3: Upper-bounding estimates of daily intake of quinoline by the general population in Canada
Estimated intake (µg/kg-bw per day) of quinoline by various age groups 0–6 months1,2,3 Route of
exposure Formula fed
Not formula
fed
0.5–4 years4
5–11 years5
12–19 years6
20–59 years7
60+ years8
Ambient air9 1.75 × 10⁻³ 3.75 ×
10−3 2.92 × 10⁻³
1.66 × 10⁻³
1.43 × 10⁻³
1.24 × 10⁻³
Indoor air9 0.0123 0.0263 0.0205 0.0116 0.0100 0.0087 Drinking water10
1.07 × 10⁻⁴ 4.0 × 10⁻⁵ 4.5 × 10⁻⁵ 3.6 × 10⁻⁵ 2.0 × 10⁻⁵ 2.1 × 10⁻⁵ 2.2 × 10⁻⁵
Food11 NA NA NA NA NA NA NA Soil12 2.4 × 10⁻⁴ 3.9 × 10⁻⁴ 1.3 × 10⁻⁴ 3.0 × 10⁻⁵ 2.5 × 10⁻⁵ 2.5 × 10⁻⁵ Total intake 0.014 0.014 0.030 0.024 0.013 0.011 0.01
Abbreviation: NA, not available. 1 No data on levels of quinoline in breast milk were identified. 2 Assumed to weigh 7.5 kg, to breathe 2.1 m3 of air per day, to drink 0.8 L of water per day (formula
fed) or 0.3 L/day (not formula fed) and to ingest 30 mg of soil per day (Health Canada 1998). 3 For formula-fed infants, intake from water is synonymous with intake from food. No data on
concentrations of quinoline in formula were identified for Canada. For non-formula-fed infants, approximately 50% are introduced to solid foods by 4 months of age and 90% by 6 months of age (NHW 1990).
4 Assumed to weigh 15.5 kg, to breathe 9.3 m3 of air per day, to drink 0.7 L of water per day and to ingest 100 mg of soil per day (Health Canada 1998).
5 Assumed to weigh 31.0 kg, to breathe 14.5 m3 of air per day, to drink 1.1 L of water per day and to ingest 65 mg of soil per day (Health Canada 1998).
6 Assumed to weigh 59.4 kg, to breathe 15.8 m3 of air per day, to drink 1.2 L of water per day and to ingest 30 mg of soil per day (Health Canada 1998).
7 Assumed to weigh 70.9 kg, to breathe 16.2 m3 of air per day, to drink 1.5 L of water per day and to ingest 30 mg of soil per day (Health Canada 1998).
8 Assumed to weigh 72.0 kg, to breathe 14.3 m3 of air per day, to drink 1.6 L of water per day and to ingest 30 mg of soil per day (Health Canada 1998).
9 The estimated detection limit of quinoline (0.05 µg/m3) for both ambient and indoor air in an air quality survey conducted in 75 homes in Ottawa, Ontario, was used to calculate the upper-bounding limit of exposure estimate (Zhu et al. 2005). Canadians are assumed to spend 3 h/day outside (Health Canada 1998)..
10 No data on levels of quinoline in drinking water were identified. As a surrogate, the detection limit (0.001 µg/L) for measuring quinoline in samples of surface water from Rainy River, Ontario, was used to calculate the upper-bounding limit of exposure estimate (Merriman 1988). For formula-fed infants, the concentration of quinoline in the water used to reconstitute formula accounts for the intake of quinoline from food.
11 Insufficient data on levels of quinoline in food were identified. 12 The highest concentration (60 µg/kg dry weight) of quinoline detected among soil samples collected
from southern Ontario was used to calculate the upper-bounding limit of exposure estimate (Webber 1994).
42

Screening Assessment CAS RN 91-22-5
Appendix 4: Summary of health effects information for quinoline Endpoint Lowest effect levels1/Results Acute toxicity Lowest oral LD50 (rat) = 331 mg/kg-bw (Marhold 1986).
[Additional study: Smyth et al. 1951] Lowest dermal LD50 (rabbit) = 540 µL/kg-bw (Smyth et al. 1951). [Additional study: Marhold 1986]
Short-term repeated-dose toxicity
No data were identified.
Subchronic toxicity
Lowest oral (diet) non-neoplastic LOEL (rat) = 0.05% in diet (25 mg/kg-bw per day), based on increased absolute and relative liver weights, fatty change, bile duct proliferation and oval cell infiltration in a 16- to 40-week study with 0%, 0.05%, 0.10% or 0.25% in diet (0, 25, 50 or 125 mg/kg-bw per day); study details are described in the carcinogenicity bioassay section (Hirao et al. 1976). [Additional studies: Shinohara et al. 1977; Hasegawa et al. 1989; Futakuchi et al. 1996]
Chronic toxicity/ carcinogenicity
No chronic toxicity data were identified. Dietary carcinogenicity bioassays in rats: Twenty male Sprague-Dawley (SD) rats per test group and six male SD rats in the control group were administered 0%, 0.05%, 0.10% or 0.25% quinoline in diet (0, 25, 50 or 125 mg/kg-bw per day) for 16–40 weeks. Increased incidence (compared with controls) of hepatocellular carcinomas (0/6, 3/11, 3/16 and 0/19 at 0, 25, 50 and 125 mg/kg-bw per day, respectively) and hemangioendotheliomas and/or hemangiosarcomas (0/6, 6/11, 12/16 and 18/19 at 0, 25, 50 and 125 mg/kg-bw per day, respectively) were observed. Two of 16 rats administered 0.10% quinoline had hemorrhagic metastatic foci in the lungs; statistical analysis was not provided. In addition, dose-related increased mortality, decreased body weight gain and increased absolute and relative liver weights were observed. The levels of serum glutamate–oxaloacetate transaminase (SGOT) and alkaline phosphatase increased slightly in rats administered 0.05% quinoline (animals in other groups were not examined) (Hirao et al. 1976). The US EPA (2001) indicated that the low incidence of hepatocellular carcinomas in the high-dose group may have been due to early mortality from rupture of hemangioendotheliomas and/or hemangiosarcomas. Wistar rats, 25 of each sex per group, were administered 0.2% quinoline in diet (100 mg/kg-bw per day) for 30 weeks. Increased incidences of liver nodular hyperplasia (7/15 in males and 14/22 in females), hemangioendotheliomas (11/15 in males and 7/22 in females) and hepatocellular carcinomas (2/15 in males and 2/22 in females) were observed (no further statistical analysis for this endpoint was provided) in exposed rats. The differences in the incidences of hemangioendotheliomas between male and female rats are statistically significant, indicating that male rats are more susceptible to the tumorigenic action of quinoline. In addition, increases in relative liver weights (no statistical analysis was provided) and some liver
43

Screening Assessment CAS RN 91-22-5
Endpoint Lowest effect levels1/Results lesions, such as nodules that were white, dark yellow or hemorrhagic, fatty changes, increased liver oval cell counts, megalocyctosis and bile duct proliferation, were also observed in exposed rats. Some of the rats had hemorrhagic metastatic foci in the lungs. No data on control animals were provided (Shinohara et al. 1977). SD rats, 20 males in the test group and 10 males in the control group, were administered 0.075% quinoline in diet (37.5 mg/kg-bw per day) for 30 weeks. Increased incidences of liver nodular hyperplasia (9/20) and hemangioendotheliomas (6/20), but not hepatocarcinomas, were observed in the exposed rats. No liver tumours were observed in the control animals. In addition, increased relative liver weights and liver oval cell counts; increased liver bile duct proliferation, liver fatty changes and liver megalocytosis; decreased red blood cell and white blood cell counts, haemoglobin amounts and aspartate transaminase (SGOT) and blood urea nitrogen levels; and increased alanine transaminase (serum glutamate–pyruvate transaminase) levels were also observed (statistical analysis was not provided) (Shinohara et al. 1977). Male Wistar rats (5–18 per group) were administered 0.25% quinoline in diet for 4, 8, 12, 16 or 20 weeks (50–68 mg/kg-bw per day). A significantly increased incidence of hemangioendotheliomas was observed in the livers of rats given quinoline for more than 12 weeks. The incidences of small foci of dysplastic endothelial cells and tumours at week 20 did not differ between the 12-, 16- and 20-week exposed groups. There was an increased relative area occupied by sinusoidal space after the 4-week exposure. Animal death was observed due to the toxicity of the chemical or the rupture of the vascular tumours of the liver (Hasegawa et al. 1989). Sixteen male spontaneously hypertensive rats (SHR) and 16 male Wistar Kyoto rats (WKY) were administered 0.2% quinoline in diet (88 mg/kg-bw per day and 72 mg/kg-bw per day, respectively) for 32 weeks; 10 male rats of each strain were in the control group; 2% corn oil was added to all diets. A significantly increased incidence of hemangiosarcomas was observed in WKY rats (14/15) but not in SHR rats (1/15). Eight exposed WKY rats died of hepatic tumours after 25 weeks. Decreased body weight gain was observed in the exposed animals from the first week to the end of the experiment. No tumours were observed in the control rats. Significantly increased liver weights were observed in both strains, whereas significantly decreased body weight gain was observed only in SHR rats. Histopathological lesions were limited mainly to the liver. A few hyperplastic hepatocyte nodules were observed in both strains of quinoline-exposed rats (Futakuchi et al. 1996). Dietary carcinogenicity bioassays in mice: DdY mice, 40 of each sex per group, were administered 0.2% quinoline in diet (260 mg/kg-bw per day) for 30 weeks. Half of the mice died within the first 6 weeks due to pneumonia. Increased incidences of liver nodular hyperplasia (1/10 in males and 2/10 in females), hemangioendotheliomas (8/10 in males and 8/10 in females) and hepatocellular carcinomas (1/10 in males and 0/10 in females) were observed (no further statistical analysis for
44

Screening Assessment CAS RN 91-22-5
Endpoint Lowest effect levels1/Results this endpoint) in exposed mice. No data on control animals were provided (Shinohara et al. 1977). Dietary carcinogenicity bioassays in hamster: Syrian golden hamsters, 25 of each sex per group, were administered 0.2% quinoline in diet (180 mg/kg-bw per day) for 30 weeks. No tumours were observed in exposed hamsters. No data on control animals were provided (Shinohara et al. 1977). Dietary carcinogenicity bioassays in guinea pigs: Hartley guinea pigs, 22 of each sex per group, were administered 0.2% quinoline in diet (80 mg/kg-bw per day) for 30 weeks. No tumours were observed in exposed guinea pigs. No data on control animals were provided (Shinohara et al. 1977). Carcinogenicity bioassays via other exposure routes: Newborn CD-1 mice (41 pups in the test group; 35 pups in the control group) were administered a total dose of 1.75 µmol quinoline dissolved in dimethyl sulfoxide (DMSO) by intraperitoneal injection on days 1, 8 and 15 of life, and the animals were observed for 52 weeks. The control group was administered 5, 10 and 20 µl DMSO. A significantly increased incidence of liver tumours was observed in exposed male mice (12/17; 4 adenomas and 8 carcinomas), but not in exposed female mice (1/10). A significantly increased incidence of lymphomas was observed in exposed female mice (4/10), but not in exposed male mice (1/17). One male mouse in the control group administered DMSO developed a liver tumour (1/17) and lymphoma (1/17) (LaVoie et al. 1987). Newborn CD-1 mice (56 pups in the test group; 46 pups in the control group) were administered a total dose of 1.75 µmol quinoline dissolved in DMSO by intraperitoneal injection on days 1, 8 and 15 of life; the control group was administered 5, 10 and 20 µl DMSO. The animals were observed for 52 weeks. A significantly increased incidence of liver tumours was observed in exposed male mice (15/19; 13 adenomas and 2 carcinomas), but not in exposed female mice (0/27). The incidence of lymphomas or lung tumours was not significantly increased in the exposed female mice (5/25 and 3/25, respectively). No tumours were observed in the control mice administered DMSO (LaVoie et al. 1988). Newborn SD rats (101 pups in the test group; 50 pups in the control group) were subcutaneously injected with quinoline at 200 µmol/kg-bw within 24 h of birth; 59% mortality was observed in exposed rats. The doses were then reduced to 100 µmol/kg-bw for weeks 2–7 and back to 200 µmol/kg-bw for week 8; the control group was administered 500 µl DMSO within 24 h of birth and then weekly from weeks 2 to 8 of life. The animals were observed for 78 weeks. No increased incidence of liver tumours was observed in exposed male (1/25) or female (0/15) rats, compared with the control animals (5/27 in male rats and 1/22 in female rats) (LaVoie et al. 1988). Newborn CD-1 mice (85 pups in the test group; 97 pups in the control group)
45

Screening Assessment CAS RN 91-22-5
Endpoint Lowest effect levels1/Results were administered a total dose of 1.75 µmol quinoline dissolved in DMSO by intraperitoneal injection on days 1, 8 and 15 of life, and the animals were observed for 52 weeks. The control group was administered 5, 10 and 20 µl DMSO. A significantly increased incidence of liver tumours, mainly adenomas, was observed in exposed male mice (20/33), but not in exposed female mice (2/37). No liver tumours were observed in the control animals administered DMSO (Weyand et al. 1993). Tumour initiation–promotion assays: Tumour-initiating activity: SENCAR mice, 40 females per group, were applied 0.75% quinoline dissolved in 01 mL acetone on the shaved back, every 2 days for 10 applications (a total dose of 7.5 mg per mouse). Acetone only was applied on the backs of control mice. Ten days after the last application of the initiator, promotion was begun by applying 2.0 µg of 12-O-tetradecanoylphorbol-13-acetate (TPA) in 0.1 mL acetone twice weekly for 18 weeks. A significantly increased incidence of skin tumours was observed in exposed mice (53%), whereas only 7.5% of control animals developed skin tumours. For the animal in a positive control group (exposed to benzo[a]pyrene), 63% of them developed liver tumours (LaVoie et al. 1984). Tumour-promoting activity: F344 rats, 16 males per group, were given a single intraperitoneal injection of diethylnitrosamine (DEN) at 200 mg/kg-bw. Then, 0.05% or 0.1% quinoline was added to their diet for a period of 6 weeks, starting from 2 weeks after the DEN injection. Control groups were administered DEN alone, All rats were subjected to a partial (two thirds) hepatectomy at the end of week 3 and sacrificed at the end of week 8. Significantly increased numbers and areas of placental glutathione S-transferase-positive (GST-P) foci in the liver were observed in male rats exposed to 0.1% quinoline. In addition, significantly increased relative liver weights and kidney weights were observed in both exposed groups (Saeki et al. 1997).
Developmental toxicity
Other than the carcinogenicity studies in newborn mice reported above, no studies of the effects of quinoline on developing organisms have been identified.
Reproductive toxicity
No data were identified.
Genotoxicity and related endpoints: in vivo
Mutagenicity Positive results: Lac Z transgenic mice (Muta™Mouse), four females per group, were administered 10 mL (50 mg) of quinoline (suspended in olive oil) per kilogram body weight per day by intraperitoneal injection for 4 consecutive days. Vehicle control animals were administered olive oil. Positive control animals were administered DEN (1 mg/kg-bw per day, 3 females per group). Mice were killed 14 days after the last injection, and the liver, kidney, lung and spleen were examined. In the same study, another set of animals underwent partial hepatectomy (two thirds removed) 1 day after the final injection, and the animals were killed 13 days after the operation. Appreciably increased mutation frequencies in the livers were observed in
46

Screening Assessment CAS RN 91-22-5
Endpoint Lowest effect levels1/Results both non-hepatectomized and partially hepatectomized mice (no further statistical analyses were provided), but not in the lung, kidney or spleen of the same treated mice exposed to quinoline or the positive control chemical. Partial hepatectomy doubled the mutation frequency of quinoline in the liver (Suzuki et al. 1998). Mitogenic activity Positive results: Adult C57BL/6JBL10/Alpk mice, 4 males per group, were administered quinoline at 40, 100 or 225 mg/kg-bw via gavage. After 24 h, hepatocytes were isolated. A dose-related increase in the incidence of S-phase hepatocytes was observed in the cells from exposed animals (no further statistical analysis was provided). The control animals were administered 10 mL corn oil (Lefevre and Ashby 1992). Adult Alpk:AP SD rats, four males per group, were administered quinoline at 40 or 100 mg/kg-bw via gavage. After 24 h, hepatocytes were isolated. A dose-related increase in the incidence of S-phase hepatocytes was observed in the cells from exposed animals (no further statistical analysis was provided). The control animals were administered 10 mL corn oil (Lefevre and Ashby 1992). Adult Alpk:AP rats, 3–9 males per group, were administered quinoline at 225 or 500 mg/kg-bw via gavage. After 12–36 h, hepatocytes were isolated. Quinoline exposure remarkably induced the S-phase in the hepatocytes, which was observed between 16 and 36 h post-dosing (no further statistical analysis was provided). The dose-related induction of S-phase in the hepatocytes was observed at 36 h but not at 24 h post-dosing. The control animals (14 males) were administered 10 mL corn oil (Ashby et al. 1989). F344 rats, five males per group, were administered a single dose or 28-day repeated dose of quinoline at 25, 50, 100 or 200 mg/kg-bw per day by gavage. Hepatocytes were isolated 4–48 h after single dosing or 24 h after 28-day dosing. Replicative DNA synthesis was significantly induced in the rats hepatocytes after single dosing or repeated dosing of quinoline at 25 mg/kg-bw and above (Asakura et al. 1997). Ambiguous results: Adult Alpk:Dunkin Hartley guinea pigs, 4–6 males per group, were administered quinoline at 40, 60, 80 or 100 mg/kg-bw via gavage. After 24 h, hepatocytes were isolated. The authors stated that the incidence of S-phase induction was complicated by the wide variation observed within individual corn oil vehicle–dosed animals (Lefevre and Ashby 1992). Clastogenicity, micronucleus test Positive results: Adult Alpk:AP rats, four and two males, were administered 10 mL corn oil or 6-dimethylaminophenylazobenzthiazole (6BT) at 10 mg/kg-bw, respectively, on day 0. The animals were then dosed with quinoline at 400 mg/kg-bw by gavage on day 3, and the hepatocytes were isolated on day 5. The incidences
47

Screening Assessment CAS RN 91-22-5
Endpoint Lowest effect levels1/Results of micronucleated hepatocytes and the mitotic figures were increased in corn oil– and 6BT-treated rats subsequently dosed with quinoline at 400 mg/kg-bw. In addition, the mitotic index was increased in the hepatocytes isolated from six rats exposed to quinoline at 400 mg/kg-bw alone by gavage. The results were compared with the historical controls. No further statistical analyses were provided (Ashby et al. 1989). CD male mice, 15 per test group and 5 per control group, were administered quinoline at 25, 50 or 100 mg/kg-bw by single intraperitoneal injection. Bone marrow cells were sampled at 24, 48 and 72 h post-injection. A significant dose-related increase in the number of micronucleated polychromatic erythrocytes (MPCE) was observed at the 24 h sampling time for all doses tested. A significant increase of MPCE was also observed at the 48 h sampling time in the two highest dose groups. The ratios of polychromatic to normochromatic erythrocytes (PCE/NCE) from the exposed animals at the 24 h sampling time were lower than that from the controls, indicating a cytotoxicity of this compound. However, the PCE/NCE ratio changes were not dose related, as the PCE/NCE ratios from the exposed animals were higher than that from the controls at 48 and 72 h (Hamoud et al. 1989). Fischer F344 or Sprague-Dawley rats, 4–5 males per group, were administered quinoline at 75 or 150 mg/kg-bw in corn oil once intraperitoneally or orally. The experiments were conducted in two laboratories. Rats were anesthetized 3, 4 or 5 days following treatment, and hepatocytes were isolated. Significantly increased micronuclei in the hepatocytes were observed at both dose levels and in both laboratories (Suzuki et al. 2005). Fischer F344 and Crl:CD(SD) rats, 4–5 males per group, were orally exposed to two doses of quinoline at 0, 30, 60 or 90 mg/kg-bw or to a single dose of quinoline at 150 mg/kg-bw. Liver specimens were prepared 3–5 days following treatment, and hepatocytes were isolated. Significantly increased micronuclei in the hepatocytes were observed at dose levels of 60 mg/kg-bw and above (Suzuki et al. 2009). Equivocal results: In the aforementioned studies in F344 or SD rats, blood samples were collected from a tail vessel on day 2 following single dosing of quinoline at 75 or 150 mg/kg-bw intraperitoneally or orally. Significantly increased micronuclei in the peripheral blood reticulocytes were observed at 150 mg/kg-bw in one laboratory, but not in the other laboratory (Suzuki et al. 2005). Negative results: In the aforementioned study in F344 rats, micronuclei were not significantly induced in the rat hepatocytes after single dosing or repeated dosing of quinoline (Asakura et al. 1997). In the aforementioned study in the Muta™Mouse, the frequency of micronucleated reticulocytes in the peripheral blood cells did not increase
48

Screening Assessment CAS RN 91-22-5
49
Endpoint Lowest effect levels1/Results with exposure to quinoline, compared with the positive controls exposed to 4-nitroquinoline 1-oxide (Suzuki et al. 1998). Chromosomal aberrations Positive results: In the aforementioned study in F344 rats, significantly increased, dose-dependent chromosomal aberrations were observed in the rat hepatocytes after single dosing of quinoline at 100 mg/kg-bw and above or after repeated dosing of quinoline at 25 mg/kg-bw per day and above (Asakura et al. 1997). Sister chromatid exchange (SCE) Positive result: In the aforementioned study in male F344 rats, significantly increased SCE was observed in the rat hepatocytes after single dosing or repeated dosing of quinoline (Asakura et al. 1997). Unscheduled DNA synthesis (UDS) Equivocal results: Adult Alpk:AP rats, 2–9 males per group, were administered quinoline at 100, 175, 225, 250, 350 or 500 mg/kg-bw by gavage. The hepatocytes were isolated 4–16 h post-dosing. The majority of UDS response was negative, with a few individual positive results. The authors stated that quinoline can not be classed as active in this assay. No further statistical analyses were provided (Ashby et al. 1989).
Genotoxicity and related endpoints: in vitro
Mutagenicity Positive results: Ames assay in Salmonella typhimurium TA98, TA100 and TA1535, with metabolic activation (Nagao et al. 1977; Sideropoulos and Specht 1984; US EPA 1985; LaVoie et al. 1991; Debnath et al. 1992; Willems et al. 1992; Takahashi and Ono 1993; JETOC 1996; Hakura et al. 2005). Mutation assay in Escherichia coli wp2uvra, with metabolic activation (JETOC 1996). Negative results: Ames assay in S. typhimurium TA98, TA1535 and TA1537, with activation (Epler et al. 1977; US EPA 1985; Debnath et al. 1992); S. typhimurium TA98, TA100, TA1535 and TA1537, without activation (Epler et al. 1977; Nagao et al. 1977; Sideropoulos and Specht 1984; Willems et al. 1992; Takahashi and Ono 1993; JETOC 1996; Hakura et al. 2005). Mutation assay in E. coli wp2uvra, without metabolic activation (JETOC 1996). Chromosomal aberration Positive results: Chinese hamster lung fibroblast cells, in the presence of metabolic activation (Suzuki et al. 2007). Micronucleus induction
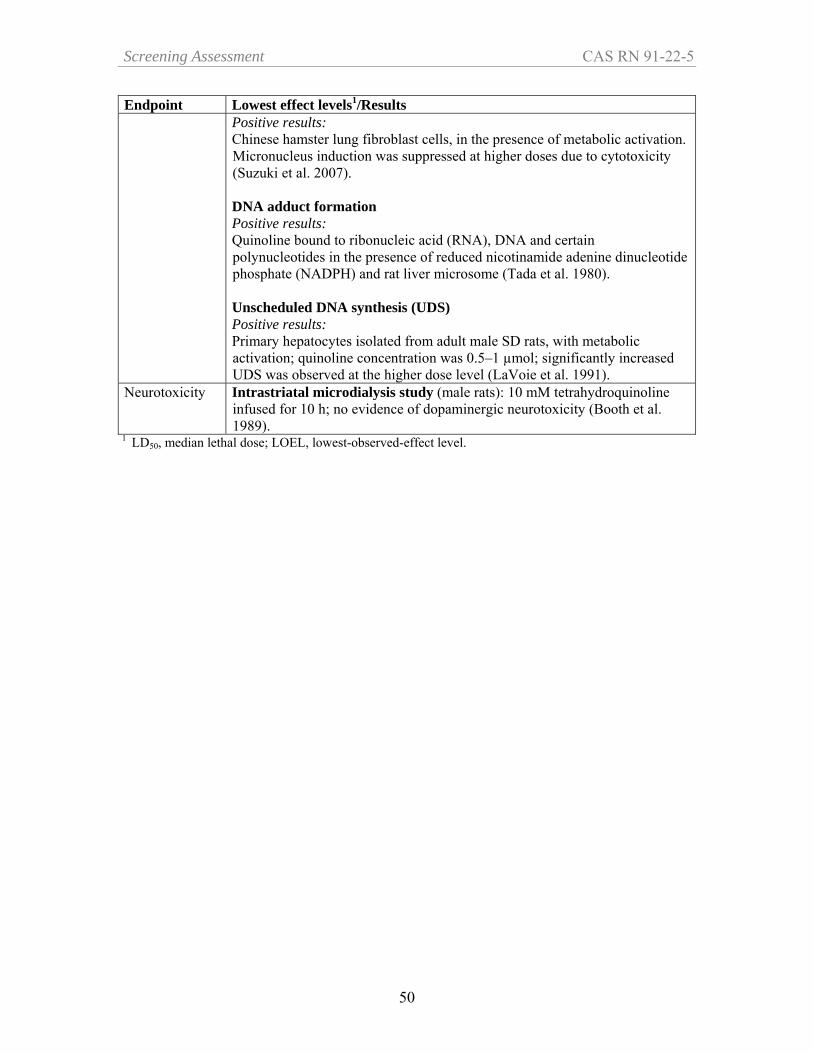
Screening Assessment CAS RN 91-22-5
50
Endpoint Lowest effect levels1/Results Positive results: Chinese hamster lung fibroblast cells, in the presence of metabolic activation. Micronucleus induction was suppressed at higher doses due to cytotoxicity (Suzuki et al. 2007). DNA adduct formation Positive results: Quinoline bound to ribonucleic acid (RNA), DNA and certain polynucleotides in the presence of reduced nicotinamide adenine dinucleotide phosphate (NADPH) and rat liver microsome (Tada et al. 1980). Unscheduled DNA synthesis (UDS) Positive results: Primary hepatocytes isolated from adult male SD rats, with metabolic activation; quinoline concentration was 0.5–1 µmol; significantly increased UDS was observed at the higher dose level (LaVoie et al. 1991).
Neurotoxicity Intrastriatal microdialysis study (male rats): 10 mM tetrahydroquinoline infused for 10 h; no evidence of dopaminergic neurotoxicity (Booth et al. 1989).
1 LD50, median lethal dose; LOEL, lowest-observed-effect level.