scotsem-economic resilience_f.pdf
TRANSCRIPT
Savita Goel, PE, LEED AP, Financial Strategist
Silvana V Croope, PhD, ENV SP,DelDOT
Herby Lissade, PE, CalTrans
October 29, 2014
SCOTSEM 2014
Financial and Economic Resilience for Transportation

Picture this:
• 3 storms, Dec. to Feb. 2009-10, 54.9” snow, Baltimore-Washington area
• 30 hours, twin winter storms, Jan-Feb
2014, Atlanta: $13.5 M • Feb. 11-17, 2014, American South and
East Coast U.S., 1.2 M homes and businesses without power
• 15 winter storms (snow event, squalls,
light snow event and Nor'easter), Dec.14, 2013 to Feb. 18, 2014 – NOAA • States over budget with snow
removal and salt shortage

SnowMagedon
Salt supply, finance
Salt supply, traffic
operations
Salt supply, future
planning
Salt supply, plow trucks
& staff
Salt supply, evacuation/
rescue
Salt supply, commercial
and community
impacts
…

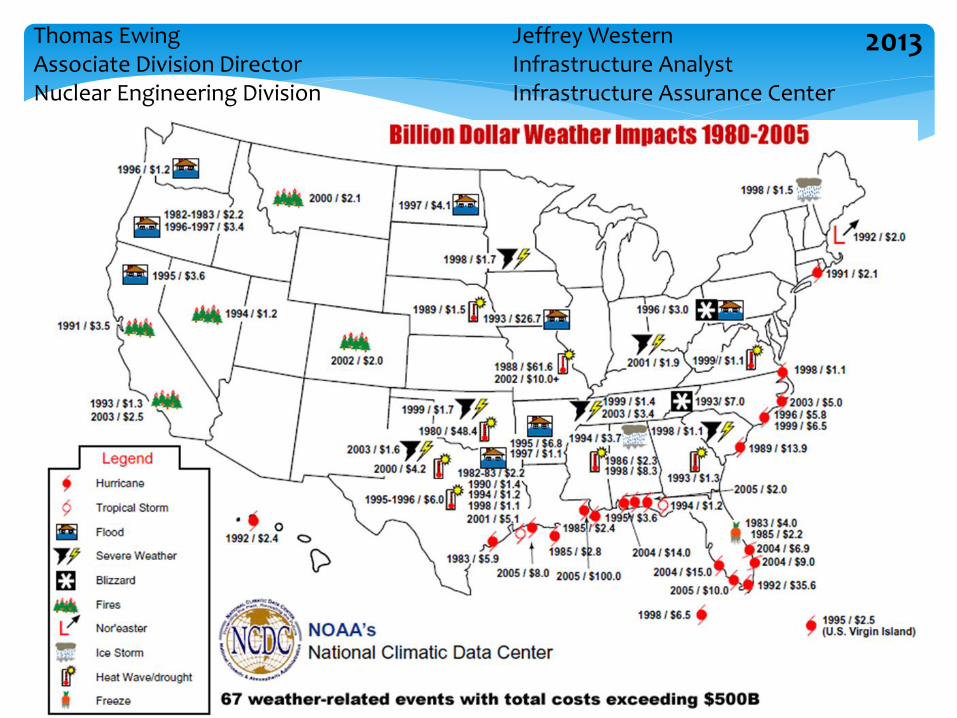
Thomas Ewing Jeffrey Western Associate Division Director Infrastructure Analyst Nuclear Engineering Division Infrastructure Assurance Center
2013
Thomas Ewing Jeffrey Western Associate Division Director Infrastructure Analyst Nuclear Engineering Division Infrastructure Assurance Center
2013

Disaster Cost
National Academies summary on disaster resilience 2009 dollars: 1953 – cost/person: $0.13 for the total of disasters of $20.9 million
2009 – cost/person: $4.75 for total federal disaster of $1.4 billion (excludes “cost of disasters to cities, states, industry, companies, and
individuals, only part” covered by insurance)
Last decade two largest hurricanes - U.S. cost impact: 2012 U.S. GDP of 15,681.5 billion dollars
Dollars withdrawn - possible investment and growth Katrina damage costs US$ 148 billion - Insured losses $48,7 billion Sandy damage costs US$ 71 billion – Insured losses $22 billion
Increasing cost of disasters is a real challenge Including terrorism TRIA and the U.S. Federal Government???
6
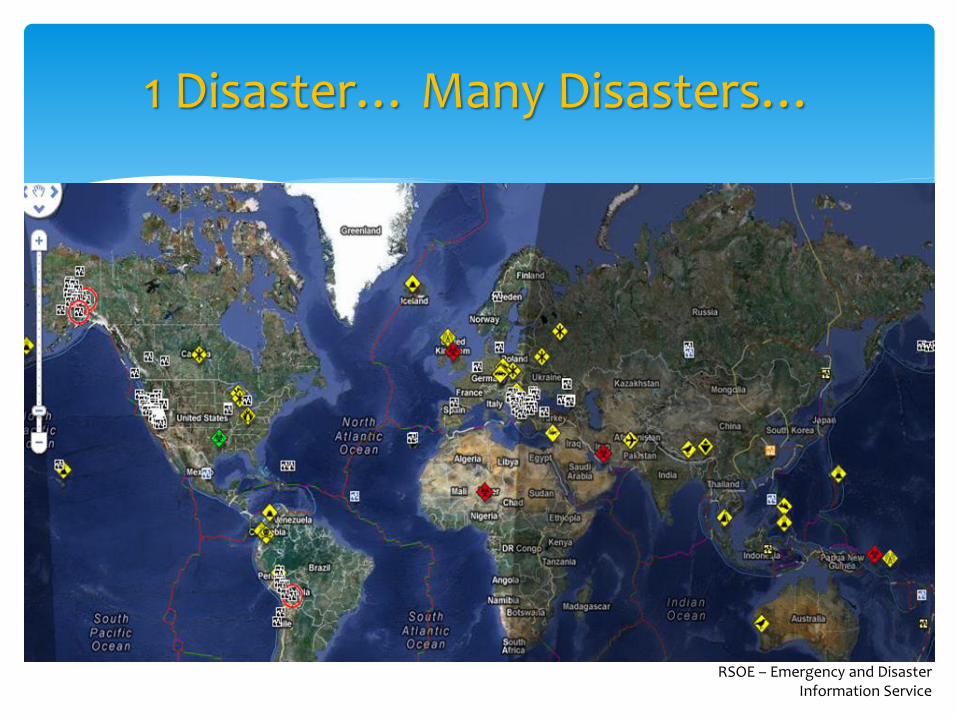
1 Disaster… Many Disasters…
RSOE – Emergency and Disaster Information Service

Insights on interdependencies, vulnerabilities and risk on climate change, critical infrastructure, economy and resilience …
World Economic Forum 2013/2014
COOP ??? COG ???
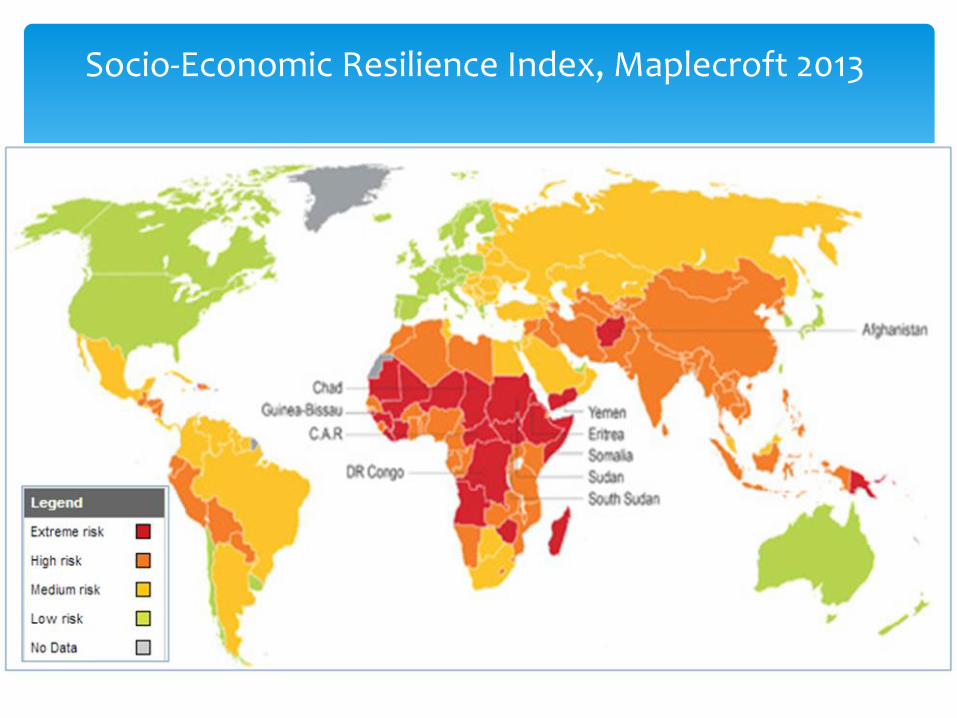
Socio-Economic Resilience Index, Maplecroft 2013
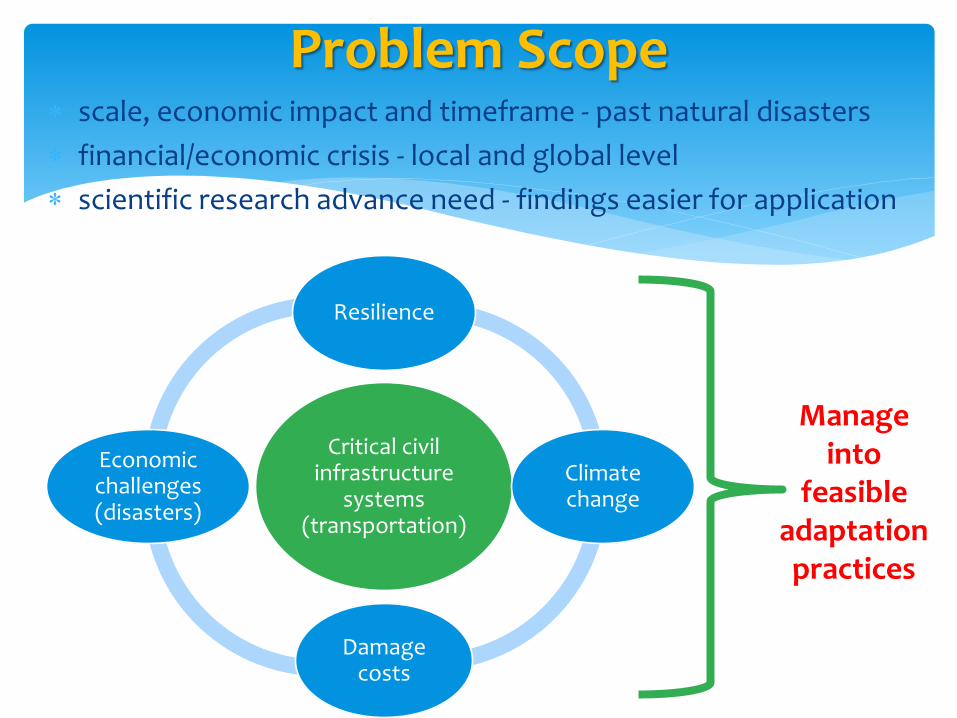
Problem Scope scale, economic impact and timeframe - past natural disasters
financial/economic crisis - local and global level
scientific research advance need - findings easier for application
Critical civil infrastructure
systems (transportation)
Resilience
Climate change
Damage costs
Economic challenges (disasters)
Manage into
feasible adaptation practices

Critical Infrastructure Resilience
“The ability to prepare and plan for, absorb, recover from, and more successfully adapt to adverse events” (summary on Disaster Resilience) – A National Imperative
“The capacity to mitigate against significant all-hazards risks and incidents and to expeditiously recover and reconstitute critical services with minimum damage to public safety and health, the economy, and national security” - ASCE
Resilience
Urban Resilience
Evolutionary Resilience
Sustainability
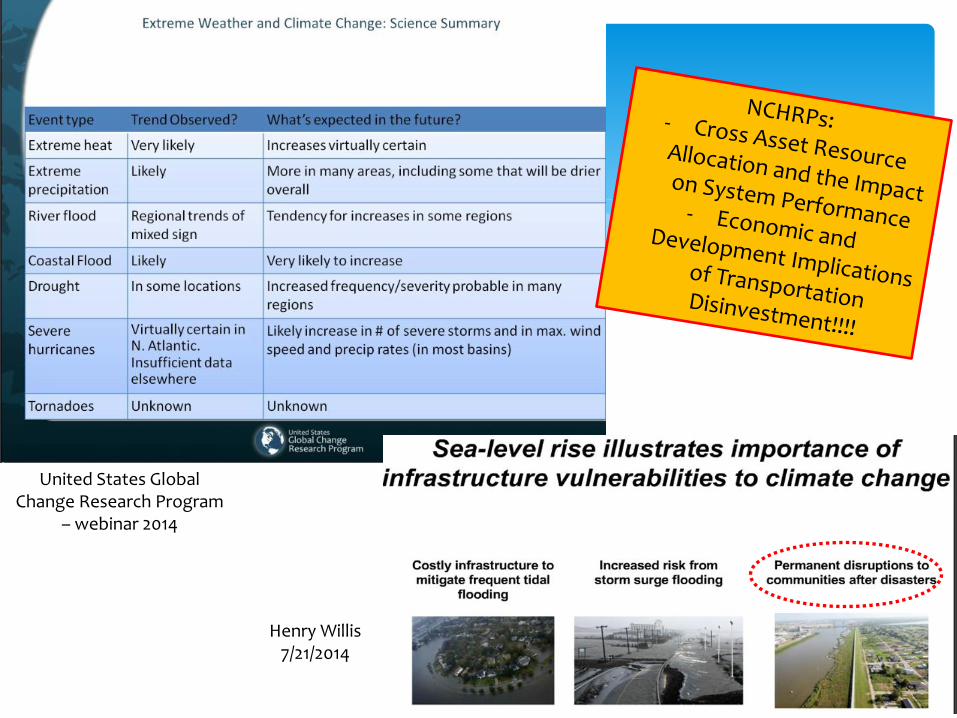
Henry Willis 7/21/2014
United States Global Change Research Program
– webinar 2014
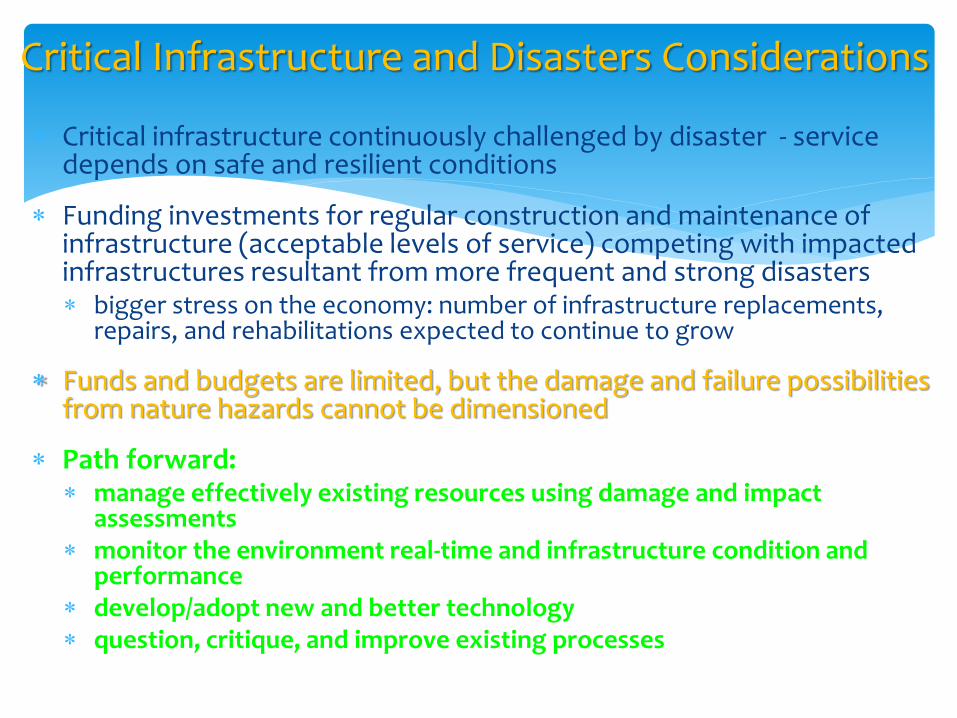
Critical Infrastructure and Disasters Considerations
Critical infrastructure continuously challenged by disaster - service depends on safe and resilient conditions
Funding investments for regular construction and maintenance of infrastructure (acceptable levels of service) competing with impacted infrastructures resultant from more frequent and strong disasters bigger stress on the economy: number of infrastructure replacements,
repairs, and rehabilitations expected to continue to grow
Funds and budgets are limited, but the damage and failure possibilities from nature hazards cannot be dimensioned
Path forward: manage effectively existing resources using damage and impact
assessments monitor the environment real-time and infrastructure condition and
performance develop/adopt new and better technology question, critique, and improve existing processes
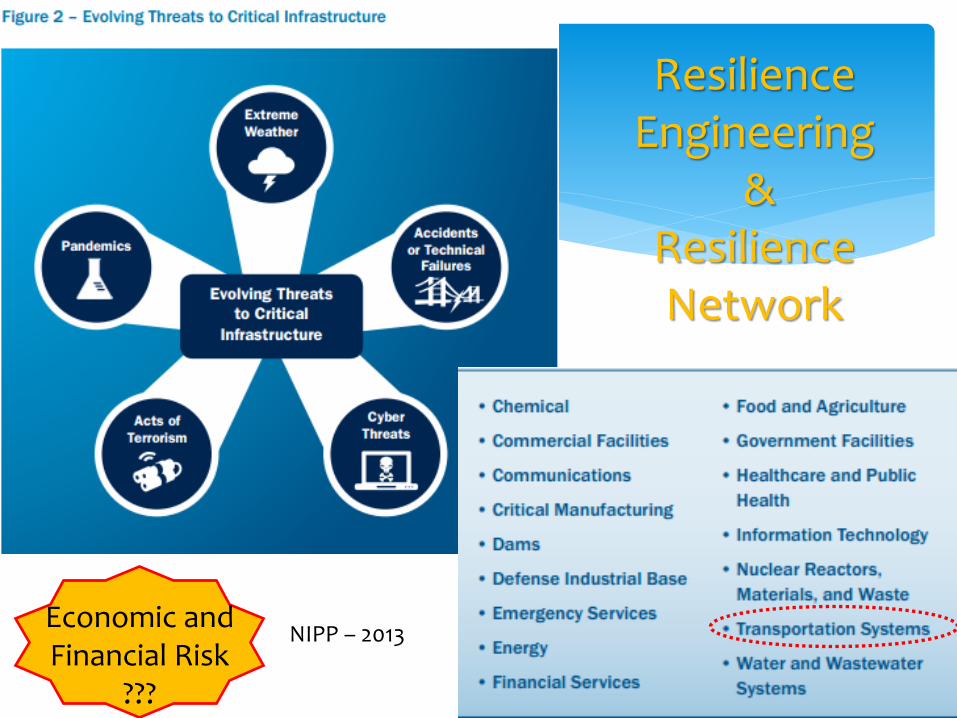
NIPP-2013
Resilience Engineering
& Resilience Network
NIPP – 2013 Economic and Financial Risk
???

Who is looking at Economic and Financial Impacts?
http://riskybusiness.org/
http://nas-sites.org/resilience/resilience-events/
http://www.acclimatise.uk.com/network/transport-and-communications?respage=2&blogpage=7
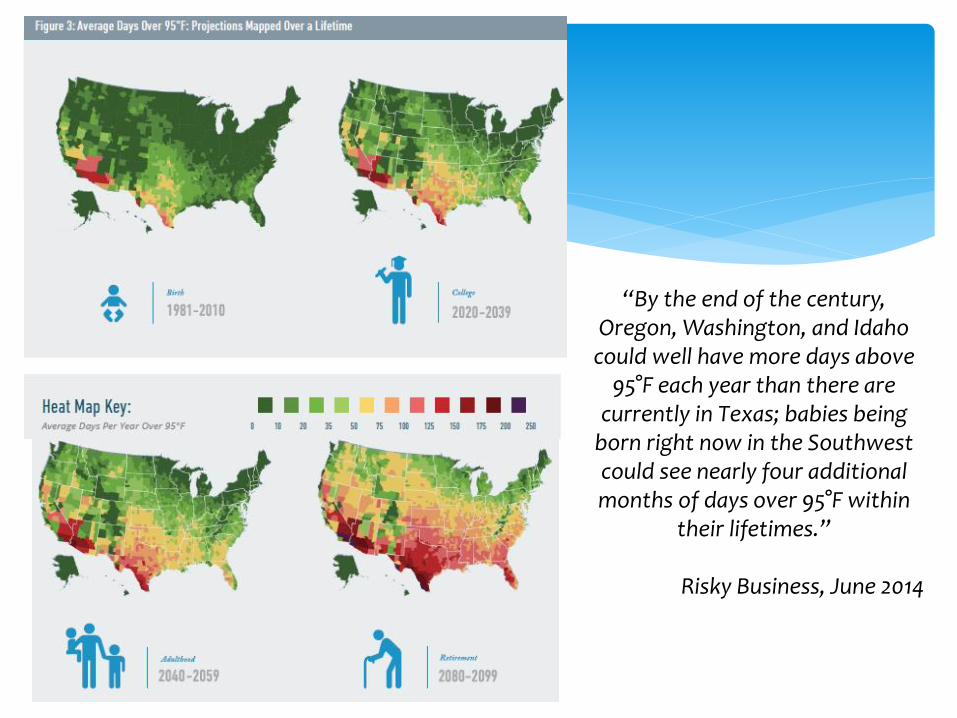
“By the end of the century, Oregon, Washington, and Idaho
could well have more days above 95°F each year than there are
currently in Texas; babies being born right now in the Southwest could see nearly four additional months of days over 95°F within
their lifetimes.”
Risky Business, June 2014

“Back to Normal”
- Taxes - Trust-Fund - Donations
- Productivity/
Gov. Bonds
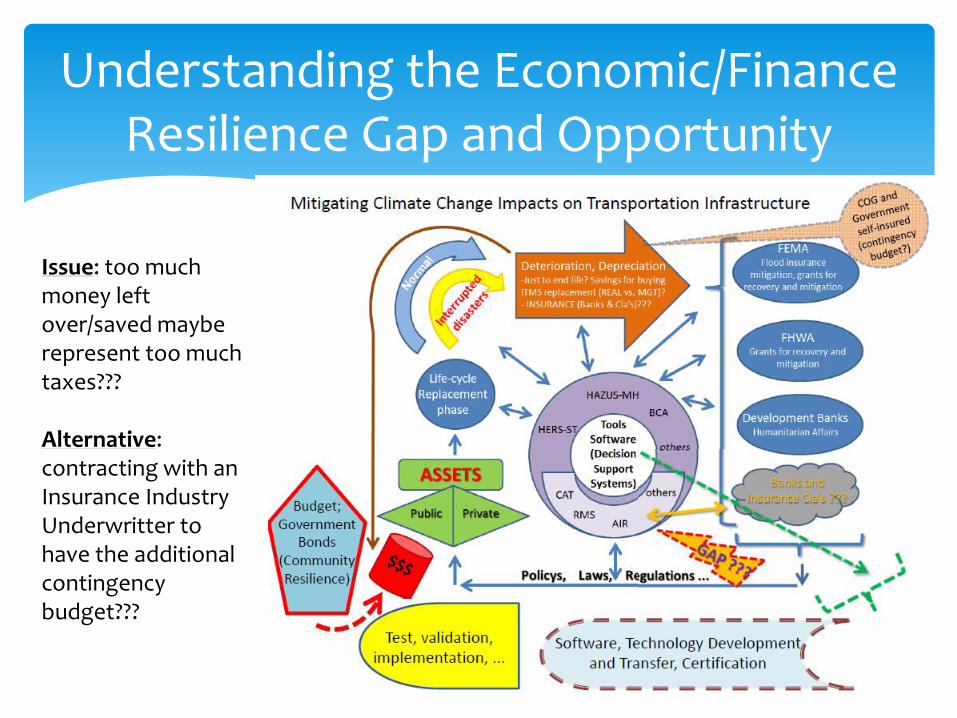
Understanding the Economic/Finance Resilience Gap and Opportunity
Issue: too much money left over/saved maybe represent too much taxes??? Alternative: contracting with an Insurance Industry Underwritter to have the additional contingency budget???
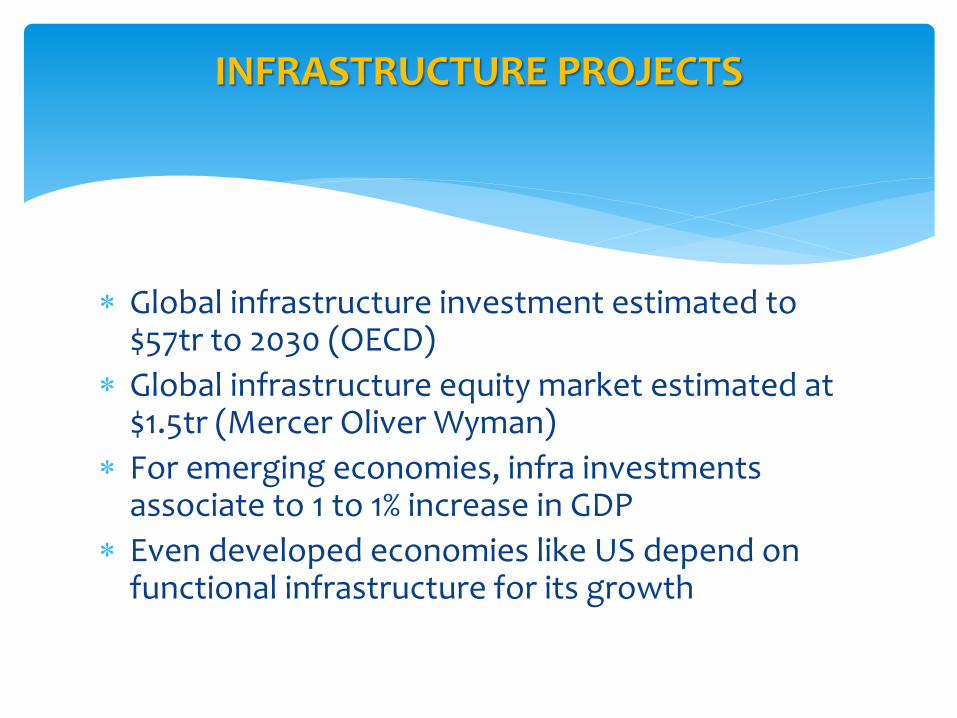
INFRASTRUCTURE PROJECTS
Global infrastructure investment estimated to $57tr to 2030 (OECD)
Global infrastructure equity market estimated at $1.5tr (Mercer Oliver Wyman)
For emerging economies, infra investments associate to 1 to 1% increase in GDP
Even developed economies like US depend on functional infrastructure for its growth
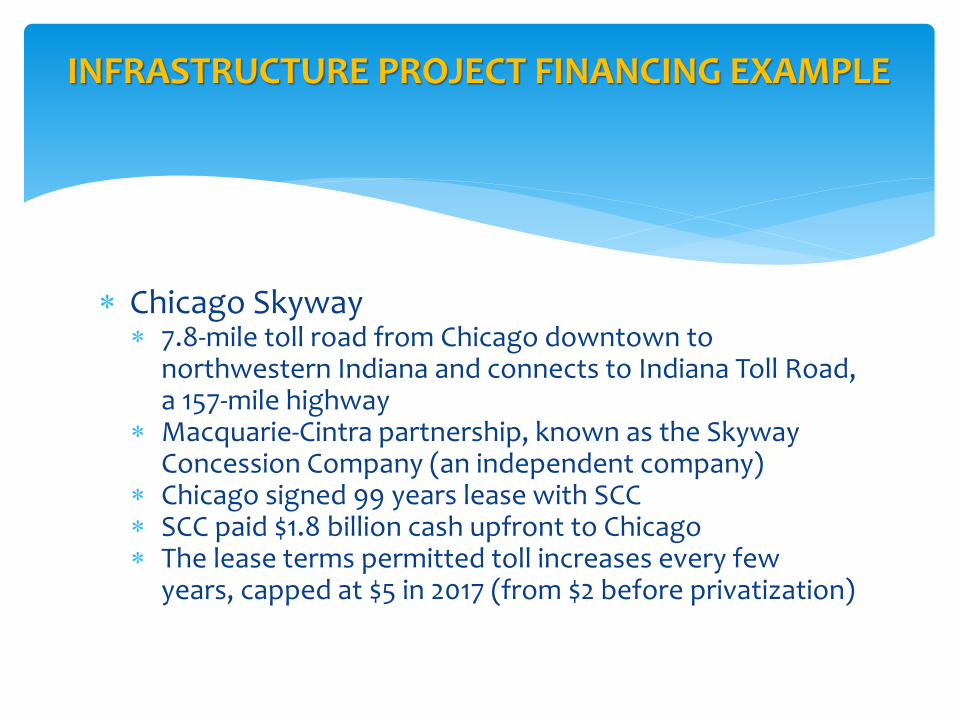
INFRASTRUCTURE PROJECT FINANCING EXAMPLE
Chicago Skyway 7.8-mile toll road from Chicago downtown to
northwestern Indiana and connects to Indiana Toll Road, a 157-mile highway
Macquarie-Cintra partnership, known as the Skyway Concession Company (an independent company)
Chicago signed 99 years lease with SCC SCC paid $1.8 billion cash upfront to Chicago The lease terms permitted toll increases every few
years, capped at $5 in 2017 (from $2 before privatization)

INFRASTRUCTURE PROJECT FINANCING
Characteristics Investment in a single
capital intensive asset
Organization in a legally independent company
Financing on limited or non-recourse basis
Benefits
Risk Spreading / Joint Venture
Borrowing Capacity High leverage Long term financing Tax benefits
Off-balance sheet financing
Overall cost of funds

FINANCIAL RISK MITIGATION AND ECONOMIC RISK MANAGEMENT - GOVERNMENT
Self Insurance No/Minor Loss Event –
Cost Savings
Major Event - Risk is not diversified
Catastrophe Bonds Parametric Insurance Is a risk management
instrument Could be structured for any
variety of risk exposures Requirements: Specific parameter-dependent loss
event Size or expected loss amount Sources to verify trigger event
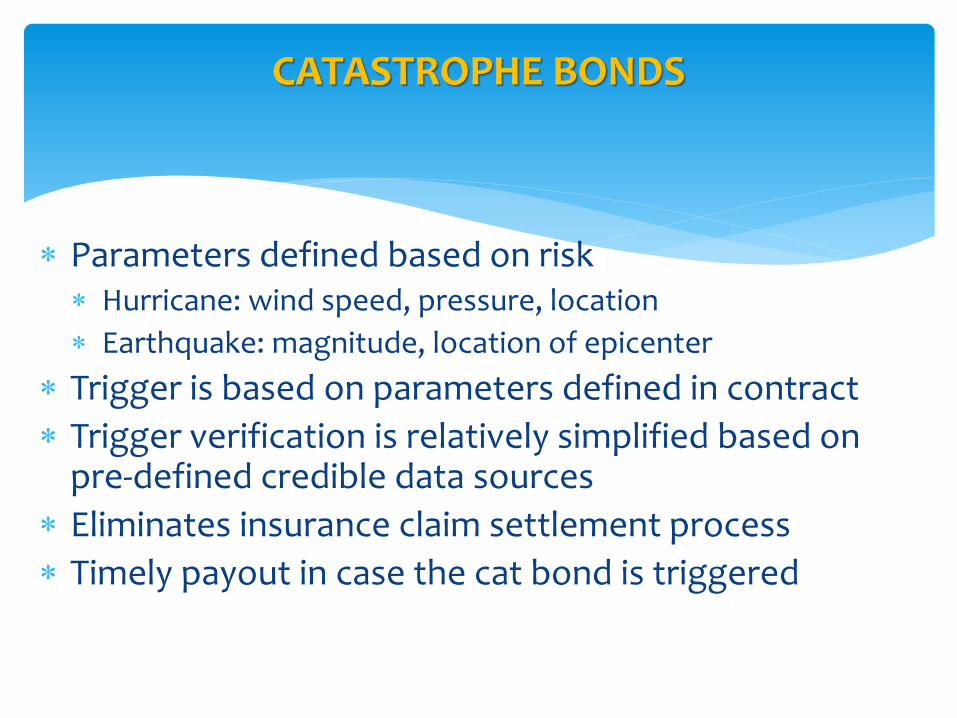
CATASTROPHE BONDS
Parameters defined based on risk Hurricane: wind speed, pressure, location
Earthquake: magnitude, location of epicenter
Trigger is based on parameters defined in contract
Trigger verification is relatively simplified based on pre-defined credible data sources
Eliminates insurance claim settlement process
Timely payout in case the cat bond is triggered

Can your DOT buy Insurance??? How economic/financial resilient is your DOT?
DelDOT RESEARCH “Abandon, Repair or Improve Roads
in the Face of Climate Change”
“DelDOT Summer Interns Estimate Costs for Future Flooding Repairs” - $1.45 billion with NOTE: validation of cost is currently
being assessed
(publication Transearch – Delaware
Center for Transportation – Summer/Fall 2013 Vol.13, No. 2)
STATUS Delaware cannot – depends on
Commission of Insurance approval
CalTrans PUBLICATION Plowing snow is expensive, plowing
a lot of snow is very expensive (www.vortexinsuranceagency.com/Pr
oducts/SnowInsuranceForMunicipalities.aspx ).
2 Towns Say, ‘Let it Snow. We’re Insured’ – Woodbridge and Dunellen /NJ (www.nytimes.com/1996/12/01/nyregi
on/2-towns-say-let-it-snow-we-re-insured.html ).
STATUS Nothing prohibits CalTrans from
buying insurance

Thank You!
John Laws, DHS
Nancy Pomerleau, DHS
Ralph Reeb, DelDOT
Silvana V Croope, DelDOT
Sam Higuchi, NASA
Marie Venner, Yuko Nakanishi, Jeffrey Western, Henry Willis