scor model - gs1 taiwan · 42 best practices scor modebest practices d1.12 ship product metrics...
TRANSCRIPT

40
SCOR Model V. 8.0 SCOR 8.0
SCOR Model
1 .
2 .
3.
1 .
2 .
3. 1
6 1 .
SCOR Model
SCOR 8.0
2
SCOR 8.0
SCOR Model
By David Lin
SCOR Model V. 8.0 SCOR Model
This article is referred to the content of SCOR Model V. 8.0 and provides the thoughts and analyses on how to improve the operating proceduresassociated with customers by using SCOR Model for customers' satisfaction
Improving the Customer-oriented Procedures by UsingSCOR Model
SCOR Model
Improving the Customer-oriented Procedures by UsingSCOR Model
(SCM)

41
(SCM) (SCM)
D1.1 Process Inquiry & QuoteMetrics
6 2.
D1.2 Receive, Enter & Validate OrderMetrics
Best Practices

42
Best Pract ices
SCOR Mode Best Practices
D1.12 Ship ProductMetrics (see Appendix A for metrics attributes):
Best Practices:
SCOR Model
(SCM)

43
(SCM)
e
A
eThe final purpose of operation procedures and e-management is expected to assist industries to engage in better policies andadjustments. The sound projects of sales, development, logistics, service and finance will directly influence the effects of policies andadjustments; this article is to actually realize the construction picture of E-global operation.
/By Shy-Ching Wang
Constructing Industrial Global Operation And E-Reference Mode (3)--The Study of Case ExperienceConstructing Industrial Global Operation And E-Reference Mode (3)--The Study of Case Experience
The Preface
2
1. PDCA(Position Decision
Checks Action-Plan)
- - -
PDCA GLM
2. Top-down Button-up
3. e
The Study of Case Experience
A e
A
A
4~5 (Points)
A
delay
e - m a i l
K e y
ERP
E R P

44
ERP
A
A
1
1 . B I
2 .
3 .
4 .
KPI
A ( 1 )
1 .
2 .
3 .
(1)
(2)
(3 )
(4)
(5)
A e ( 2 )
1 .
5 0 %
Material Suppliers
2 .
3 .
4 .
A One Voice
1 .
2 .
3. ERP
4.
5 .
6.
BI ( )
6 1 .
- 2 0 0 6
(SCM)

45
(SCM)
6 1.
- 2 0 0 6
6 2.
- 2 0 0 6
46
BIKP I (
. . . 3 )
E R P
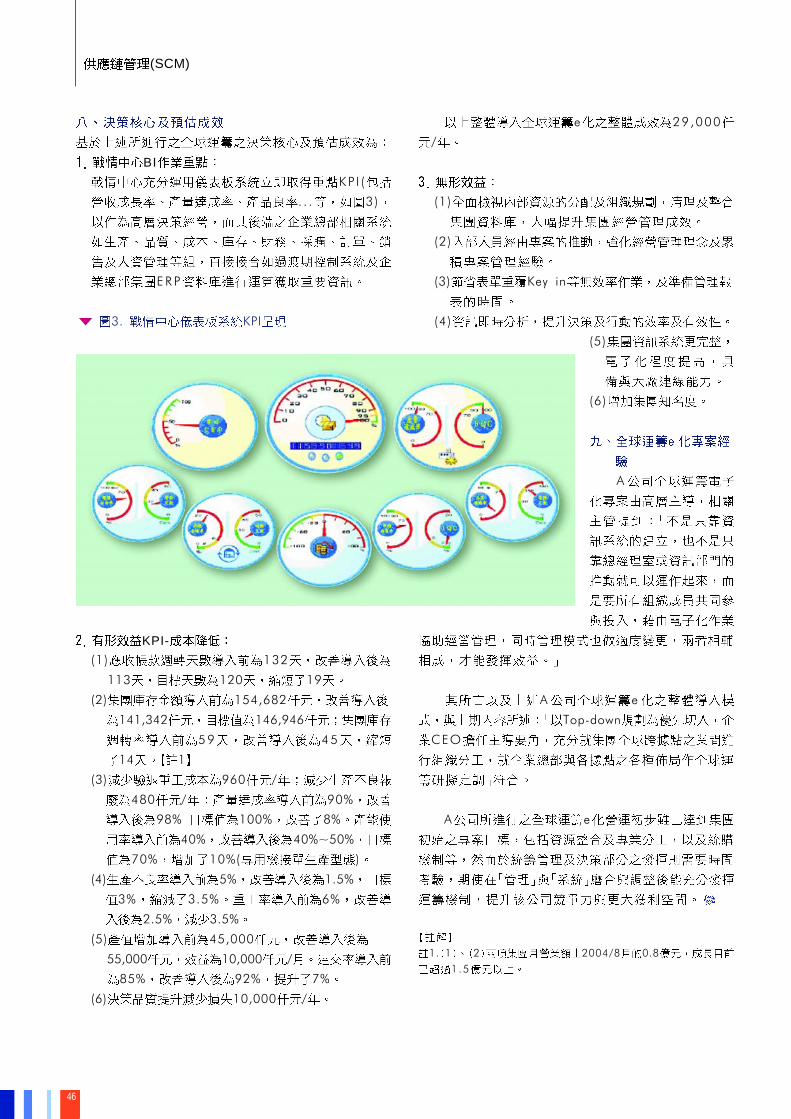
6 3. KPI
KPI-(1) 132
113 120 19
(2) 154,682
141,342 146,946
59 45
14 1
(3) 960 /
480 / 90%
98% 100% 8%
40% 40%~50%
70% 10%( )
(4) 5% 1.5%
3% 3.5% 6%
2.5% 3.5%
(5) 45,000
55,000 10,000 /
85% 92% 7%
(6) 10,000 /
e 29,000
/
(1)
(2)
(3) Key in
(4)
(5)
(6)
A
A e
Top-down
CEO
A e
1. 1 2 2004/8 0.8
1 .5
(SCM)